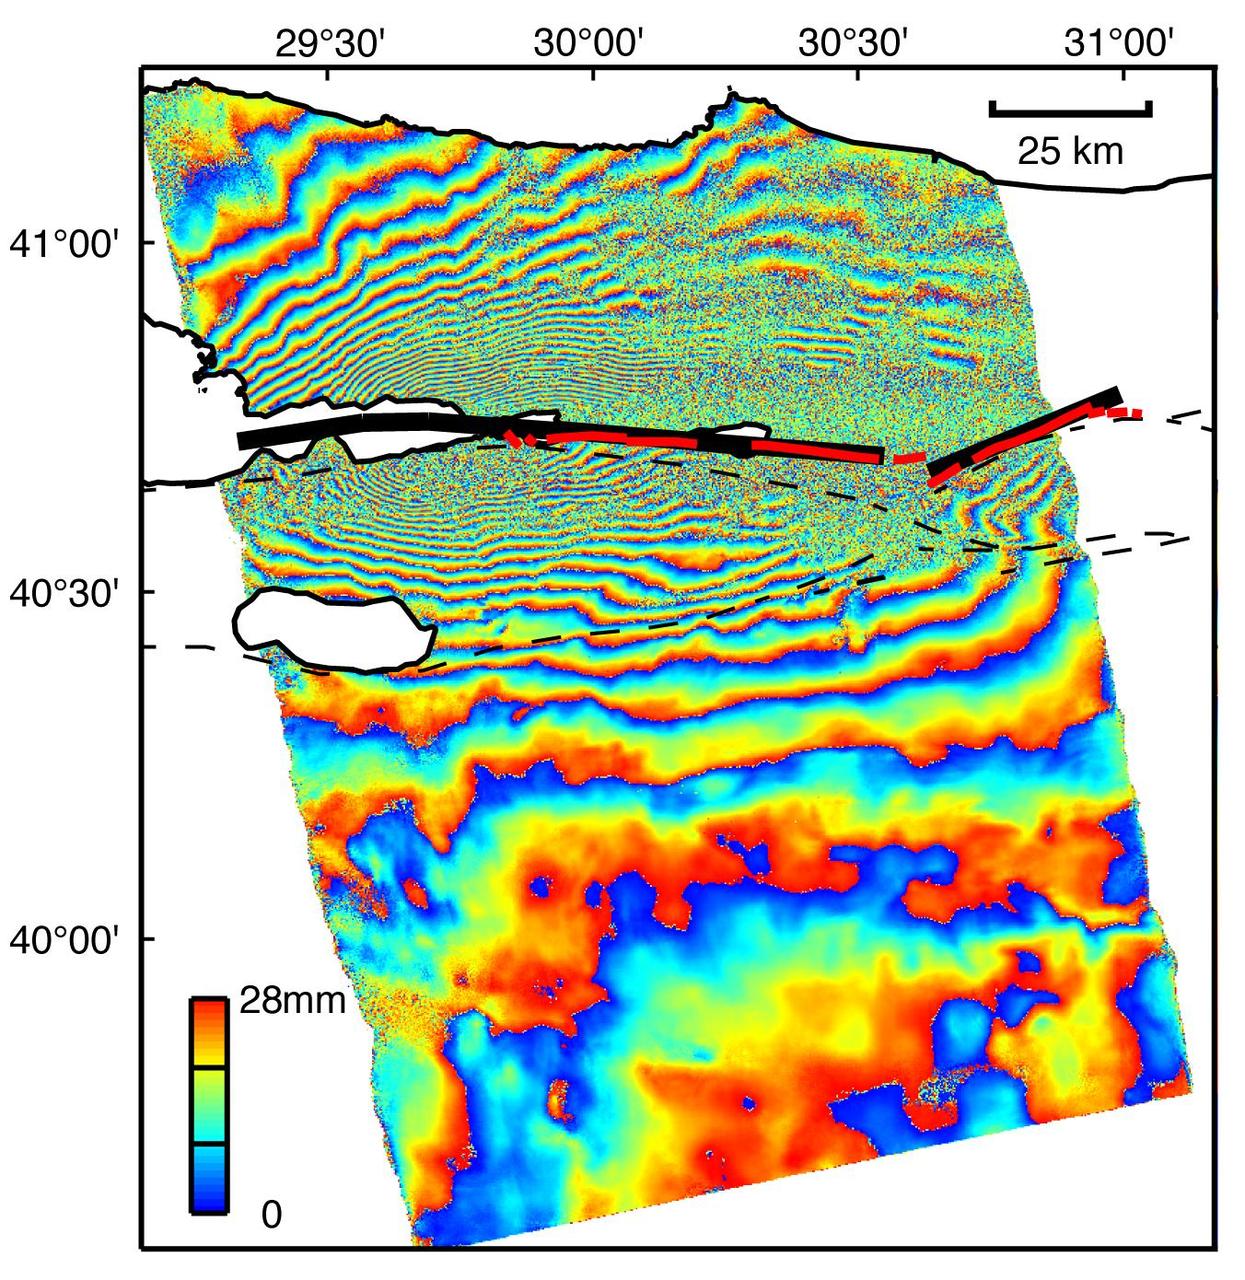
This image is an interferogram that was created using pairs of images taken by Synthetic Aperture Radar (SAR). The images, acquired at two different times, have been combined to measure surface deformation or changes that may have occurred during the time between data acquisition. The images were collected by the European Space Agency's Remote Sensing satellite (ERS-2) on 13 August 1999 and 17 September 1999 and were combined to produce these image maps of the apparent surface deformation, or changes, during and after the 17 August 1999 Izmit, Turkey earthquake. This magnitude 7.6 earthquake was the largest in 60 years in Turkey and caused extensive damage and loss of life. Each of the color contours of the interferogram represents 28 mm (1.1 inches) of motion towards the satellite, or about 70 mm (2.8 inches) of horizontal motion. White areas are outside the SAR image or water of seas and lakes. The North Anatolian Fault that broke during the Izmit earthquake moved more than 2.5 meters (8.1 feet) to produce the pattern measured by the interferogram. Thin red lines show the locations of fault breaks mapped on the surface. The SAR interferogram shows that the deformation and fault slip extended west of the surface faults, underneath the Gulf of Izmit. Thick black lines mark the fault rupture inferred from the SAR data. Scientists are using the SAR interferometry along with other data collected on the ground to estimate the pattern of slip that occurred during the Izmit earthquake. This then used to improve computer models that predict how this deformation transferred stress to other faults and to the continuation of the North Anatolian Fault, which extends to the west past the large city of Istanbul. These models show that the Izmit earthquake further increased the already high probability of a major earthquake near Istanbul. http://photojournal.jpl.nasa.gov/catalog/PIA00557
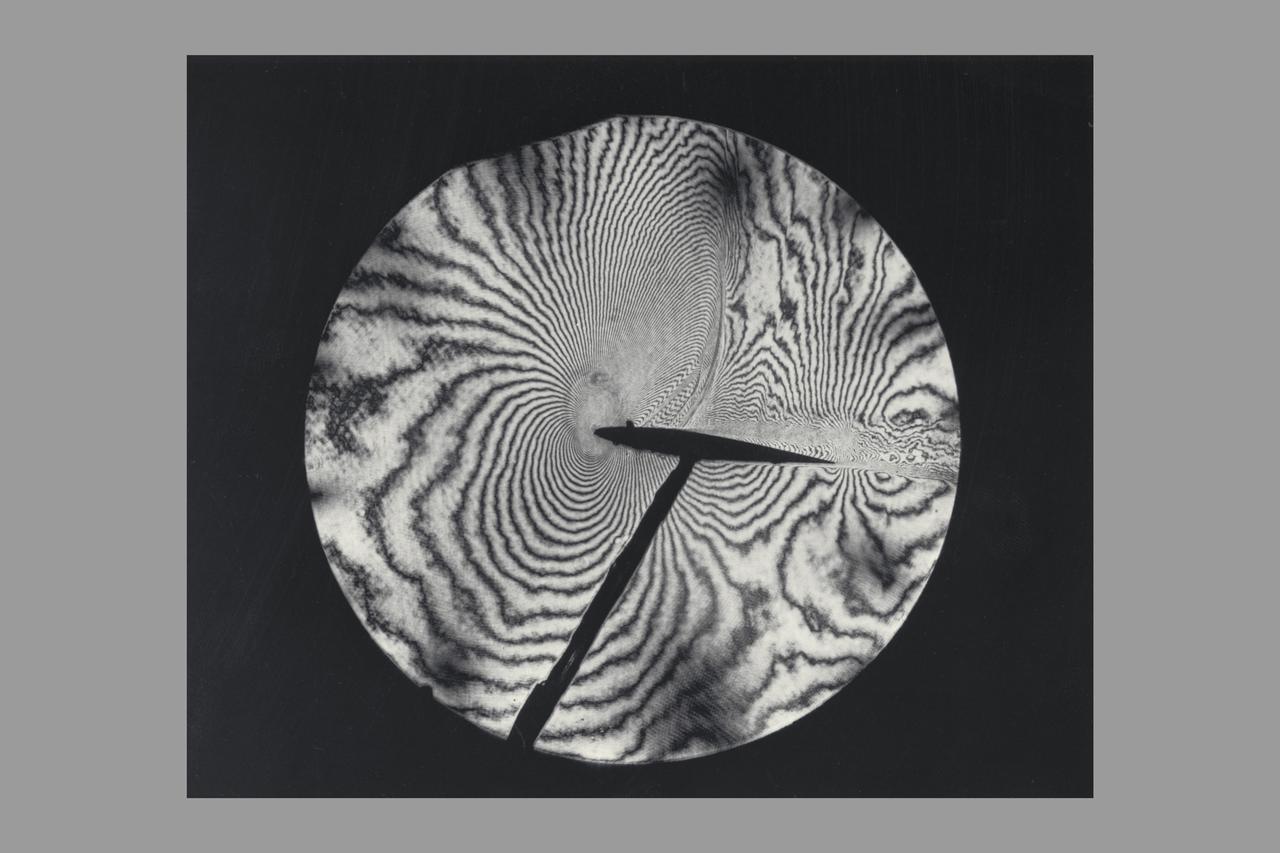
Interferogram of Transonic flow field - reconstructed laser hologram as an infinite-fringe interferogram shows shock-wave shape, location and separaton of the airfoil boundry layer
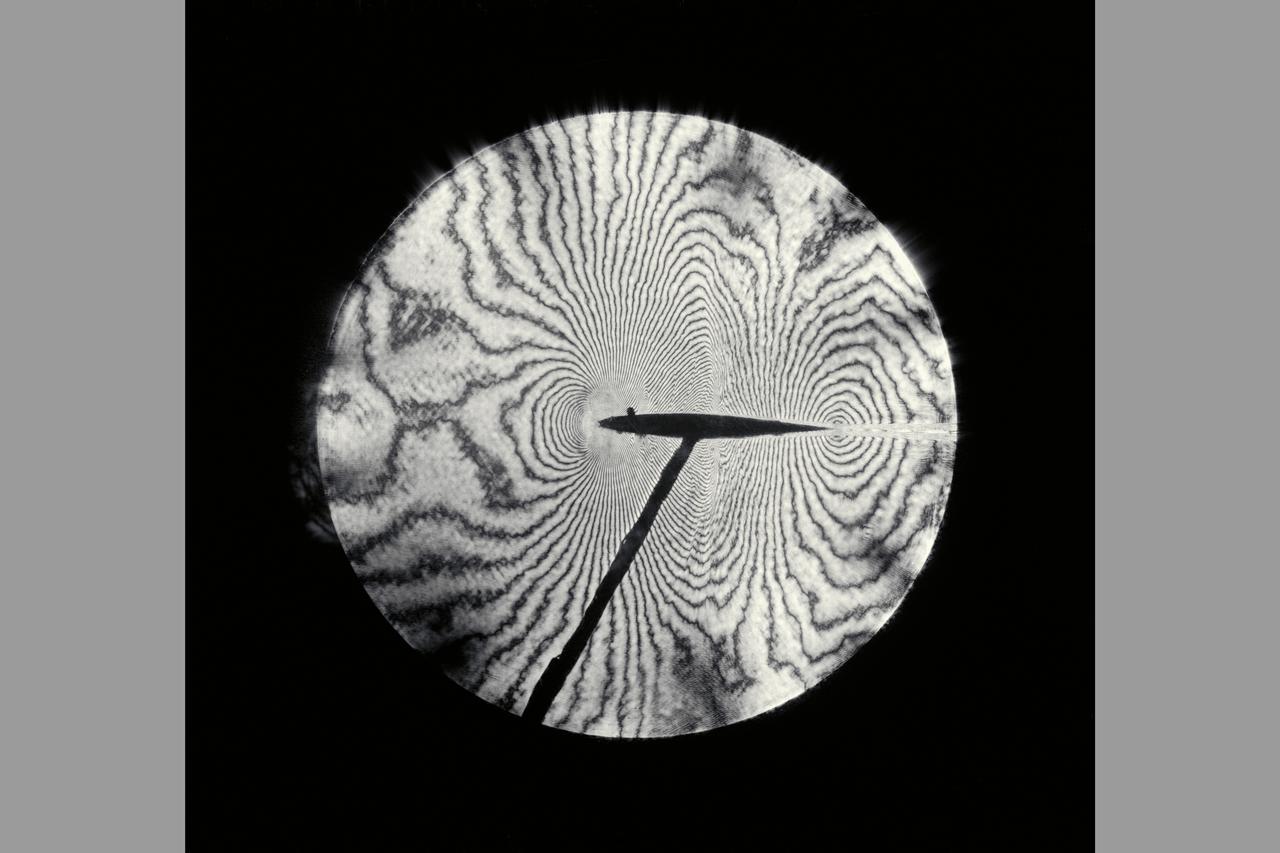
Interferogram of Transonic flow field - reconstructed laser hologram as an infinite-fringe interferogram shows shock-wave shape, location and separaton of the airfoil boundry layer
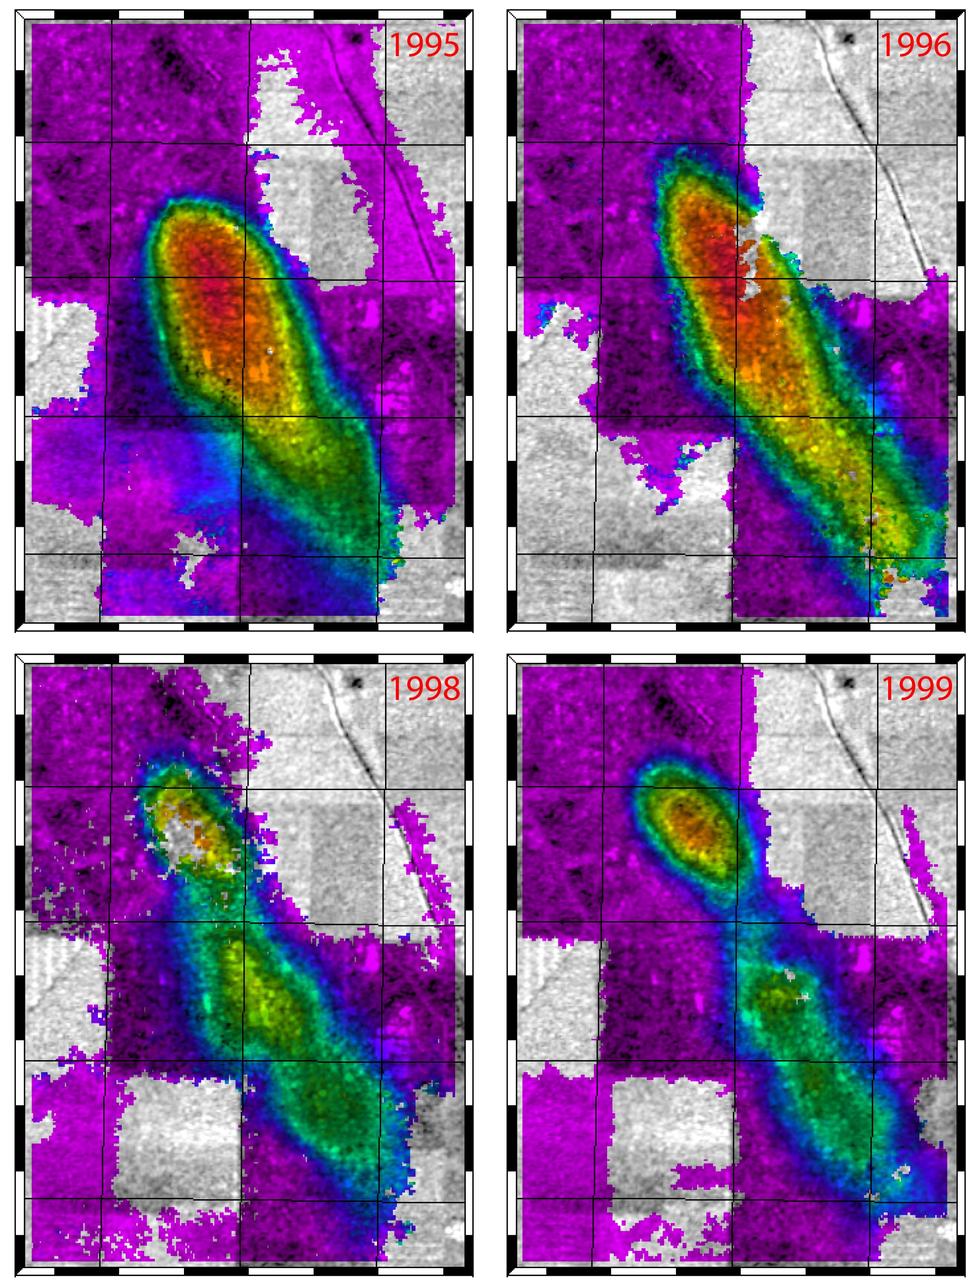
This figure shows a comparison of interferograms from four different years mapping the rapid ground subsidence over the Lost Hills oil field in California.
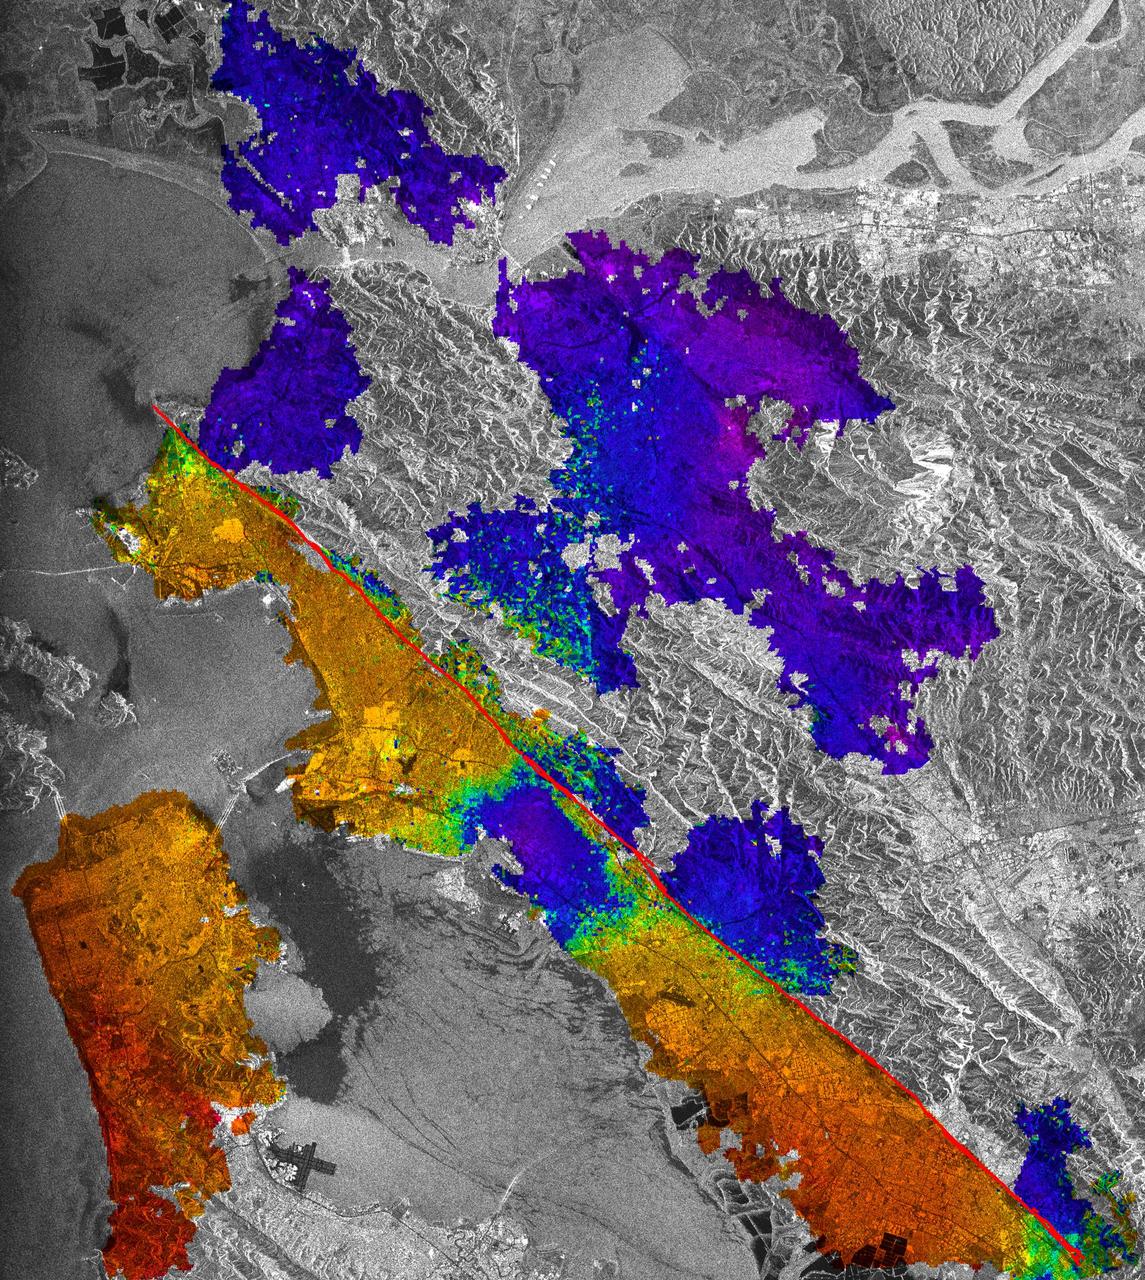
This image of California Hayward fault is an interferogram created using a pair of images taken by ESA ERS-1 and ERS-2 in June 1992 and September 1997 over the central San Francisco Bay in California.

This radar image, called a coseismic interferogram, using satellite data from the European Space Agency Envisat depicts ground displacements resulting from the March 11, 2011, magnitude 9.0 Tohoku earthquake in Japan.
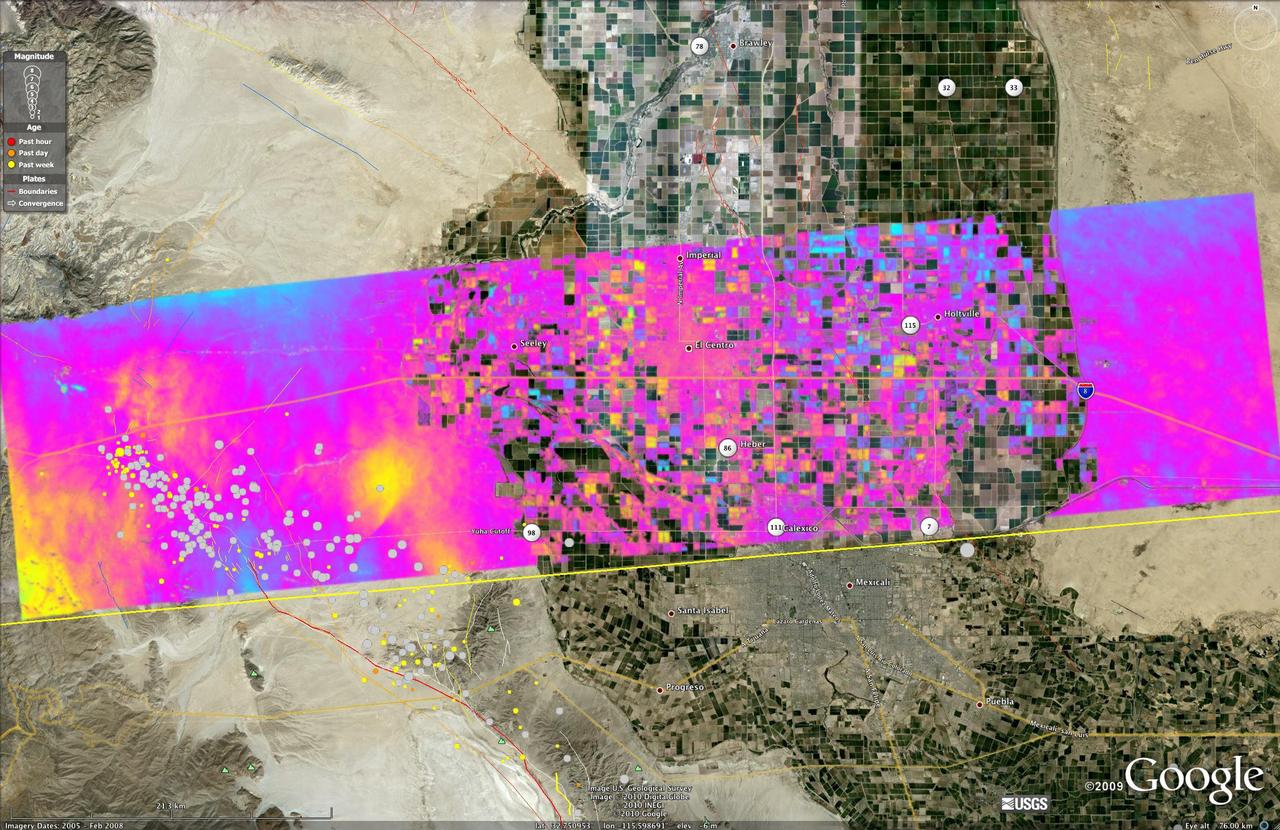
This image shows a UAVSAR interferogram swath overlaid atop a Google Earth image. New NASA airborne radar images show the continuing deformation in Earth surface resulting from the magnitude 7.2 temblor in Baja California on April 4, 2010.
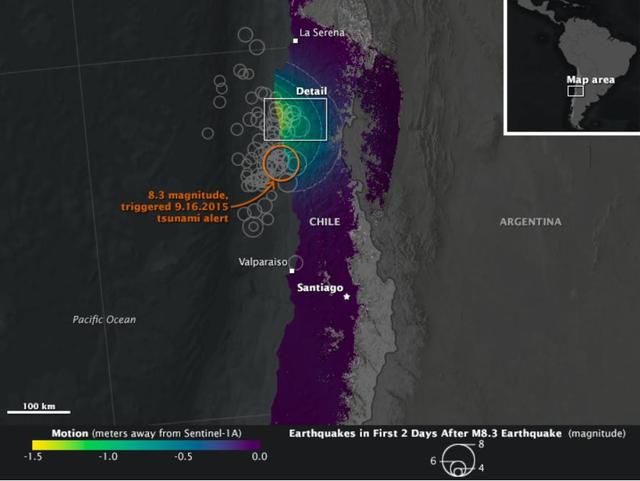
On Sept. 16, 2015, a magnitude 8.3 earthquake struck near the coast of central Chile along the boundary of the Nazca and South American tectonic plates. Dubbed the Illapel earthquake, the shaking lasted at least three minutes and propelled a 15-foot (4.5-meter) tsunami that washed into Coquimbo and other coastal areas. Smaller tsunami waves raced across the Pacific and showed up on the shores of Hawaii and other islands. The earthquake and tsunami caused substantial damage in several Chilean coastal towns, and at least 13 deaths have been reported. Demanding building codes and extensive disaster preparedness helped to limit the loss of life and property. The maps above, known as interferograms, show how the quake moved the ground, as observed by the Copernicus Sentinel-1A satellite (operated by the European Space Agency) and reported by ground stations to the U.S. Geological Survey. Sentinel-1A carries a synthetic aperture radar (SAR) instrument, which beams radio signals toward the ground and measures the reflections to determine the distance between the ground and the satellite. By comparing measurements made on Aug. 24 and Sept. 17, Cunren Liang, Eric Fielding, and other researchers from NASA's Jet Propulsion Laboratory were able to determine how the land surface shifted during and after the earthquake. Interferograms can be used to estimate where the fault moved deep in Earth and which areas have increased stress and higher likelihood of future earthquakes. The details can also provide important information to better understand the earthquake process. On both the close-up and the broad-view maps, the amount of land motion is represented in shades from yellow to purple. Areas where the ground shifted the most (vertically, horizontally, or both) are represented in yellow, while areas with little change are represented in purple. Circles show the location of earthquakes and aftershocks in the two days after the initial 8.3 earthquake, as reported by the USGS National Earthquake Information Center. Larger quakes are represented by larger circles. The base map layer uses a digital elevation model and a bathymetry map to show the contours of the land surface and seafloor. The interferograms above show that land moved as much as 1.4 meters toward to satellite (generally in the vertical direction) near the coast, and early estimates of the horizontal motion suggest it was as much as 2 meters. While SAR can see through clouds and the dark of night, it cannot see much through water. It is likely that much of the ground deformation from the earthquake occurred underwater, which explains the formation of the tsunami and the location of many aftershocks. http://photojournal.jpl.nasa.gov/catalog/PIA20002
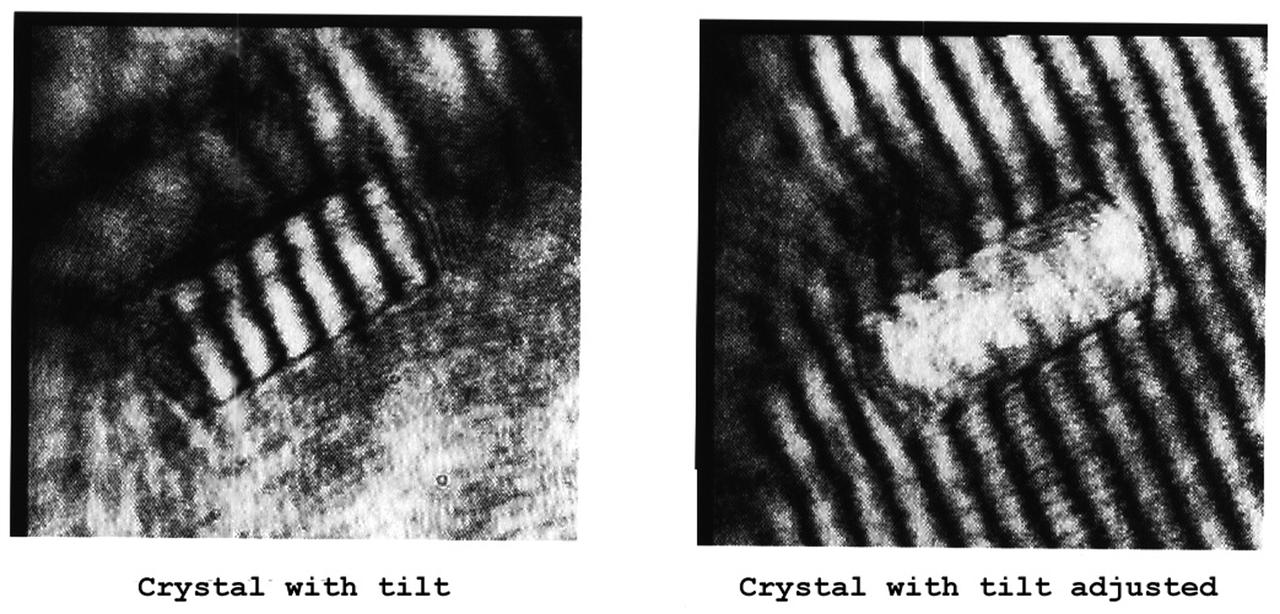
The Interferometer Protein Crystal Growth (IPCG) experiment was designed to measure details of how protein molecules move through a fluid. It was flown on the STS-86 mission for use aboard Russian Space Station Mir in 1998. It studied aspects of how crystals grow - and what conditions lead to the best crystals, details that remain a mystery. IPCG produces interference patterns by spilitting then recombining laser light. This let scientists see how fluid densities - and molecular diffusion - change around a crystal as it grows in microgravity. The heart of the IPCG apparatus is the interferometer cell comprising the optical bench, microscope, other optics, and video camera. IPCG experiment cells are made of optical glass and silvered on one side to serve as a mirror in the interferometer system that visuzlizes crystals and conditions around them as they grow inside the cell. This view shows interferograms produced in ground tests. The principal investigator was Dr. Alexander McPherson of University of California, Irvine. Co-investigators are William Witherow and Dr. Marc Pusey of NASA's Marshall Space Flight Center (MSFC).
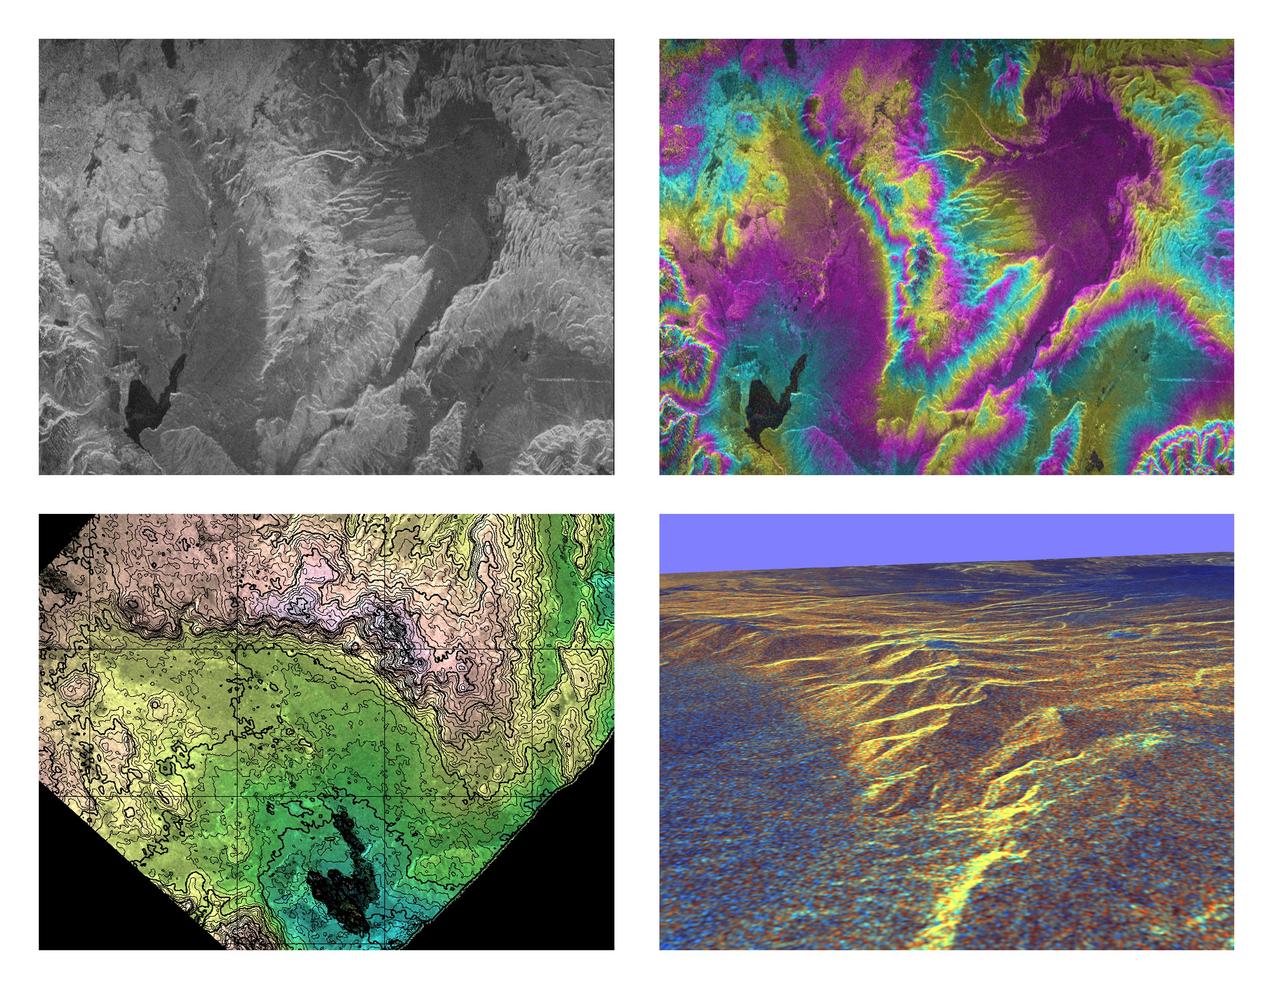
These four images of the Long Valley region of east-central California illustrate the steps required to produced three dimensional data and topographics maps from radar interferometry. All data displayed in these images were acquired by the Spaceborne Imaging Radar-C/X-band Synthetic Aperture Radar (SIR-C/X-SAR) aboard the space shuttle Endeavour during its two flights in April and October, 1994. The image in the upper left shows L-band (horizontally transmitted and received) SIR-C radar image data for an area 34 by 59 kilometers (21 by 37 miles). North is toward the upper right; the radar illumination is from the top of the image. The bright areas are hilly regions that contain exposed bedrock and pine forest. The darker gray areas are the relatively smooth, sparsely vegetated valley floors. The dark irregular patch near the lower left is Lake Crowley. The curving ridge that runs across the center of the image from top to bottom is the northeast rim of the Long Valley Caldera, a remnant crater from a massive volcanic eruption that occurred about 750,000 years ago. The image in the upper right is an interferogram of the same area, made by combining SIR-C L-band data from the April and October flights. The colors in this image represent the difference in the phase of the radar echoes obtained on the two flights. Variations in the phase difference are caused by elevation differences. Formation of continuous bands of phase differences, known as interferometric "fringes," is only possible if the two observations were acquired from nearly the same position in space. For these April and October data takes, the shuttle tracks were less than 100 meters (328 feet) apart. The image in the lower left shows a topographic map derived from the interferometric data. The colors represent increments of elevation, as do the thin black contour lines, which are spaced at 50-meter (164-foot) elevation intervals. Heavy contour lines show 250-meter intervals (820-foot). Total relief in this area is about 1,320 meters (4,330 feet). Brightness variations come from the radar image, which has been geometrically corrected to remove radar distortions and rotated to have north toward the top. The image in the lower right is a three-dimensional perspective view of the northeast rim of the Long Valley caldera, looking toward the northwest. SIR-C C-band radar image data are draped over topographic data derived from the interferometry processing. No vertical exaggeration has been applied. Combining topographic and radar image data allows scientists to examine relationships between geologic structures and landforms, and other properties of the land cover, such as soil type, vegetation distribution and hydrologic characteristics. http://photojournal.jpl.nasa.gov/catalog/PIA01770