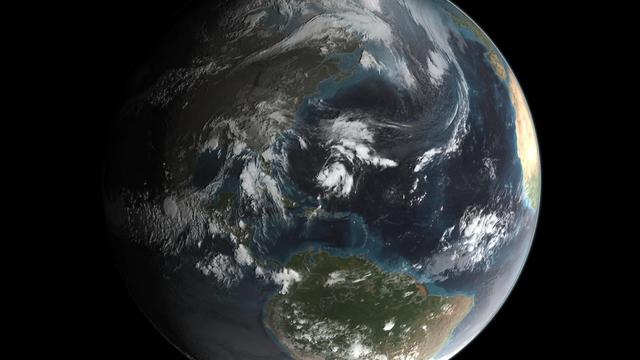
Joaquin became a tropical storm Monday evening (EDT) midway between the Bahamas and Bermuda and has now formed into Hurricane Joaquin, the 3rd of the season--the difference is Joaquin could impact the US East Coast. NASA's GPM satellite captured Joaquin Tuesday, September 29th at 21:39 UTC (5:39 pm EDT). Credit: NASA's Scientific Visualization Studio Data provided by the joint NASA/JAXA GPM mission. Download/read more: <a href="http://svs.gsfc.nasa.gov/cgi-bin/details.cgi?aid=4367" rel="nofollow">svs.gsfc.nasa.gov/cgi-bin/details.cgi?aid=4367</a> <b><a href="http://www.nasa.gov/audience/formedia/features/MP_Photo_Guidelines.html" rel="nofollow">NASA image use policy.</a></b> <b><a href="http://www.nasa.gov/centers/goddard/home/index.html" rel="nofollow">NASA Goddard Space Flight Center</a></b> enables NASA’s mission through four scientific endeavors: Earth Science, Heliophysics, Solar System Exploration, and Astrophysics. Goddard plays a leading role in NASA’s accomplishments by contributing compelling scientific knowledge to advance the Agency’s mission. <b>Follow us on <a href="http://twitter.com/NASAGoddardPix" rel="nofollow">Twitter</a></b> <b>Like us on <a href="http://www.facebook.com/pages/Greenbelt-MD/NASA-Goddard/395013845897?ref=tsd" rel="nofollow">Facebook</a></b> <b>Find us on <a href="http://instagrid.me/nasagoddard/?vm=grid" rel="nofollow">Instagram</a></b>
Joaquin became a tropical storm Monday evening (EDT) midway between the Bahamas and Bermuda and has now formed into Hurricane Joaquin, the 3rd of the season--the difference is Joaquin could impact the US East Coast. NASA's GPM satellite captured Joaquin Tuesday, September 29th at 21:39 UTC (5:39 pm EDT). Credit: NASA's Scientific Visualization Studio Data provided by the joint NASA/JAXA GPM mission. Download/read more: <a href="http://svs.gsfc.nasa.gov/cgi-bin/details.cgi?aid=4367" rel="nofollow">svs.gsfc.nasa.gov/cgi-bin/details.cgi?aid=4367</a> <b><a href="http://www.nasa.gov/audience/formedia/features/MP_Photo_Guidelines.html" rel="nofollow">NASA image use policy.</a></b> <b><a href="http://www.nasa.gov/centers/goddard/home/index.html" rel="nofollow">NASA Goddard Space Flight Center</a></b> enables NASA’s mission through four scientific endeavors: Earth Science, Heliophysics, Solar System Exploration, and Astrophysics. Goddard plays a leading role in NASA’s accomplishments by contributing compelling scientific knowledge to advance the Agency’s mission. <b>Follow us on <a href="http://twitter.com/NASAGoddardPix" rel="nofollow">Twitter</a></b> <b>Like us on <a href="http://www.facebook.com/pages/Greenbelt-MD/NASA-Goddard/395013845897?ref=tsd" rel="nofollow">Facebook</a></b> <b>Find us on <a href="http://instagrid.me/nasagoddard/?vm=grid" rel="nofollow">Instagram</a></b>
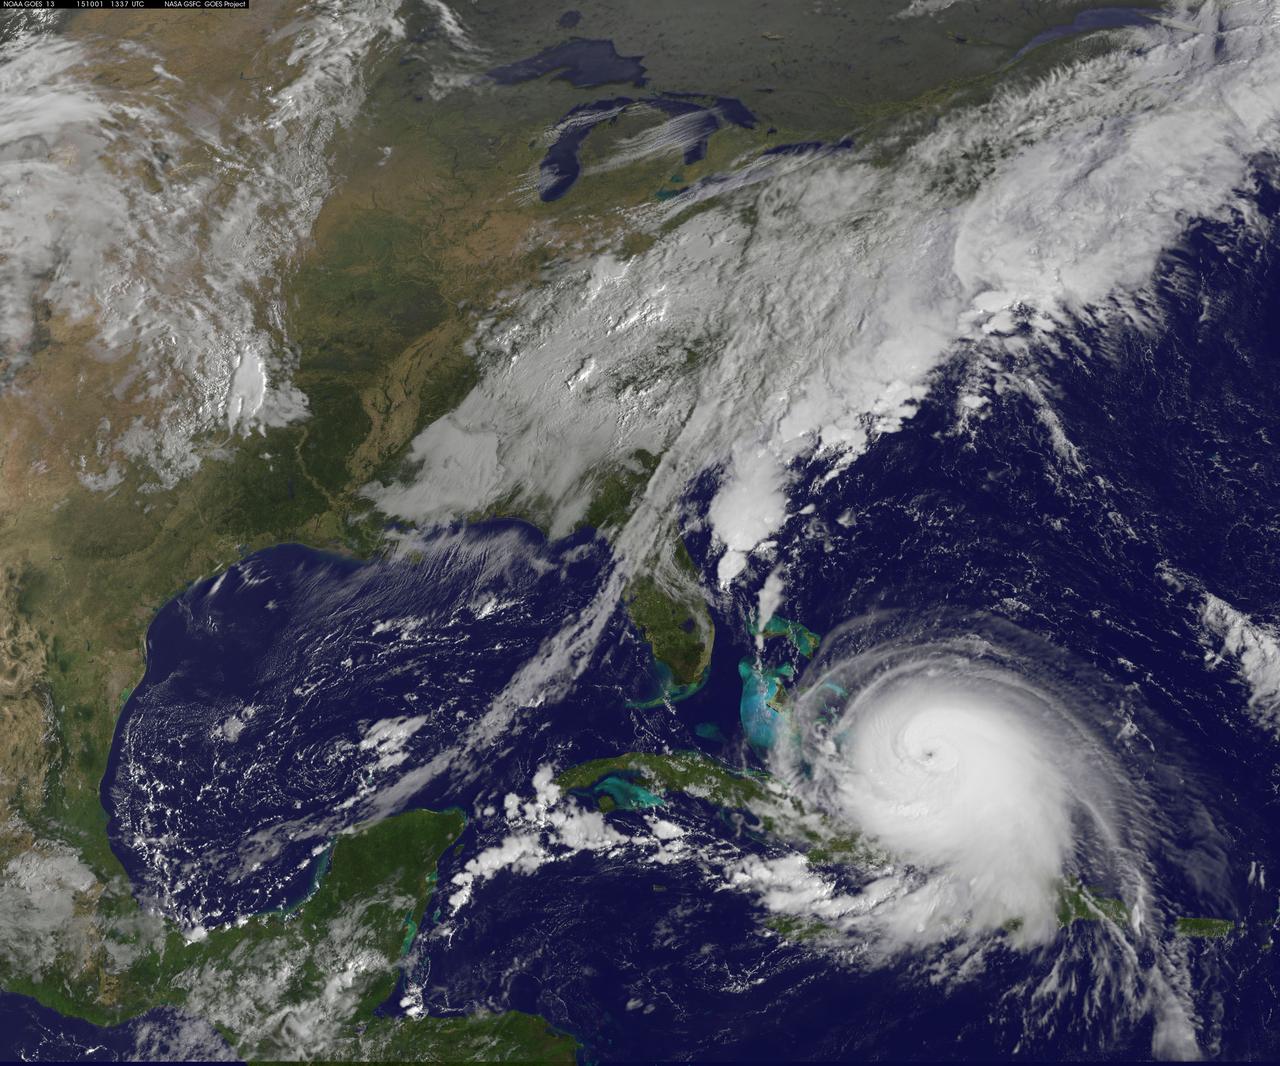
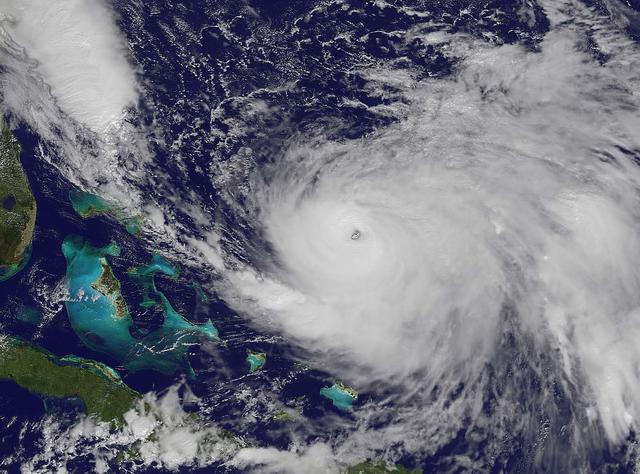
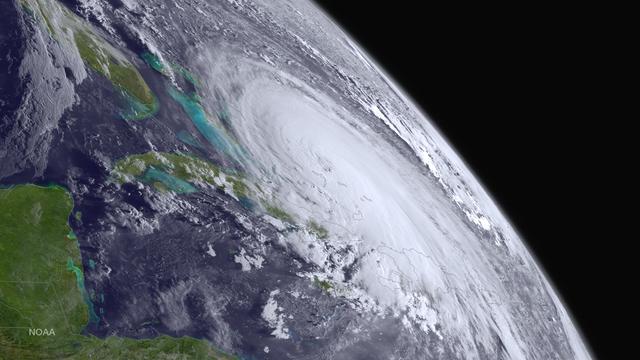
Hurricane Joaquin continued to intensify in the Bahamas on October 1 and NASA and NOAA satellites have been providing valuable data on the storm. NASA's GPM and Terra satellites and NOAA's GOES-East satellite provided rainfall, cloud extent, cloud height and other data to forecasters. Joaquin became a major hurricane today, October 1, reaching Category 3 status on the Saffir-Simpson Wind Scale. On October 1 at 1330 UTC (9:30 a.m. EDT) NOAA's GOES-East satellite captured this visible image of Hurricane Joaquin covering the southern Bahamas and extending over southeastern Cuba, and the island of Hispaniola (which includes Haiti and the Dominican Republic). Joaquin's eye had become completely visible now that the storm had reached Category 3 status. On October 1, a Hurricane Warning was in effect for the Central Bahamas, Northwestern Bahamas including the Abacos, Berry Islands, Eleuthera, Grand Bahama Island, and New Providence, The Acklins, Crooked Island, and Mayaguana in the southeastern Bahamas. A Hurricane Watch was in effect for Bimini and Andros Island, and a Tropical Storm Warning was in effect for the remainder of the southeastern Bahamas excluding the Turks and Caicos Islands and Andros Island. According to NHC, at 8 a.m. EDT (1200 UTC), the center of Hurricane Joaquin was located near latitude 23.2 North, longitude 73.7 West. That's just 10 miles (15 km) north of Samana Cays, Bahamas and about 75 miles (120 km) southeast of San Salvador, Bahamas. Joaquin was moving toward the west-southwest near 5 mph (7 kph), and this motion is expected to continue today. NHC noted that a turn toward the west- northwest is forecast tonight (Oct. 1), followed by a turn toward the north and an increase in forward speed on Friday, Oct. 2. On the forecast track, the center of Joaquin will move near or over portions of the central Bahamas today and tonight and pass near or over portions of the northwestern Bahamas on Friday. Maximum sustained winds are near 120 mph (195 km/h) with higher gusts. Joaquin is a category 3 hurricane on the Saffir-Simpson Hurricane Wind Scale. Some strengthening is forecast in the next day or so, with some fluctuations in intensity possible on Friday. Hurricane force winds extend outward up to 35 miles (55 km) from the center and tropical storm force winds extend outward up to 140 miles (220 km). The minimum central pressure just extrapolated by an Air Force Reserve Hurricane Hunter aircraft is 942 millibars. For updated forecasts, watches and warnings visit the National Hurricane Center (NHC) website: <a href="http://www.nhc.noaa.gov" rel="nofollow">www.nhc.noaa.gov</a>. Credit: NASA/NOAA GOES Project <b><a href="http://www.nasa.gov/audience/formedia/features/MP_Photo_Guidelines.html" rel="nofollow">NASA image use policy.</a></b> <b><a href="http://www.nasa.gov/centers/goddard/home/index.html" rel="nofollow">NASA Goddard Space Flight Center</a></b> enables NASA’s mission through four scientific endeavors: Earth Science, Heliophysics, Solar System Exploration, and Astrophysics. Goddard plays a leading role in NASA’s accomplishments by contributing compelling scientific knowledge to advance the Agency’s mission. <b>Follow us on <a href="http://twitter.com/NASAGoddardPix" rel="nofollow">Twitter</a></b> <b>Like us on <a href="http://www.facebook.com/pages/Greenbelt-MD/NASA-Goddard/395013845897?ref=tsd" rel="nofollow">Facebook</a></b> <b>Find us on <a href="http://instagrid.me/nasagoddard/?vm=grid" rel="nofollow">Instagram</a></b>
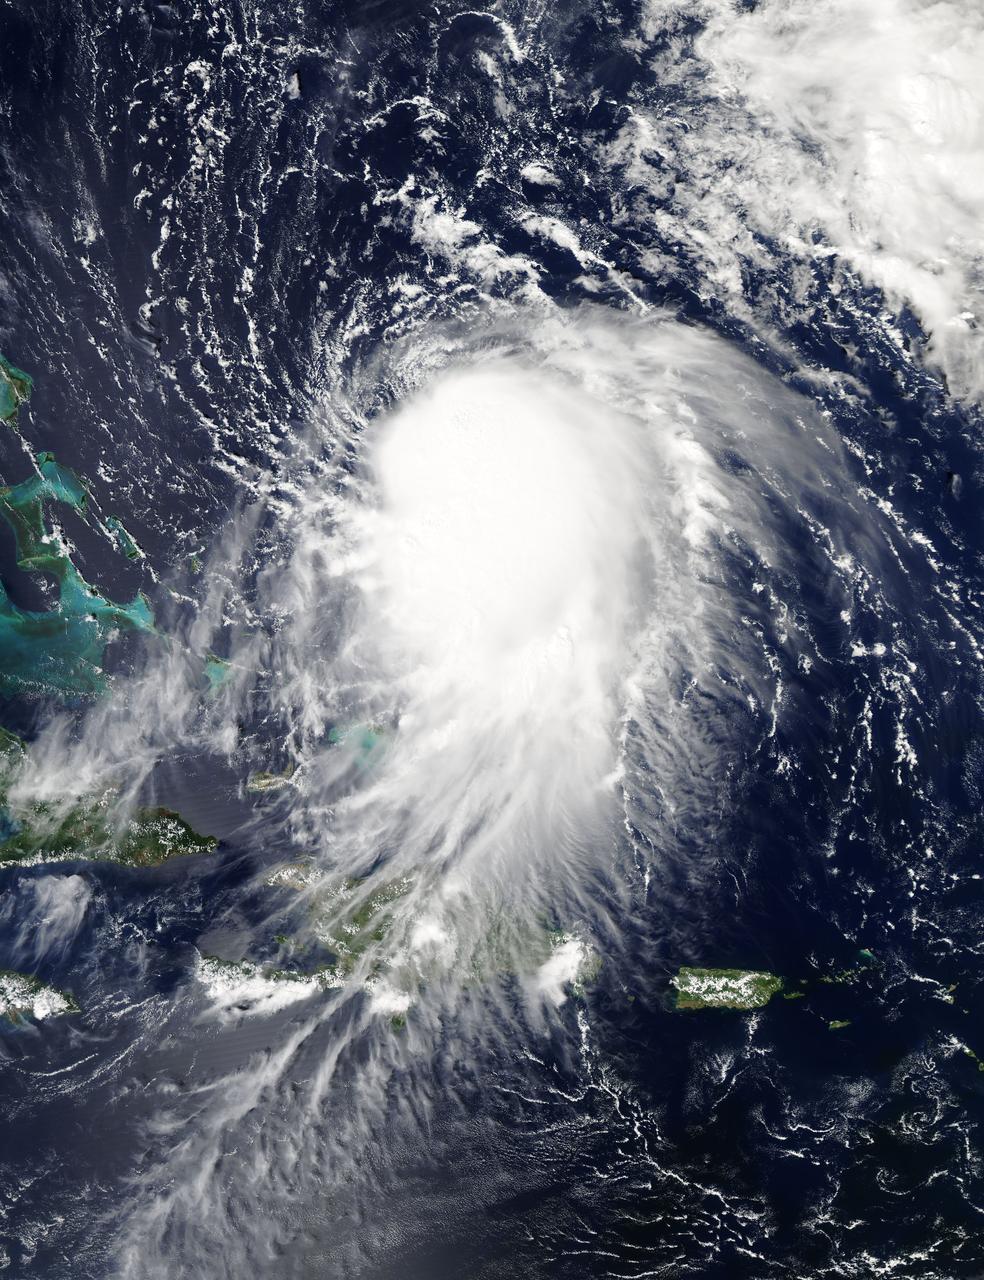
NASA's Aqua satellite captured this image of Joaquin near the Bahamas on Sept. 29 at 18:10 UTC (2:10 p.m. EDT). Credit: NASA Goddard MODIS Rapid Response Team At 11 a.m. EDT (1500 UTC) on Wednesday, September 30, 2015 the center of Hurricane Joaquin was located near latitude 24.7 North, longitude 72.6 West. That puts the center of Joaquin about 215 miles (345 km) east-northeast of the Central Bahamas. Joaquin became a tropical storm Monday evening (EDT), September 29 when it was midway between the Bahamas and Bermuda. By 8 a.m. EDT on September 30, it strengthened into a hurricane and has become the third hurricane of the Atlantic Hurricane season. On September 30, the National Hurricane Center issued a Hurricane Warning for the central Bahamas including Cat Island, the Exumas, Long Island, Rum Cay, and San Salvador. A Hurricane Watch is in effect for the northwestern Bahamas including the Abacos, Berry Islands, Bimini, Eleuthera, Grand Bahama Island, and New Providence, but excluding Andros Island. <b><a href="http://www.nasa.gov/audience/formedia/features/MP_Photo_Guidelines.html" rel="nofollow">NASA image use policy.</a></b> <b><a href="http://www.nasa.gov/centers/goddard/home/index.html" rel="nofollow">NASA Goddard Space Flight Center</a></b> enables NASA’s mission through four scientific endeavors: Earth Science, Heliophysics, Solar System Exploration, and Astrophysics. Goddard plays a leading role in NASA’s accomplishments by contributing compelling scientific knowledge to advance the Agency’s mission. <b>Follow us on <a href="http://twitter.com/NASAGoddardPix" rel="nofollow">Twitter</a></b> <b>Like us on <a href="http://www.facebook.com/pages/Greenbelt-MD/NASA-Goddard/395013845897?ref=tsd" rel="nofollow">Facebook</a></b> <b>Find us on <a href="http://instagrid.me/nasagoddard/?vm=grid" rel="nofollow">Instagram</a></b>
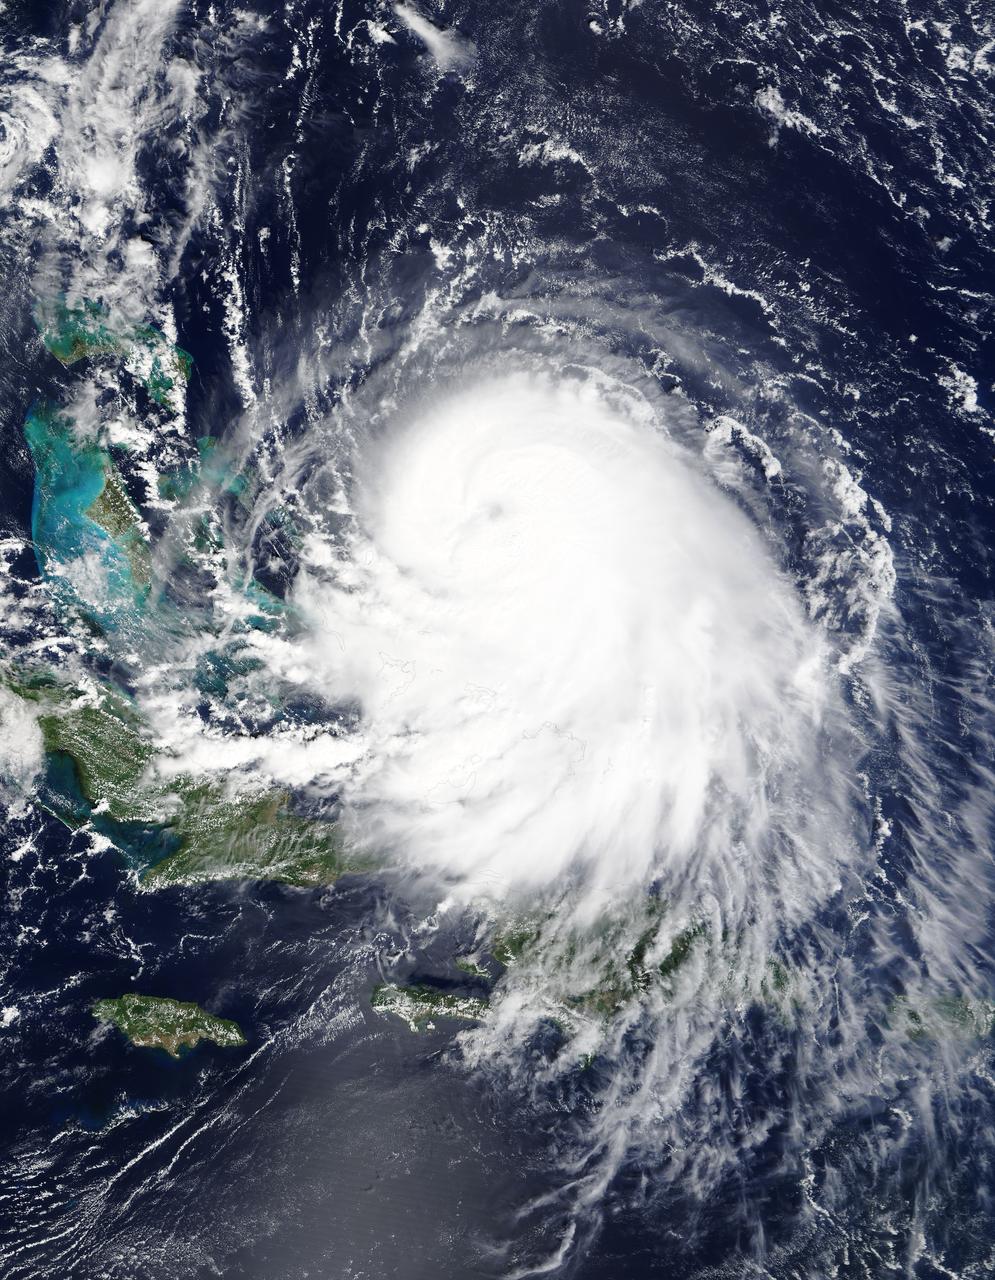
The MODIS instrument on NASA's Terra satellite captured Hurricane Joaquin off the Bahamas at 15:45 UTC (11:45 a.m. EDT) on September 30, 2015. Credit: NASA/GSFC/Jeff Schmaltz/MODIS Land Rapid Response Team At 11 a.m. EDT (1500 UTC) on Wednesday, September 30, 2015 the center of Hurricane Joaquin was located near latitude 24.7 North, longitude 72.6 West. That puts the center of Joaquin about 215 miles (345 km) east-northeast of the Central Bahamas. Joaquin became a tropical storm Monday evening (EDT), September 29 when it was midway between the Bahamas and Bermuda. By 8 a.m. EDT on September 30, it strengthened into a hurricane and has become the third hurricane of the Atlantic Hurricane season. On September 30, the National Hurricane Center issued a Hurricane Warning for the central Bahamas including Cat Island, the Exumas, Long Island, Rum Cay, and San Salvador. A Hurricane Watch is in effect for the northwestern Bahamas including the Abacos, Berry Islands, Bimini, Eleuthera, Grand Bahama Island, and New Providence, but excluding Andros Island. <b><a href="http://www.nasa.gov/audience/formedia/features/MP_Photo_Guidelines.html" rel="nofollow">NASA image use policy.</a></b> <b><a href="http://www.nasa.gov/centers/goddard/home/index.html" rel="nofollow">NASA Goddard Space Flight Center</a></b> enables NASA’s mission through four scientific endeavors: Earth Science, Heliophysics, Solar System Exploration, and Astrophysics. Goddard plays a leading role in NASA’s accomplishments by contributing compelling scientific knowledge to advance the Agency’s mission. <b>Follow us on <a href="http://twitter.com/NASAGoddardPix" rel="nofollow">Twitter</a></b> <b>Like us on <a href="http://www.facebook.com/pages/Greenbelt-MD/NASA-Goddard/395013845897?ref=tsd" rel="nofollow">Facebook</a></b> <b>Find us on <a href="http://instagrid.me/nasagoddard/?vm=grid" rel="nofollow">Instagram</a></b>
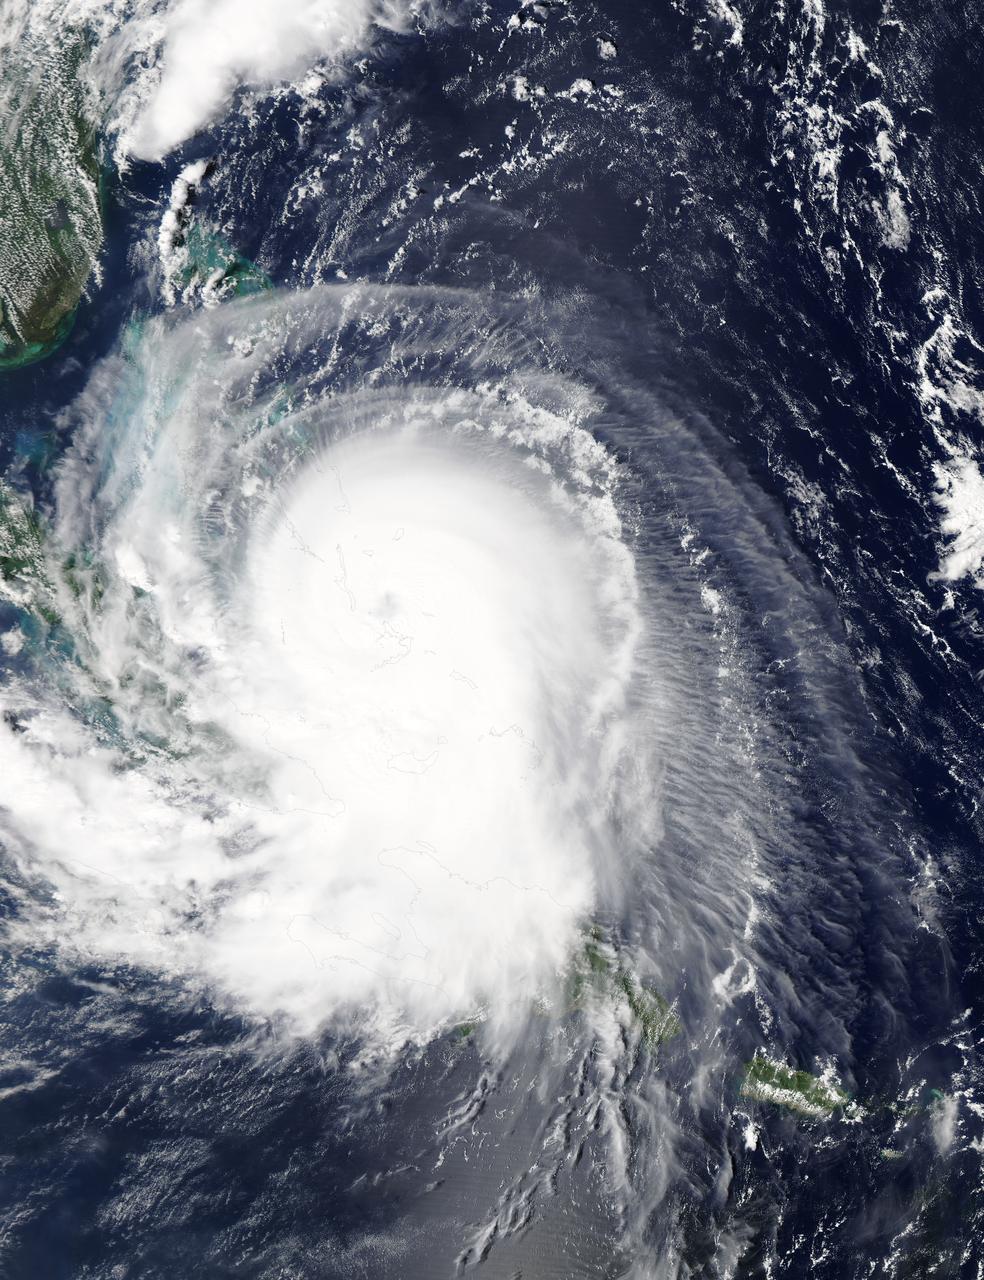
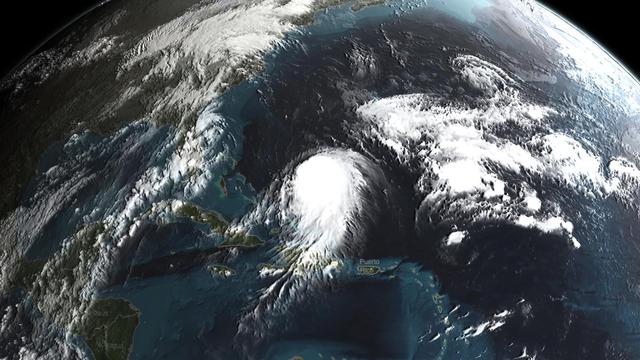
NASA's Aqua satellite captured this image of Hurricane Joaquin over the Bahamas on Oct. 1 at 17:55 UTC (1:55 p.m. EDT). Recently upgraded to Category 4, Hurricane Joaquin has maximum sustained winds of 130 mph which may grow stronger. Credit: NASA Goddard MODIS Rapid Response Team <b><a href="http://www.nasa.gov/audience/formedia/features/MP_Photo_Guidelines.html" rel="nofollow">NASA image use policy.</a></b> <b><a href="http://www.nasa.gov/centers/goddard/home/index.html" rel="nofollow">NASA Goddard Space Flight Center</a></b> enables NASA’s mission through four scientific endeavors: Earth Science, Heliophysics, Solar System Exploration, and Astrophysics. Goddard plays a leading role in NASA’s accomplishments by contributing compelling scientific knowledge to advance the Agency’s mission. <b>Follow us on <a href="http://twitter.com/NASAGoddardPix" rel="nofollow">Twitter</a></b> <b>Like us on <a href="http://www.facebook.com/pages/Greenbelt-MD/NASA-Goddard/395013845897?ref=tsd" rel="nofollow">Facebook</a></b> <b>Find us on <a href="http://instagrid.me/nasagoddard/?vm=grid" rel="nofollow">Instagram</a></b>
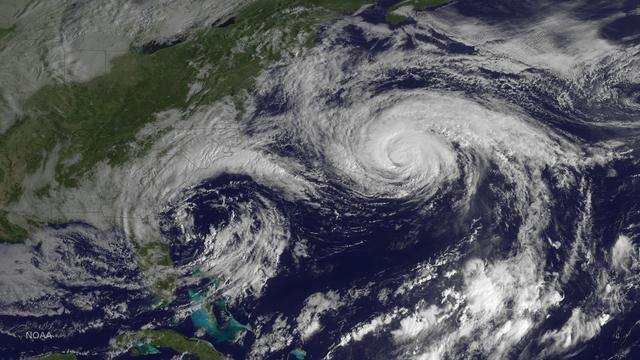
NOAA's GOES-East satellite captured this visible image of Hurricane Joaquin east of the Bahamas on Oct. 3 at 1615 UTC (12:15 p.m. EDT). The national weather forecast for October 3, 2015: Joaquin is no threat for now, but the nor'easter on the East Coast is causing massive flooding. Heavy rain hit Charleston, South Carolina., and much of the Southeast on Saturday, giving the region little relief from the threat of Hurricane Joaquin as it moved to the northeast away from the East Coast. Credit: NASA/NOAA GOES Project <b><a href="http://www.nasa.gov/audience/formedia/features/MP_Photo_Guidelines.html" rel="nofollow">NASA image use policy.</a></b> <b><a href="http://www.nasa.gov/centers/goddard/home/index.html" rel="nofollow">NASA Goddard Space Flight Center</a></b> enables NASA’s mission through four scientific endeavors: Earth Science, Heliophysics, Solar System Exploration, and Astrophysics. Goddard plays a leading role in NASA’s accomplishments by contributing compelling scientific knowledge to advance the Agency’s mission. <b>Follow us on <a href="http://twitter.com/NASAGoddardPix" rel="nofollow">Twitter</a></b> <b>Like us on <a href="http://www.facebook.com/pages/Greenbelt-MD/NASA-Goddard/395013845897?ref=tsd" rel="nofollow">Facebook</a></b> <b>Find us on <a href="http://instagrid.me/nasagoddard/?vm=grid" rel="nofollow">Instagram</a></b>
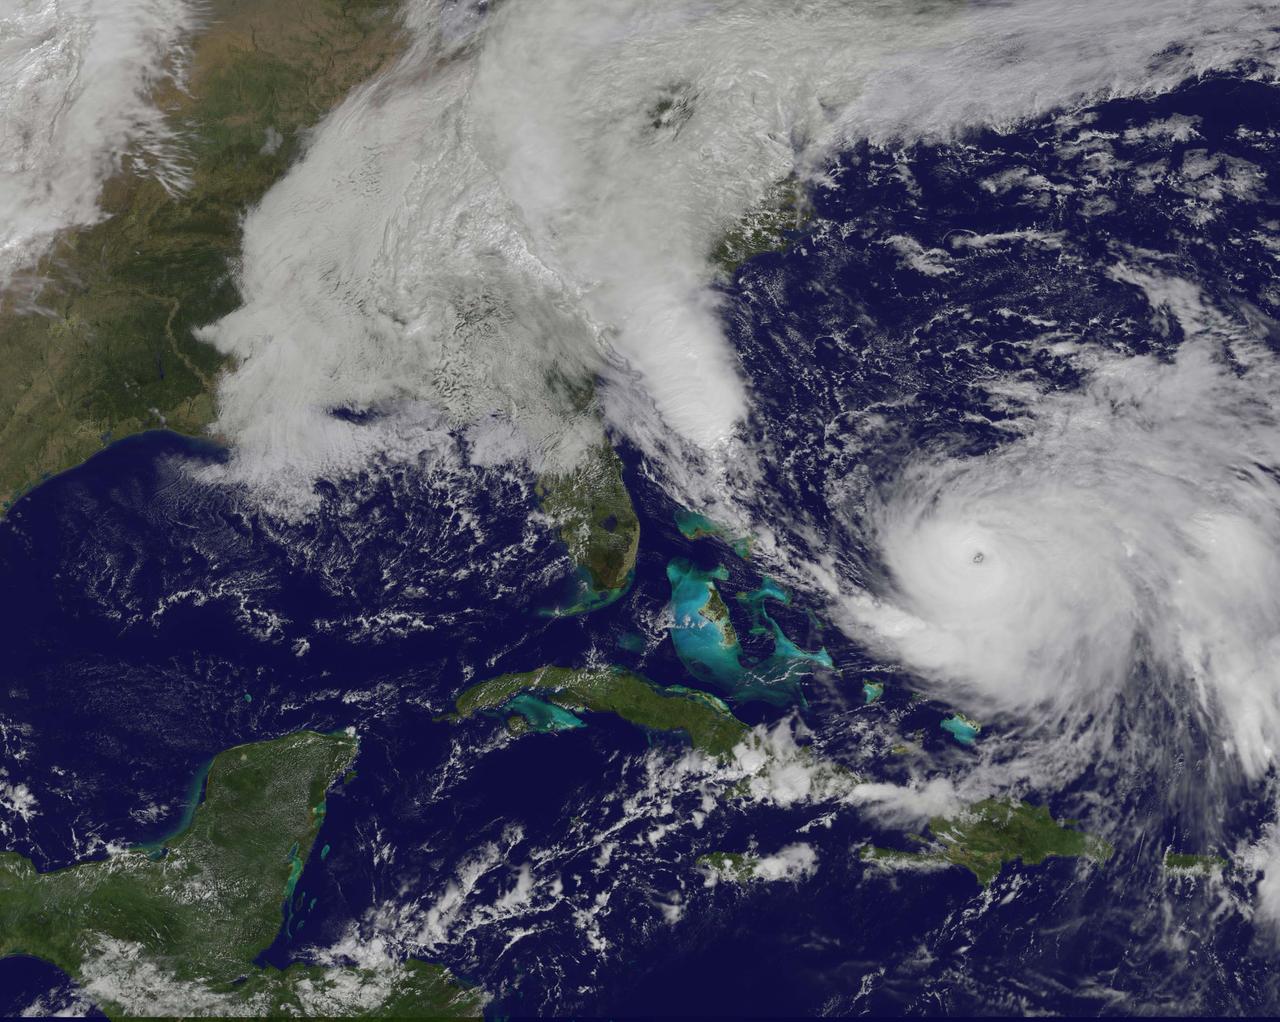
NOAA's GOES-East satellite captured this visible image of Hurricane Joaquin east of the Bahamas on Oct. 3 at 1615 UTC (12:15 p.m. EDT). The national weather forecast for October 3, 2015: Joaquin is no threat for now, but the nor'easter on the East Coast is causing massive flooding. Heavy rain hit Charleston, South Carolina., and much of the Southeast on Saturday, giving the region little relief from the threat of Hurricane Joaquin as it moved to the northeast away from the East Coast. Credit: NASA/NOAA GOES Project <b><a href="http://www.nasa.gov/audience/formedia/features/MP_Photo_Guidelines.html" rel="nofollow">NASA image use policy.</a></b> <b><a href="http://www.nasa.gov/centers/goddard/home/index.html" rel="nofollow">NASA Goddard Space Flight Center</a></b> enables NASA’s mission through four scientific endeavors: Earth Science, Heliophysics, Solar System Exploration, and Astrophysics. Goddard plays a leading role in NASA’s accomplishments by contributing compelling scientific knowledge to advance the Agency’s mission. <b>Follow us on <a href="http://twitter.com/NASAGoddardPix" rel="nofollow">Twitter</a></b> <b>Like us on <a href="http://www.facebook.com/pages/Greenbelt-MD/NASA-Goddard/395013845897?ref=tsd" rel="nofollow">Facebook</a></b> <b>Find us on <a href="http://instagrid.me/nasagoddard/?vm=grid" rel="nofollow">Instagram</a></b>
Hurricane Joaquin is seen in the Atlantic Ocean north of Bermuda in this image taken by GOES East at 1315 UTC (9:15 a.m. EDT) on October 5, 2015. Credit: NASA/NOAA via <b><a href="www.nnvl.noaa.gov/" rel="nofollow"> NOAA Environmental Visualization Laboratory</a></b> <b><a href="http://goes.gsfc.nasa.gov/" rel="nofollow">Credit: NOAA/NASA GOES Project</a></b> <b><a href="http://www.nasa.gov/audience/formedia/features/MP_Photo_Guidelines.html" rel="nofollow">NASA image use policy.</a></b> <b><a href="http://www.nasa.gov/centers/goddard/home/index.html" rel="nofollow">NASA Goddard Space Flight Center</a></b> enables NASA’s mission through four scientific endeavors: Earth Science, Heliophysics, Solar System Exploration, and Astrophysics. Goddard plays a leading role in NASA’s accomplishments by contributing compelling scientific knowledge to advance the Agency’s mission. <b>Follow us on <a href="http://twitter.com/NASAGoddardPix" rel="nofollow">Twitter</a></b> <b>Like us on <a href="http://www.facebook.com/pages/Greenbelt-MD/NASA-Goddard/395013845897?ref=tsd" rel="nofollow">Facebook</a></b> <b>Find us on <a href="http://instagrid.me/nasagoddard/?vm=grid" rel="nofollow">Instagram</a></b>
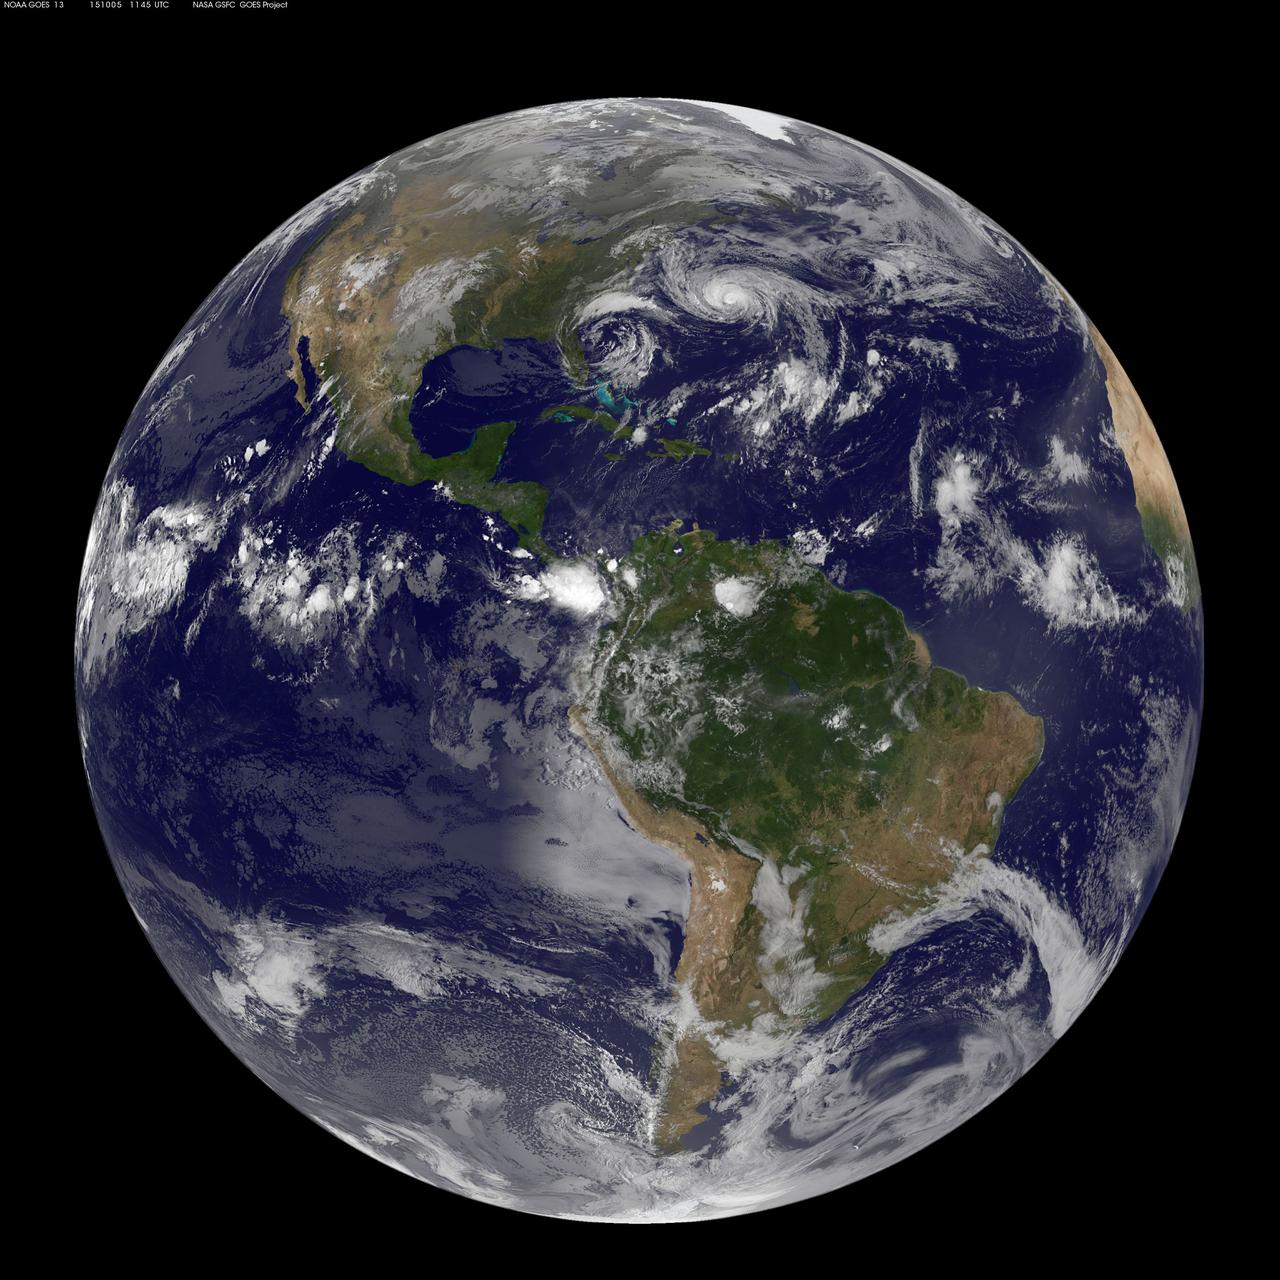
Hurricane Joaquin is seen in the Atlantic Ocean north of Bermuda in this image taken by GOES East at 1315 UTC (9:15 a.m. EDT) on October 5, 2015. <b><a href="http://goes.gsfc.nasa.gov/" rel="nofollow">Credit: NOAA/NASA GOES Project</a></b> <b><a href="http://www.nasa.gov/audience/formedia/features/MP_Photo_Guidelines.html" rel="nofollow">NASA image use policy.</a></b> <b><a href="http://www.nasa.gov/centers/goddard/home/index.html" rel="nofollow">NASA Goddard Space Flight Center</a></b> enables NASA’s mission through four scientific endeavors: Earth Science, Heliophysics, Solar System Exploration, and Astrophysics. Goddard plays a leading role in NASA’s accomplishments by contributing compelling scientific knowledge to advance the Agency’s mission. <b>Follow us on <a href="http://twitter.com/NASAGoddardPix" rel="nofollow">Twitter</a></b> <b>Like us on <a href="http://www.facebook.com/pages/Greenbelt-MD/NASA-Goddard/395013845897?ref=tsd" rel="nofollow">Facebook</a></b> <b>Find us on <a href="http://instagrid.me/nasagoddard/?vm=grid" rel="nofollow">Instagram</a></b>
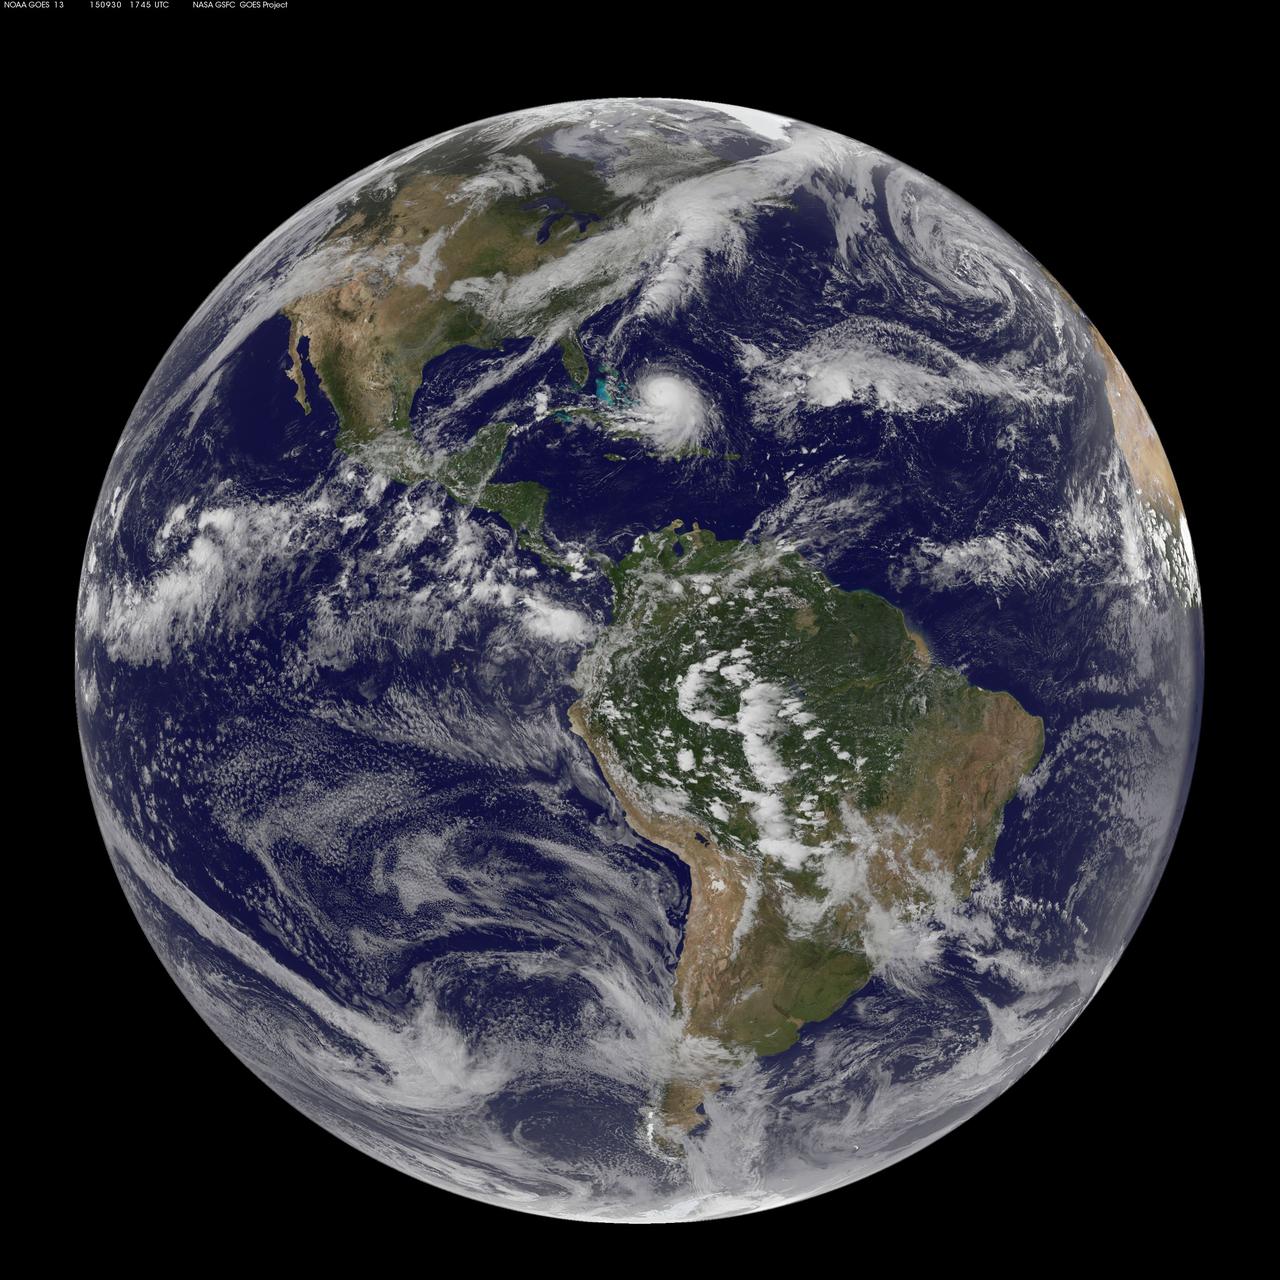
NOAA's GOES-East satellite captured this visible image of Hurricane Joaquin east of the Bahamas on Sept. 30 at 1745 UTC (1:45 p.m. EDT). Credit: NASA/NOAA GOES Project At 11 a.m. EDT (1500 UTC) on Wednesday, September 30, 2015 the center of Hurricane Joaquin was located near latitude 24.7 North, longitude 72.6 West. That puts the center of Joaquin about 215 miles (345 km) east-northeast of the Central Bahamas. Joaquin became a tropical storm Monday evening (EDT), September 29 when it was midway between the Bahamas and Bermuda. By 8 a.m. EDT on September 30, it strengthened into a hurricane and has become the third hurricane of the Atlantic Hurricane season. On September 30, the National Hurricane Center issued a Hurricane Warning for the central Bahamas including Cat Island, the Exumas, Long Island, Rum Cay, and San Salvador. A Hurricane Watch is in effect for the northwestern Bahamas including the Abacos, Berry Islands, Bimini, Eleuthera, Grand Bahama Island, and New Providence, but excluding Andros Island. <b><a href="http://www.nasa.gov/audience/formedia/features/MP_Photo_Guidelines.html" rel="nofollow">NASA image use policy.</a></b> <b><a href="http://www.nasa.gov/centers/goddard/home/index.html" rel="nofollow">NASA Goddard Space Flight Center</a></b> enables NASA’s mission through four scientific endeavors: Earth Science, Heliophysics, Solar System Exploration, and Astrophysics. Goddard plays a leading role in NASA’s accomplishments by contributing compelling scientific knowledge to advance the Agency’s mission. <b>Follow us on <a href="http://twitter.com/NASAGoddardPix" rel="nofollow">Twitter</a></b> <b>Like us on <a href="http://www.facebook.com/pages/Greenbelt-MD/NASA-Goddard/395013845897?ref=tsd" rel="nofollow">Facebook</a></b> <b>Find us on <a href="http://instagrid.me/nasagoddard/?vm=grid" rel="nofollow">Instagram</a></b>
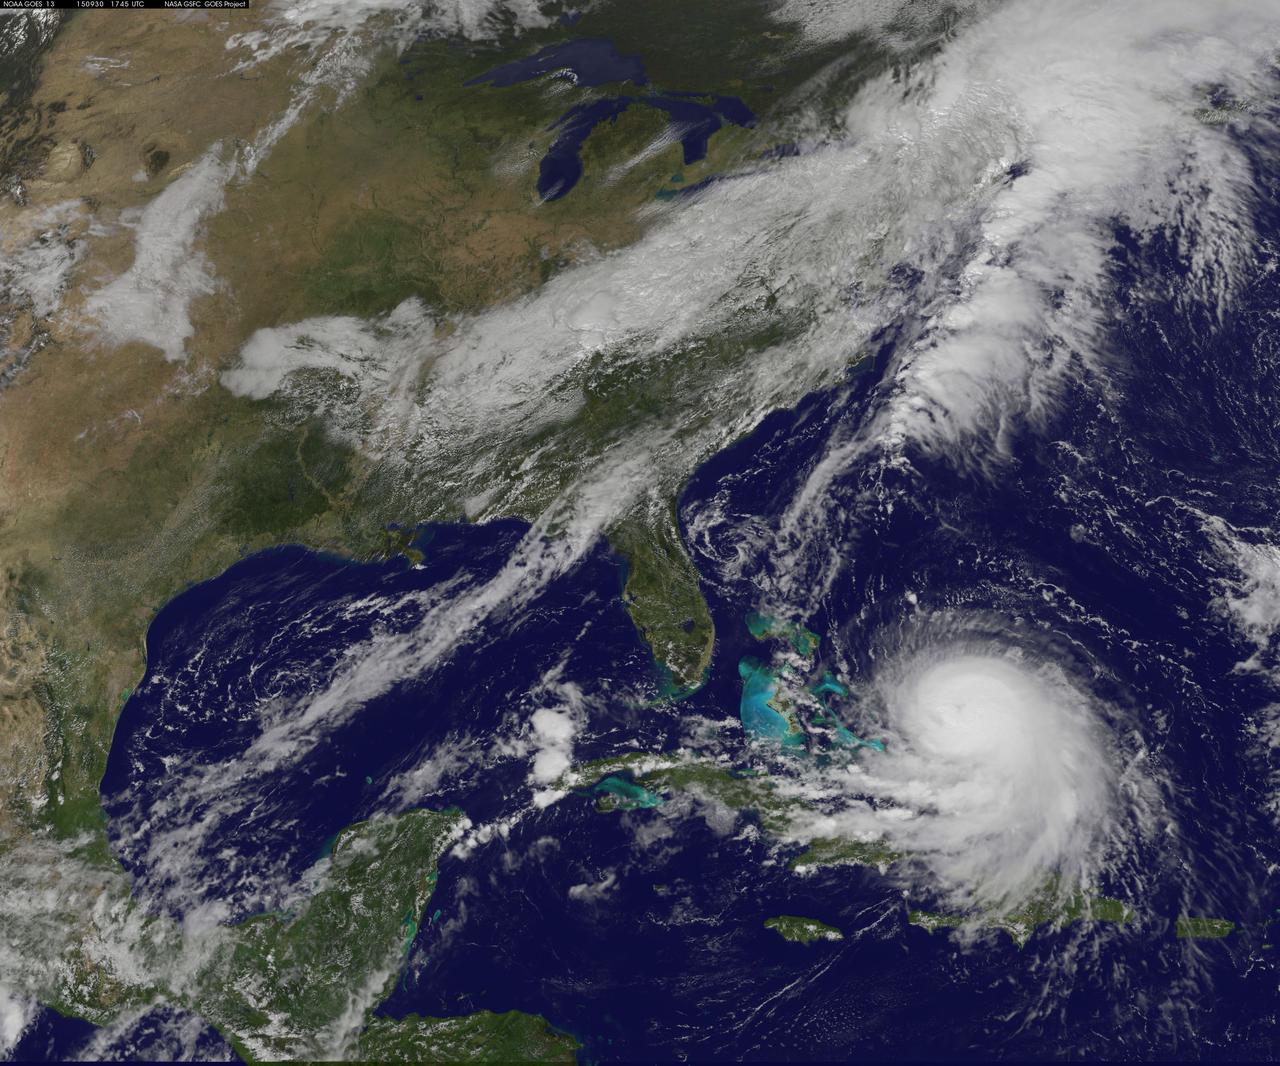
NOAA's GOES-East satellite captured this visible image of Hurricane Joaquin east of the Bahamas on Sept. 30 at 1745 UTC (1:45 p.m. EDT). Credit: NASA/NOAA GOES Project At 11 a.m. EDT (1500 UTC) on Wednesday, September 30, 2015 the center of Hurricane Joaquin was located near latitude 24.7 North, longitude 72.6 West. That puts the center of Joaquin about 215 miles (345 km) east-northeast of the Central Bahamas. Joaquin became a tropical storm Monday evening (EDT), September 29 when it was midway between the Bahamas and Bermuda. By 8 a.m. EDT on September 30, it strengthened into a hurricane and has become the third hurricane of the Atlantic Hurricane season. On September 30, the National Hurricane Center issued a Hurricane Warning for the central Bahamas including Cat Island, the Exumas, Long Island, Rum Cay, and San Salvador. A Hurricane Watch is in effect for the northwestern Bahamas including the Abacos, Berry Islands, Bimini, Eleuthera, Grand Bahama Island, and New Providence, but excluding Andros Island. <b><a href="http://www.nasa.gov/audience/formedia/features/MP_Photo_Guidelines.html" rel="nofollow">NASA image use policy.</a></b> <b><a href="http://www.nasa.gov/centers/goddard/home/index.html" rel="nofollow">NASA Goddard Space Flight Center</a></b> enables NASA’s mission through four scientific endeavors: Earth Science, Heliophysics, Solar System Exploration, and Astrophysics. Goddard plays a leading role in NASA’s accomplishments by contributing compelling scientific knowledge to advance the Agency’s mission. <b>Follow us on <a href="http://twitter.com/NASAGoddardPix" rel="nofollow">Twitter</a></b> <b>Like us on <a href="http://www.facebook.com/pages/Greenbelt-MD/NASA-Goddard/395013845897?ref=tsd" rel="nofollow">Facebook</a></b> <b>Find us on <a href="http://instagrid.me/nasagoddard/?vm=grid" rel="nofollow">Instagram</a></b>
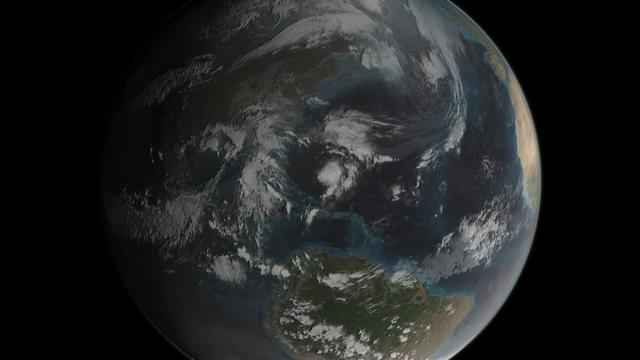
-- Joaquin became a tropical storm Monday evening (EDT) midway between the Bahamas and Bermuda and has now formed into a hurricane, the 3rd of the season--the difference is Joaquin could impact the US East Coast. GPM captured Joaquin Tuesday, September 29th at 21:39 UTC (5:39 pm EDT) as the hurricane moved slowly towards the west-southwest about 400 miles east of the northwestern Bahamas. At the time, Joaquin had been battling northerly wind shear, which was impeding the storm's ability to strengthen. However, compared to earlier in the day, the system was beginning to gain the upper hand as the shear began to relax its grip. At the time of this data visualization, Joaquin's low-level center of circulation was located further within the cloud shield, and the rain area was beginning to wrap farther around the center on the eastern side of the storm while showing signs of increased banding and curvature, a sure sign that Joaquin's circulation was intensifying. GPM shows a large area of very intense rain with rain rates ranging from around 50 to 132 mm/hr (~2 to 5 inches, shown in red and magenta) just to the right of the center. This is a strong indication that large amounts of heat are being released into the storm's center, fueling its circulation and providing the means for its intensification. Associated with the area of intense rain is an area of tall convective towers, known as a convective burst, with tops reaching up to 16.3 km (shown in orange). These towers when located near the storm's core are a strong indication that the storm is poised to strengthen as they too reveal the release of heat into the storm. At the time this data was taken, the National Hurricane Center reported that Joaquin's maximum sustained winds had increased to 65 mph from 40 mph earlier in the day, making Joaquin a strong tropical storm but poised to become a hurricane, which occurred this morning at 8:00 am EDT. With the inhibiting wind shear expected to continue to diminish and the system moving over warm waters, the National Hurricane Center is forecasting Joaquin to intensify further, possibly into a major hurricane within the next few days. Credit: NASA's Scientific Visualization Studio Data provided by the joint NASA/JAXA GPM mission <b><a href="http://www.nasa.gov/audience/formedia/features/MP_Photo_Guidelines.html" rel="nofollow">NASA image use policy.</a></b> <b><a href="http://www.nasa.gov/centers/goddard/home/index.html" rel="nofollow">NASA Goddard Space Flight Center</a></b> enables NASA’s mission through four scientific endeavors: Earth Science, Heliophysics, Solar System Exploration, and Astrophysics. Goddard plays a leading role in NASA’s accomplishments by contributing compelling scientific knowledge to advance the Agency’s mission. <b>Follow us on <a href="http://twitter.com/NASAGoddardPix" rel="nofollow">Twitter</a></b> <b>Like us on <a href="http://www.facebook.com/pages/Greenbelt-MD/NASA-Goddard/395013845897?ref=tsd" rel="nofollow">Facebook</a></b> <b>Find us on <a href="http://instagrid.me/nasagoddard/?vm=grid" rel="nofollow">Instagram</a></b>

San Joaquin, the name given to the southern portion of California vast Central Valley, as shown in this image acquired by NASA Shuttle Radar Topography Mission SRTM on February 16, 2000.
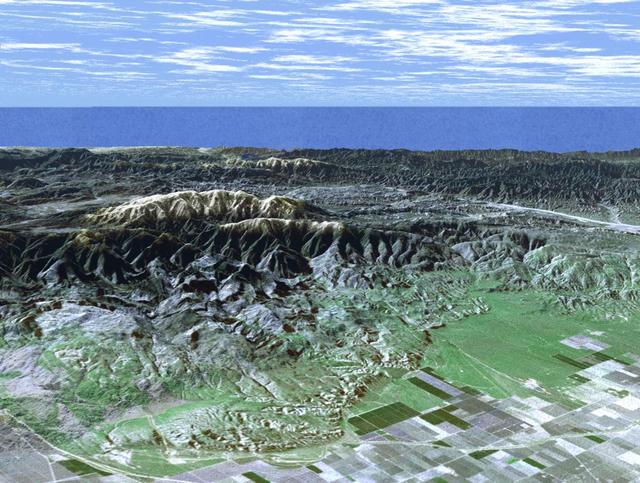
This image is of Mt. Pinos and San Joaquin Valley, California. NASA Shuttle Radar Topography Mission SRTM acquired this data on February 16, 2000.
Major Hurricane Joaquin is shown at the far eastern periphery of the GOES West satellite's full disk extent, taken at 1200Z on October 1, 2015. Credit: NASA/NOAA via <b><a href="www.nnvl.noaa.gov/" rel="nofollow"> NOAA Environmental Visualization Laboratory</a></b> <b><a href="http://www.nasa.gov/audience/formedia/features/MP_Photo_Guidelines.html" rel="nofollow">NASA image use policy.</a></b> <b><a href="http://www.nasa.gov/centers/goddard/home/index.html" rel="nofollow">NASA Goddard Space Flight Center</a></b> enables NASA’s mission through four scientific endeavors: Earth Science, Heliophysics, Solar System Exploration, and Astrophysics. Goddard plays a leading role in NASA’s accomplishments by contributing compelling scientific knowledge to advance the Agency’s mission. <b>Follow us on <a href="http://twitter.com/NASAGoddardPix" rel="nofollow">Twitter</a></b> <b>Like us on <a href="http://www.facebook.com/pages/Greenbelt-MD/NASA-Goddard/395013845897?ref=tsd" rel="nofollow">Facebook</a></b> <b>Find us on <a href="http://instagrid.me/nasagoddard/?vm=grid" rel="nofollow">Instagram</a></b>
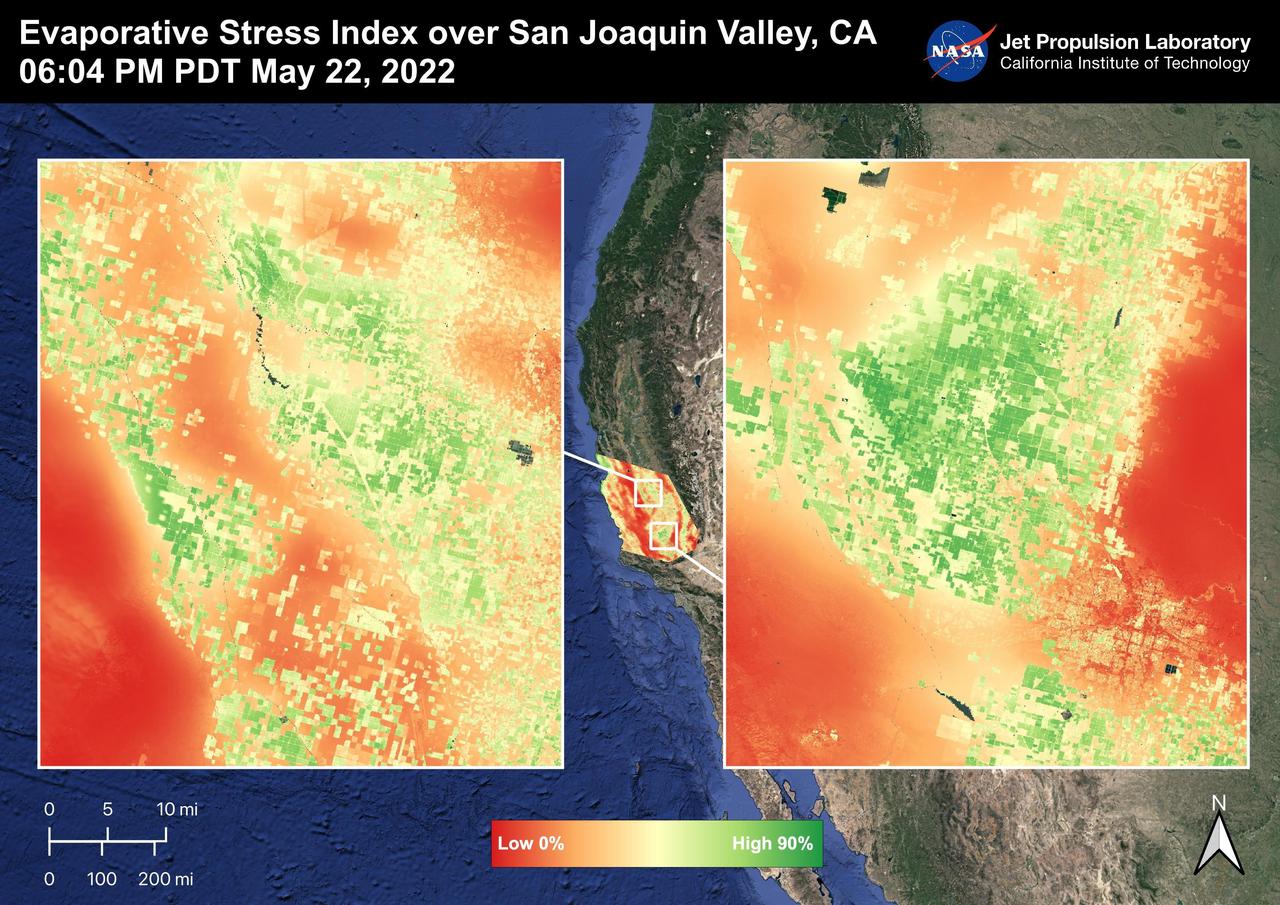
The San Joaquin Valley, CA is one of the most productive agricultural regions in the United States and the world. The image shows the Evaporative Stress Index over the San Joaquin Valley on May 22, 2022 at 06:04 PM PDT where many fields show high ESI values that indicate low plant stress whereas low ESI values indicate high plant stress. ECOSTRESS's ability to detect Evaporative Stress over the agricultural fields can help farmers and decision makers in their choices. As California is in a continuing drought, it is important to monitor that agricultural plant life. ECOSTRESS is a thermal instrument on the International Space Station that measures the temperature of the ground, which is hotter than the air temperature during the day. It was launched to the space station in 2018. Its primary mission is to identify critical thresholds of water use and water stress in plants and to detect the timing, location, and predictive factors leading to plant water uptake decline and/or cessation. The nature of the high-resolution data provided by ECOSTRESS allows it to record heat related phenomena such as heat waves and wildfires. https://photojournal.jpl.nasa.gov/catalog/PIA25487
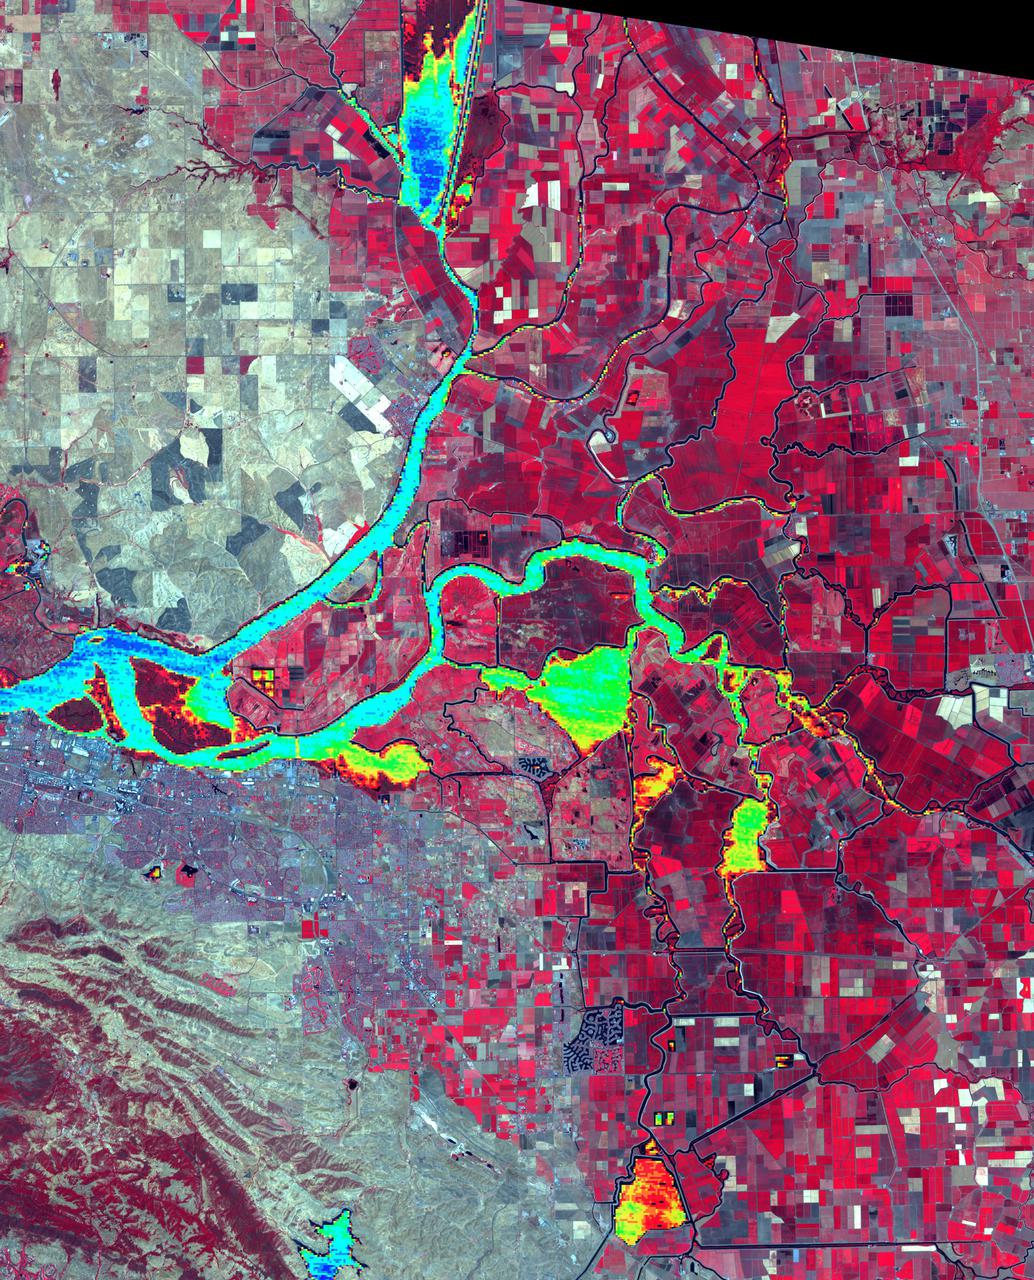
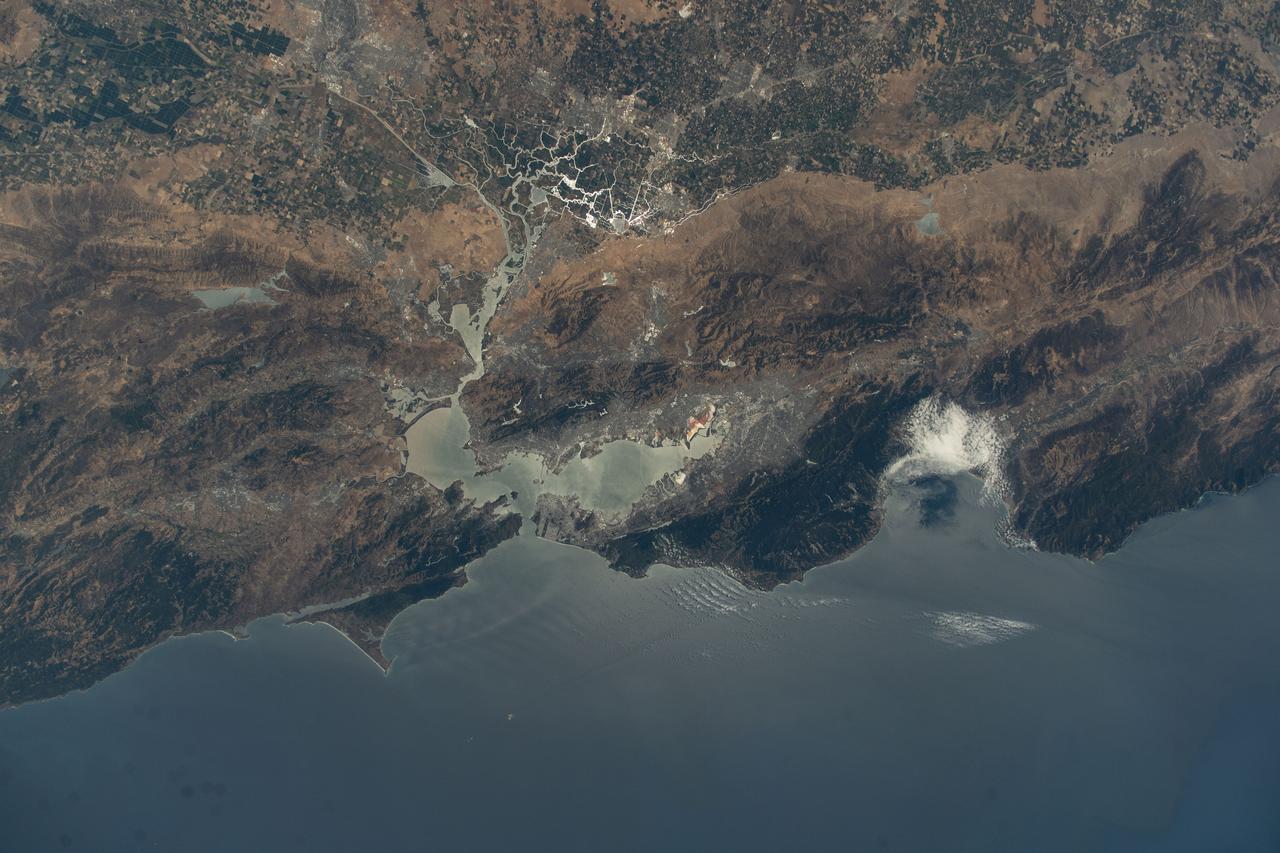
The Sacramento-San Joaquin River Delta, CA (or California Delta) has an area of about 3000 km2, and provides a large fraction of all the water used in California. The Delta drains about 50% of the water coming from the Sierra Nevada Mountains, and channels it through San Francisco's Golden Gate to the Pacific Ocean. Thousands of miles of levees now carefully control the Delta's flow, to maximize water use. The image combines a false color infrared composite (with vegetation depicted in red) with a colorized thermal infrared band to show the water temperature for the larger water bodies. Warmer temperatures are red and yellow, cooler water temperatures are blue and green. The image was acquired July 3, 2012, covers an area of 46.5 by 57.5 km, and is located at 38.1 degrees north, 121.3 degrees west. https://photojournal.jpl.nasa.gov/catalog/PIA24691
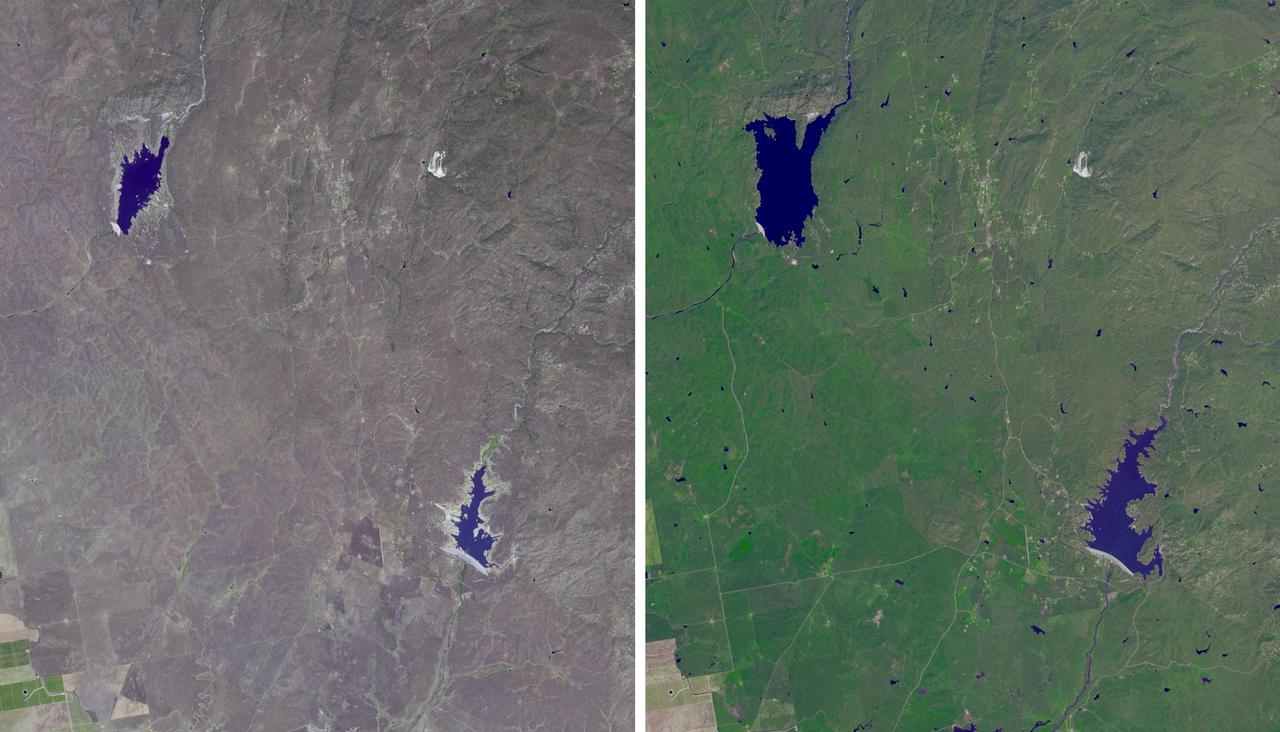
The effects of California severe multiyear drought are seen in this pair of images acquired by NASA Terra spacecraft of the area northeast of Madera, in the Sierra Nevada Moutains foothills between Yosemite National Park and the San Joaquin Valley
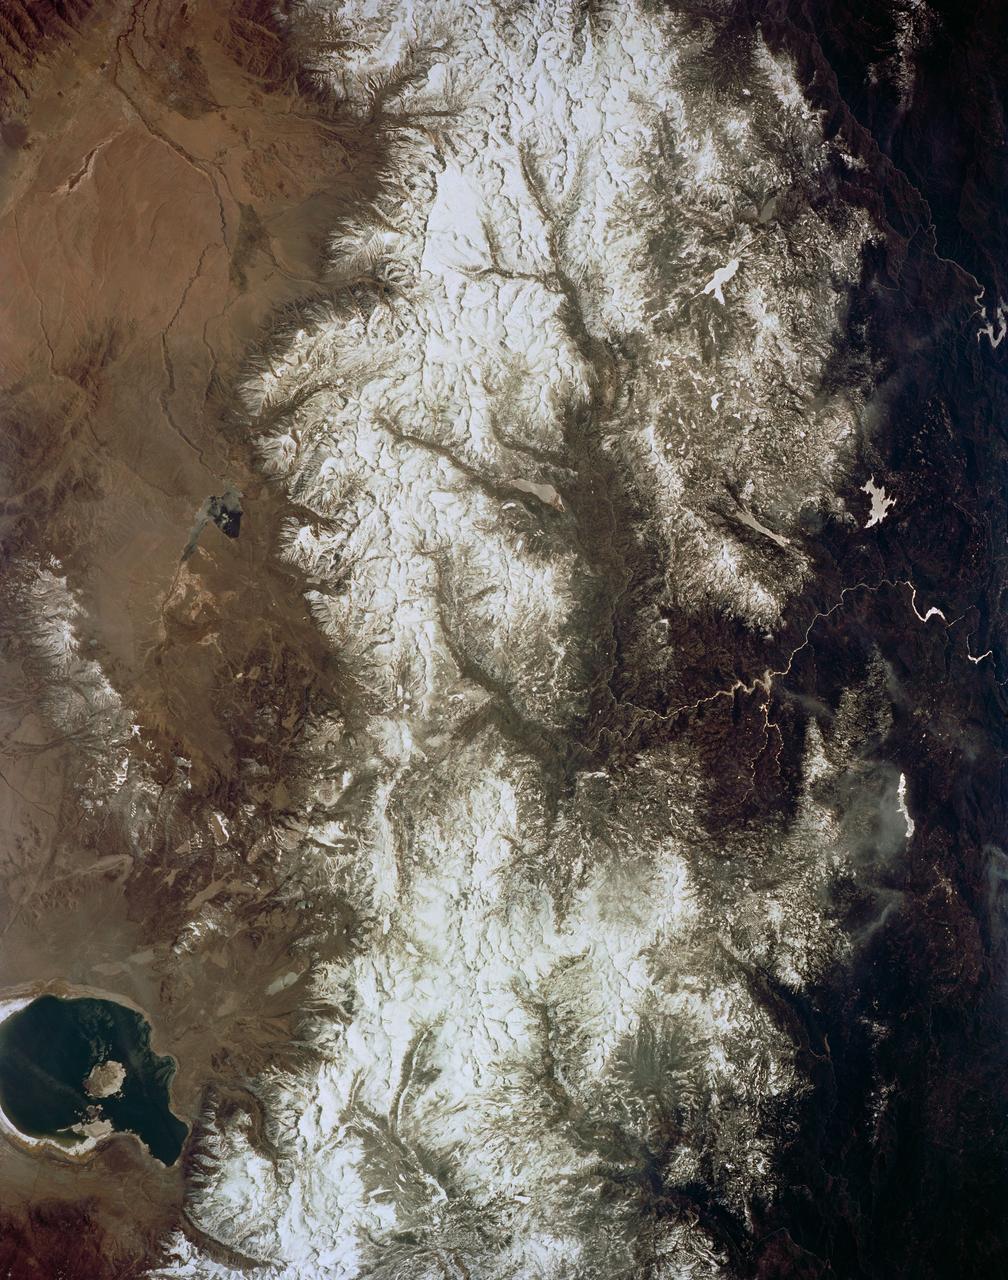
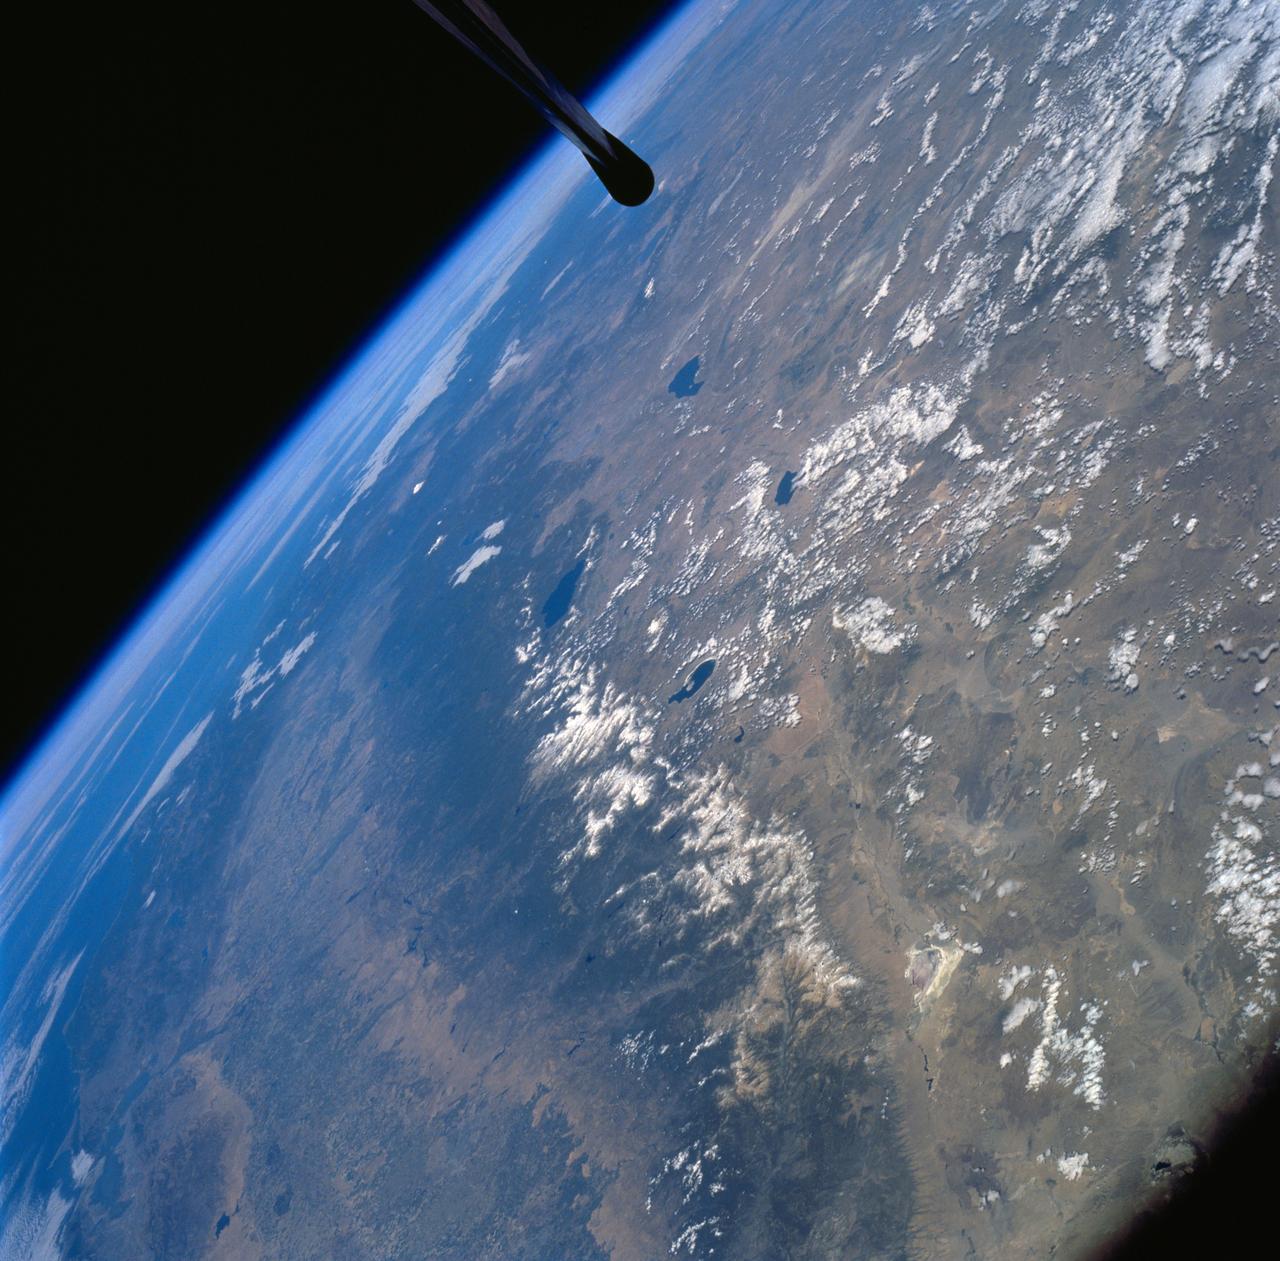
STS059-154-160 (9-20 April 1994) --- Orient with Mono Lake, California at the lower right; then the view is westward across the Sierra Nevada into the San Joaquin River drainage. A tiny network of ski trails can be seen on the Mono Lake side of the Sierras, on a line between Mono Lake and the snow-free San Joaquin headwaters. The ski trails mark Mammoth Mountain, where SRL investigators are studying microwave measurements of the water content of snowpacks. Linhof camera.
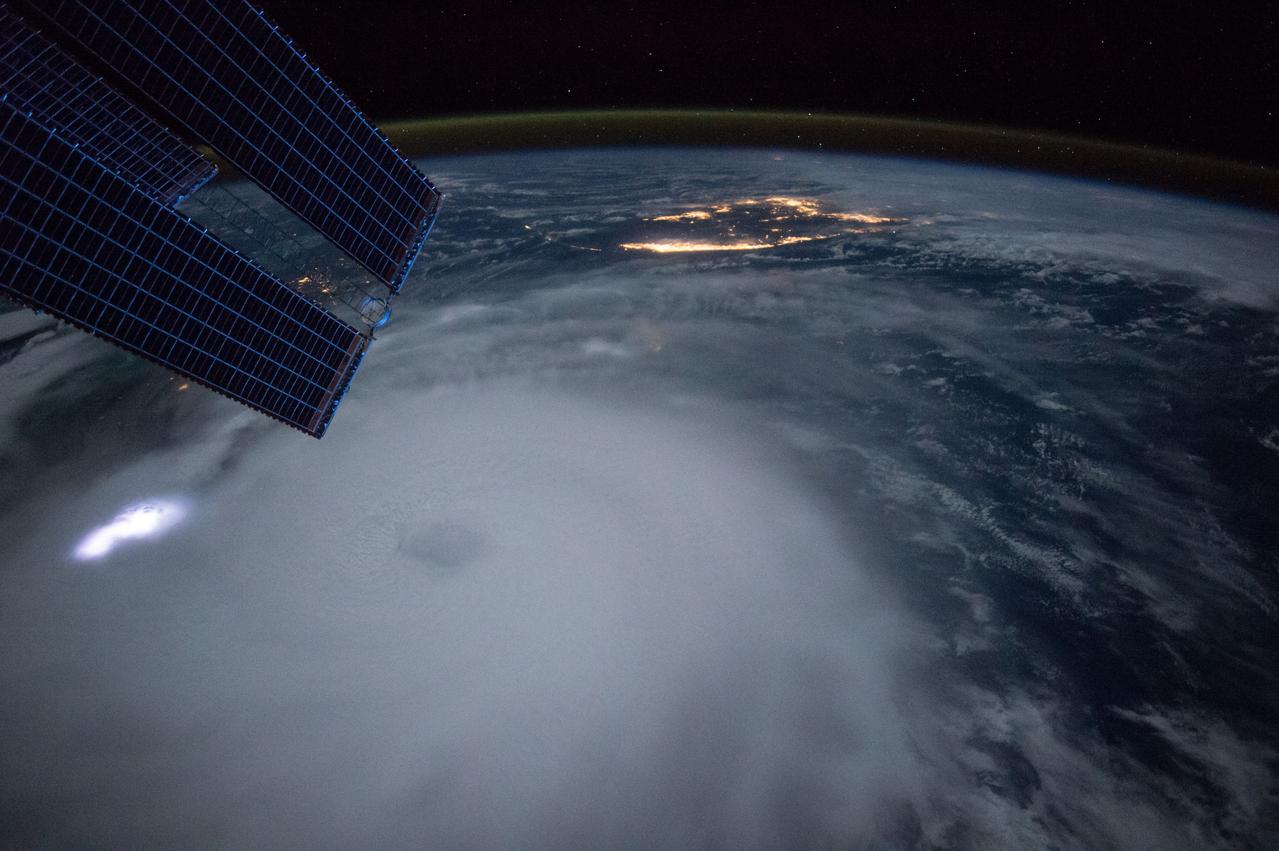
ISS045E037250 (10/02/2015) --- Hurricane Joaquin as seen from the International Space Station as it approached the Bahamas on Oct. 2, 2015. The intense storm was at Category 4 strength at the time the photo was taken.
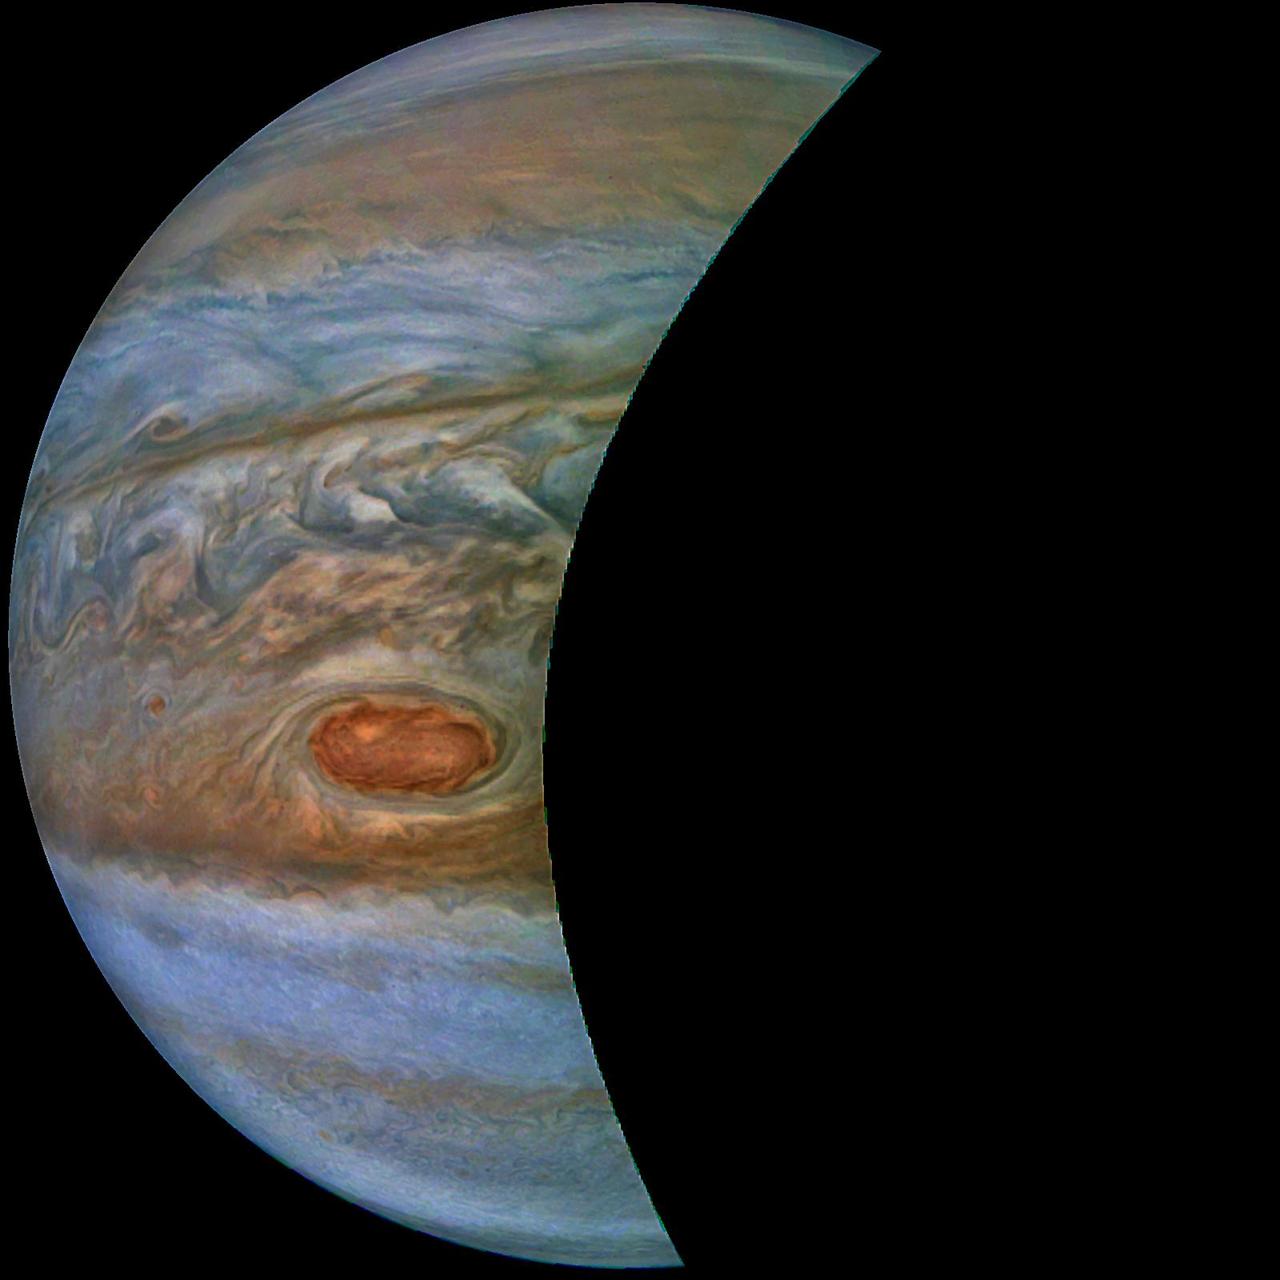
A "brown barge" in Jupiter's South Equatorial Belt is captured in this color-enhanced image from NASA's Juno spacecraft. This color-enhanced image was taken at 10:28 p.m. PDT on July 15, 2018 (1:28 a.m. EDT on July 16), as the spacecraft performed its 14th close flyby of Jupiter. Citizen scientist Joaquin Camarena created this image using data from the spacecraft's JunoCam imager. https://photojournal.jpl.nasa.gov/catalog/PIA22940. Enhanced image by Joaquin Camarena based on images provided courtesy of NASA/JPL-Caltech/SwRI/MSSS
iss073e0420567 (Aug. 3, 2025) --- California's San Francisco Bay Area surrounded by the cities of San Francisico, Oakland, and San Jose, is pictured from the International Space Station as it orbited 260 miles above the Golden State. At top, the sun's glint beams off the San Joaquin River in California's Central Valley.
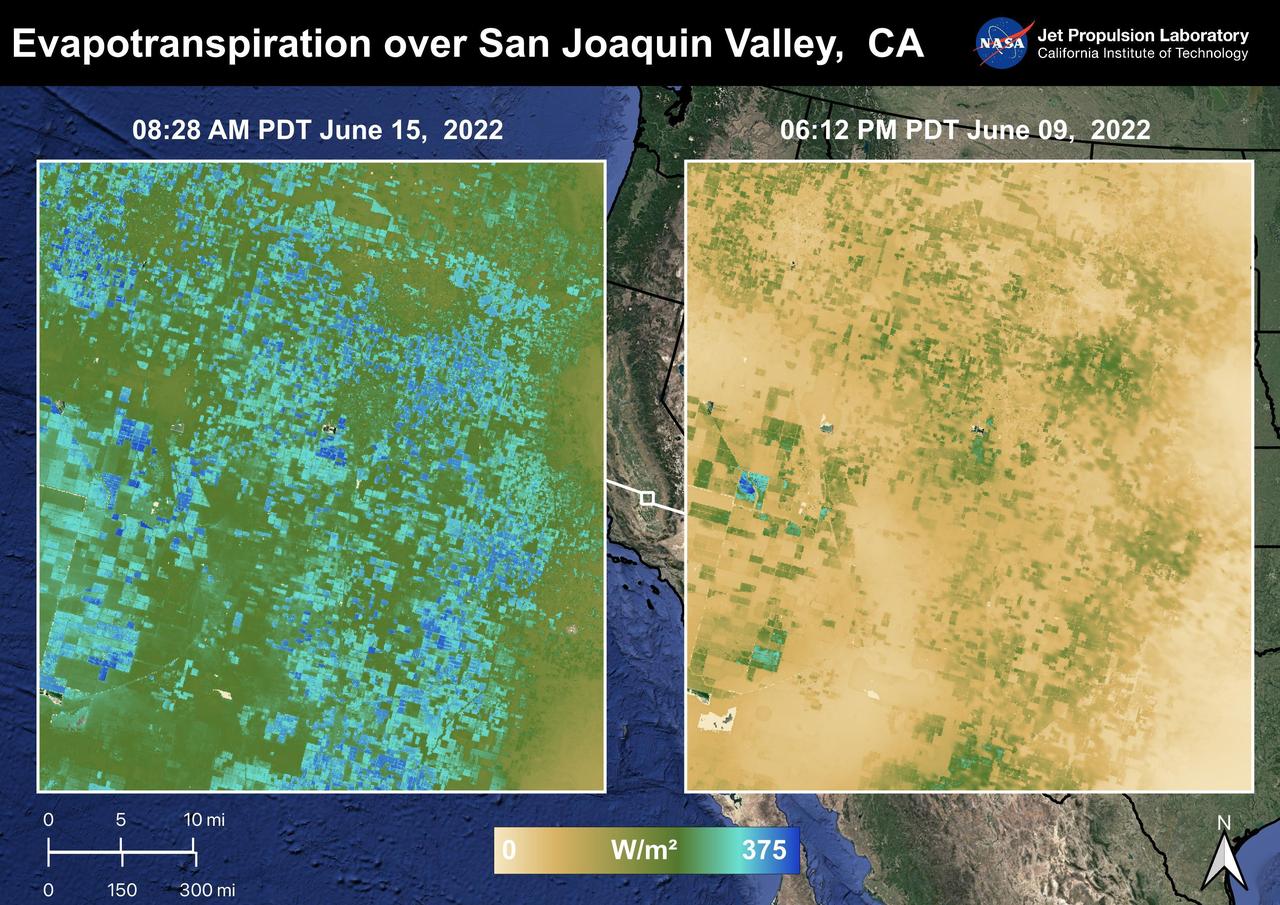
The Central Valley, CA is one of the most productive agricultural regions in the United States and the world. As California is in a continuing drought, it is important to monitor agricultural plant life to ensure maximized productivity. ECOSTRESS has the ability to monitor Evapotranspiration over agricultural fields. This Evapotranspiration image on the right was captured on June 09, 2022 at 06:12 PM PDT. The image on the left was captured by ECOSTRESS on June 15, 2022 at 08:27 AM PDT. Blue indicates high water use while brown indicates dry conditions. ECOSTRESS is a thermal instrument on the International Space Station that measures the temperature of the ground, which is hotter than the air temperature during the day. It was launched to the space station in 2018. Its primary mission is to identify critical thresholds of water use and water stress in plants and to detect the timing, location, and predictive factors leading to plant water uptake decline and/or cessation. The nature of the high-resolution data provided by ECOSTRESS allows it to record heat related phenomena such as heat waves and wildfires. https://photojournal.jpl.nasa.gov/catalog/PIA25486
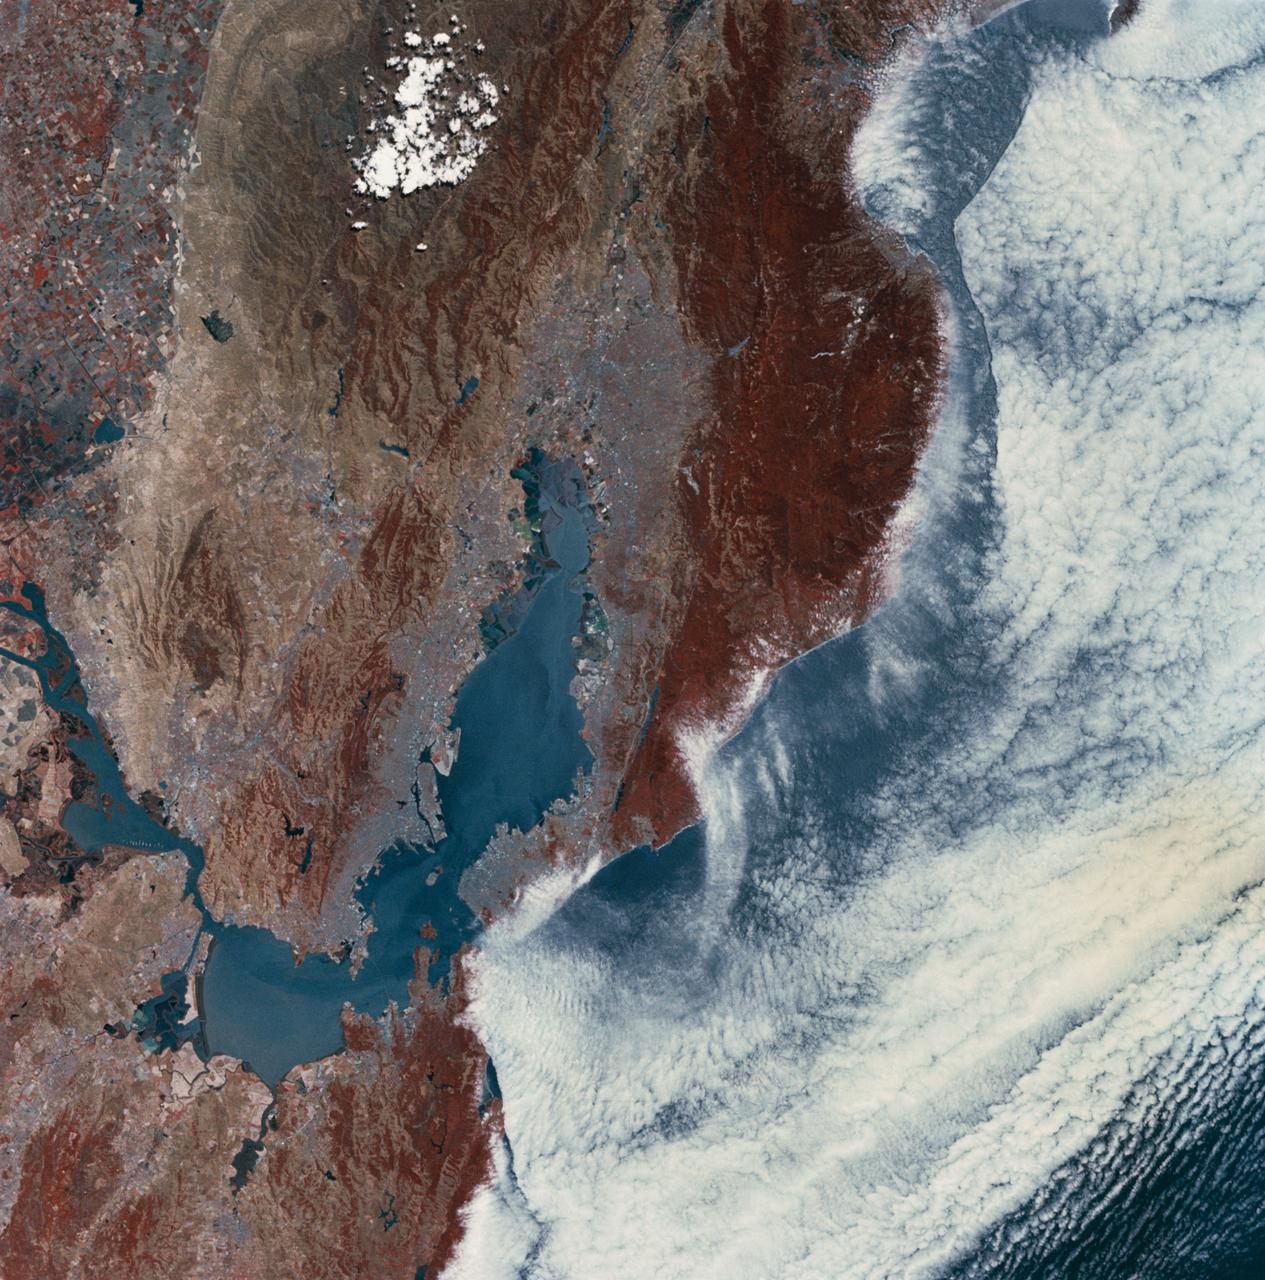
SL4-138-3843 (1 Jan. 1974) --- A part of northern California centered near San Francisco Bay photographed at 3 p.m. Jan. 2, 1974, from the Skylab space station in Earth orbit. This near vertical view encompasses the coastline from Monterey Bay (right) to about 50 miles north of Point Reyes (left) and includes, from bottom to top, San Francisco Bay (center), Sacramento Valley (left center), San Joaquin Valley (right center), and the snow-covered Sierra Nevada. Afternoon shadows sharply delineate a valley which parallels San Francisco Bay, crosses Point Reyes, and lies between the Bay and the Pacific coastline. This valley marks the location of the San Andreas Fault, a major break in the Earth's crust. Forces acting on the crust are causing the land west (bottom) of the fault line to move north relative to land on the east side. The Skylab 4 astronauts photographed major fault zones in South America, New Zealand, Japan and Africa for use in the study of worldwide tectonic system. Agricultural areas in the Sacramento and San Joaquin Valleys are indicated by the tan areas which are easily discerned in contrast to the green-gray background. Photo credit: NASA
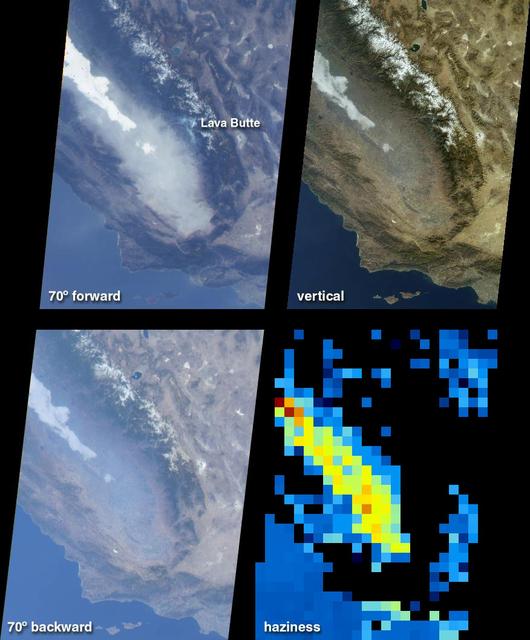
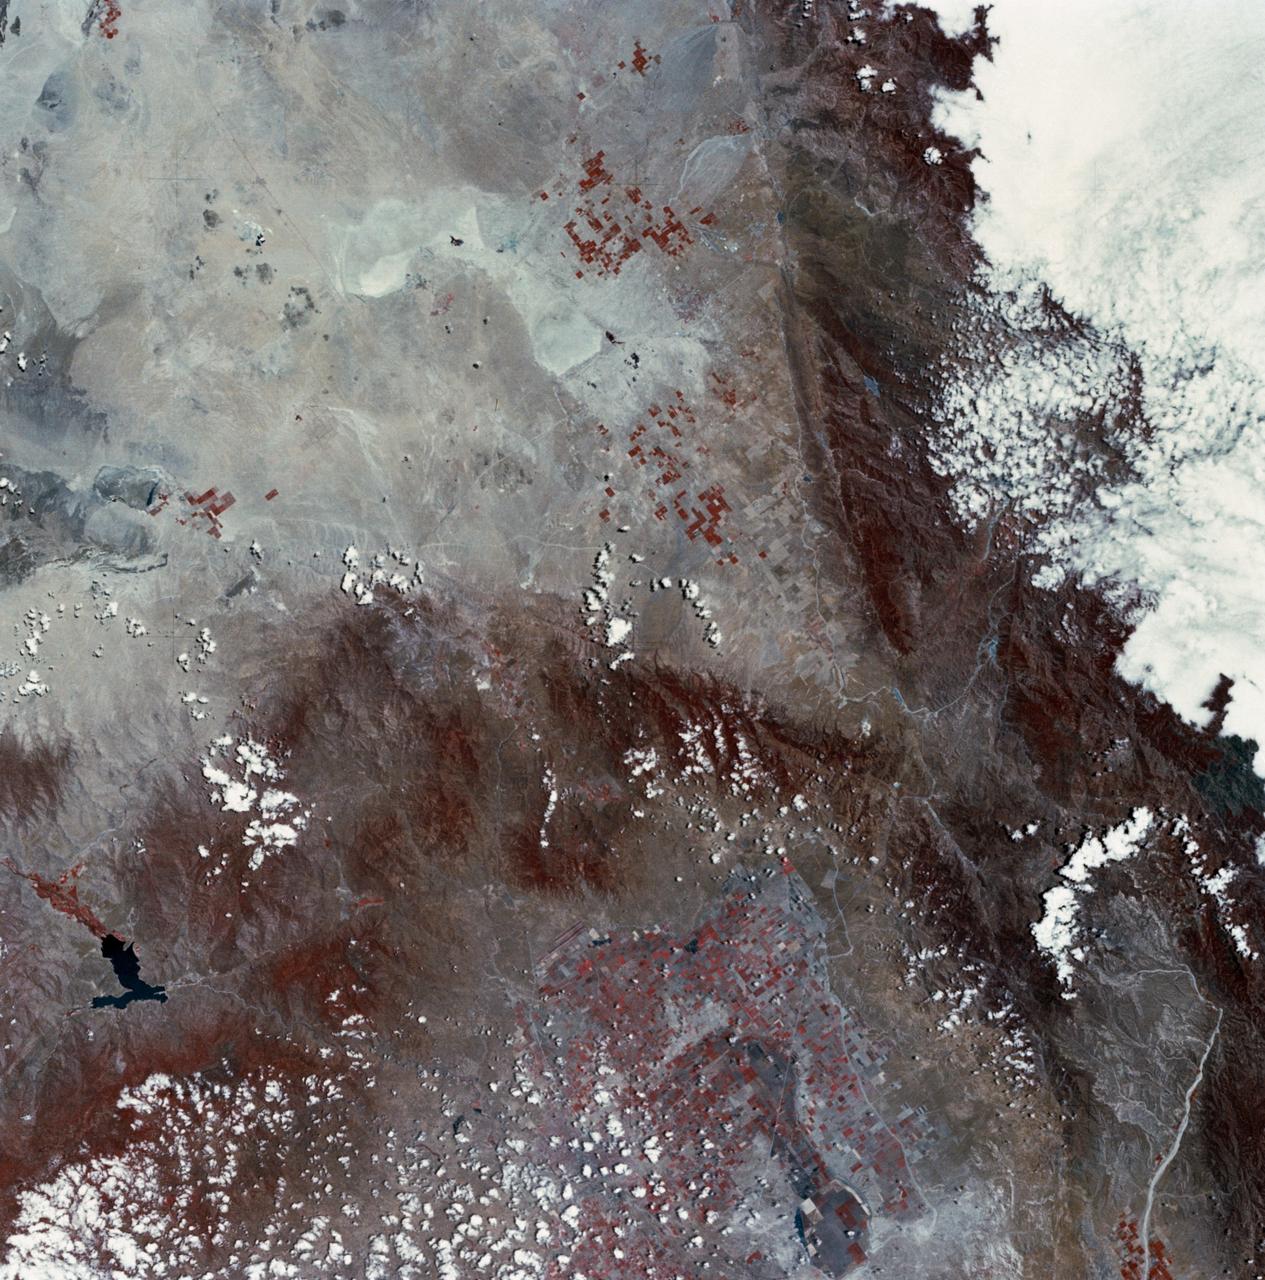
This illustration features images of southern California and southwestern Nevada acquired by NASA Terra satellite on January 3, 2001 Terra orbit 5569.
This view of southern California as seen from the Apollo 7 spacecraft during its 18th revolution of the earth. Photographed from an altitude of 124 nautical miles. The coast of California can be seen from Point Mugu southward to Oceanside. Santa Catalina can be seen below the off shore clouds. Details of the Los Angeles area are obscured by pollution which extends from Banning westard for 100 miles to beyond Malibu. In the upper portion of the photograph can be seen (left to right) the San Joaquin Valley beyond Bakersfield, the Techachapi Mountains, the Sierra Nevada, Owens Valley, Death Valley and the Mojave Desert.
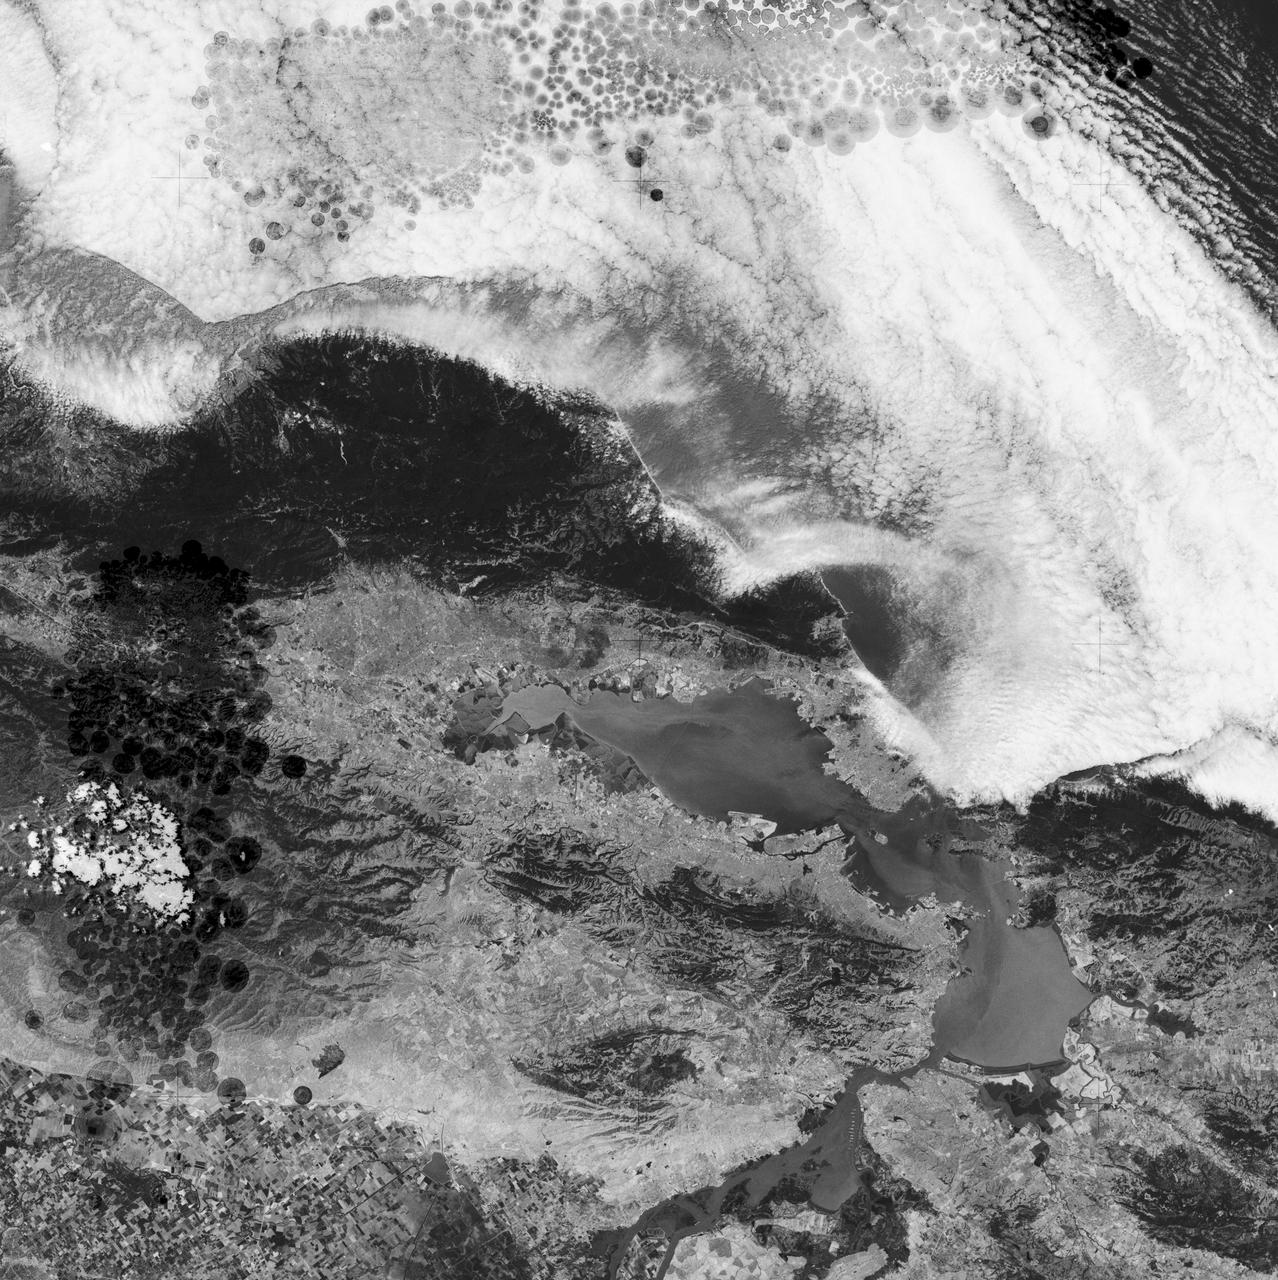
SL2-05-102 (June 1973) --- A black and white photograph of the San Francisco Bay California area, taken from the Skylab 1-2 space station cluster in Earth orbit. THE PICTURE SHOULD BE HELD WITH THE CLOUDS AND PACIFIC OCEAN ON THE LEFT. This photograph was taken by one of six lenses of the Itek-furnished S190-A Multispectral Photographic Facility Experiment in the Multiple Docking Adapter of the space station. Note the thickly populated and highly developed area around the Bay. Among the cities visible in this photograph are San Francisco, Oakland, Berkeley and San Jose. This view extends eastward to show a portion of the San Joaquin Valley. The S190-A experiment is part of the Skylab Earth Resources Experiments Package (EREP). Type SO-022 film was used. This station covered the spectral region from 0.6 to .07 micrometers. Photo credit: NASA
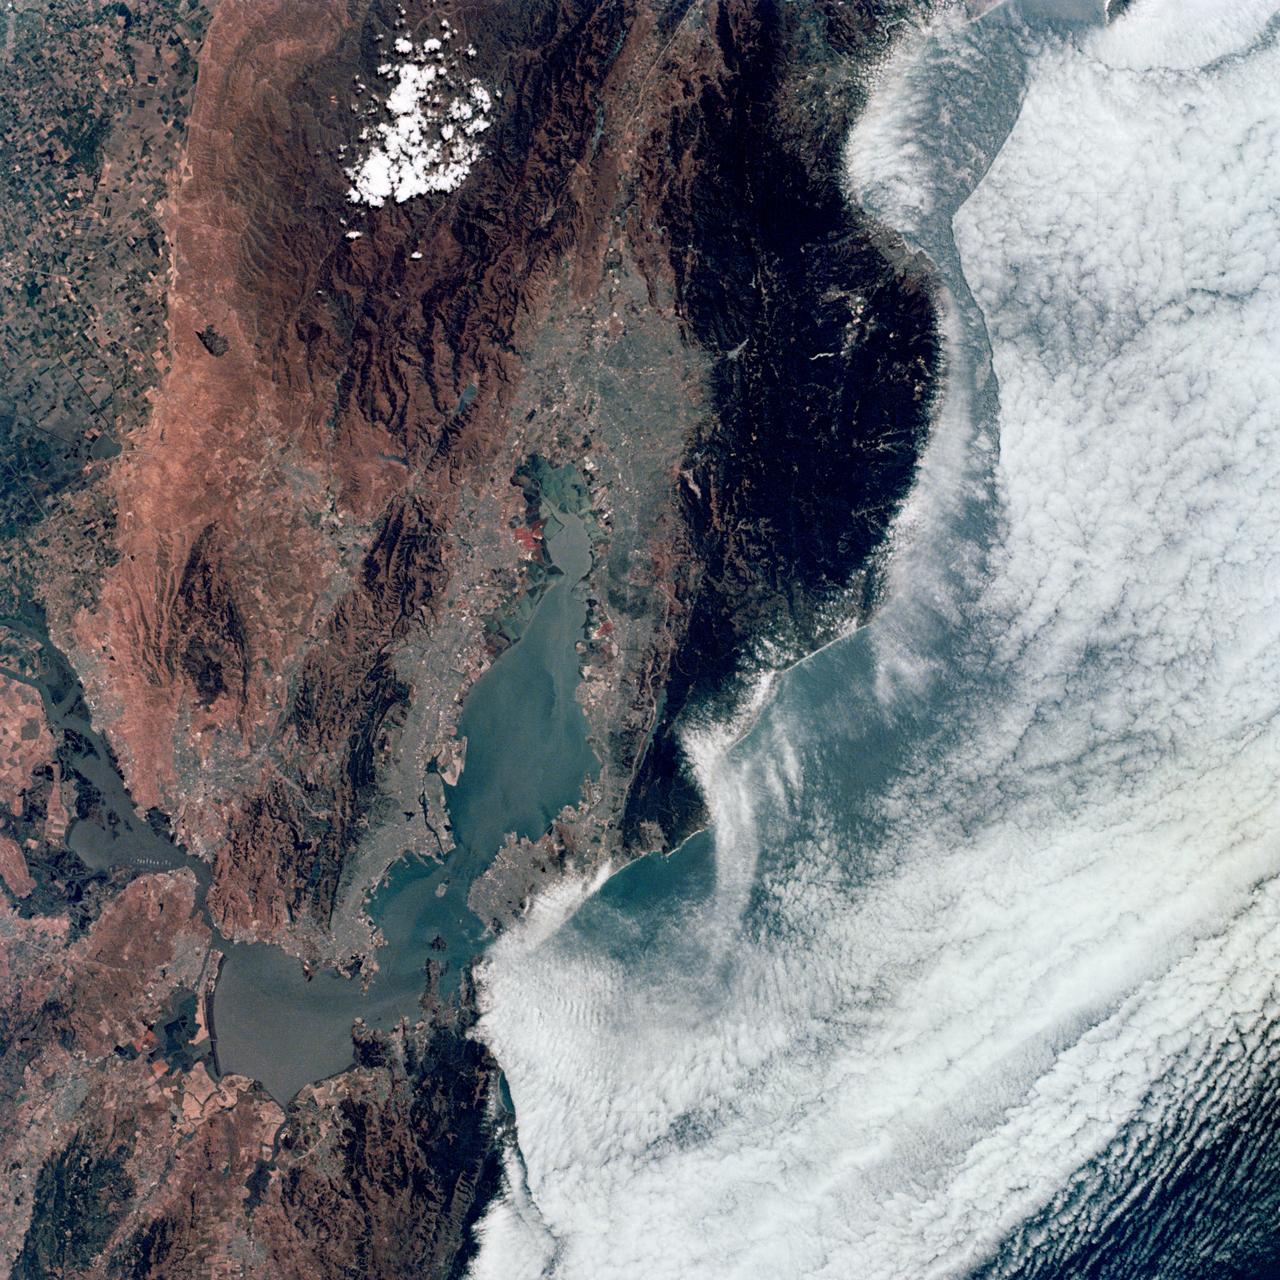
SL2-04-118 (June 1973) --- A color photograph of the San Francisco Bay, California area, taken from the Skylab space station in Earth orbit. (The picture should be held with the clouds and Pacific Ocean on the left.) Note the thickly populated and highly developed area around the bay. Among the cities visible are San Francisco, Oakland, Berkeley and San Jose. This view extends eastward to show a portion of the San Joaquin Valley. This photograph was taken by one of the six lenses of the Itek-furnished S190-A Multispectral Photographic Facility Experiment in the Multiple Docking Adapter of the space station. Type SO-356 film was used. The S190-A experiment is part of the Skylab Earth Resources Experiments Package (EREP). Photo credit: NASA
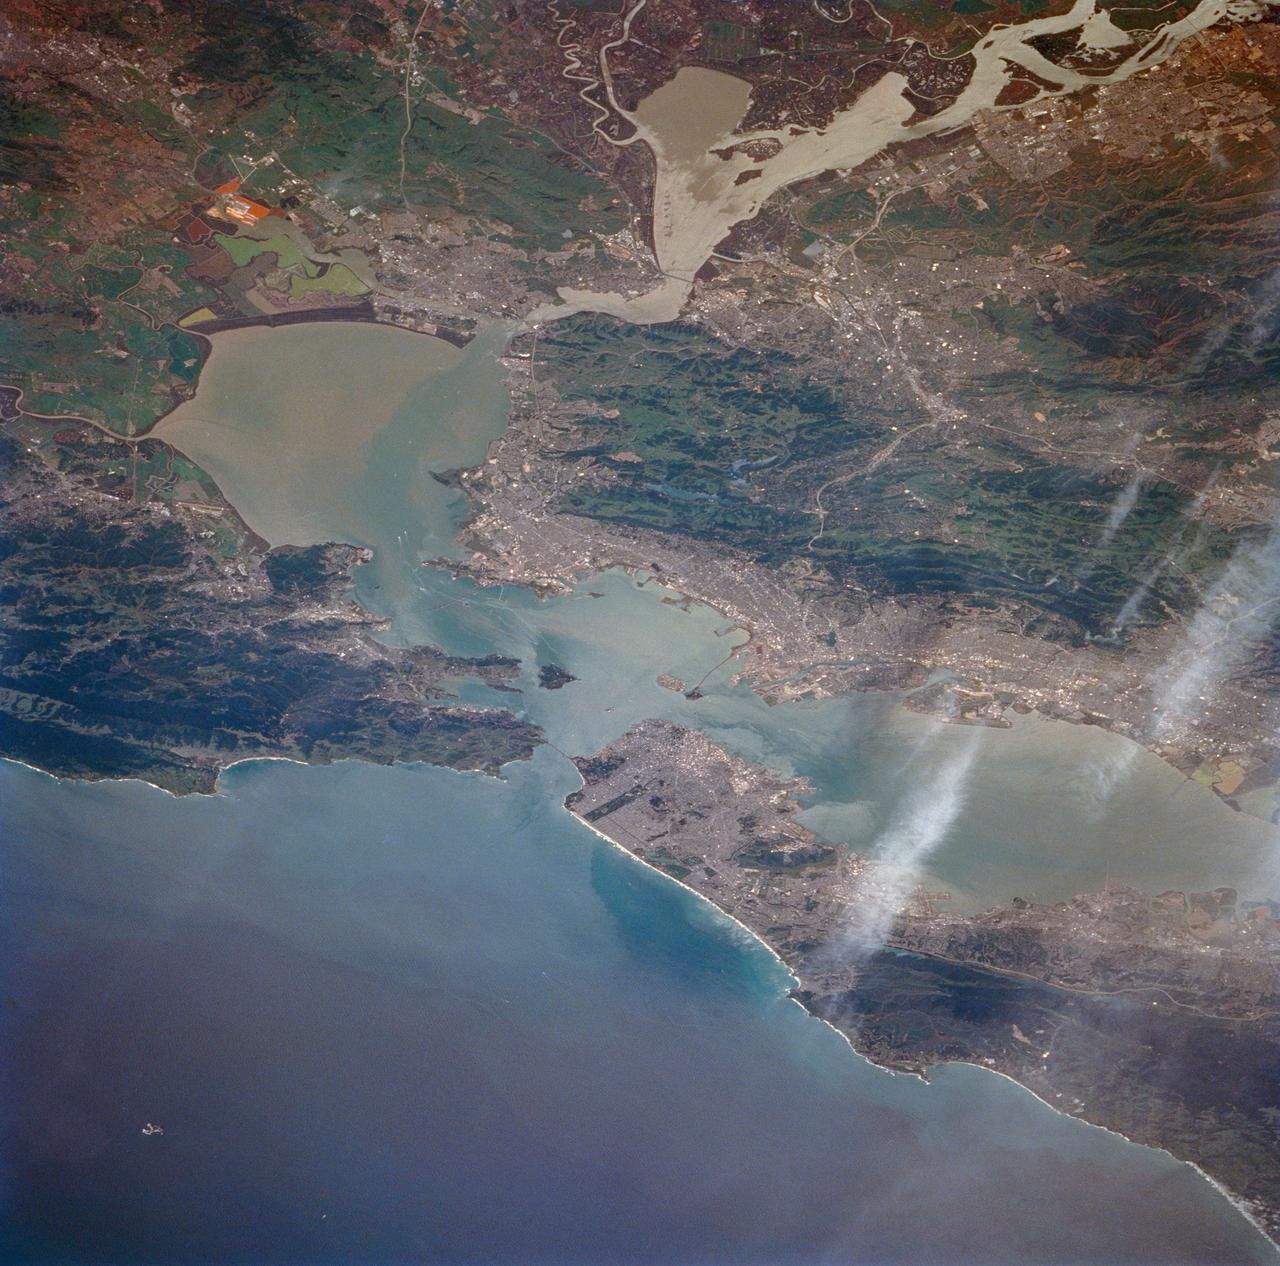
STS059-213-009 (9-20 April 1994) --- San Francisco Bay. Orient with the sea up. The delta of the combined Sacramento and San Joaquin Rivers occupies the foreground, San Francisco Bay the middle distance, and the Pacific Ocean the rest. Variations in water color caused both by sediment load and by wind streaking strike the eye. Man-made features dominate this scene. The Lafayette/Concord complex is left of the bay head, Vallejo is to the right, the Berkeley/Oakland complex rims the shoreline of the main bay, and San Francisco fills the peninsula beyond. Salt-evaporation ponds contain differently-colored algae depending on salinity. The low altitude (less than 120 nautical miles) and unusually-clear air combine to provide unusually-strong green colors in this Spring scene. Hasselblad camera.
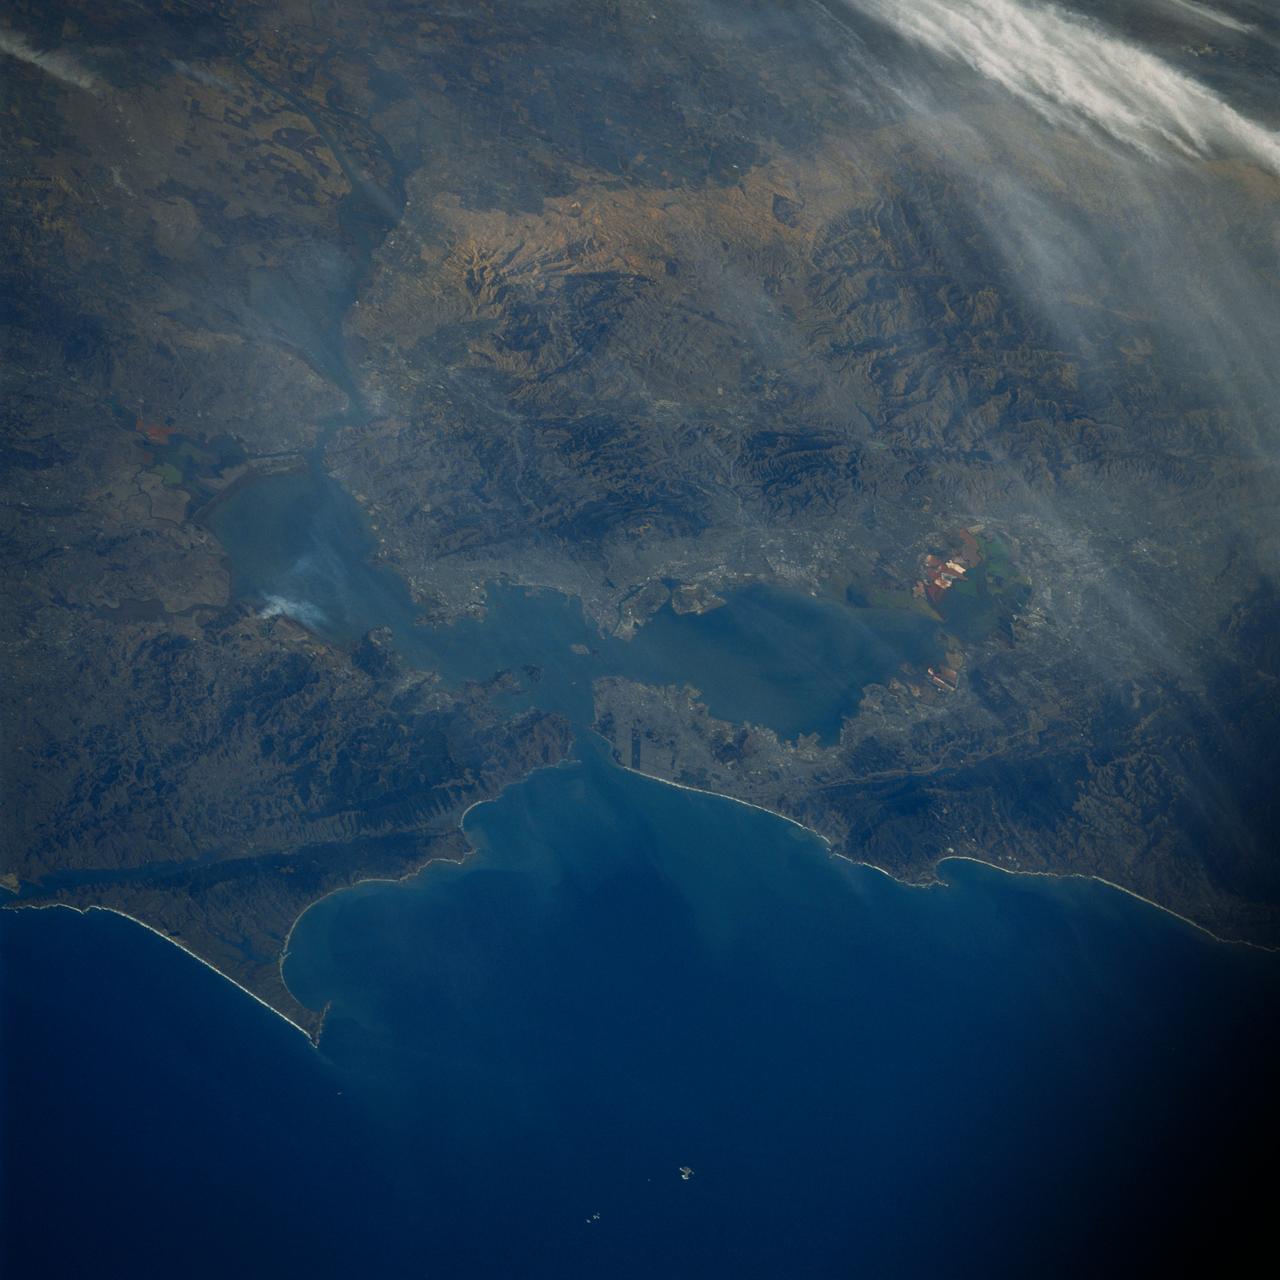
61A-51-045 (31 Oct 1985) --- San Francisco Bay and the San Andreas fault line stand out in this 70mm frame exposed from the Earth-orbiting Space Shuttle Challenger on October 31, 1985. The California coastline extends from Tomales Bay on the north almost to Santa Cruz (just out of frame) on the south. Parts of the Sacramento and San Joaquin valleys are seen along the frame's right edge. Some of the bay's salt evaporators are recognizable by their unique hews, near Fremont and near Vallejo. Center point coordinates are located at 37.5 degrees north latitude and 122.5 degrees west longitude. The Challenger was 180 nautical miles directly above a point centered at 38.8 degrees north latitude and 126.5 degrees west longitude.
SL2-03-118 (June 1973) --- An infrared photograph of the San Francisco Bay, California area, taken from the Skylab 1/2 space station in Earth orbit. THE PICTURE SHOULD BE HELD WITH THE CLOUDS AND PACIFIC OCEAN ON THE LEFT. This photograph was taken by one of the six lenses of the Itek-furnished S190-A Multispectral Photographic Facility Experiment in the Multiple Docking Adapter of the space station. Type 2443 film was used. Note the thickly populated and highly developed area around the bay. Among the cities visible in this photograph are San Francisco, Oakland, Berkeley and San Jose. This view extends eastward to show a portion of the San Joaquin Valley. The S190-A experiment is part of the Skylab Earth Resources Experiment Package (EREP). Photo credit: NASA
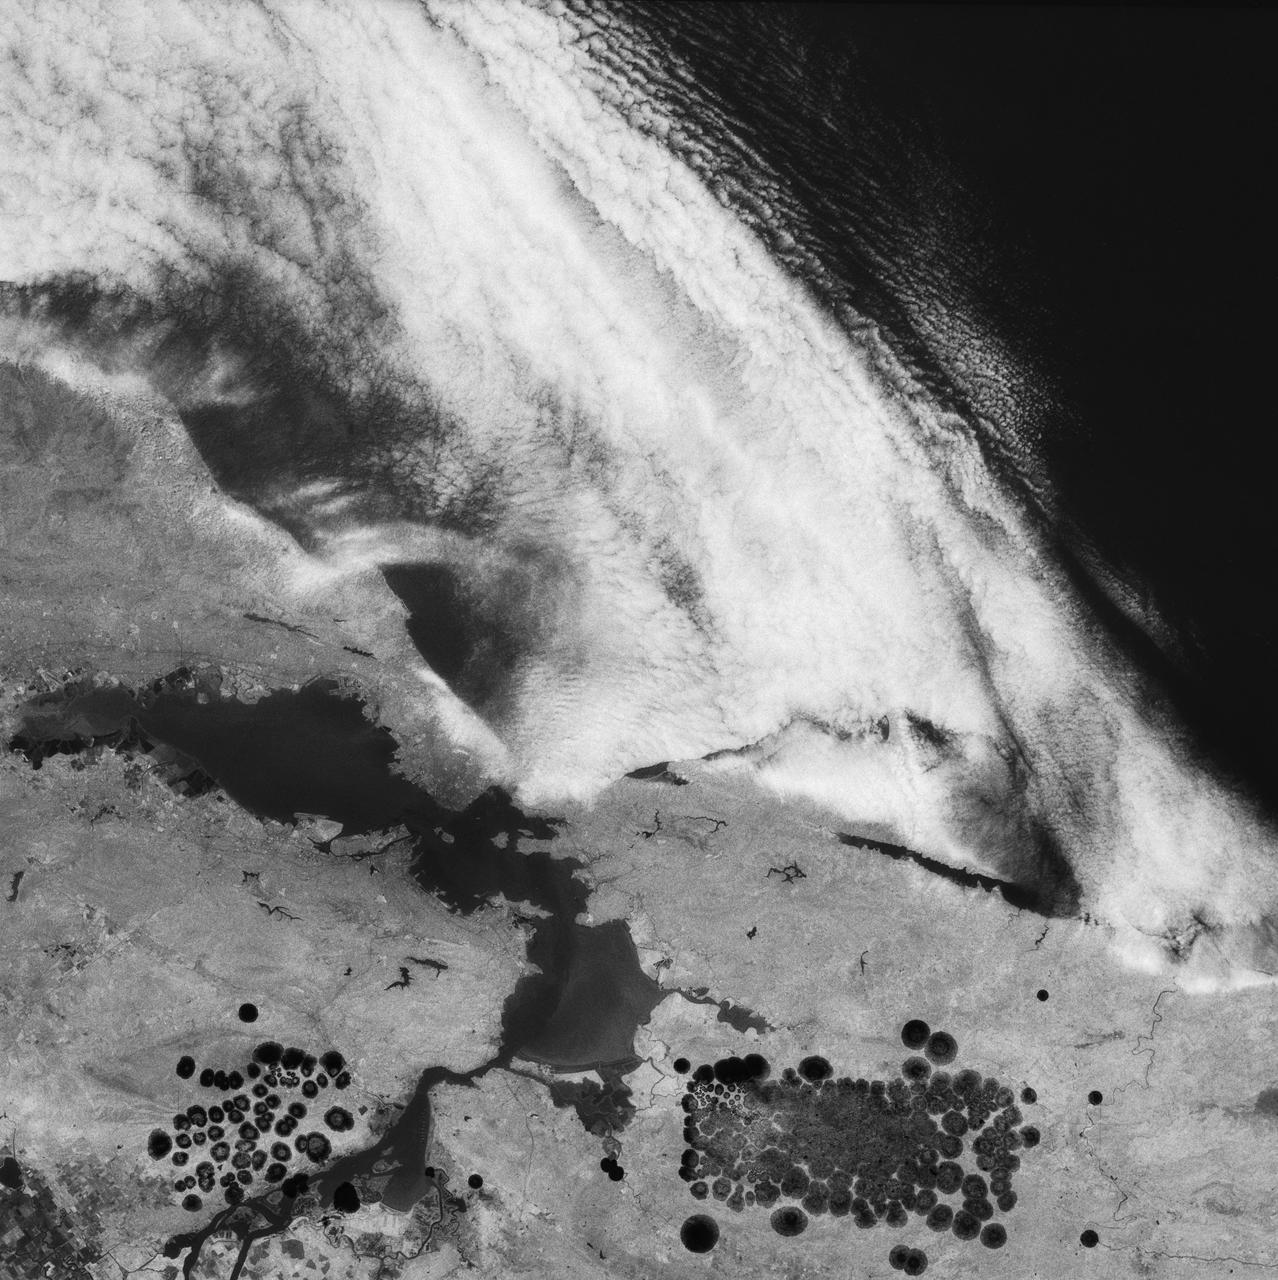
SL2-06-102 (June 1973) --- A black and white photograph of the San Francisco Bay California area, taken from the Skylab 1-2 space station cluster in Earth orbit. THE PICTURE SHOULD BE HELD WITH THE CLOUDS AND PACIFIC OCEAN ON THE LEFT. This photograph was taken by one of six lenses of the Itek-furnished S190-A Multispectral Photographic Facility Experiment in the Multiple Docking Adapter of the space station. Note the thickly populated and highly developed area around the Bay. Among the cities visible in this photograph are San Francisco, Oakland, Berkeley and San Jose. This view extends eastward to show a portion of the San Joaquin Valley. The S190-A experiment is part of the Skylab Earth Resources Experiments Package (EREP). Type SO-022 film was used. This station covered the spectral region from 0.5 to 0.6 micrometers. Photo credit: NASA
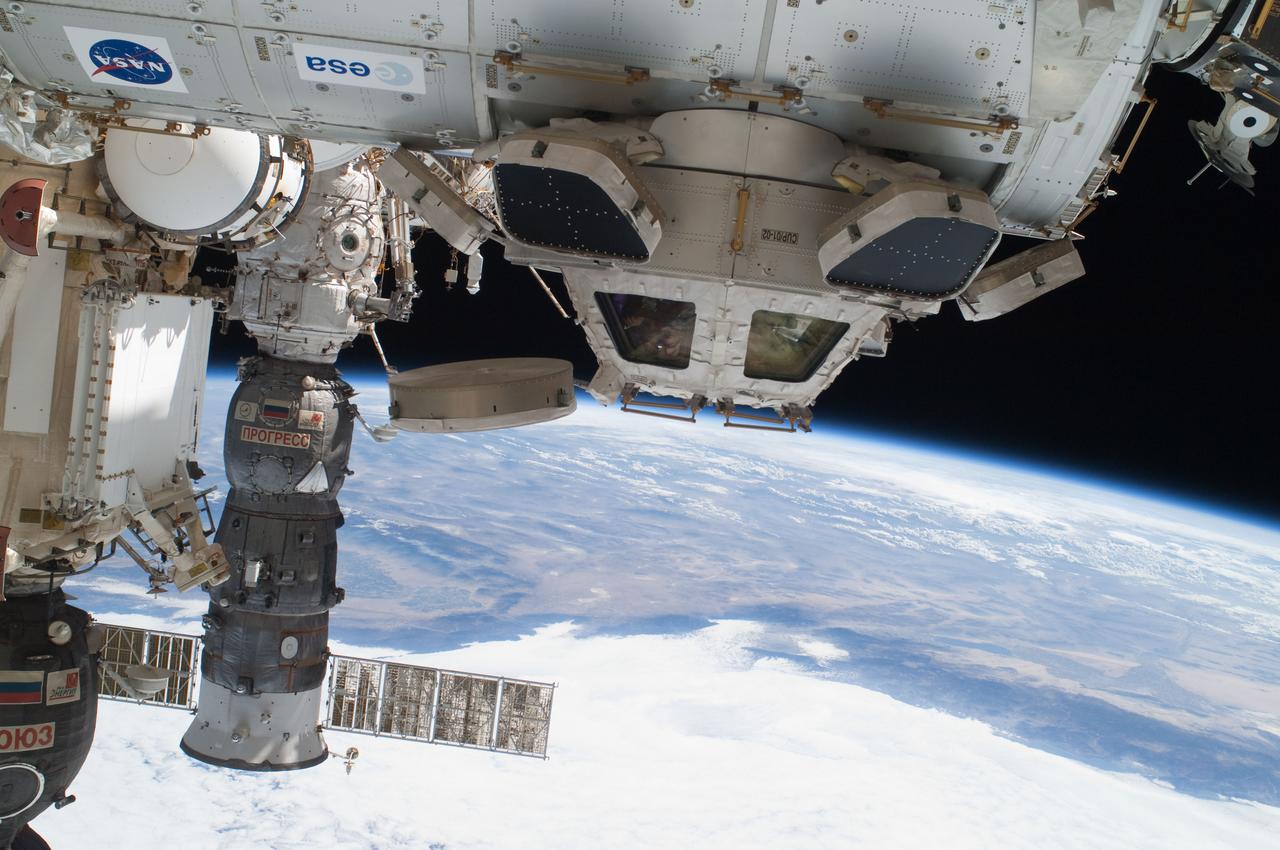
ISS028-E-016225 (12 July 2011) --- Components of the International Space Station, though moving along at 17,500 miles per hour, appear to hover above the Pacific Ocean just off the California coast. Ten cosmonauts and astronauts were working together when this photo was taken -- four of them as STS-135 visitors from the docked space shuttle Atlantis and six as members of the Expedition 28 crew. The Cupola, near center of frame, is attached to Node 3 or Tranquility. A Russian Soyuz and a Russian Progress spacecraft are parked at the station, left side of frame. While much of the coast is obscured by clouds, just inland from left to right, one can see the agriculture of the San Joaquin Valley, the southern Sierra Nevada, the Los Angeles Basin (center), the Mojave Desert, coastal mountains of southern California, the Salton Sea, the Imperial Valley, and the mouth of the Colorado River on the extreme right edge.
STS068-267-097 (30 September-11 October 1994) --- An extensive view eastward from the irrigated San Joaquin Valley in the foreground, across the Sierra Nevada (living up to its name in early October), into the desert of eastern California and Nevada (which has no snow, despite the name). Mono Lake is just visible at the left edge of the frame; Owens Valley extends southward to Owens Lake, the next valley is Panamint Valley, and then Death Valley. Las Vegas and Lake Mead are visible at the upper right of the frame. The Space Radar Laboratory 2 (SRL-2) obtained extensive, multiple-pass data from many test sites within the region displayed, including Mammoth Mountain ski area south of Mono Lake, and in Death Valley.
SL2-03-126 (June 1973) --- A color infrared photograph of the Los Angeles County and Kern County area, taken from the Skylab space station in Earth orbit during its first manned Skylab mission. The Mojave Desert occupies the northeast one-fourth of the photograph. Lake Isabella in the Sierra Nevada Mountains is the v-shaped body of water. The San Gabriel Mountains extend across the southern part of the picture. At lower center is the intersection of the San Andreas and Garlock faults. The San Joaquin Valley is in the center at the left edge. (The picture should be held with the heavy cloud cover at lower right corner so that north will be at top.) This picture was exposed by one of the six lenses of the Itek-furnished S190-A Multispectral Photographic Facility experiment in the Multiple Docking Adapter of the Skylab space station. Type 2443 film was used. Photo credit: NASA
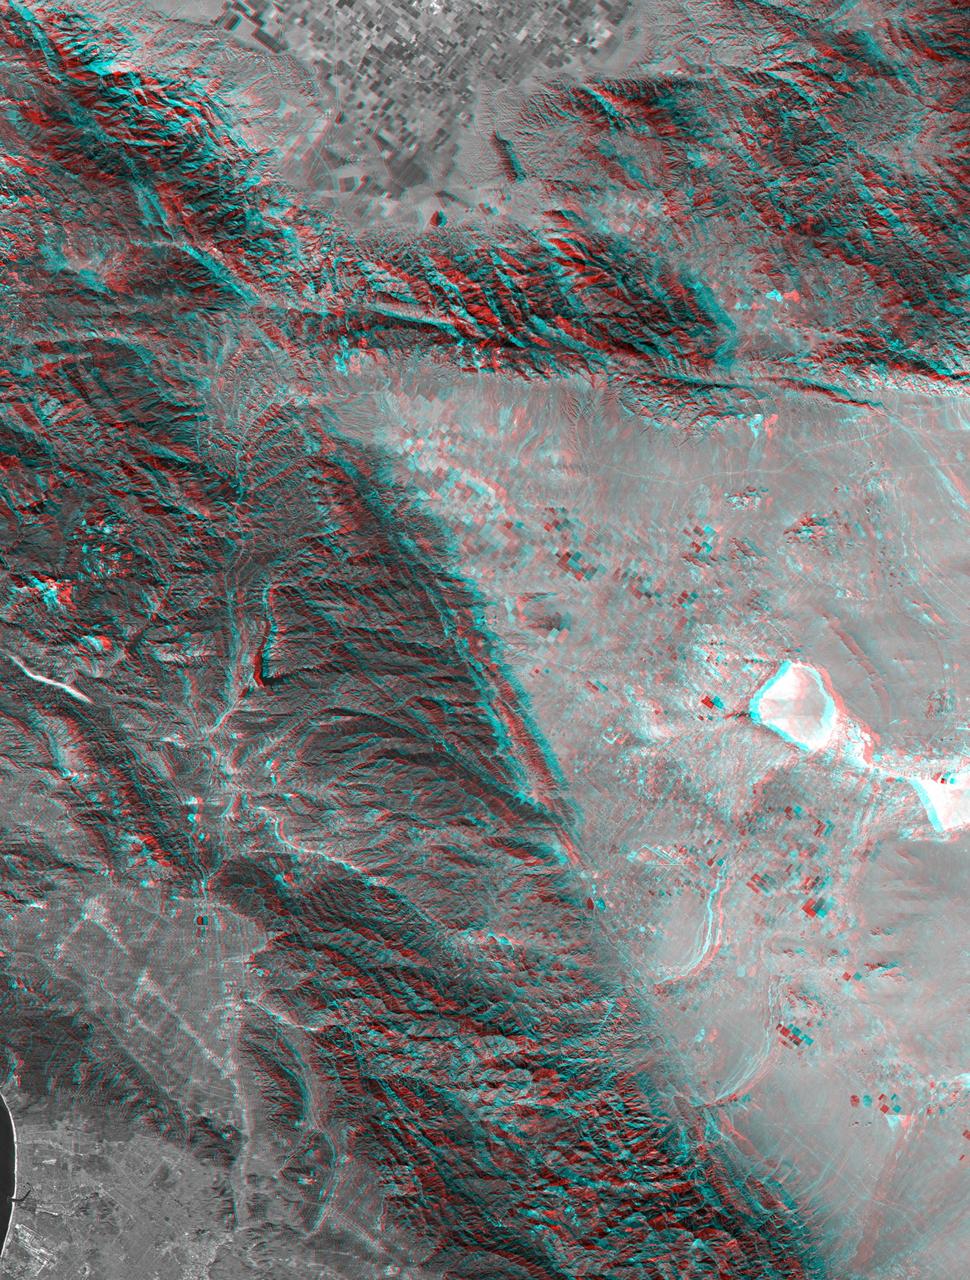
This anaglyph, from NASA Shuttle Radar Topography Mission, shows rugged terrain between Los Angeles and California central valley. 3D glasses are necessary to view this image.

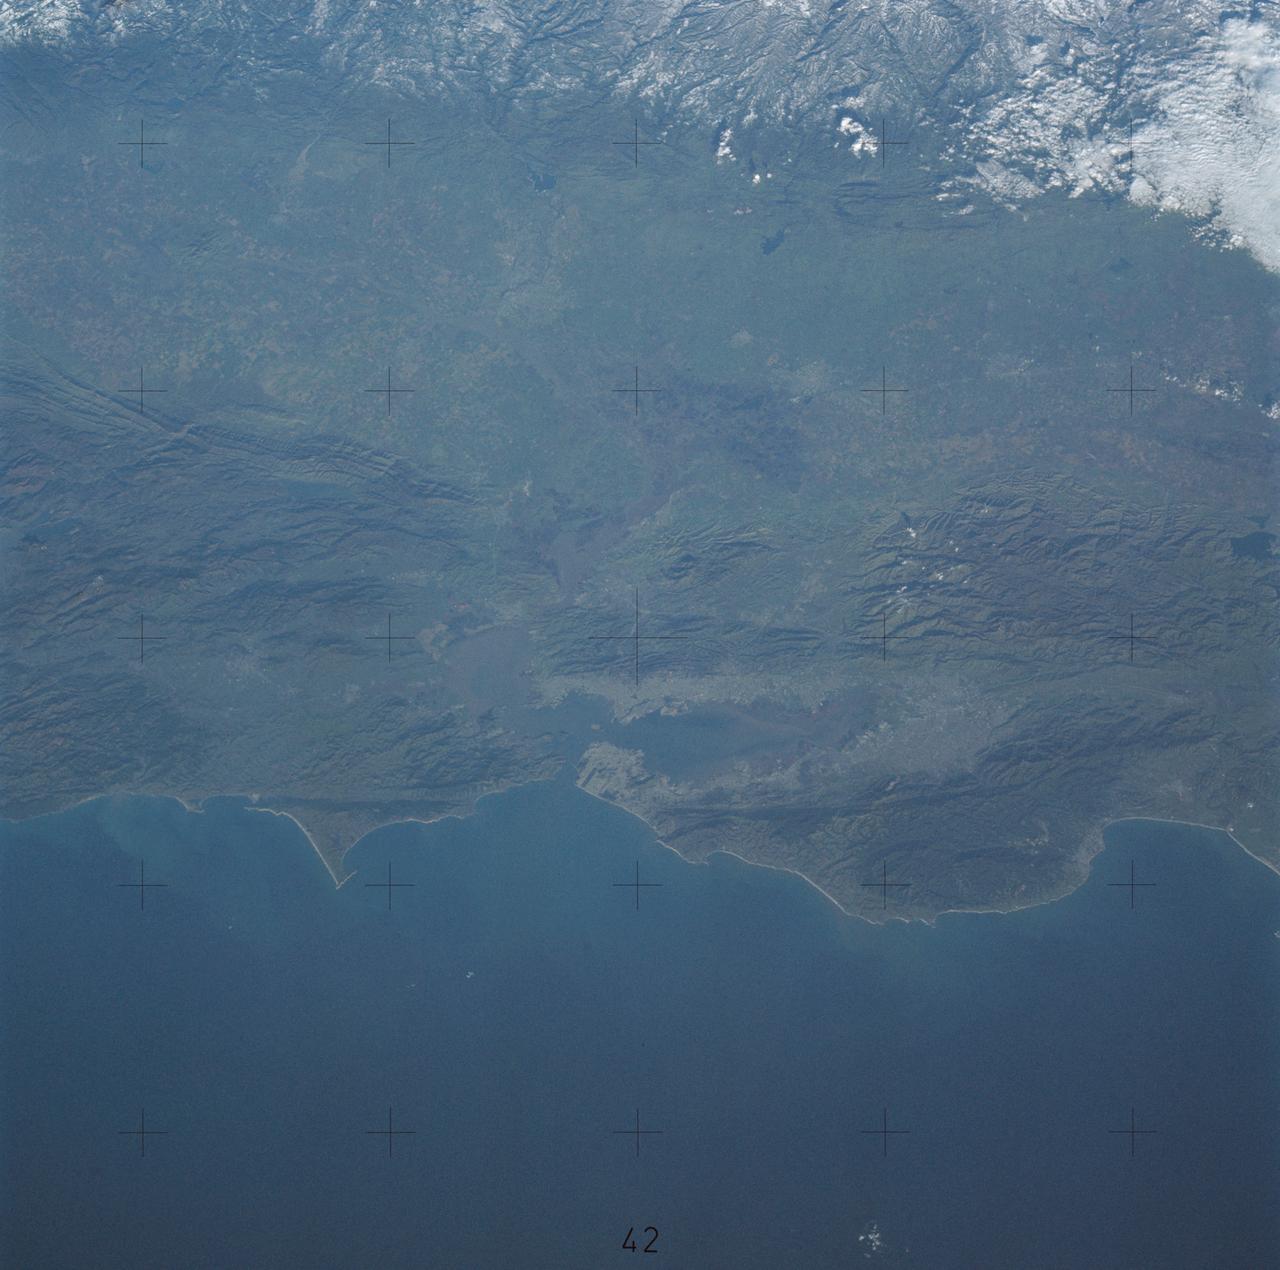
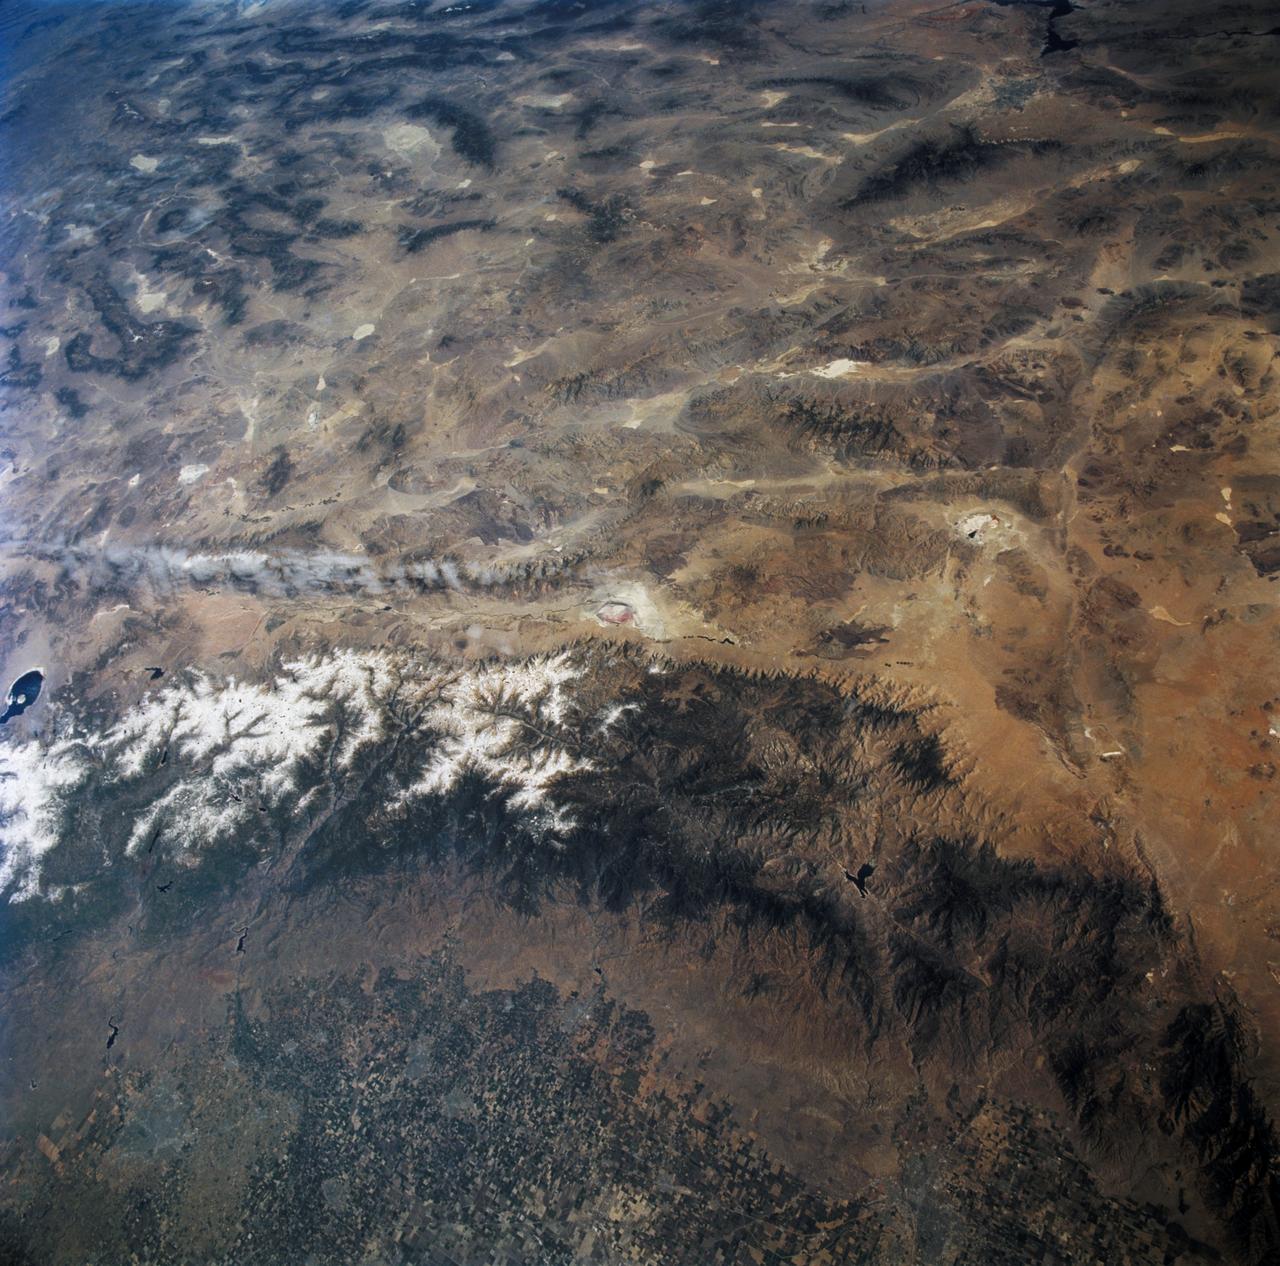
STS098-714A-020 (7-20 February 2001) ---One of the STS-98 astronauts aboard the Earth-orbiting Space Shuttle Atlantis used a 70mm handheld camera to record this image of Southern California. Snow blanketing the higher elevations in the Los Padres National Forest (center of the image) and that covering the Angeles National Forest (right middle) help to accentuate and separate three major landform regions in southern California. The northern Los Angeles Basin that includes the San Fernando Valley and the Santa Monica Mountains is visible in the lower right quadrant of the image. The western end of the Mojave Desert (upper right) shows the two distinctive mountain boundaries along the southwest and northwest edge of the desert. The San Andreas Fault and the Garlock Fault converge (snow covered in this scene) at the western end of the desert. The intensively irrigated and cultivated southern end of the San Joaquin Valley that includes Bakersfield is visible (upper left) north of the snow-covered, northeast-southwest trending Tehachapi Mountains. The island off of the California coast (bottom left) is Santa Cruz Island.
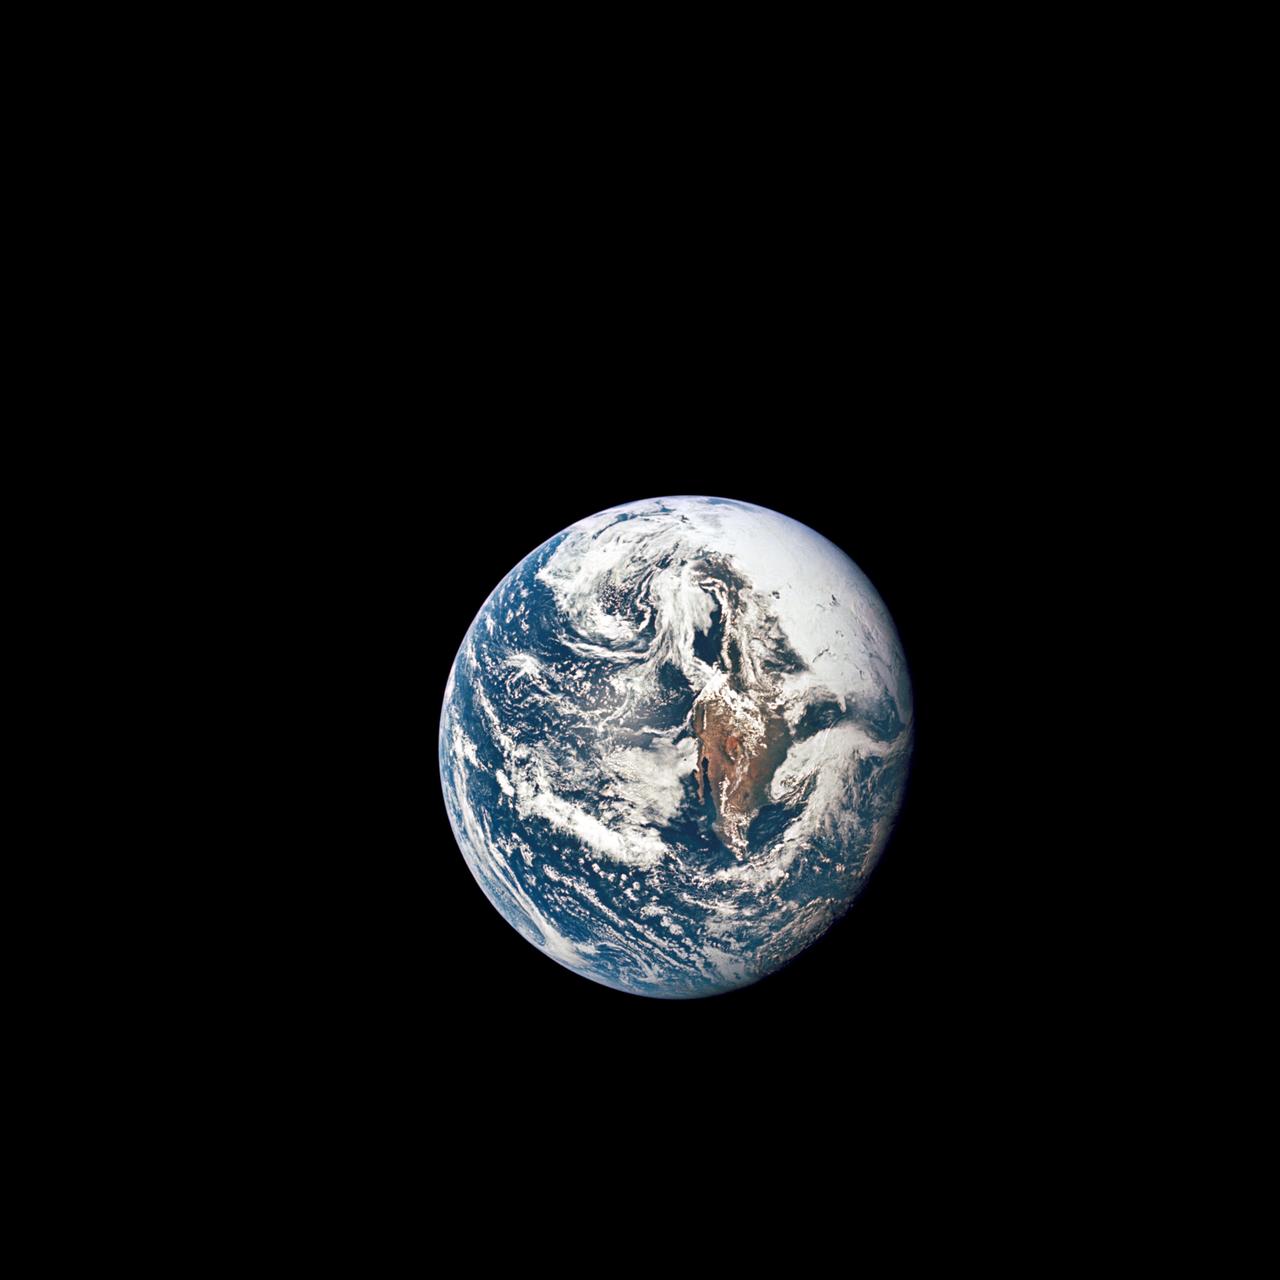
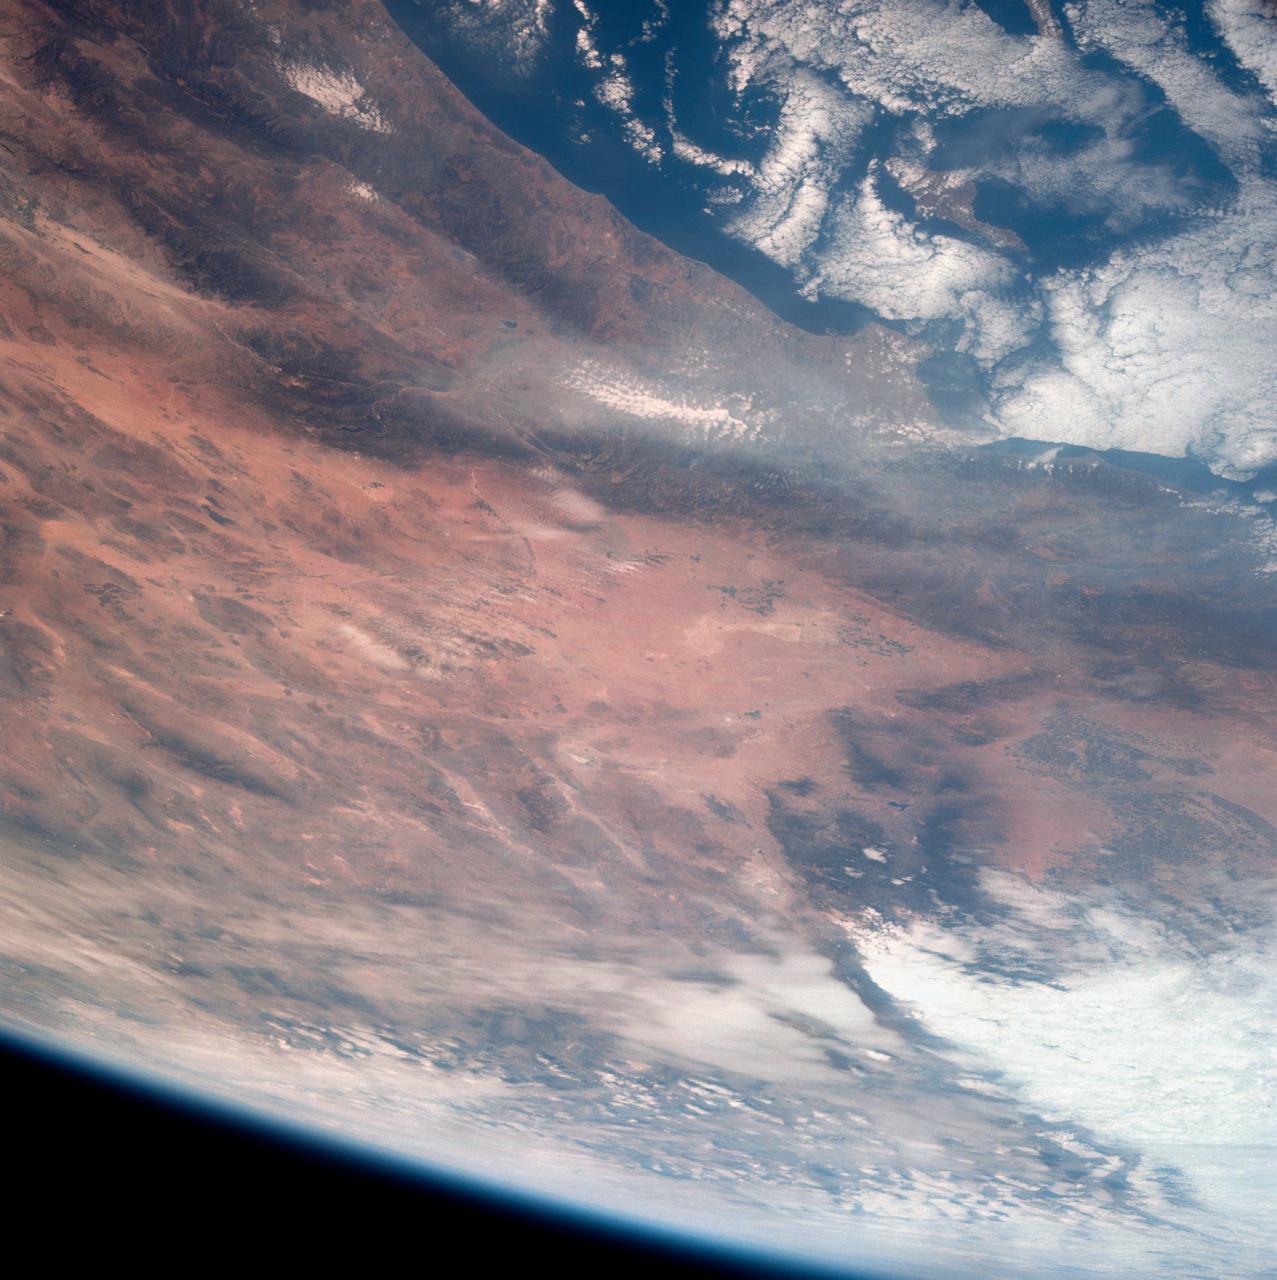
AS10-34-5013 (18 May 1969) --- A view of Earth from 36,000 nautical miles away as photographed from the Apollo 10 spacecraft during its trans-lunar journey toward the moon. While the Yucatan Peninsula is obscured by clouds, nearly all of Mexico north of the Isthmus of Tehuantepec can be clearly delineated. The Gulf of California and Baja California and the San Joaquin Valley can be easily identified. Also, the delta of the Rio Grande River and the Texas coast are visible. Note the color differences (greens - east, browns - west) along the 100 degrees meridian. The crew members on Apollo 10 are astronauts Thomas P. Stafford, commander; John W. Young, command module pilot; and Eugene E. Cernan, lunar module pilot. Astronaut Young remained in lunar orbit, in the Command and Service Modules (CSM) "Charlie Brown", while astronauts Stafford and Cernan descended to within nine miles of the lunar surface, in the Lunar Module (LM) "Snoopy".
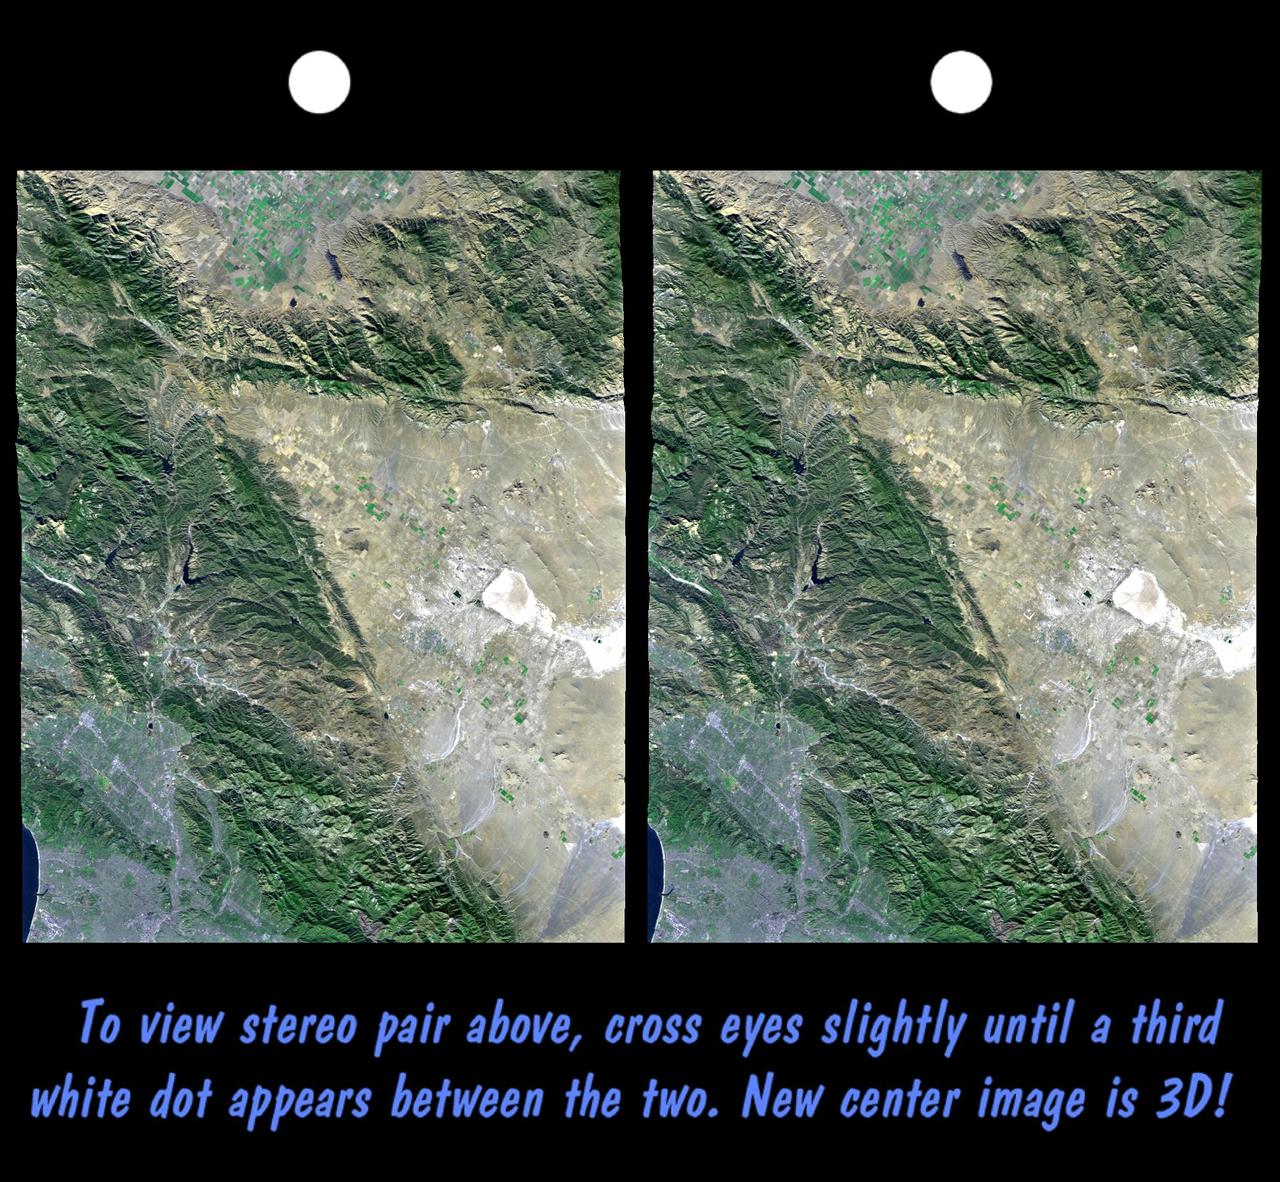
California topography poses challenges for road builders. Northwest of Los Angeles, deformation of Earth crust along the Pacific-North American crustal plate boundary has made transportation difficult.
STS058-72-004 (18 Oct-1 Nov 1993) --- The Sierra Nevada Mountain Range can be seen in this north-looking high oblique view taken in October, 1993, by the STS-58 crew. Visible in the view to the west of the Sierra Nevada are the San Joaquin and Sacramento Valleys of central California. The San Francisco/Oakland Bay Area can be seen to the west of the valley at the extreme left of the photograph. To the east or right of the Sierra Nevada, the basin and Range Region of central and northern Nevada is visible. Mono Lake, Lake Tahoe and Pyramid Lake are also visible in this scene. The long northwest/southeast trending Walker Lane Shear Zone, which lies just to the east (right) of the Sierra Nevada is also visible. Near the top of the view (near the horizon), the snow covered volcanic peak Mount Shasta can be seen. Over 645 kilometers (400 miles) long and from 65 to 130 kilometers (40 to 80 miles) wide, the Sierra Nevada have many peaks in excess of 3,300 meters (11,000 feet) above sea level. A titled fault block in structure (the largest in the United States) and shaped by glaciers during the last ice age over 12,000 years ago, the Sierra Nevada eastern front rises sharply from the Great Basin of Nevada, while its western slope descends gradually to the hills bordering the Central Valley of California. Snow-fed streams supply much of the irrigation water to the Central Valley and to western Nevada and also generate hydroelectricity. Recent above normal precipitation (snowfall) of the last two years has helped in alleviating the drought conditions that had prevailed throughout most of California in the mid and late 1980's and early 1990's.
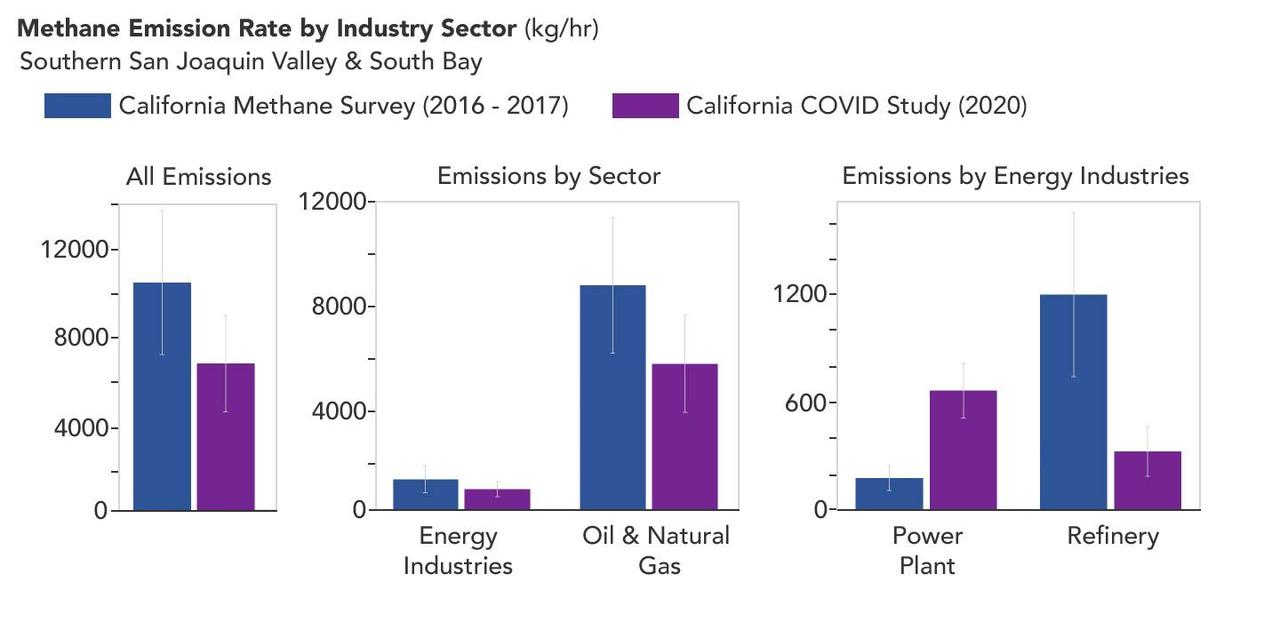
A March 2023 study by researchers at NASA's Jet Propulsion Laboratory in Southern California compared emissions from a belt of oil refineries across the South Bay area of Los Angeles during the first summer of the COVID-19 pandemic to those observed three years earlier. Using data from a NASA airborne instrument, researchers saw that most of the facilities they identified as methane sources in 2016-17 were no longer emitting the greenhouse gas in 2020, leading to a 73% reduction in measured emissions. The study uses measurements made by an imaging spectrometer called AVIRIS-NG (Airborne Visible/Infrared Imaging Spectrometer-Next Generation). Attached to the bottom of an aircraft, the instrument can detect greenhouse gas emissions from individual facilities or even pieces of equipment by looking at how the gases absorb sunlight. In 2016 and 2017, AVIRIS-NG was flown over 22,000 square miles (57,000 square kilometers) of the state as part of the California Methane Survey. From July to September 2020, researchers retraced some of those flight paths over refineries and power plants in Los Angeles County and over oil fields in central California's San Joaquin Valley. The flights were funded by NASA's Earth Science Division, the California Air Resources Board, and the California Energy Commission. The 2020 surveys over Los Angeles identified only 11 plumes from five refinery sources, with a total emissions rate of about 712 pounds (323 kilograms) methane per hour. The 2016 and 2017 flights had found 48 plumes from 33 sources, with a total emissions rate of roughly 2,639 pounds (1,197 kilograms) methane per hour. The drop correlates with an 18% decrease in monthly production in Southern California refineries between the two flight campaigns, the scientists noted, citing data from the California Energy Commission. The study also found that emissions from oil fields in and around the city of Bakersfield in central California fell 34.2%, correlating with a 24.2% drop in oil production. Reduced production during the pandemic due to lower demand for fuel and lower gas prices could have led to the drop in methane emissions, as oil fields and refineries emitted less methane as part of operations. However, researchers said, improved equipment maintenance and mitigation efforts at those facilities between 2016 and 2020 can't be ruled out as a factor. https://photojournal.jpl.nasa.gov/catalog/PIA25864