
Dr. Rafat Ansari and James King testing their dynamic light scattering clinical device in NASA's Vision Research Laboratory at NASA Glenn. The objective is to diagnose eye diseases non-invasively long before the clinical symptoms appear and help find non-surgical medical treatments. The device shown was recently used in humans by ophthalmologists and scientists for the study of early onset of cataracts.

Titan murky atmosphere shines as a halo of scattered light

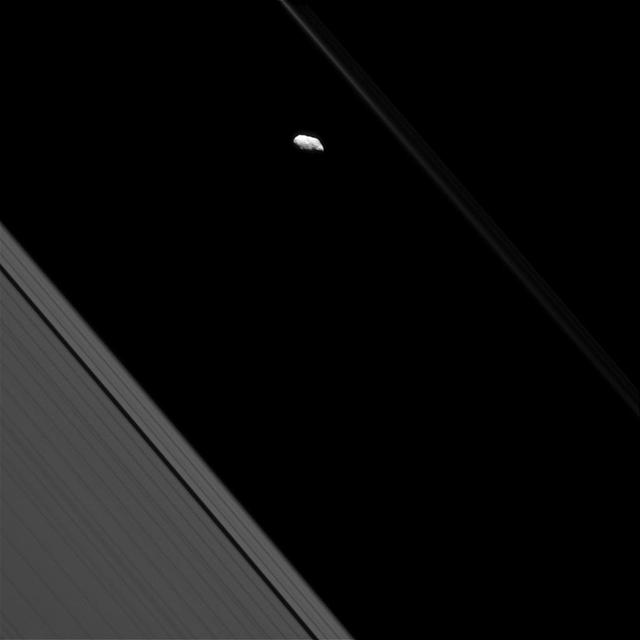
An enhanced close-up view shows at least two distinct jets spraying a mist of fine particles from the south polar region of Enceladus. This image shows the night side of Saturn and the active moon against dark sky
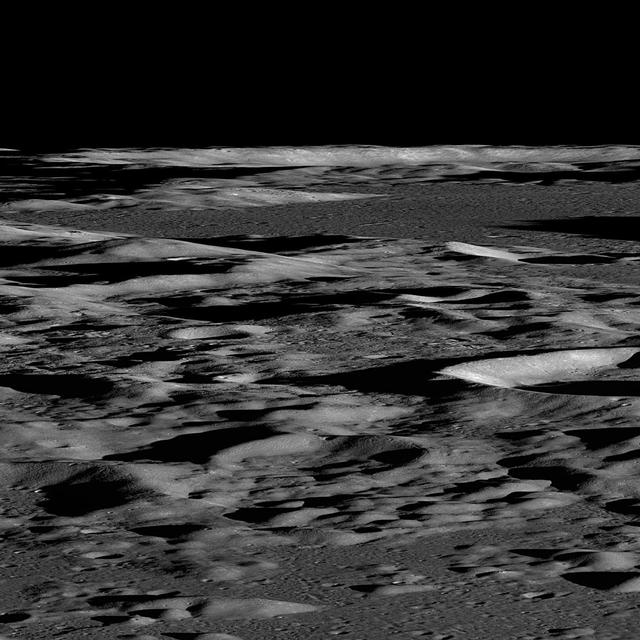
Several sequences were acquired by NASA Lunar Reconnaissance Orbiter looking across the illuminated limb to quantify scattered light.
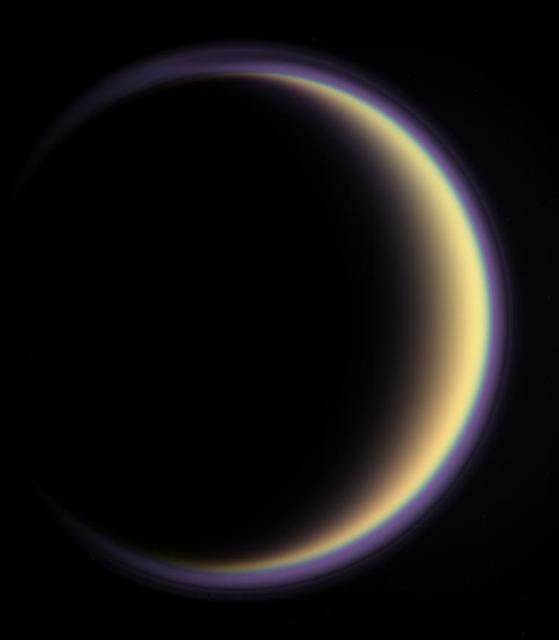
With its thick, distended atmosphere, Titan orange globe shines softly, encircled by a thin halo of purple light-scattering haze
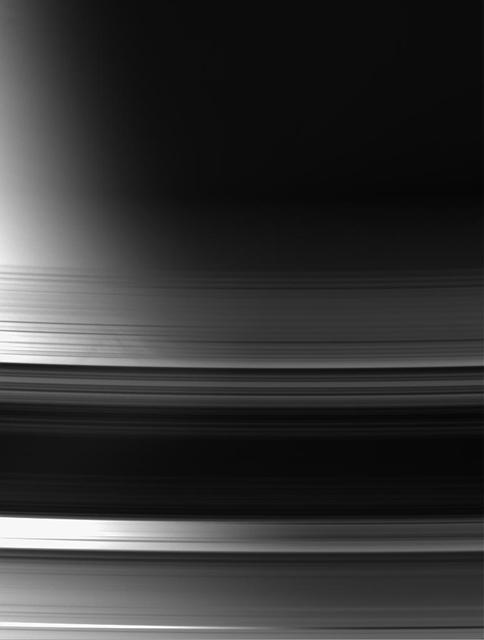
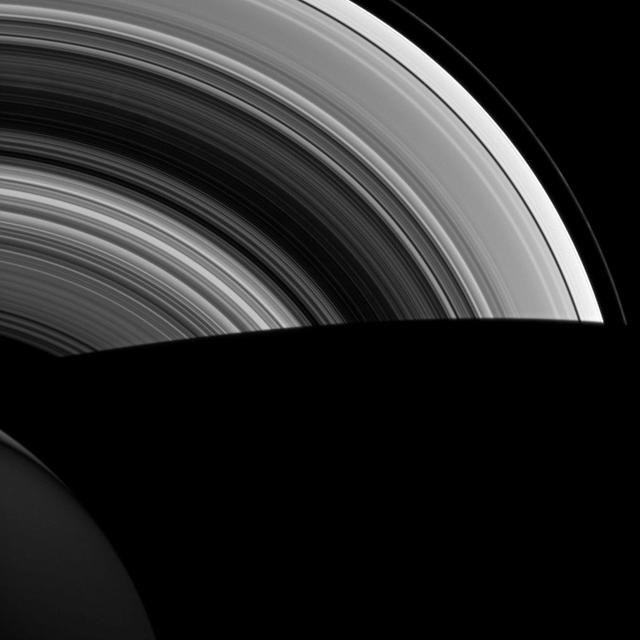
With Saturn terminator as a backdrop, this view of the unlit face of the rings makes it easy to distinguish between areas that are actual gaps, where light passes through essentially unimpeded, and areas where the rings block or scatter light
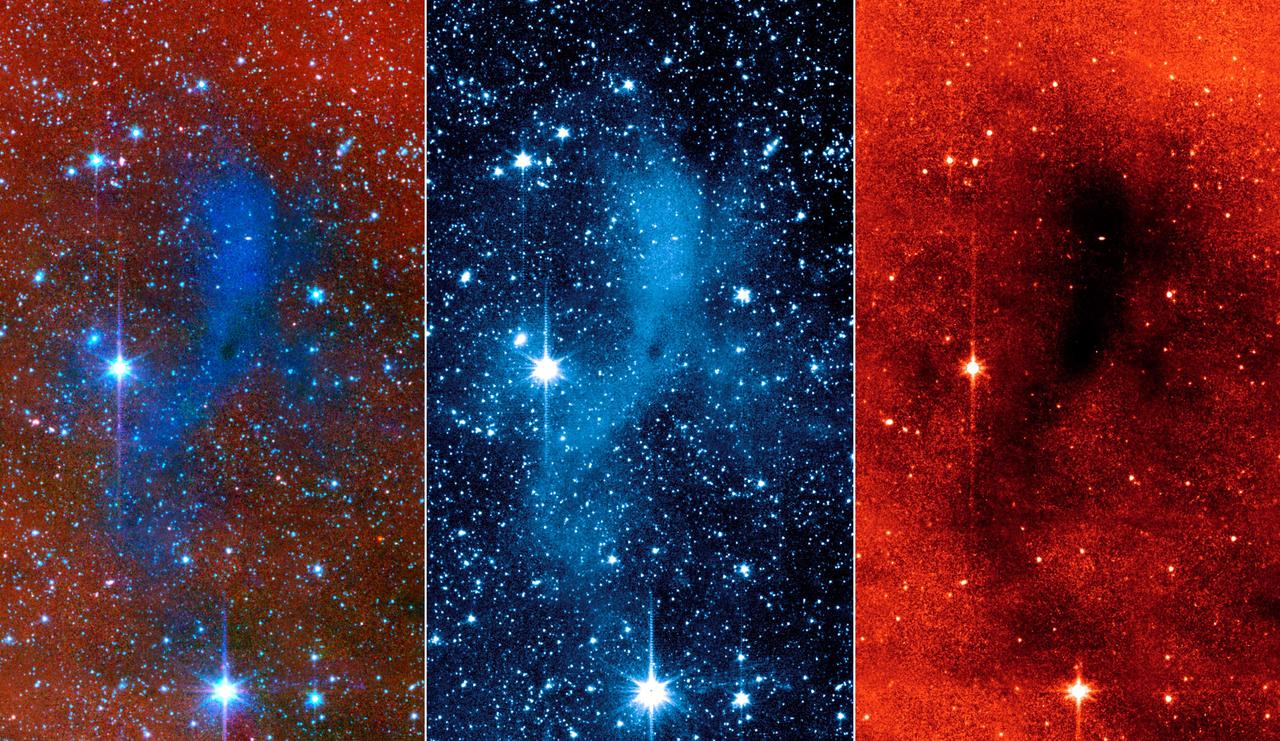
This series of images from NASA Spitzer Space Telescope shows a dark mass of gas and dust, called a core, where new stars and planets will likely spring up. This particular core lies deep within a larger dark cloud called L183.

A demonstration of the light scattering and light transmitting properties of an Aerogel material sample
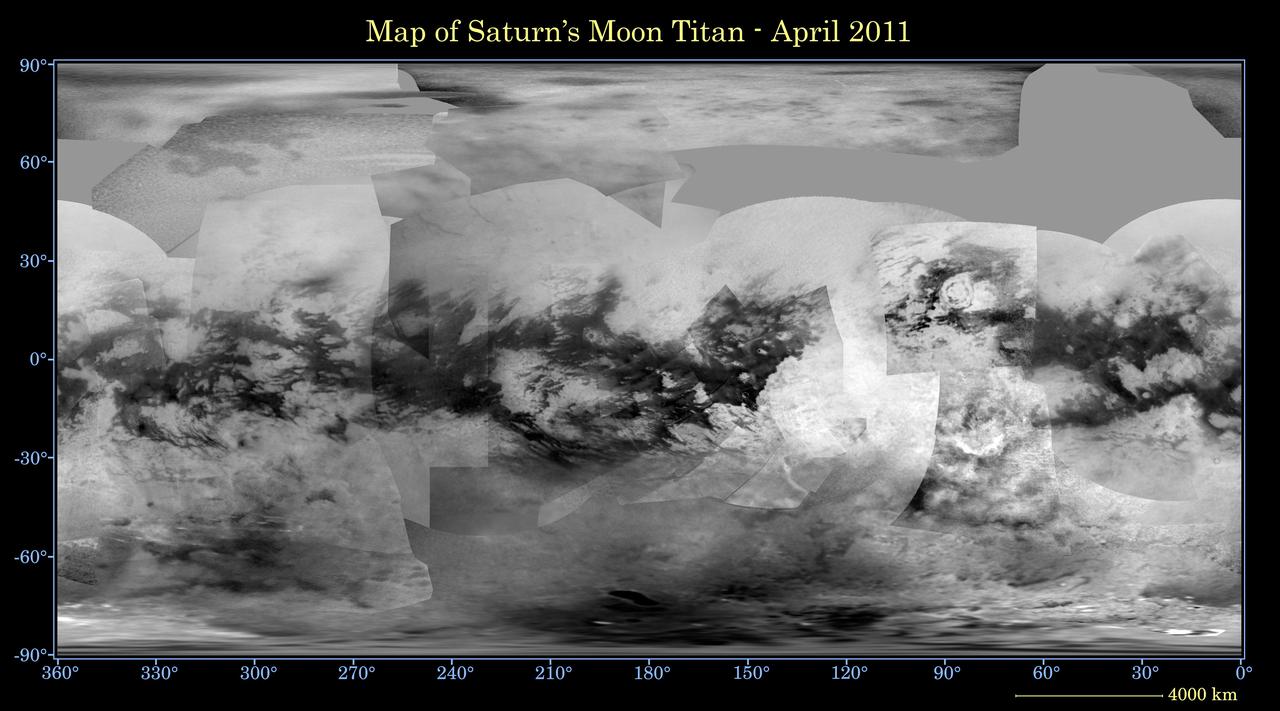
This global digital map of Saturn moon Titan was created using images taken by NASA Cassini spacecraft imaging science subsystem ISS. Because of the scattering of light by Titan dense atmosphere, no topographic shading is visible here.
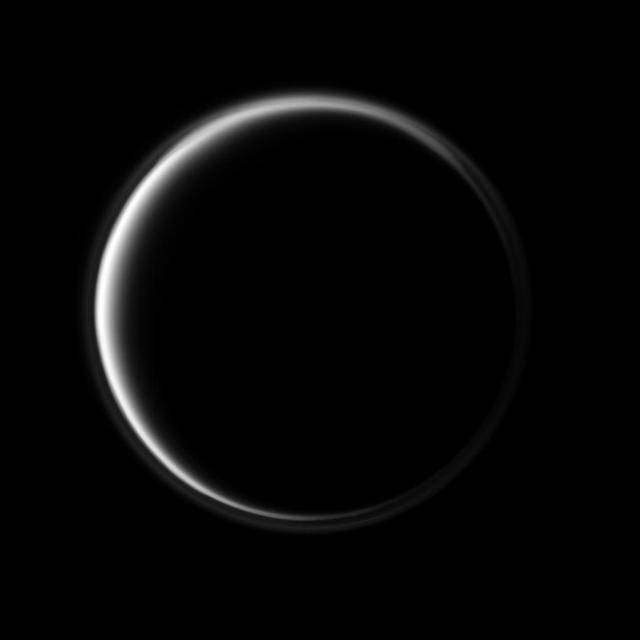
NASA Cassini spacecraft looks toward the dark side of Saturn largest moon as a circle of light is produced by sunlight scattering through the periphery of Titan atmosphere. A detached, high-altitude global haze layer encircles the moon.
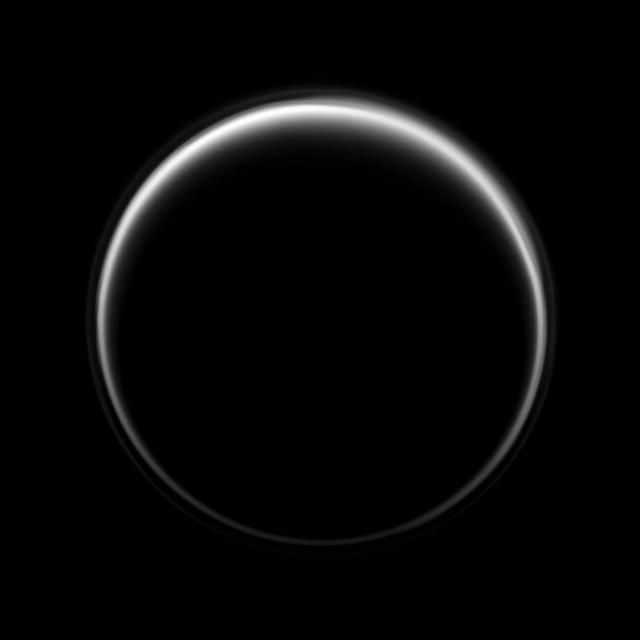
NASA Cassini spacecraft looks toward the dark side of Titan as a circle of light is produced by sunlight scattering through the periphery of the atmosphere of Saturn largest moon. A detached, high-altitude global haze layer encircles the moon.
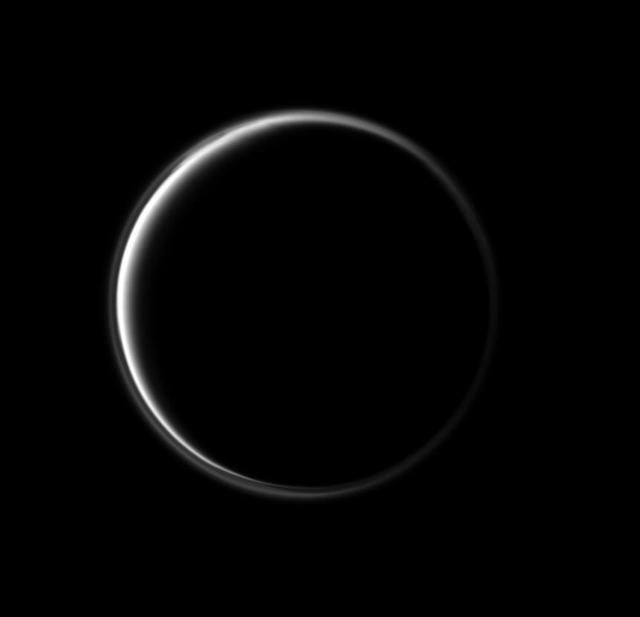
In this stunning image, NASA Cassini spacecraft looks at the dark side of Saturn largest moon. The narrowing circle of light surrounding Titan is produced by sunlight scattering through Titan atmosphere.
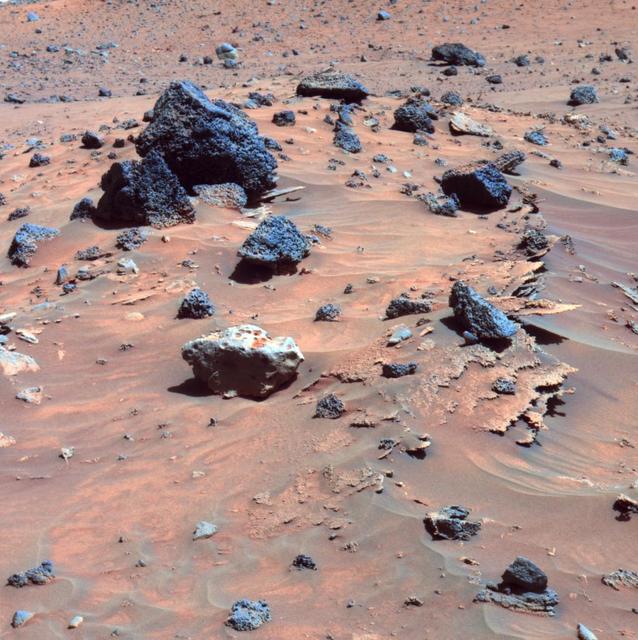
This false-color image shows paper-thin layers of light-toned, jagged-edged rocks; a light gray rock with smooth, rounded edges atop and drifts; and several dark gray to black, angular rocks with vesicles typical of hardened lava scattered across the sand
NASA Cassini spacecraft shows Saturn shadow cutting sharply across its rings as the orbits of ring particles carry them suddenly from day to night. With no atmosphere to scatter light, shadows in space are much darker than were used to here on Earth.
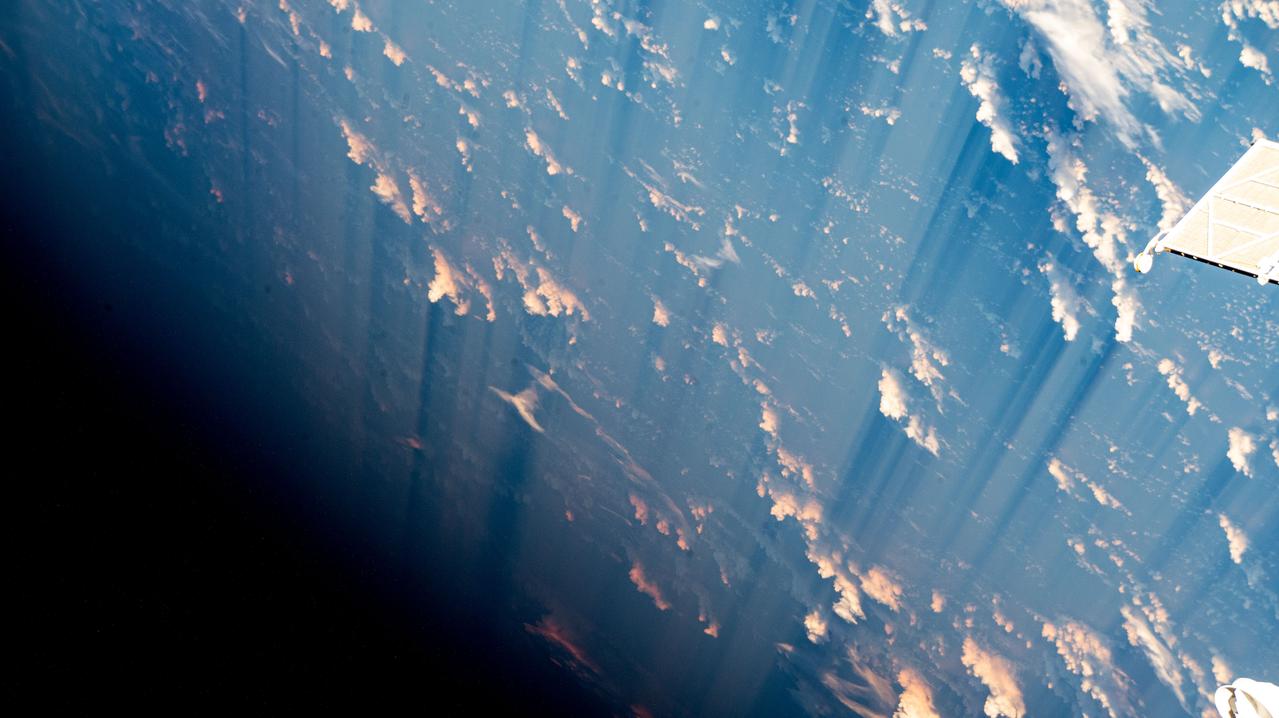
iss069e060352 (August 15, 2023) -- Light pink-orange and white clouds scatter across the blue waters of the Atlantic ocean as the International Space Station orbited 260 miles above.
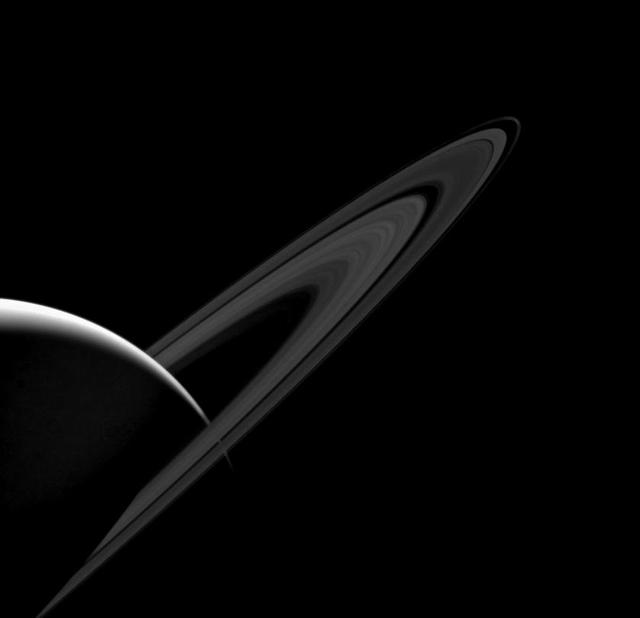
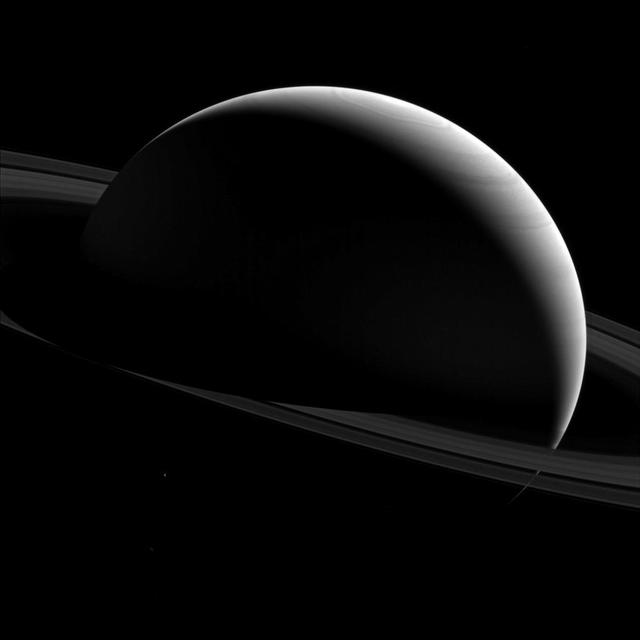
Saturn's main rings, seen here on their "lit" face, appear much darker than normal. That's because they tend to scatter light back toward its source -- in this case, the Sun. Usually, when taking images of the rings in geometries like this, exposures times are increased to make the rings more visible. Here, the requirement to not over-expose Saturn's lit crescent reveals just how dark the rings actually become. Scientists are interested in images in this sunward-facing ("high phase") geometry because the way that the rings scatter sunlight can tell us much about the ring particles' physical make-up. This view looks toward the sunlit side of the rings from about 6 degrees above the ringplane. The image was taken in visible light with the Cassini spacecraft wide-angle camera on Jan. 12, 2014. The view was acquired at a distance of approximately 1.4 million miles (2.3 million kilometers) from Saturn and at a Sun-Saturn-spacecraft, or phase, angle of 152 degrees. Image scale is 86 miles (138 kilometers) per pixel. http://photojournal.jpl.nasa.gov/catalog/PIA18294

P-34712 Range: 1.1 million kilometers (683,000 miles) This wide-angle Voyager 2 image, taken through the camera's clear filter, is the first to show Neptune's rings in detail. The two main rings, about 53,000 km (33,000 miles) and 63,000 km (39,000 miles) from Neptune, are 5 to 10 times brighter than in earlier images. The difference is due to lighting and viewing geometry. In approach images, the rings were seen in light scattered backward toward the spacecraft at a 15° phase angle. However, this image was taken at a 135° phase angle as Voyager left the planet. That geometry is ideal for detecting microscopic particles that forward scatter light preferentially. The fact that Neptune's rings are so much brighter at that angle means the particle-size distribution is quite different from most of Uranus' and Saturn's rings, which contain fewer dust-size grains. However, a few componenets of the Saturian and Uranian ring systems exhibit forward-scattering behavior: The F ring and the Encke Gap ringlet at Saturn and 1986U1R at Uranus. They are also narrow, clumpy ringlets with kinks, and are associated with nearby moonlets too small to detect directly. In this image, the main clumpy arc, composed of three features each about 6 to 8 degrees long, is clearly seen. Exposure time for this image was 111 seconds.
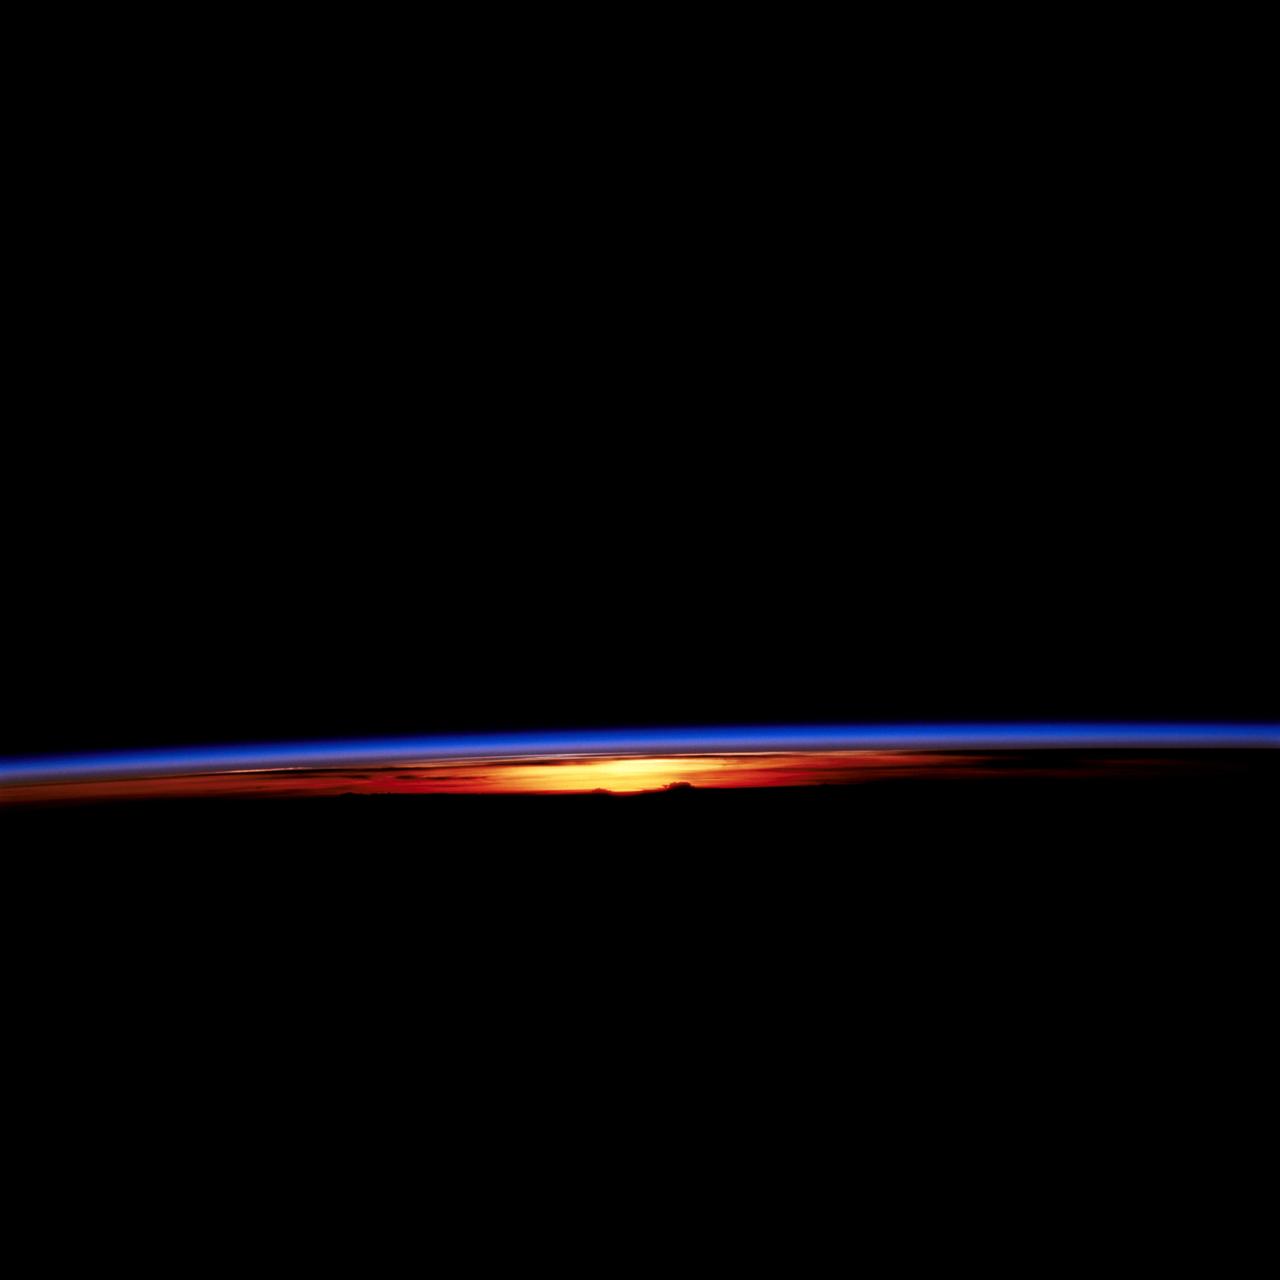
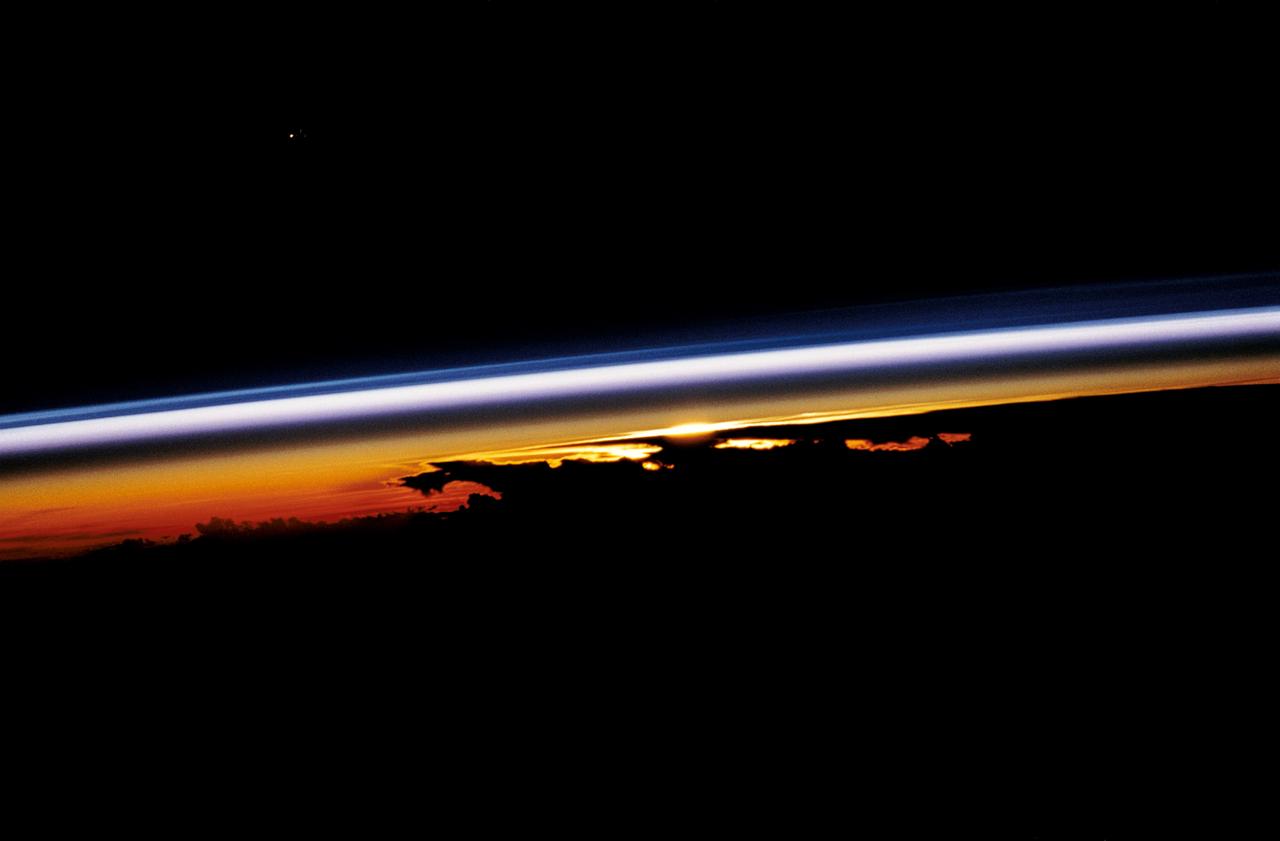
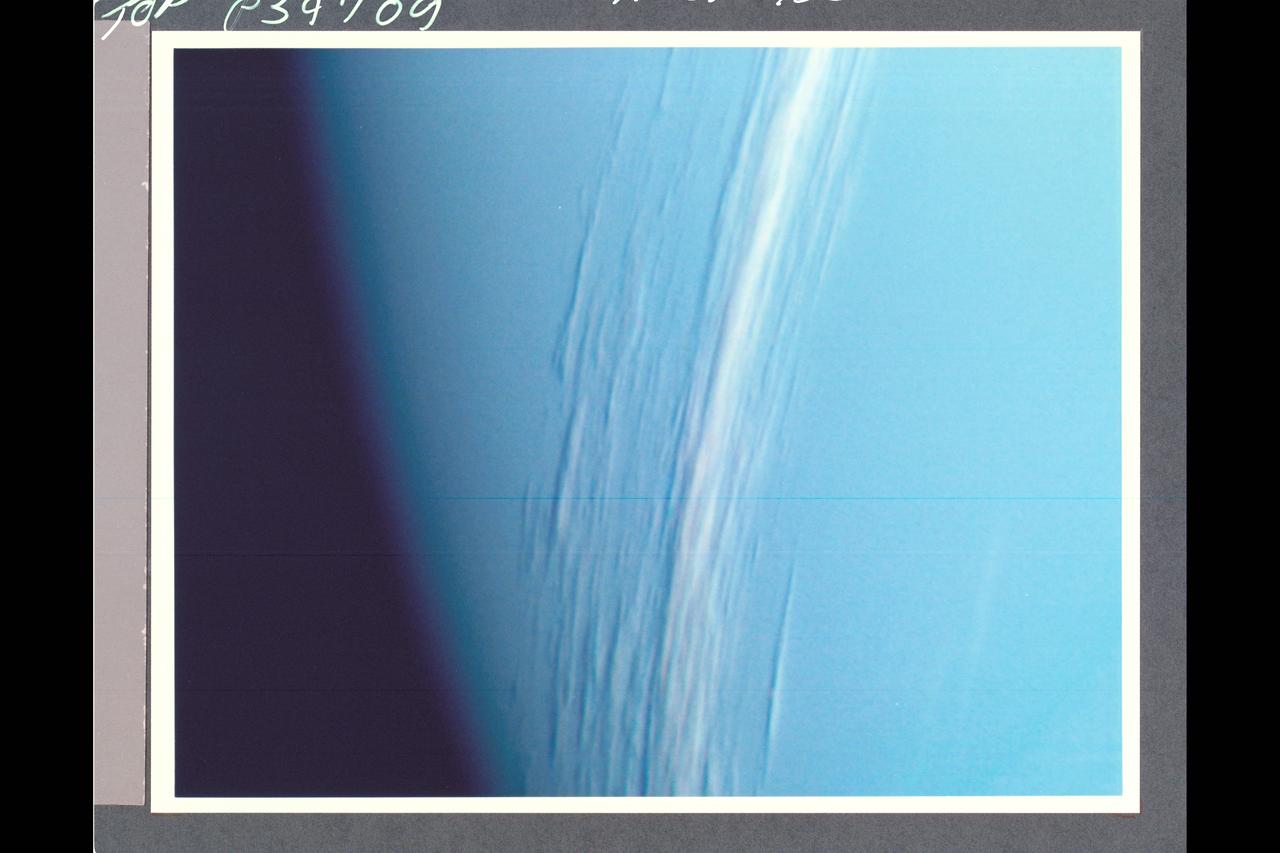
STS067-709-007 (2-18 March 1995) --- This shot, taken just after sunset, shows several distinct layers of gases in the atmosphere on the Earth’s limb. The distinct colors formed by the amount of scattered light that passes through these gases.
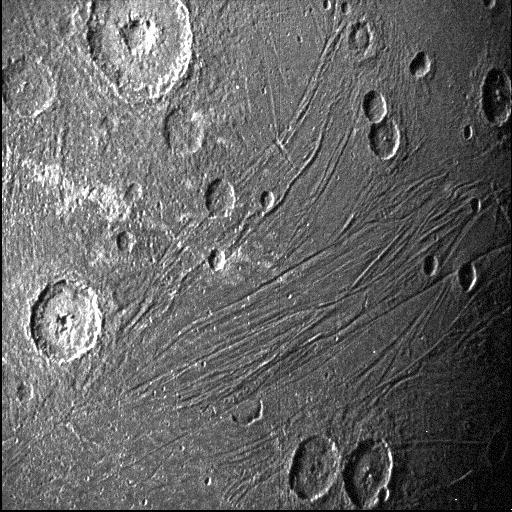
This image of the dark side of the Jovian moon Ganymede was obtained by the Stellar Reference Unit star camera aboard NASA's Juno spacecraft during its June 7, 2021, flyby of the icy moon. Usually used to the spacecraft on course, the navigation camera was able to obtain an image of the moon's dark side (the side opposite the Sun) because it was bathed in the dim light scattered off Jupiter; the camera operates exceptionally well in low-light conditions. https://photojournal.jpl.nasa.gov/catalog/PIA24682
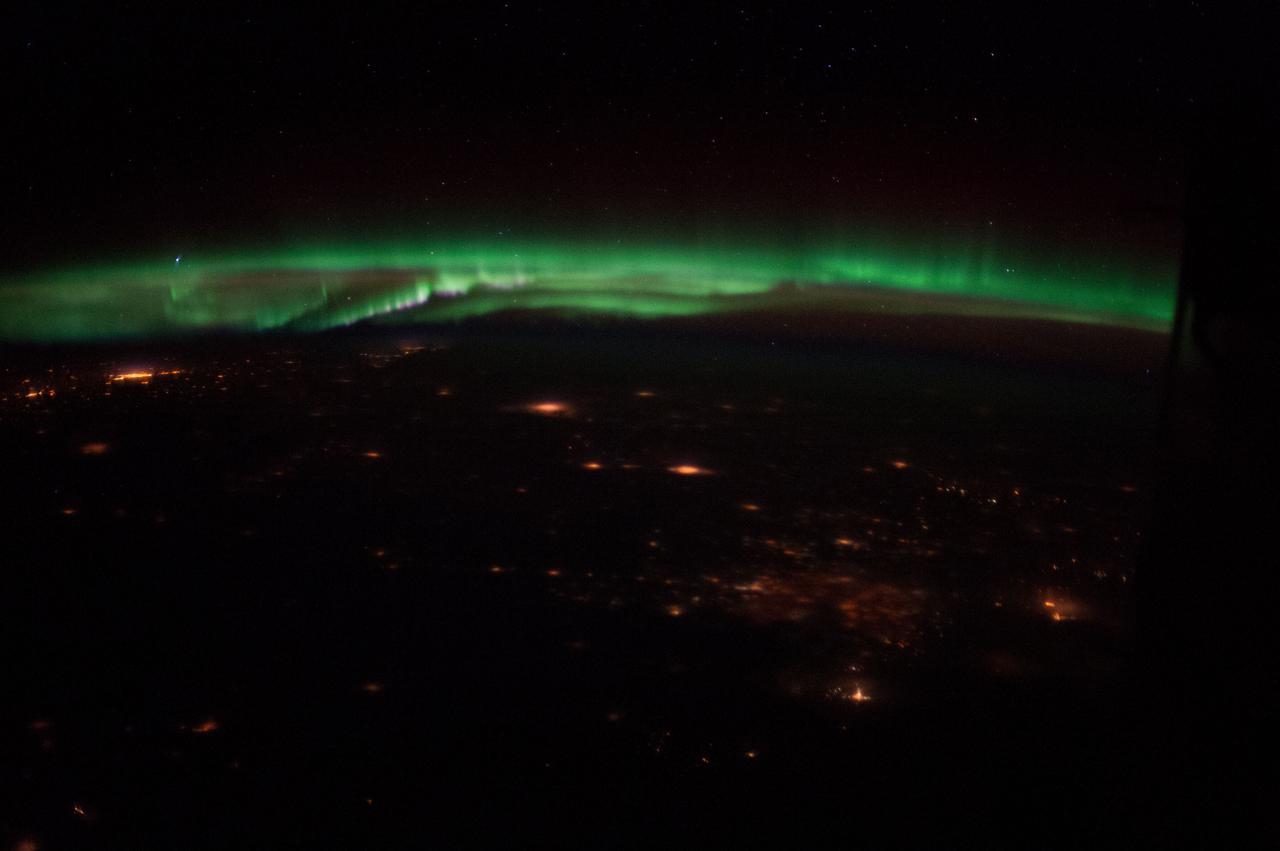
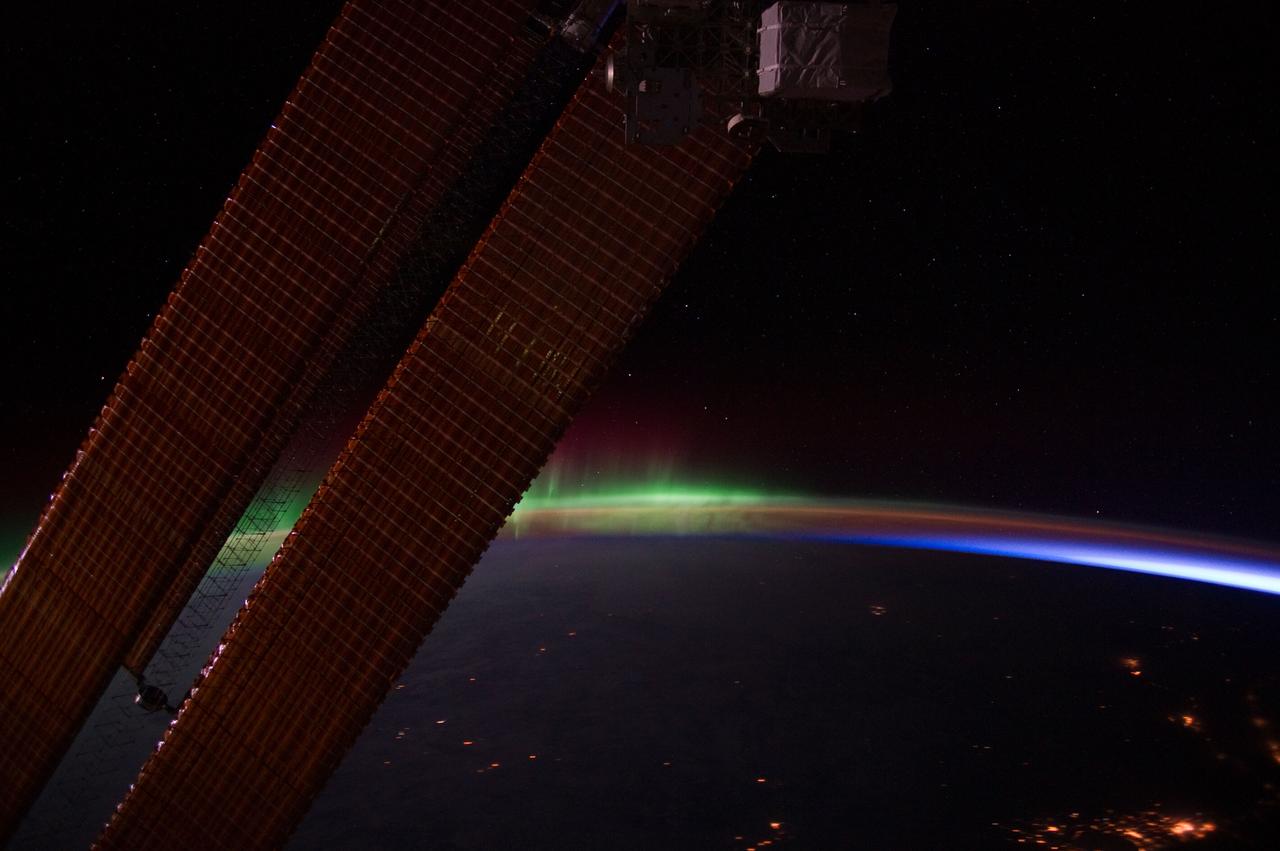
ISS034-E-045223 (10 Feb. 2013) -- One of the Expedition 34 crew members aboard the International Space Station captured this night panorama featuring a display of Northern Lights, also known as Aurora Borealis, and scattered lights in the more highly populated areas in the state of Colorado and possibly the states north of it. A 50 millimeter lens was used to record the image.

In this lunar eclipse viewed from Merritt Island, Fla., at midnight, the full moon takes on a dark red color because it is being lighted slightly by sunlight passing through the Earth's atmosphere. This light has the blue component preferentially scattered out (this is also why the sky appears blue from the surface of the Earth), leaving faint reddish light to illuminate the Moon during the eclipse. Eclipses occur when the Sun, Earth and Moon line up. They are rare because the Moon usually passes above or below the imaginary line connecting Earth and the Sun. The Earth casts a shadow that the Moon can pass through -when it does, it is called a lunar eclipse

In this lunar eclipse viewed from Merritt Island, Fla., at 11:55 p.m., the full moon takes on a dark red color because it is being lighted slightly by sunlight passing through the Earth's atmosphere. This light has the blue component preferentially scattered out (this is also why the sky appears blue from the surface of the Earth), leaving faint reddish light to illuminate the Moon during the eclipse. Eclipses occur when the Sun, Earth and Moon line up. They are rare because the Moon usually passes above or below the imaginary line connecting Earth and the Sun. The Earth casts a shadow that the Moon can pass through -when it does, it is called a lunar eclipse

In this lunar eclipse viewed from Merritt Island, Fla., the full moon takes on a dark red color because it is being lighted slightly by sunlight passing through the Earth's atmosphere. This light has the blue component preferentially scattered out (this is also why the sky appears blue from the surface of the Earth), leaving faint reddish light to illuminate the Moon. Eclipses occur when the Sun, Earth and Moon line up. They are rare because the Moon usually passes above or below the imaginary line connecting Earth and the Sun. The Earth casts a shadow that the Moon can pass through - when it does, it is called a lunar eclipse.
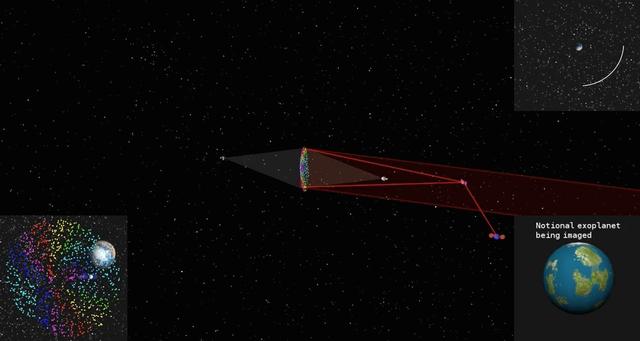
This simulated image shows how a cloud of glitter in geostationary orbit would be illuminated and controlled by two laser beams. As the cloud orbits Earth, grains scatter the sun's light at different angles like many tiny prisms, similar to how rainbows are produced from light being dispersed by water droplets. That is why the project concept is called "Orbiting Rainbows." The cloud functions like a reflective surface, allowing the exoplanet (displayed in the bottom right) to be imaged. The orbit path is shown in the top right. On the bottom left, Earth's image is seen behind the cloud. To image an exoplanet, the cloud would need to have a diameter of nearly 98 feet (30 meters). This simulation confines the cloud to a 3.3 x 3.3 x 3.3 foot volume (1 x 1 x 1 meter volume) to simplify the computations. The elements of the orbiting telescope are not to scale. Orbiting Rainbows is currently in Phase II development through the NASA Innovative Advanced Concepts (NIAC) Program. It was one of five technology proposals chosen for continued study in 2014. In the current phase, Orbiting Rainbows researchers are conducting small-scale ground experiments to demonstrate how granular materials can be manipulated using lasers and simulations of how the imaging system would behave in orbit. http://photojournal.jpl.nasa.gov/catalog/PIA19318
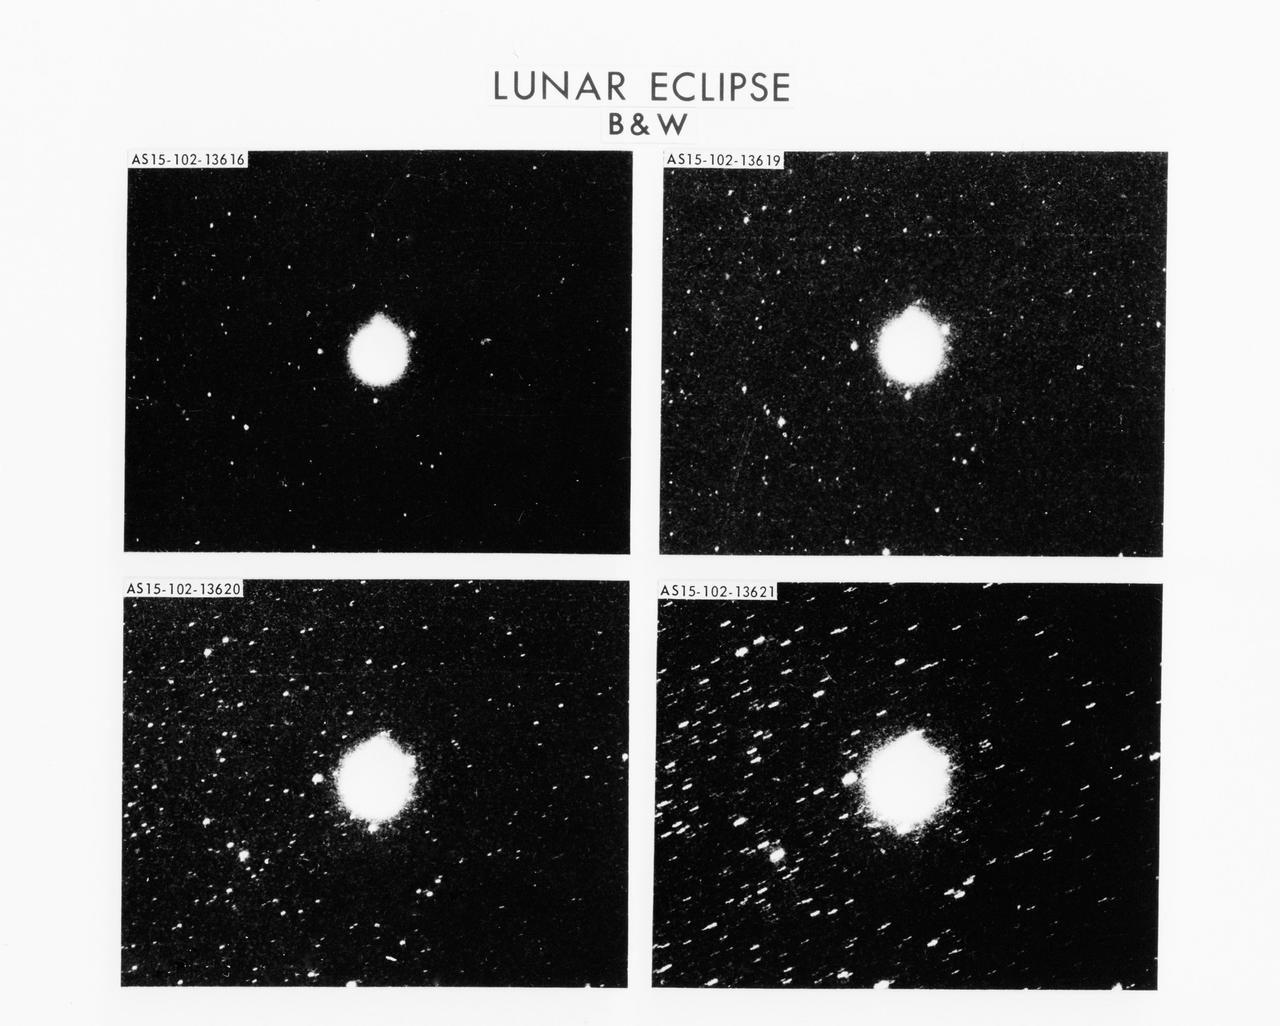
S71-58222 (31 July-2 Aug. 1971) --- During the lunar eclipse that occurred during the Apollo 15 lunar landing mission, astronaut Alfred M. Worden, command module pilot, used a 35mm Nikon camera to obtain a series of 15 photographs while the moon was entering and exiting Earth's umbra. Although it might seem that there should be no light on the moon when it is in Earth's shadow, sunlight is scattered into this region by Earth's atmosphere. This task was an attempt to measure by photographic photometry the amount of scattered light reaching the moon. The four views from upper left to lower right were selected to show the moon as it entered Earth's umbra. The first is a four-second exposure which was taken at the moment when the moon had just entered umbra; the second is a 15-second exposure taken two minutes after entry; the third, a 30-second exposure three minutes after entry; and the fourth is a 60-second exposure four minutes after entry. In all cases the light reaching the moon was so bright on the very high speed film (Eastman Kodak type 2485 emulsion) that the halation obscures the lunar image, which should be about one-third as big as the circle of light. The background star field is clearly evident, and this is very important for these studies. The spacecraft was in full sunlight when these photographs were taken, and it was pointed almost directly away from the sun so that the windows and a close-in portion of the camera's line-of-sight were in shadow. The environment around the vehicle at this time appears to be very "clean" with no light scattering particles noticeable.
Surface features are visible on Saturn's moon Prometheus in this view from NASA's Cassini spacecraft. Most of Cassini's images of Prometheus are too distant to resolve individual craters, making views like this a rare treat. Saturn's narrow F ring, which makes a diagonal line beginning at top center, appears bright and bold in some Cassini views, but not here. Since the sun is nearly behind Cassini in this image, most of the light hitting the F ring is being scattered away from the camera, making it appear dim. Light-scattering behavior like this is typical of rings comprised of small particles, such as the F ring. This view looks toward the unilluminated side of the rings from about 14 degrees below the ring plane. The image was taken in visible light with the Cassini spacecraft narrow-angle camera on Sept. 24, 2016. The view was acquired at a distance of approximately 226,000 miles (364,000 kilometers) from Prometheus and at a sun-Prometheus-spacecraft, or phase, angle of 51 degrees. Image scale is 1.2 miles (2 kilometers) per pixel. http://photojournal.jpl.nasa.gov/catalog/PIA20508
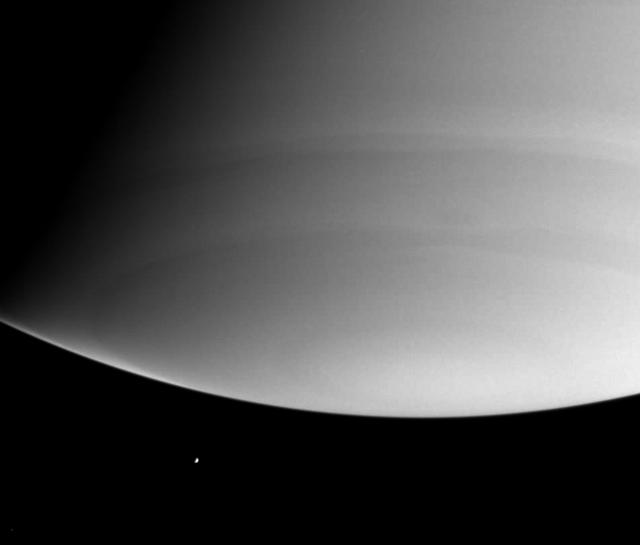
Looking beyond Saturn's south pole, this was the Cassini spacecraft's view of the distant, icy moon Enceladus on July 28, 2004. The planet itself shows few obvious features at these ultraviolet wavelengths, due to scattering of light by molecules of the gases high in the atmosphere. Enceladus is 499 kilometers (310 miles) wide. The image was taken with the Cassini spacecraft narrow angle camera at a distance of 7.4 million kilometers (4.6 million miles) from Saturn through a filter sensitive to ultraviolet wavelengths of light. The image scale is 44 kilometers (27 miles) per pixel of Saturn. http://photojournal.jpl.nasa.gov/catalog/PIA06483
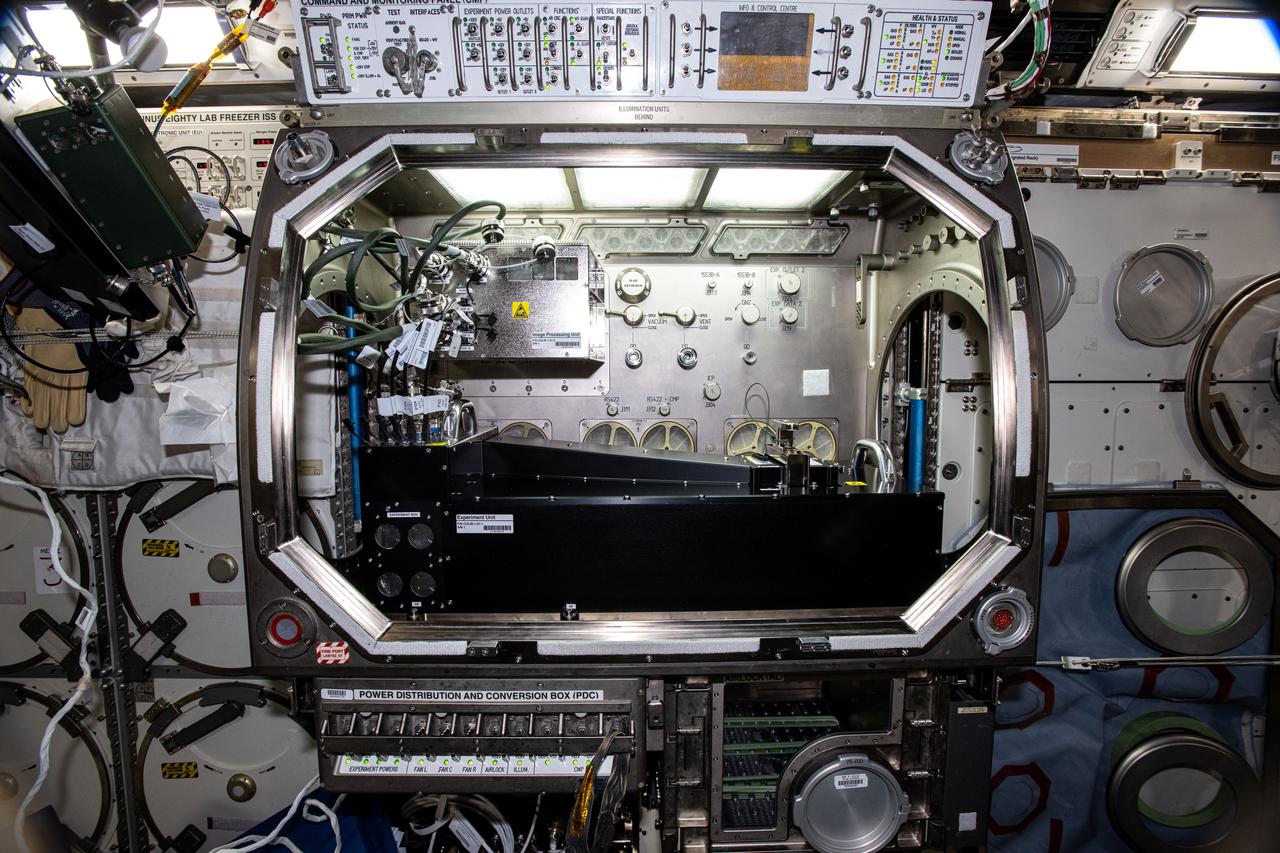
iss073e0002997 (4/28/2025) --- A view of the Colloidal Solids investigation inside the Microgravity Sciences Glovebox (MSG). Colloidal Solids (COLIS) provides researchers with a better understanding of the origin, formation, and dynamics of protein crystals and colloidal glasses and gels. COLIS is a state-of-the-art multi-line light scattering apparatus that enables the research team to monitor the dynamics of physical processes, during and after solidification, of soft matter solids on the International Space Station (ISS) to assess the role played by gravity on the properties of growing structures.
ISS030-E-075182 (4 Feb. 2012) --- This nighttime view of Earth's horizon and scattered city lights was photographed by one of the Expedition 30 crew members aboard the International Space Station. Activity of Aurora Borealis appears from behind one of the orbital outpost's solar array panels, then fades into an area where Earth's limb is visible and finally a small "slice" of daybreak appears at right.
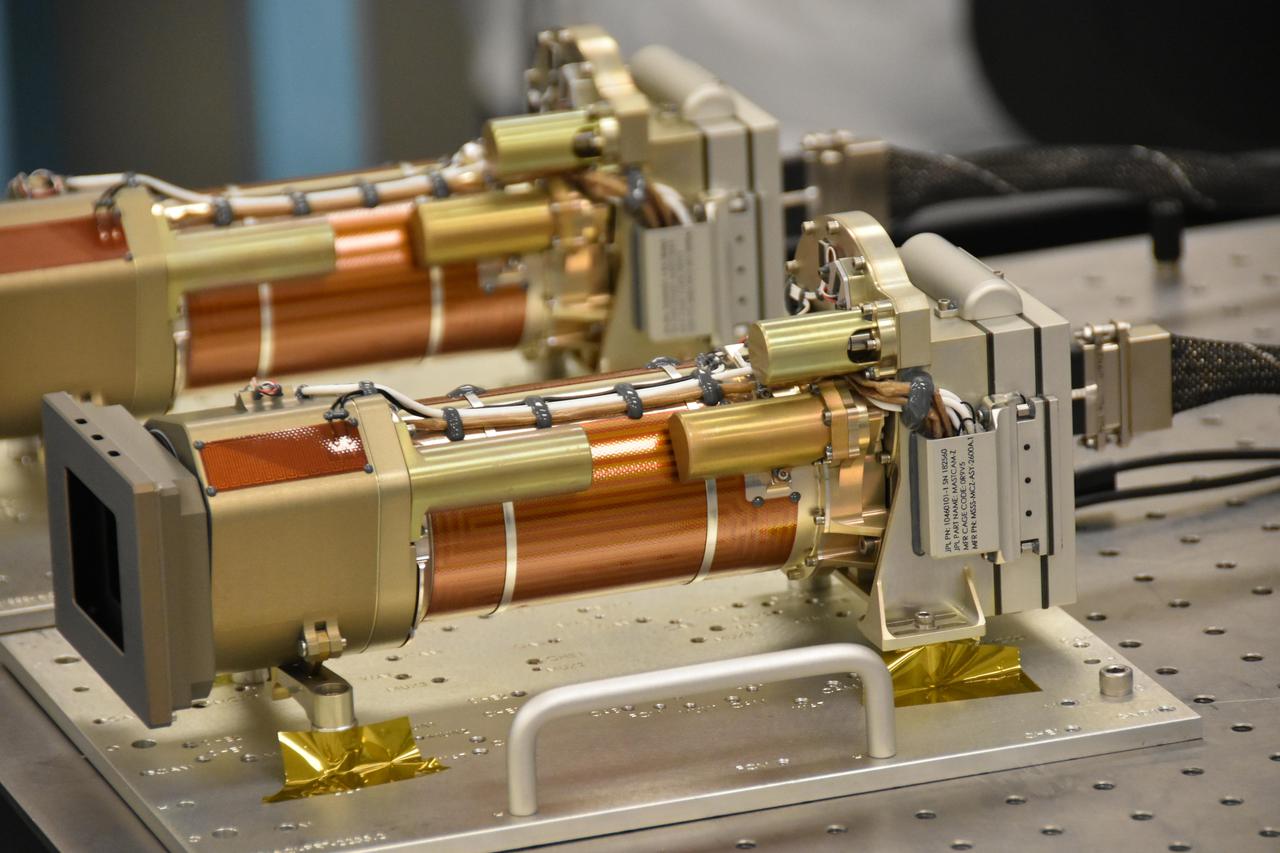
The Mastcam-Z cameras are on a workbench during their assembly at Malin Space Science Systems in San Diego. A square lightshade is mounted at the left end of the camera to reduce the scattered light that reaches the optics. Both cameras are almost identical, except for slight differences in the adjustable color filters that will provide more information about the mineralogy of the rocks on Mars. https://photojournal.jpl.nasa.gov/catalog/PIA24198
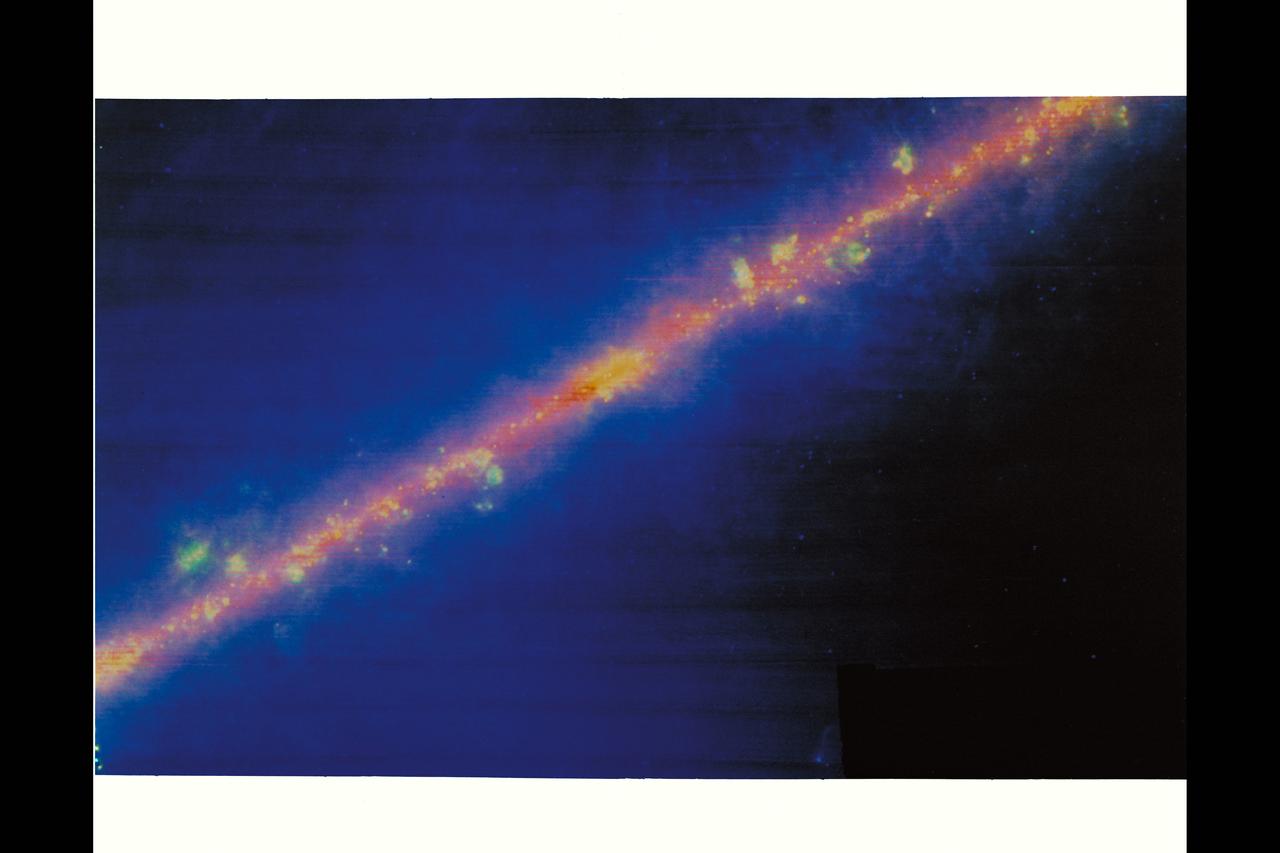
Milky way - The real shape of our galaxy is revealed in this infrared image obtained by IRAS. Infrared light penetrates the dust clouds and shows that the galaxy appears as a thin disk, just like the edge-on spiral galaxies we see throughtout the cosmos. The bulge in the band is the center of the galaxy. The yellow and green knots and blobs scattered along the band are giant clouds of interstellar gas and dust heated by nearby stars.
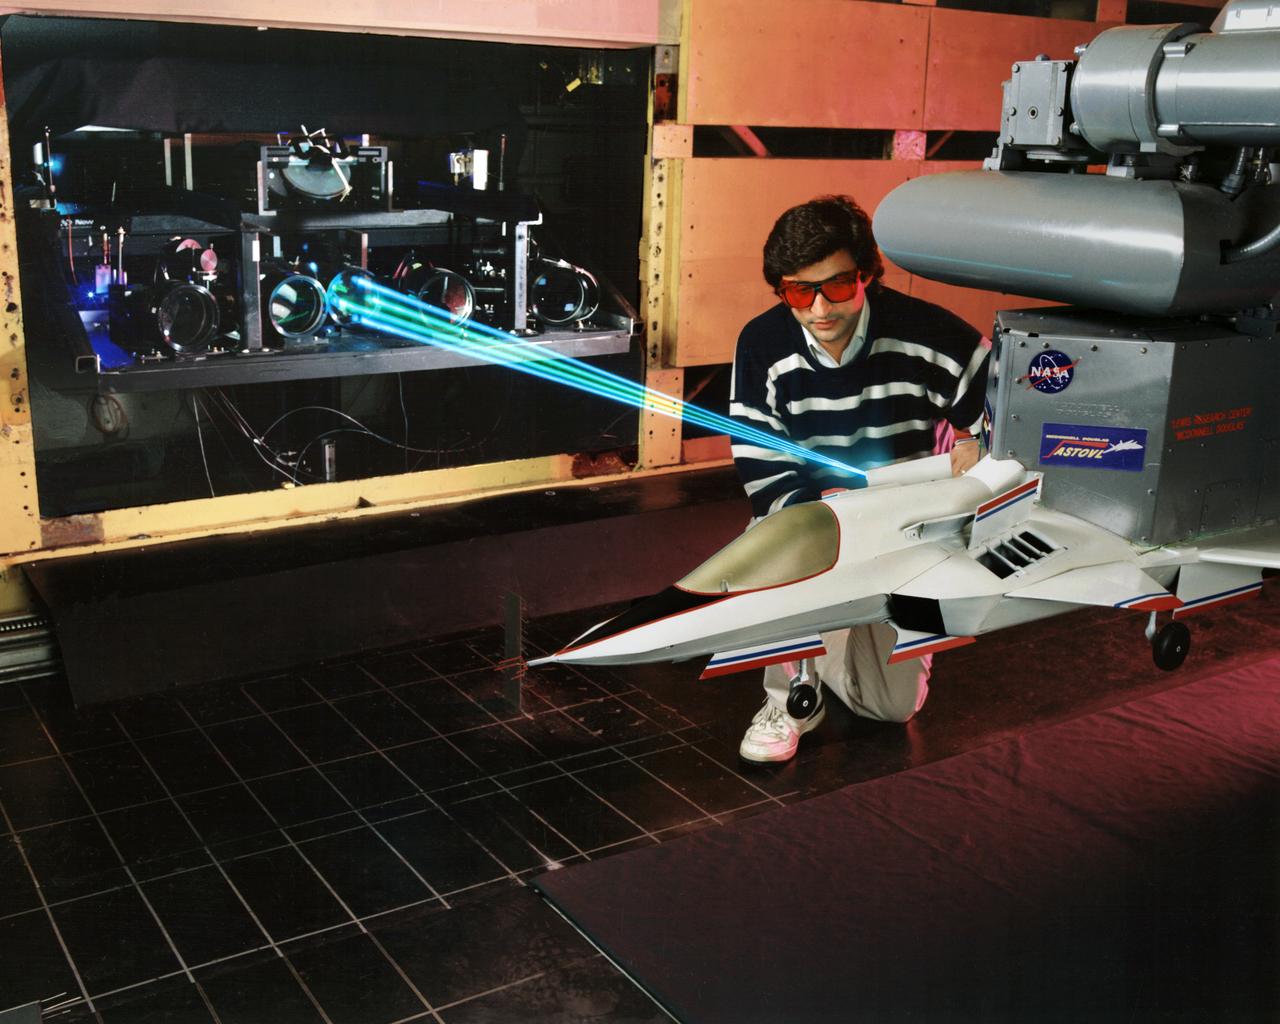
A spectrally resolved Rayleigh/Mie scattering diagnostic was developed to measure temperature and wing span wise velocity in the vicinity of an ASTOVL aircraft model tested in the Lewis, now Glenn, 9x15 Low Speed Wind Tunnel. Shown is a Fabry-Perot interferometer that uses only the blue light from a laser to measure static temperature and velocity near the lift nozzles and suction systems.

STS073-725-031 (24 October 1995) --- The contrasting colors of fall in New England are captured on this northward-looking photo of Martha's Vineyard, Nantucket Island, and the famous hook-shaped Cape Cod. Light-colored patches of urbanization are scattered throughout the scene, the most evident being the greater Boston area along the shores of Massachusetts Bay. The cape is composed of rock debris that, according to NASA scientists studying Columbia's photo collection, was deposited along the end of glacier some 20,000 years ago.
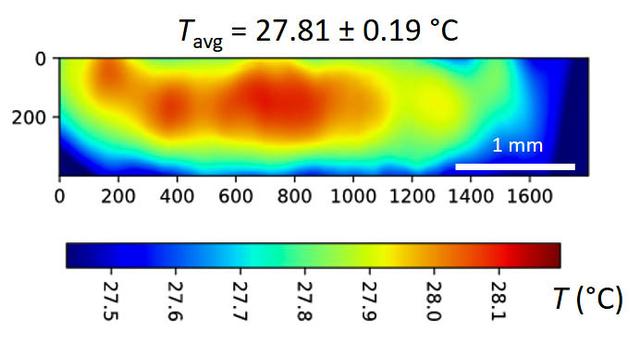
jsc2024e065172 (10/3/2024) --- A temperature map is seen within a microgel suspension illuminated by the Colloidal Solids (COLIS) near infrared laser (NIR). Reference ground tests for the Colloidal Solids (COLIS) investigation show spatial variation of the sample temperature while illuminating an aqueous, dense suspension of thermosensitive microgels with a 0.5 s pulse of NIR laser light. The NIR beam propagates from left to right. The sample temperature with no NIR laser is uniform and set to 27°C. The temperature values are inferred from the change in scattered intensity at a scattering angle of 90°, as recorded by one of the complementary metal-oxide-semiconductor (CMOS) cameras of COLIS. Results from this investigation are expected to provide a deeper understanding of soft solid interactions with gravity and microgravity, paving the way for the design of new materials. Image courtesy of Redwire Space Laboratories, Kruibeke – Belgium.
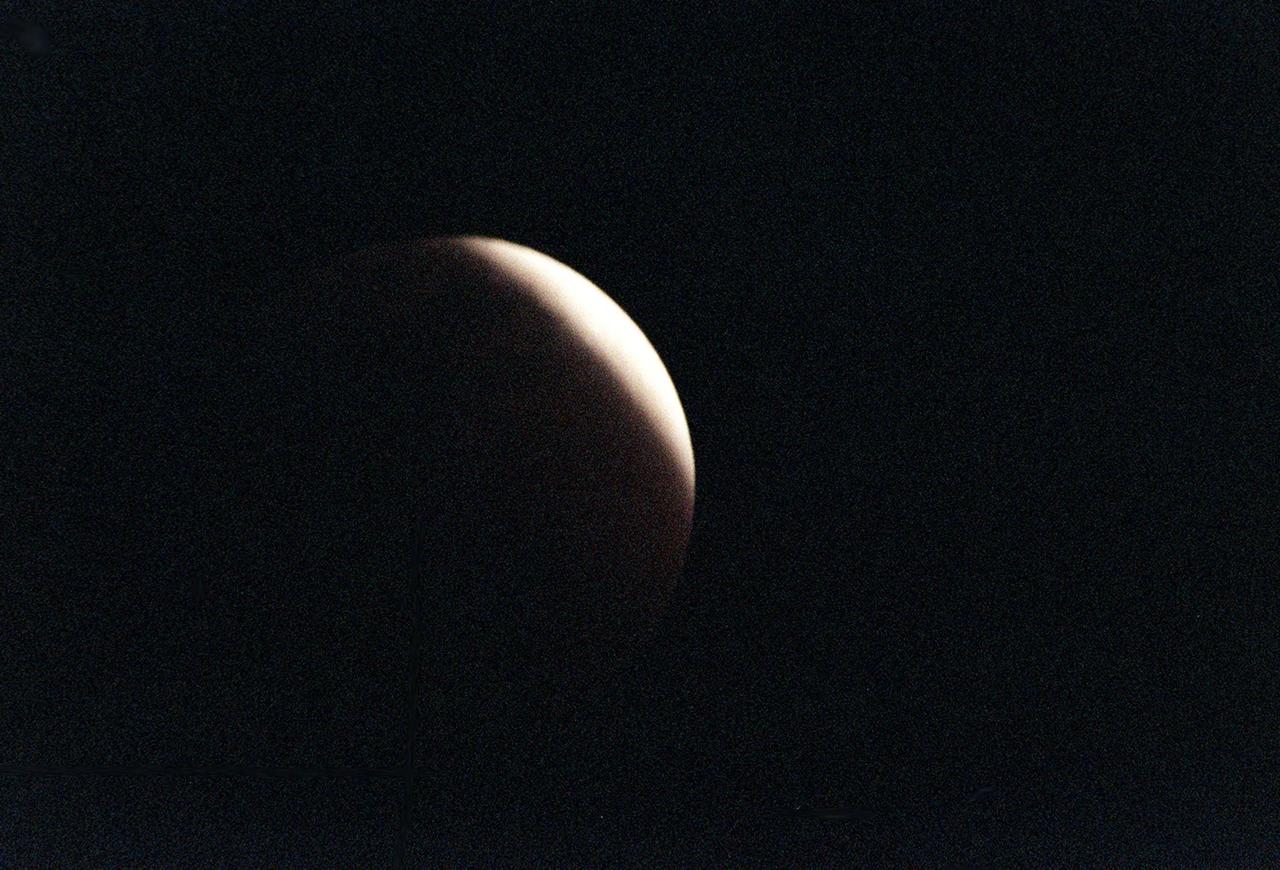
Viewed from Merritt Island, Fla., at 11:25 p.m. EST, the full moon, traveling west to east, is nearly completely in the Earth's shadow, producing a lunar eclipse. Eclipses occur when the Sun, Earth and Moon line up. They are rare because the Moon usually passes above or below the imaginary line connecting Earth and the Sun. The Earth casts a shadow that the Moon can pass through -when it does, it is called a lunar eclipse. They can only occur when the moon is "full." During a total lunar eclipse the Moon takes on a dark red color because it is being lighted slightly by sunlight passing through the Earth's atmosphere and this light has the blue component preferentially scattered out (this is also why the sky appears blue from the surface of the Earth), leaving faint reddish light to illuminate the Moon during the eclipse
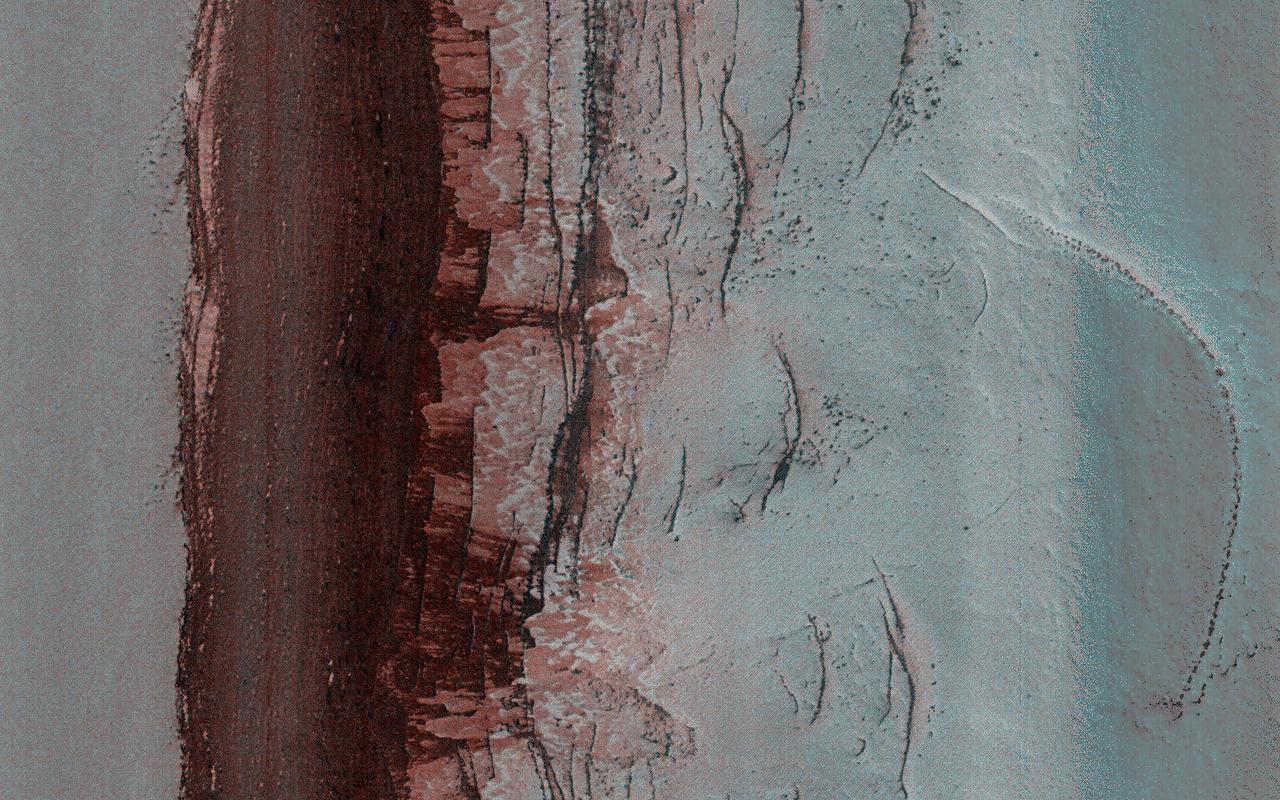
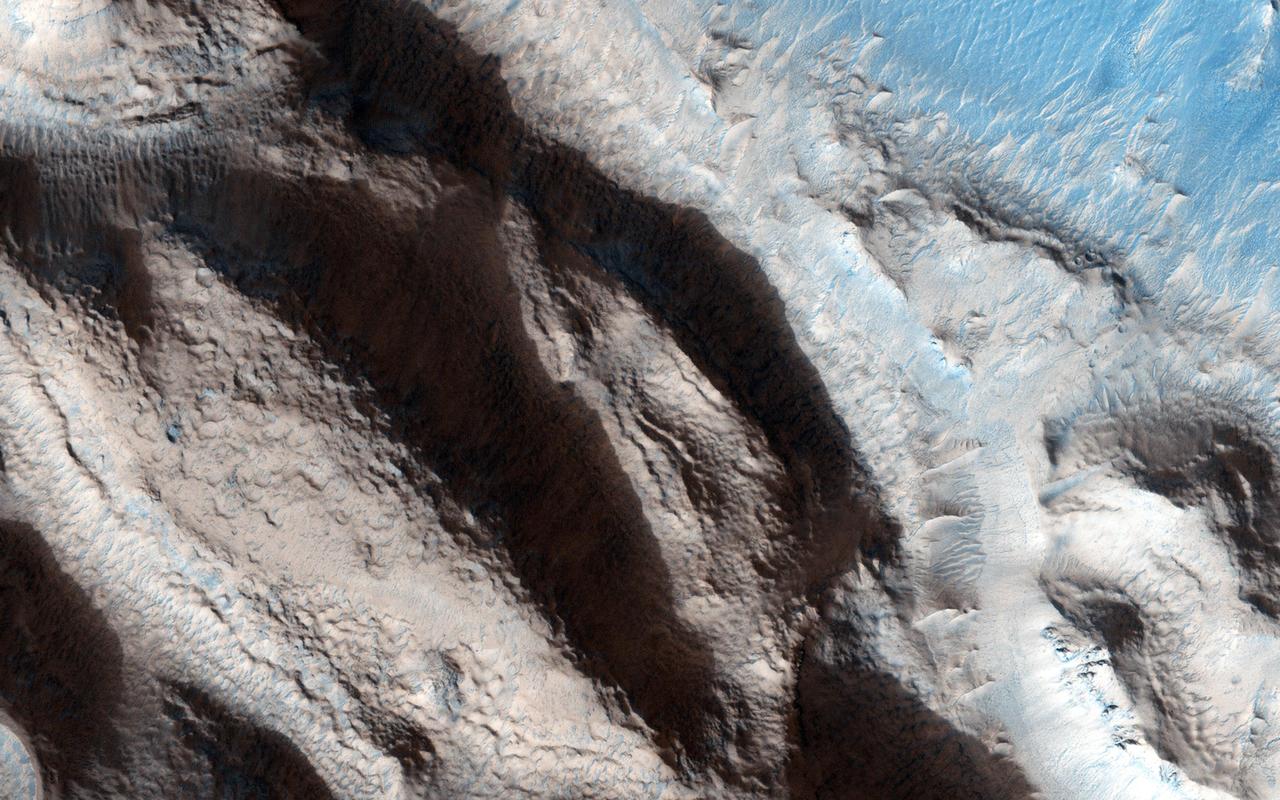
This very steep (more than 60 degrees) scarp shows mass wasting activity every year in the early northern spring, when it is first illuminated after the period of winter darkness. This observation was an attempt to image in late northern winter, in spite of poor illumination. The solar incidence angle is 91.3 degrees, meaning that the Sun is just below the horizon and there was no direct lighting when this image was acquired. However, the atmosphere scatters light to create some diffuse lighting, and the surface is very bright from winter frost deposition, so a useful image of the surface was obtained. The image reveals relatively dark streaks down the steep slope, so mass wasting activity has already started. There is some direct illumination here close to noontime at this time of year, which may be sufficient to initiate some activity. https://photojournal.jpl.nasa.gov/catalog/PIA25792
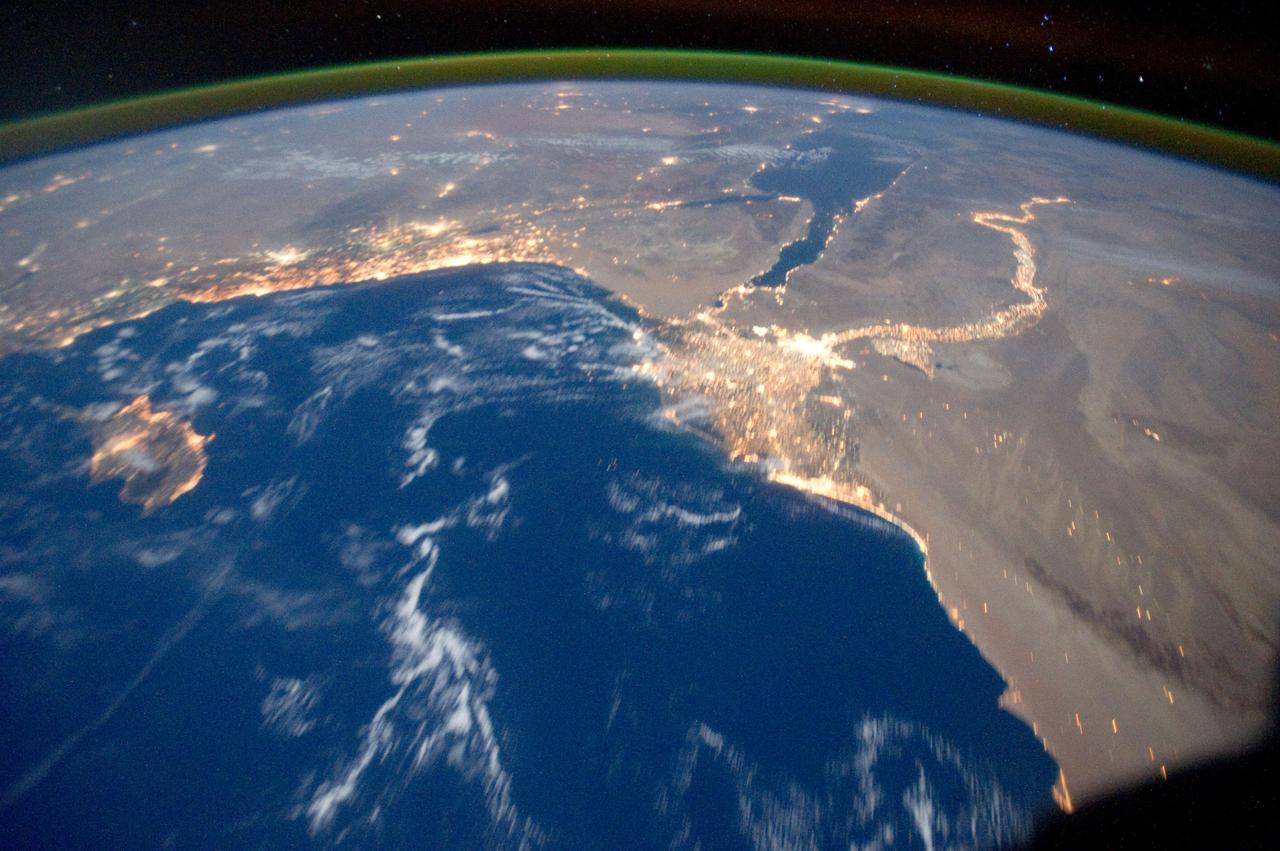
ISS029-E-031157 (15 Oct. 2011) --- One of the Expedition 29 crew members aboard the International Space Station recorded this oblique view showing the Mediterranean Sea area, including the Nile River and the river's delta, and the Sinai Peninsula, on Oct. 15, 2011. Cyprus is visible at left. At first look, the image appears to have been photographed in daylight, but actually it was taken at 01:01:08 GMT. Some areas of the photo like the river and river delta appear as the brightest areas because of either man-made lighting (mostly incandescent) or man-made lighting reflected off nearby surfaces. The other areas appear to be illuminated naturally by moonlight, starlight, or back-scattered light from the atmosphere. A 20-mm focal length was used to record the image.

Traveling west to east, the full moon, viewed from Merritt Island, Fla., at 10:18 p.m. EST, begins moving into the Earth's shadow, at the start of a lunar eclipse. Eclipses occur when the Sun, Earth and Moon line up. They are rare because the Moon usually passes above or below the imaginary line connecting Earth and the Sun. The Earth casts a shadow that the Moon can pass through -when it does, it is called a lunar eclipse. They can only occur when the moon is "full." During a total lunar eclipse the Moon takes on a dark red color because it is being lighted slightly by sunlight passing through the Earth's atmosphere and this light has the blue component preferentially scattered out (this is also why the sky appears blue from the surface of the Earth), leaving faint reddish light to illuminate the Moon during the eclipse
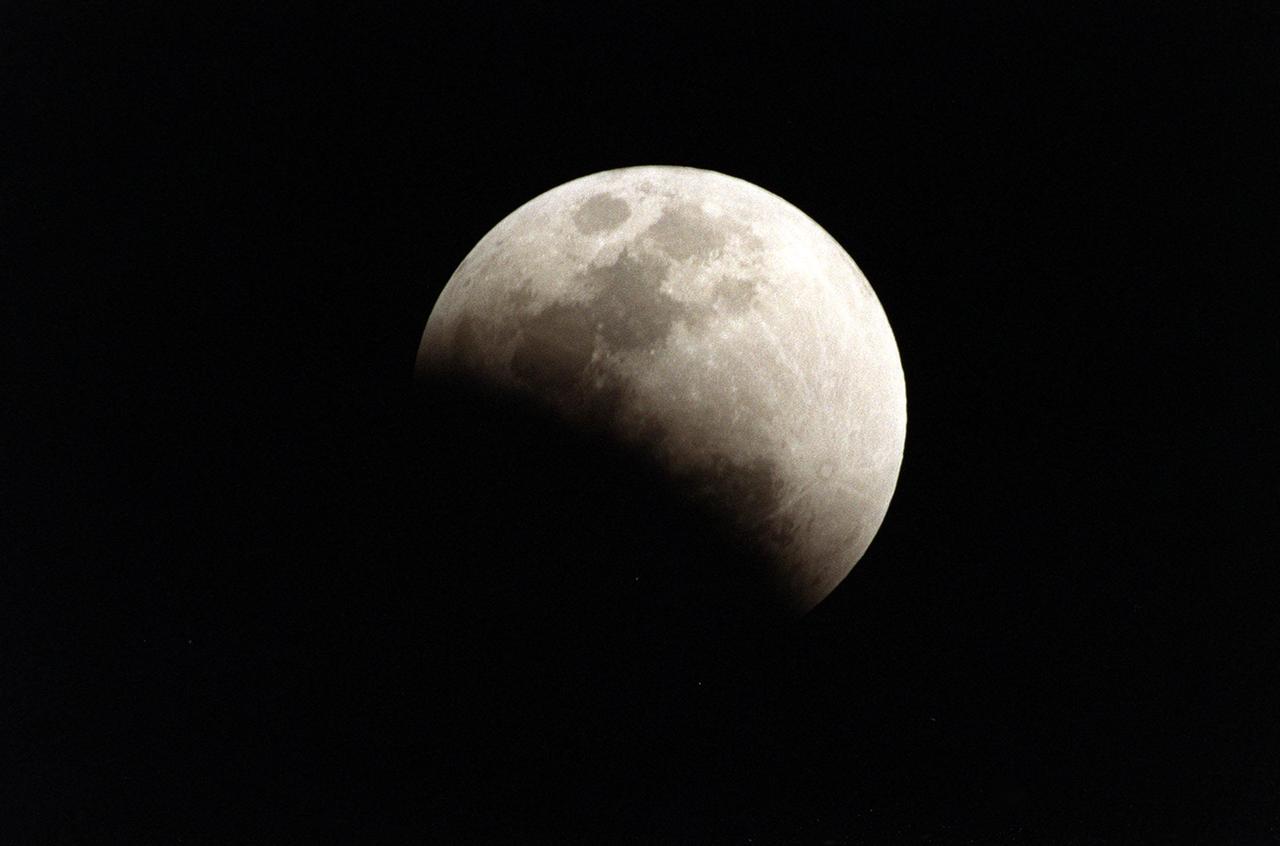
Traveling west to east, the full moon, viewed from Merritt Island, Fla., at 10:35 p.m. EST, moves into the Earth's shadow during a lunar eclipse. Eclipses occur when the Sun, Earth and Moon line up. They are rare because the Moon usually passes above or below the imaginary line connecting Earth and the Sun. The Earth casts a shadow that the Moon can pass through -when it does, it is called a lunar eclipse. They can only occur when the moon is "full." During a total lunar eclipse the Moon takes on a dark red color because it is being lighted slightly by sunlight passing through the Earth's atmosphere and this light has the blue component preferentially scattered out (this is also why the sky appears blue from the surface of the Earth), leaving faint reddish light to illuminate the Moon during the eclipse
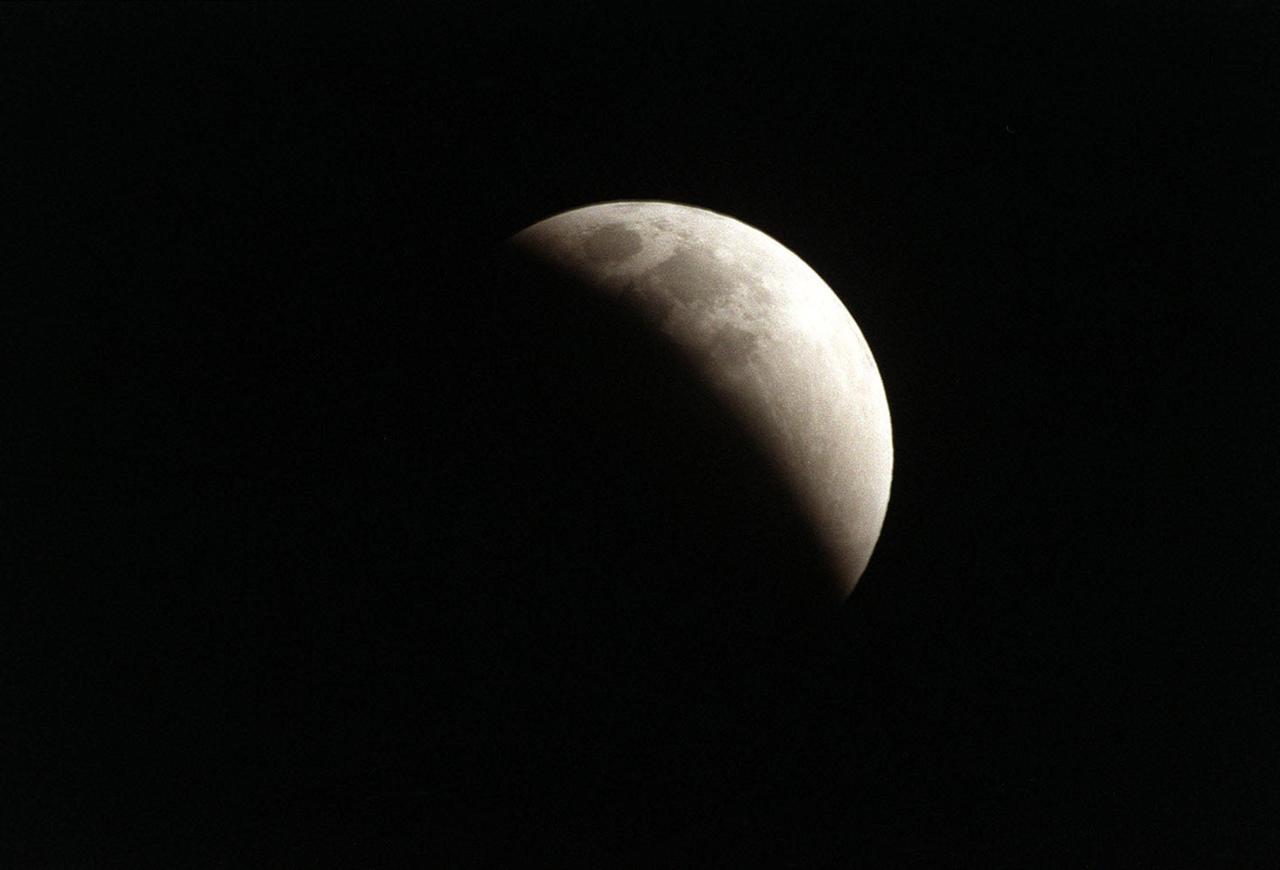
Viewed from Merritt Island, Fla., at 10:59 p.m. EST, the full moon, traveling west to east, is three-quarters of the way into the Earth's shadow during a lunar eclipse. Eclipses occur when the Sun, Earth and Moon line up. They are rare because the Moon usually passes above or below the imaginary line connecting Earth and the Sun. The Earth casts a shadow that the Moon can pass through -when it does, it is called a lunar eclipse. They can only occur when the moon is "full." During a total lunar eclipse the Moon takes on a dark red color because it is being lighted slightly by sunlight passing through the Earth's atmosphere and this light has the blue component preferentially scattered out (this is also why the sky appears blue from the surface of the Earth), leaving faint reddish light to illuminate the Moon during the eclipse
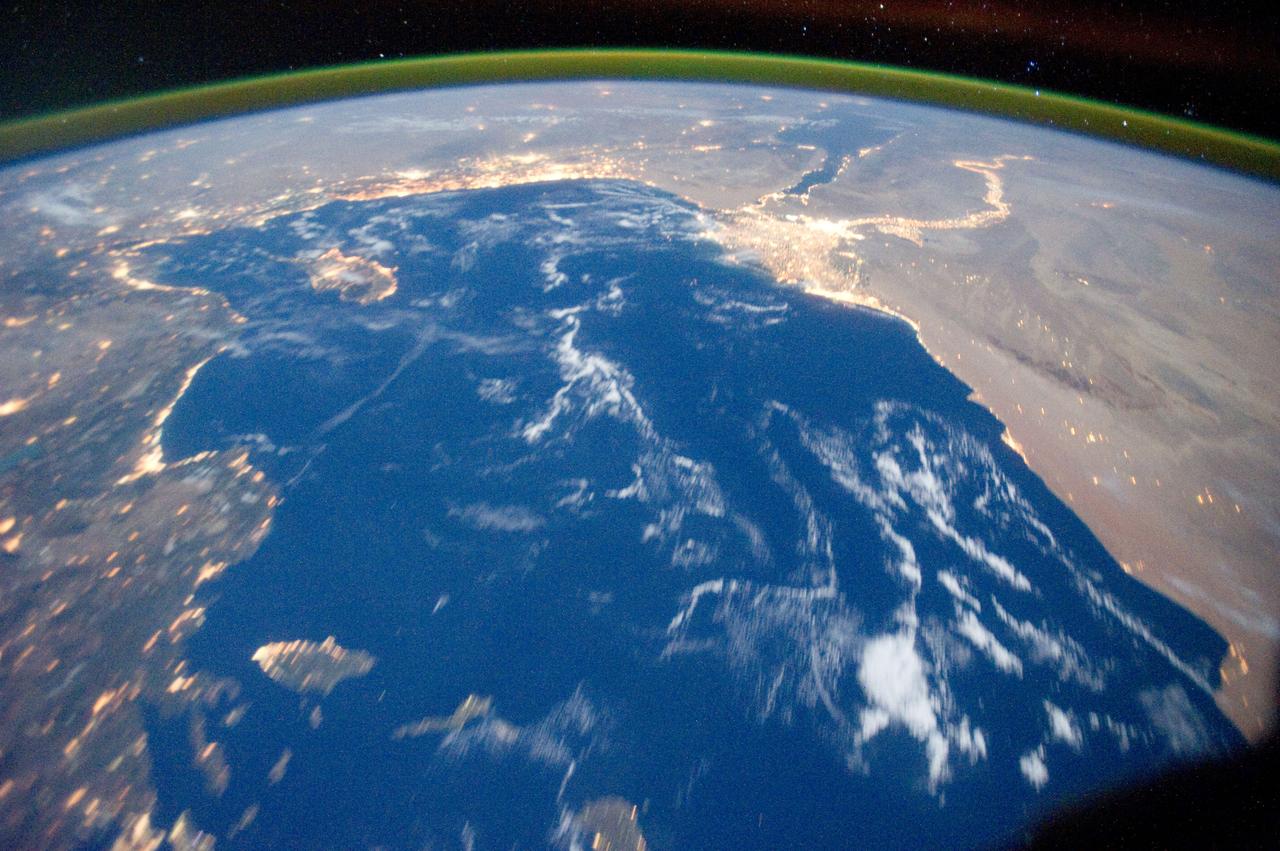
ISS029-E-031143 (15 Oct. 2011) --- One of the Expedition 29 crew members aboard the International Space Station recorded this oblique view showing the Mediterranean Sea area, including parts of Turkey, the Nile River and the river's delta, and the Sinai Peninsula, on Oct. 15, 2011. At first look, the image appears to have been photographed in daylight, but actually it was taken at 01:01:26 GMT. Some areas of the photo like the river and river delta appear as the brightest areas because of either man-made lighting (mostly incandescent) or man-made lighting reflected off nearby surfaces. The other areas appear to be illuminated naturally by moonlight, starlight, or back-scattered light from the atmosphere. A 20-mm focal length was used to record the image.
The night sides of Saturn and Tethys are dark places indeed. We know that shadows are darker areas than sunlit areas, and in space, with no air to scatter the light, shadows can appear almost totally black. Tethys (660 miles or 1,062 kilometers across) is just barely seen in the lower left quadrant of this image below the ring plane and has been brightened by a factor of three to increase its visibility. The wavy outline of Saturn's polar hexagon is visible at top center. This view looks toward the sunlit side of the rings from about 10 degrees above the ring plane. The image was taken with the Cassini spacecraft wide-angle camera on Jan. 15, 2015 using a spectral filter which preferentially admits wavelengths of near-infrared light centered at 752 nanometers. The view was obtained at a distance of approximately 1.5 million miles (2.4 million kilometers) from Saturn. Image scale is 88 miles (141 kilometers) per pixel. http://photojournal.jpl.nasa.gov/catalog/PIA18333

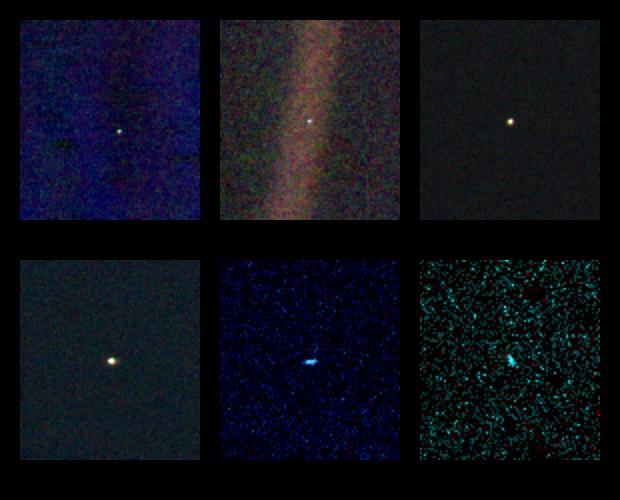
The cameras of Voyager 1 on Feb. 14, 1990, pointed back toward the sun and took a series of pictures of the sun and the planets, making the first ever portrait of our solar system as seen from the outside. In the course of taking this mosaic consisting of a total of 60 frames, Voyager 1 made several images of the inner solar system from a distance of approximately 4 billion miles and about 32 degrees above the ecliptic plane. Thirty-nine wide angle frames link together six of the planets of our solar system in this mosaic. Outermost Neptune is 30 times further from the sun than Earth. Our sun is seen as the bright object in the center of the circle of frames. The wide-angle image of the sun was taken with the camera's darkest filter (a methane absorption band) and the shortest possible exposure (5 thousandths of a second) to avoid saturating the camera's vidicon tube with scattered sunlight. The sun is not large as seen from Voyager, only about one-fortieth of the diameter as seen from Earth, but is still almost 8 million times brighter than the brightest star in Earth's sky, Sirius. The result of this great brightness is an image with multiple reflections from the optics in the camera. Wide-angle images surrounding the sun also show many artifacts attributable to scattered light in the optics. These were taken through the clear filter with one second exposures. The insets show the planets magnified many times. Narrow-angle images of Earth, Venus, Jupiter, Saturn, Uranus and Neptune were acquired as the spacecraft built the wide-angle mosaic. Jupiter is larger than a narrow-angle pixel and is clearly resolved, as is Saturn with its rings. Uranus and Neptune appear larger than they really are because of image smear due to spacecraft motion during the long (15 second) exposures. From Voyager's great distance Earth and Venus are mere points of light, less than the size of a picture element even in the narrow-angle camera. Earth was a crescent only 0.12 pixel in size. Coincidentally, Earth lies right in the center of one of the scattered light rays resulting from taking the image so close to the sun. http://photojournal.jpl.nasa.gov/catalog/PIA00451
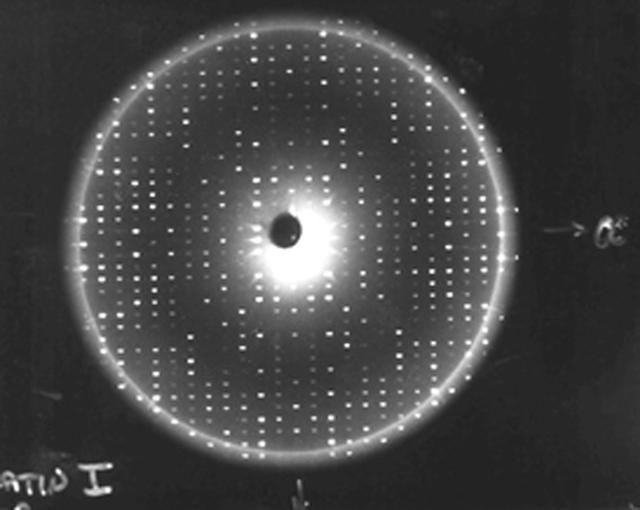
X-rays diffracted from a well-ordered protein crystal create sharp patterns of scattered light on film. A computer can use these patterns to generate a model of a protein molecule. To analyze the selected crystal, an X-ray crystallographer shines X-rays through the crystal. Unlike a single dental X-ray, which produces a shadow image of a tooth, these X-rays have to be taken many times from different angles to produce a pattern from the scattered light, a map of the intensity of the X-rays after they diffract through the crystal. The X-rays bounce off the electron clouds that form the outer structure of each atom. A flawed crystal will yield a blurry pattern; a well-ordered protein crystal yields a series of sharp diffraction patterns. From these patterns, researchers build an electron density map. With powerful computers and a lot of calculations, scientists can use the electron density patterns to determine the structure of the protein and make a computer-generated model of the structure. The models let researchers improve their understanding of how the protein functions. They also allow scientists to look for receptor sites and active areas that control a protein's function and role in the progress of diseases. From there, pharmaceutical researchers can design molecules that fit the active site, much like a key and lock, so that the protein is locked without affecting the rest of the body. This is called structure-based drug design.
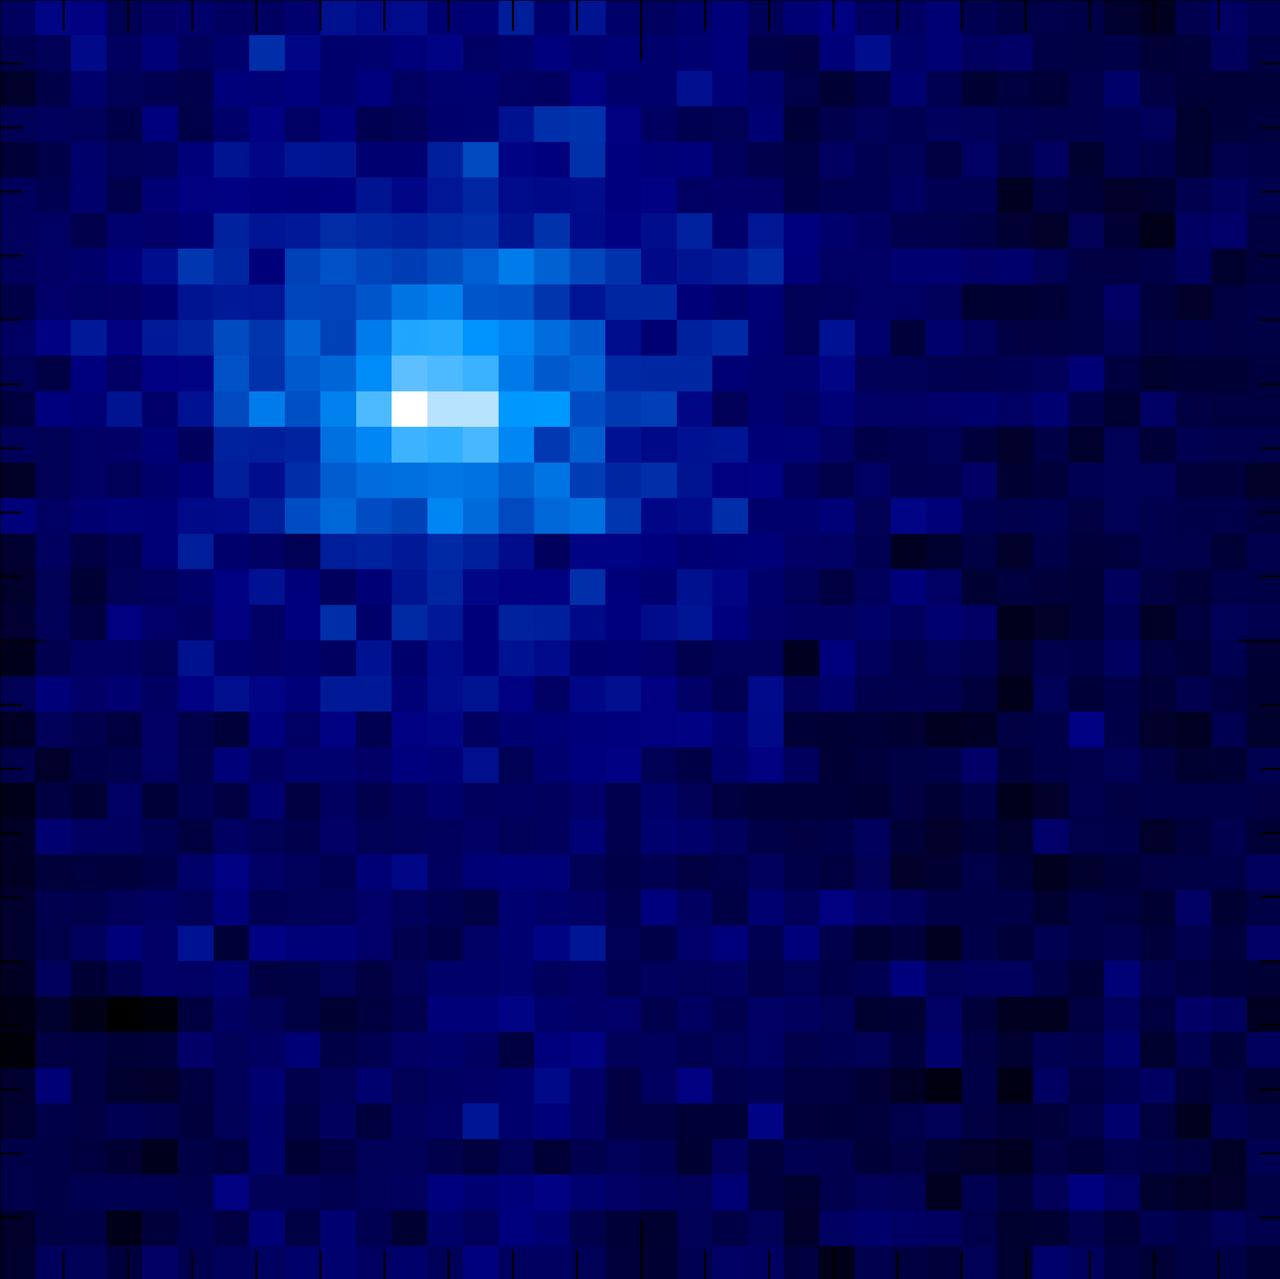
NASA’s Mars Atmosphere and Volatile Evolution (MAVEN) spacecraft obtained this ultraviolet image of hydrogen surrounding comet Siding Spring on Friday, Oct. 17, two days before the comet’s closest approach to Mars. The Imaging Ultraviolet Spectrograph (IUVS) instrument imaged the comet at a distance of 5.3 million miles (8.5 million kilometers). The image shows sunlight that has been scattered by atomic hydrogen, and is shown as blue in this false-color representation. Comets are surrounded by a huge cloud of atomic hydrogen because water (H2O) vaporizes from the icy nucleus, and solar ultraviolet light breaks it apart into hydrogen and oxygen. Hydrogen atoms scatter solar ultraviolet light, and it was this light that was imaged by the IUVS. Two observations were combined to create this image, after removing the foreground signal that results from sunlight being scattered from hydrogen surrounding Mars. The bulk of the scattered sunlight shows a cloud that was about a half degree across on the “sky” background, comparable in size to Earth’s moon as seen from Earth. Hydrogen was detected to as far as 93,000 miles (150,000 kilometers) away from the comet’s nucleus. The distance is comparable to the distance of the comet from Mars at its closest approach. Gas from the comet is likely to have hit Mars, and would have done so at a speed of 125,000 mph (56 kilometers/second. This gas may have disturbed the Mars atmosphere. Credit: Laboratory for Atmospheric and Space Physics, University of Colorado; NASA <b><a href="http://www.nasa.gov/audience/formedia/features/MP_Photo_Guidelines.html" rel="nofollow">NASA image use policy.</a></b> <b><a href="http://www.nasa.gov/centers/goddard/home/index.html" rel="nofollow">NASA Goddard Space Flight Center</a></b> enables NASA’s mission through four scientific endeavors: Earth Science, Heliophysics, Solar System Exploration, and Astrophysics. Goddard plays a leading role in NASA’s accomplishments by contributing compelling scientific knowledge to advance the Agency’s mission. <b>Follow us on <a href="http://twitter.com/NASAGoddardPix" rel="nofollow">Twitter</a></b> <b>Like us on <a href="http://www.facebook.com/pages/Greenbelt-MD/NASA-Goddard/395013845897?ref=tsd" rel="nofollow">Facebook</a></b> <b>Find us on <a href="http://instagram.com/nasagoddard?vm=grid" rel="nofollow">Instagram</a></b>
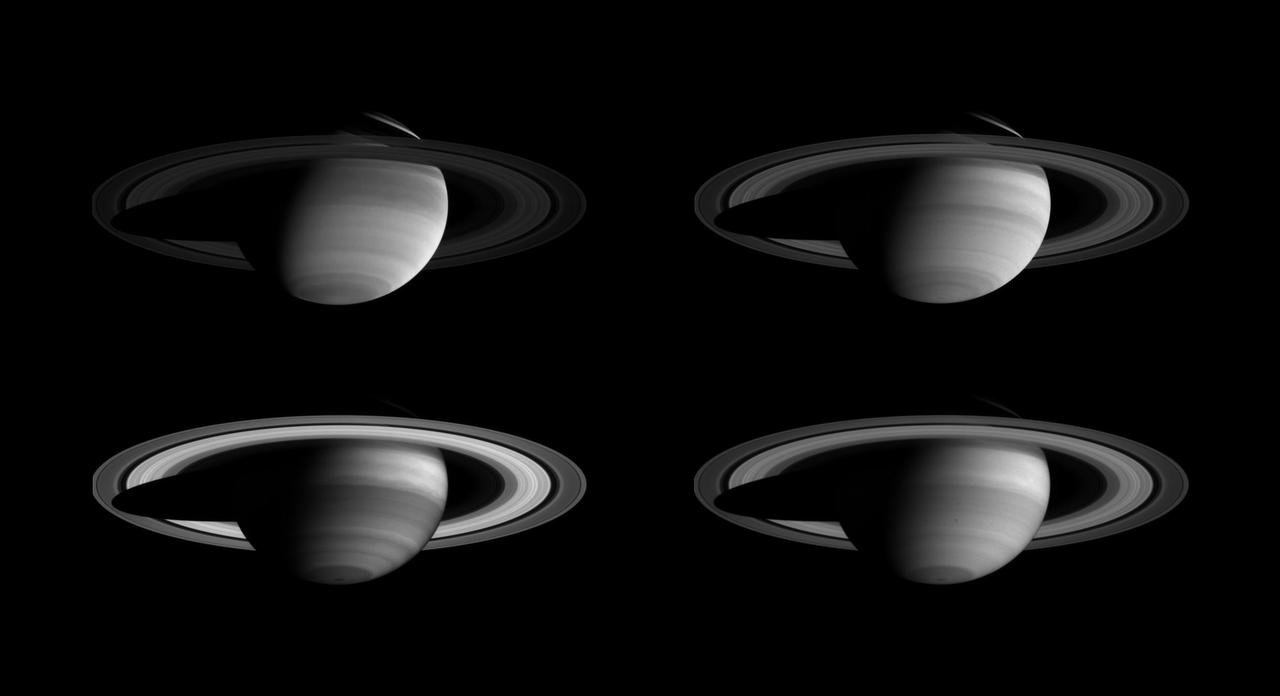
A montage of Cassini images, taken in four different regions of the spectrum from ultraviolet to near-infrared, demonstrates that there is more to Saturn than meets the eye. The pictures show the effects of absorption and scattering of light at different wavelengths by both atmospheric gas and clouds of differing heights and thicknesses. They also show absorption of light by colored particles mixed with white ammonia clouds in the planet's atmosphere. Contrast has been enhanced to aid visibility of the atmosphere. Cassini's narrow-angle camera took these four images over a period of 20 minutes on April 3, 2004, when the spacecraft was 44.5 million kilometers (27.7 million miles) from the planet. The image scale is approximately 267 kilometers (166 miles) per pixel. All four images show the same face of Saturn. In the upper left image, Saturn is seen in ultraviolet wavelengths (298 nanometers); at upper right, in visible blue wavelengths (440 nanometers); at lower left, in far red wavelengths just beyond the visible-light spectrum (727 nanometers; and at lower right, in near-infrared wavelengths (930 nanometers). The sliver of light seen in the northern hemisphere appears bright in the ultraviolet and blue (top images) and is nearly invisible at longer wavelengths (bottom images). The clouds in this part of the northern hemisphere are deep, and sunlight is illuminating only the cloud-free upper atmosphere. The shorter wavelengths are consequently scattered by the gas and make the illuminated atmosphere bright, while the longer wavelengths are absorbed by methane. Saturn's rings also appear noticeably different from image to image, whose exposure times range from two to 46 seconds. The rings appear dark in the 46-second ultraviolet image because they inherently reflect little light at these wavelengths. The differences at other wavelengths are mostly due to the differences in exposure times. http://photojournal.jpl.nasa.gov/catalog/PIA05388
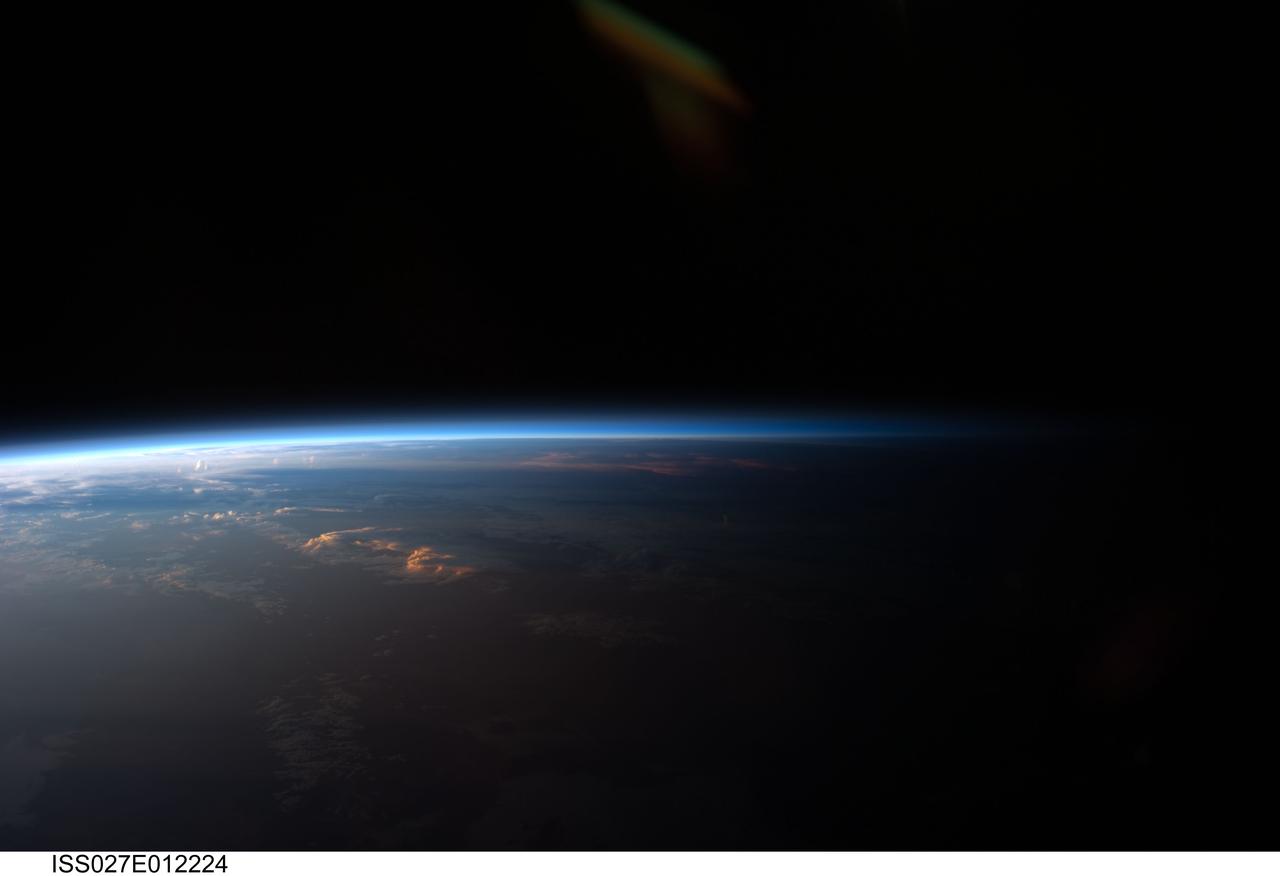
ISS027-E-012224 (12 April 2011) --- Sunset over western South America is featured in this image photographed by an Expedition 27 crew member on the International Space Station. Crew members onboard the space station see, on average, sixteen sunrises and sunsets during a 24-hour orbital period. Each changeover between day and night on the ground is marked by the terminator, or line separating the sunlit side of Earth from the side in darkness. While the terminator is conceptualized as a hard boundary?and is frequently presented as such in graphics and visualizations?in reality the boundary between light and dark is diffuse due to scattering of light by Earth?s atmosphere. This zone of diffuse lighting is experienced as dusk or twilight on the ground ? while the sun is no longer visible, some illumination is still present due to light scattering over the local horizon. The terminator is visible in this photograph trending across the image from lower left to upper right. This panoramic view across central South America, looking towards the northeast, was acquired at approximately 7:37 p.m. local time. Layers of Earth?s atmosphere, colored bright white to deep blue, are visible extending across the horizon (or limb). The highest cloud tops have a reddish glow from the direct light of the setting sun while lower clouds are in twilight. The Salar de Coipasa, a large salt lake in Bolivia, is dimly visible on the night side of the terminator. The salar provides a geographic reference point that allows the location and viewing orientation of the image to be determined.
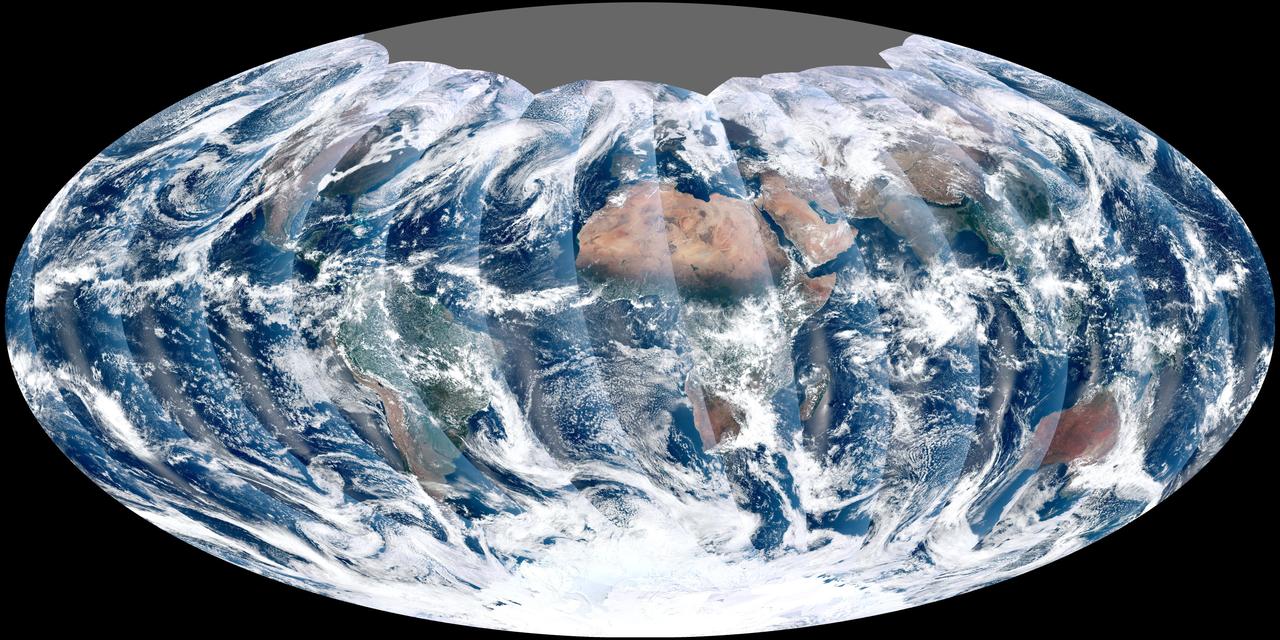
NASA acquired November 24, 2011 From its vantage 824 kilometers (512 miles) above Earth, the Visible Infrared Imager Radiometer Suite (VIIRS) on the NPOESS Preparatory Project (NPP) satellite gets a complete view of our planet every day. This image from November 24, 2011, is the first complete global image from VIIRS. The NPP satellite launched on October 28, 2011, and VIIRS acquired its first measurements on November 21. To date, the images are preliminary, used to gauge the health of the sensor as engineers continue to power it up for full operation. Rising from the south and setting in the north on the daylight side of Earth, VIIRS images the surface in long wedges measuring 3,000 kilometers (1,900 miles) across. The swaths from each successive orbit overlap one another, so that at the end of the day, the sensor has a complete view of the globe. The Arctic is missing because it is too dark to view in visible light during the winter. The NPP satellite was placed in a Sun-synchronous orbit, a unique path that takes the satellite over the equator at the same local (ground) time in every orbit. So, when NPP flies over Kenya, it is about 1:30 p.m. on the ground. When NPP reaches Gabon—about 3,000 kilometers to the west—on the next orbit, it is close to 1:30 p.m. on the ground. This orbit allows the satellite to maintain the same angle between the Earth and the Sun so that all images have similar lighting. The consistent lighting is evident in the daily global image. Stripes of sunlight (sunglint) reflect off the ocean in the same place on the left side of every swath. The consistent angle is important because it allows scientists to compare images from year to year without worrying about extreme changes in shadows and lighting. The image also shows a band of haze along the right side of every orbit swath. When light travels through the atmosphere, it bounces off particles or scatters, making the atmosphere look hazy. The scattering effect is most pronounced along the edge of the swath, where the sensor is looking at an angle through more of the atmosphere. Scientists can correct for this scattering effect, but need measurements from a range of wavelengths to do so. The degree to which light scatters depends partly on the wavelength of the light. Blue light scatters more than red light, for example, which is why the sky is blue. VIIRS measures 22 different wavelengths of light, but not all of the sensor’s detectors are operating at peak performance yet. Those measuring thermal infrared light are not yet cold enough to collect reliable measurements. Once VIIRS begins full operations, it will produce a range of measurements from ocean temperature to clouds to the locations of fires. These measurements will help extend the record from earlier sensors like the Moderate Resolution Imaging Spectroradiometer (MODIS). VIIRS is very similar to MODIS, but flies at a higher altitude to measure the whole planet without gaps. (MODIS daily measurements have gaps at the equator. See the MODIS image from November 24.) VIIRS also sees the Earth in less detail, 375 meters per pixel, compared to 250 meters per pixel for MODIS. Image by NASA’s NPP Land Product Evaluation and Testing Element. Caption by Holli Riebeek. Credit: <b><a href="http://www.earthobservatory.nasa.gov/" rel="nofollow"> NASA Earth Observatory</a></b> <b><a href="http://www.nasa.gov/audience/formedia/features/MP_Photo_Guidelines.html" rel="nofollow">NASA image use policy.</a></b> <b><a href="http://www.nasa.gov/centers/goddard/home/index.html" rel="nofollow">NASA Goddard Space Flight Center</a></b> enables NASA’s mission through four scientific endeavors: Earth Science, Heliophysics, Solar System Exploration, and Astrophysics. Goddard plays a leading role in NASA’s accomplishments by contributing compelling scientific knowledge to advance the Agency’s mission. <b>Follow us on <a href="http://twitter.com/NASA_GoddardPix" rel="nofollow">Twitter</a></b> <b>Like us on <a href="http://www.facebook.com/pages/Greenbelt-MD/NASA-Goddard/395013845897?ref=tsd" rel="nofollow">Facebook</a></b> <b>Find us on <a href="http://instagrid.me/nasagoddard/?vm=grid" rel="nofollow">Instagram</a></b>
STS047-54-018 (12-20 Sept. 1992) --- The colors in this photograph provide insight into the relative density of the atmosphere. The crew members had many opportunities to witness sunrises and sunsets, considering they orbit the Earth every 90 minutes, but few, they said, compared to this scene. It captures the silhouette of several mature thunderstorms with their cirrus anvil tops spreading out against the tropopause (the top of the lowest layer of Earth's atmosphere) at sunset. The lowest layer (troposphere) is the densest and refracts light at the red end of the visible spectrum (7,400 Angstroms), while the blues (4,000 Angstroms) are separated in the least dense portion of the atmosphere (middle and upper atmosphere, or stratosphere and mesosphere). Several layers of blue can be seen. NASA scientists studying the photos believe this stratification to be caused by the scattering of light by particulate trapped in the stratosphere and mesosphere particulate that generally originate from volcanic eruptions, such as those of Mt. Pinatubo in the Philippines and, most recently, Mt. Spurr in Alaska.

Seen shortly after local Martian sunrise, clouds gather in the summit pit, or caldera, of Pavonis Mons, a giant volcano on Mars, in this image from the Thermal Emission Imaging System (THEMIS) on NASA's Mars Odyssey orbiter. The clouds are mostly made of ice crystals. They appear blue in the image because the cloud particles scatter blue light more strongly than other colors. Pavonis Mons stands about nine miles (14 kilometers) high, and the caldera spans about 29 miles (47 kilometers) wide. This image was made by THEMIS through three of its visual-light filters plus a near-infrared filter, and it is approximately true in color. THEMIS and other instruments on Mars Odyssey have been studying Mars from orbit since 2001. http://photojournal.jpl.nasa.gov/catalog/PIA19675

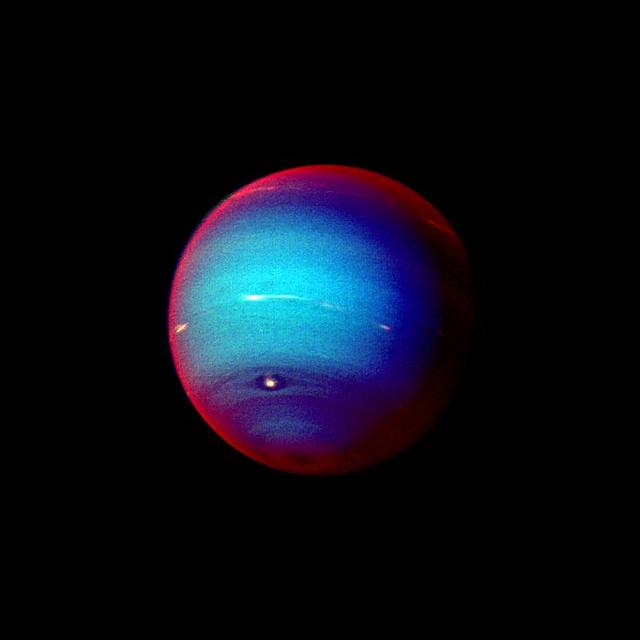
This picture of Neptune was produced from images taken through the ultraviolet, violet and green filters of the Voyager 2 wide-angle camera. This 'false' color image has been made to show clearly details of the cloud structure and to paint clouds located at different altitudes with different colors. Dark, deeplying clouds tend to be masked in the ultraviolet wavelength since overlying air molecules are particularly effective in scattering sunlight there which brightens the sky above them. Such areas appear dark blue in this photo. The Great Dark Spot (GDS) and the high southern latitudes have a deep bluish cast in this image, indication they are regions where visible light (but not ultraviolet light) may penetrate to a deeper layer of dark cloud or haze in Neptune's atmosphere. Conversely, the pinkish clouds may be positioned at high altitudes.
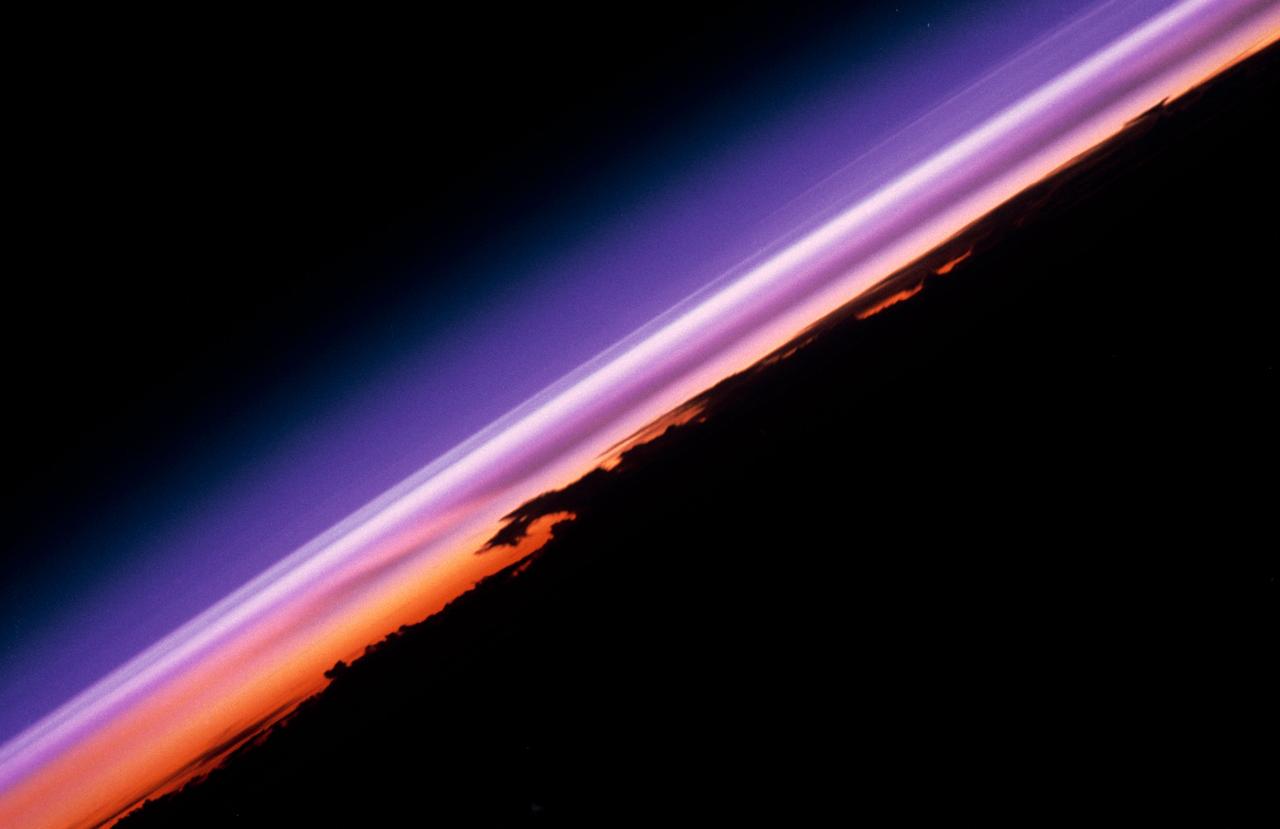
STS047-54-016 (12 - 20 Sept 1992) --- The colors in this photograph provide insight into the relative density of the atmosphere. The crew members had many opportunities to witness sunrises and sunsets, considering they orbit the Earth every 90 minutes, but few, they said, compared to this scene. It captures the silhouette of several mature thunderstorms with their cirrus anvil tops spreading out against the tropopause (the top of the lowest layer of Earth's atmosphere) at sunset. The lowest layer (troposphere) is the densest and refracts light at the red end of the visible spectrum (7,400 Angstroms), while the blues (4,000 Angstroms) are separated in the least dense portion of the atmosphere (middle and upper atmosphere, or stratosphere and mesosphere). Several layers of blue can be seen. NASA scientists studying the photos believe this stratification to be caused by the scattering of light by particulate trapped in the stratosphere and mesosphere particulate that generally originate from volcanic eruptions, such as those of Mt. Pinatubo in the Philippines and, most recently, Mt. Spurr in Alaska.

This narrow-angle color image of the Earth, dubbed Pale Blue Dot, is a part of the first ever 'portrait' of the solar system taken by NASA’s Voyager 1. The spacecraft acquired a total of 60 frames for a mosaic of the solar system from a distance of more than 4 billion miles from Earth and about 32 degrees above the ecliptic. From Voyager's great distance Earth is a mere point of light, less than the size of a picture element even in the narrow-angle camera. Earth was a crescent only 0.12 pixel in size. Coincidentally, Earth lies right in the center of one of the scattered light rays resulting from taking the image so close to the sun. This blown-up image of the Earth was taken through three color filters -- violet, blue and green -- and recombined to produce the color image. The background features in the image are artifacts resulting from the magnification. http://photojournal.jpl.nasa.gov/catalog/PIA00452
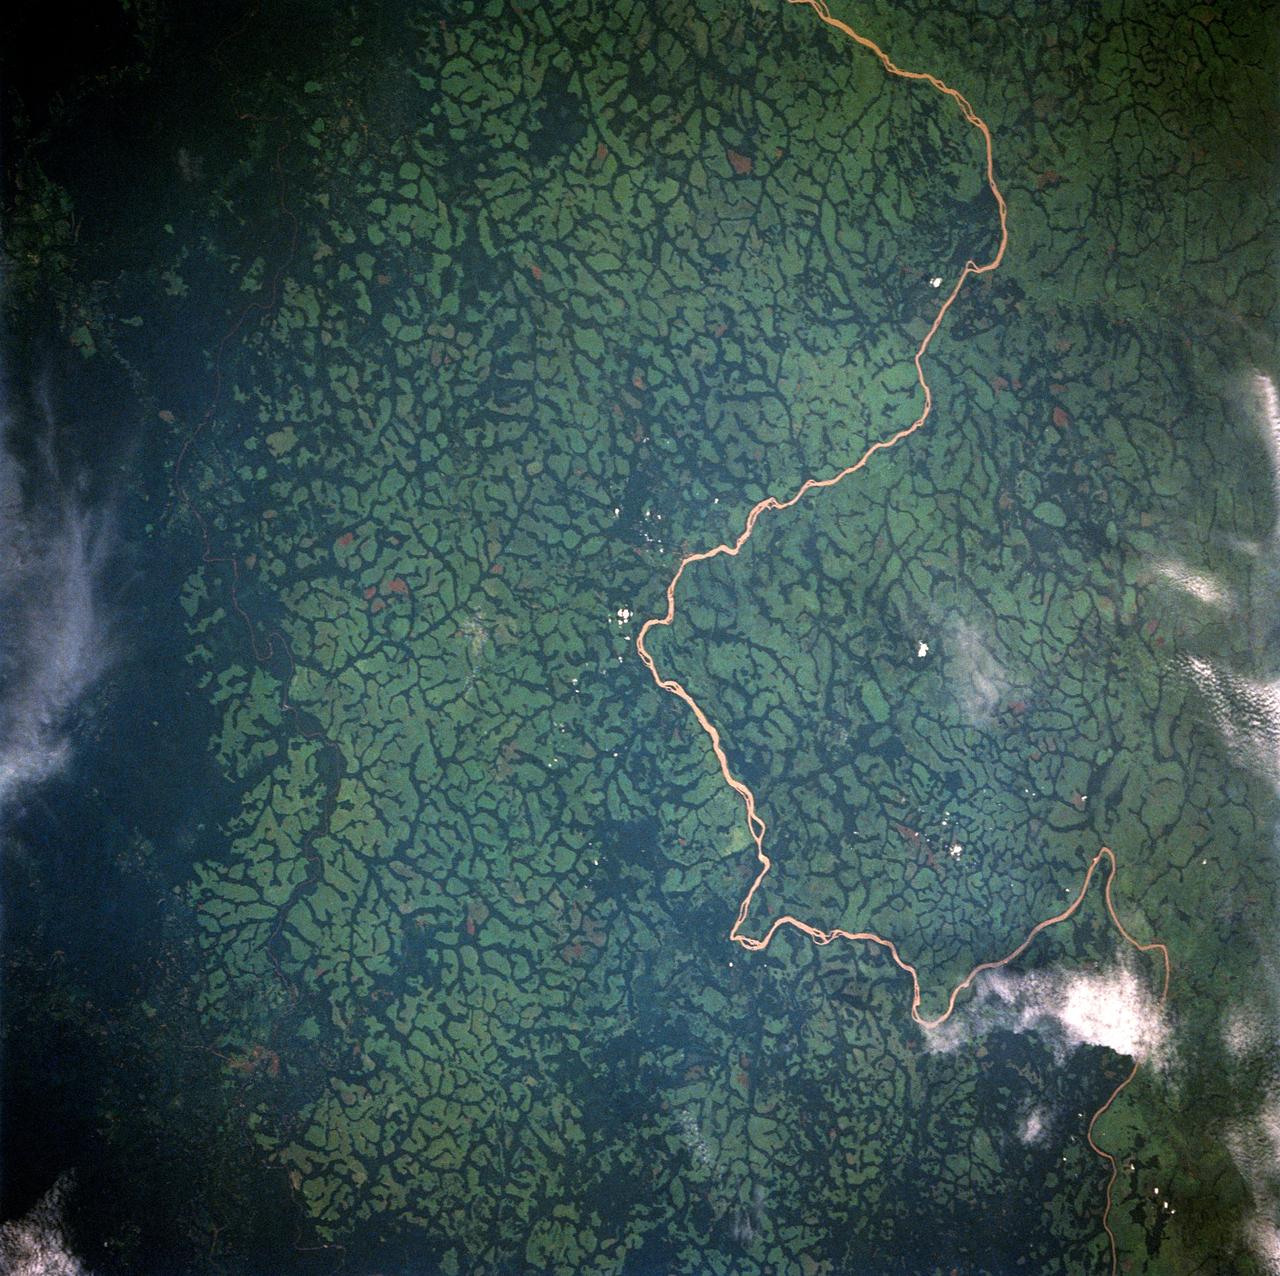
STS049-91-079 (7 - 16 May 1992) --- This 70mm frame, photographed from the Earth-orbiting Space Shuttle Endeavour, features a dendritic drainage pattern in Zaire. Cleared pasture land shows light green in this color photograph, in contrast to the dark, closed-canopy forest of Zaire. Remnant woodland along minor streams indicates the intricate drainage network of this hilly region. Scattered vegetation-free spots show the deep red, tropical soil of the region. The sediment-laden stream is the Vele River just west of the village of Niangara. A crew member used a 70mm handheld Hasselblad camera with a 250mm lens to record the image.
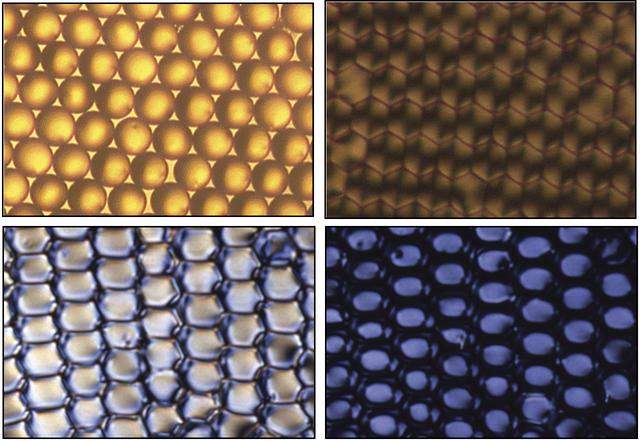
These images, from David Weitz’s liquid crystal research, show ordered uniform sized droplets (upper left) before they are dried from their solution. After the droplets are dried (upper right), they are viewed with crossed polarizers that show the deformation caused by drying, a process that orients the bipolar structure of the liquid crystal within the droplets. When an electric field is applied to the dried droplets (lower left), and then increased (lower right), the liquid crystal within the droplets switches its alignment, thereby reducing the amount of light that can be scattered by the droplets when a beam is shone through them.
This relatively fresh, shallowly incised valley was once filled with water and/or ice and flowed to the west toward a large, local depression in northern Arabia Terra (36.5 degrees north, 0.3 degrees east). This type of valley is younger and distinct in appearance relative to the ancient valley networks that formed in the Martian highlands. Most fresh, shallow valleys like this one often appear as scattered and isolated or sparsely branched networks of individual valleys in the mid-latitudes and equatorial regions of Mars. The floor of the channel within this broader valley is covered with light-toned transverse aeolian ridges (3 kilometers across). http://photojournal.jpl.nasa.gov/catalog/PIA19301
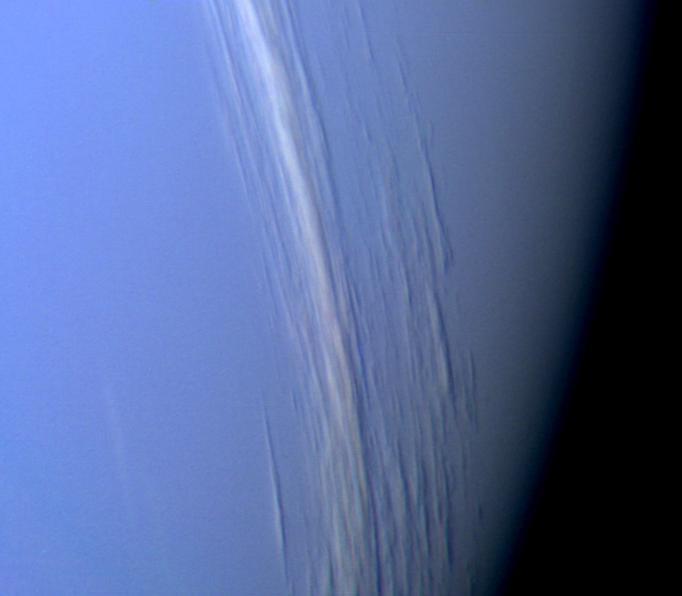
NASA's Voyager 2 high resolution color image, taken 2 hours before closest approach, provides obvious evidence of vertical relief in Neptune's bright cloud streaks. These clouds were observed at a latitude of 29 degrees north near Neptune's east terminator. The linear cloud forms are stretched approximately along lines of constant latitude and the sun is toward the lower left. The bright sides of the clouds which face the sun are brighter than the surrounding cloud deck because they are more directly exposed to the sun. Shadows can be seen on the side opposite the sun. These shadows are less distinct at short wavelengths (violet filter) and more distinct at long wavelengths (orange filter). This can be understood if the underlying cloud deck on which the shadow is cast is at a relatively great depth, in which case scattering by molecules in the overlying atmosphere will diffuse light into the shadow. Because molecules scatter blue light much more efficiently than red light, the shadows will be darkest at the longest (reddest) wavelengths, and will appear blue under white light illumination. The resolution of this image is 11 kilometers (6.8 miles per pixel) and the range is only 157,000 kilometers (98,000 miles). The width of the cloud streaks range from 50 to 200 kilometers (31 to 124 miles), and their shadow widths range from 30 to 50 kilometers (18 to 31 miles). Cloud heights appear to be of the order of 50 kilometers (31 miles). This corresponds to 2 scale heights. http://photojournal.jpl.nasa.gov/catalog/PIA00058
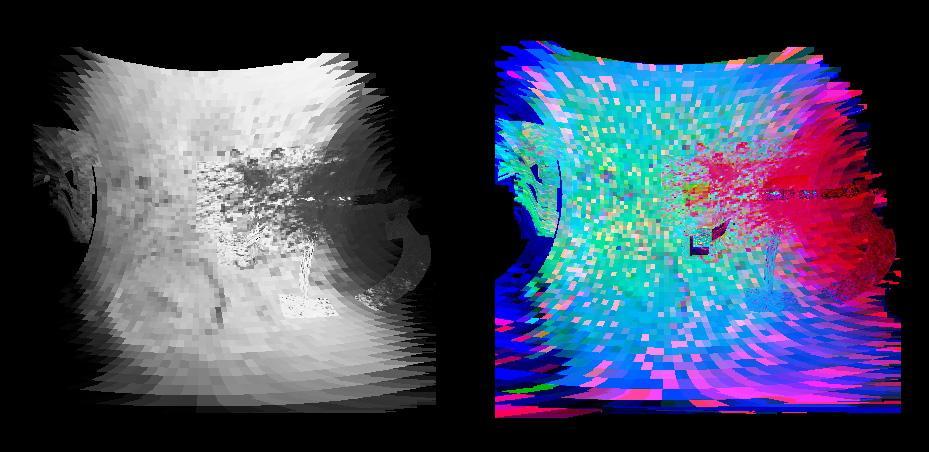
Cassini made a close flyby of Saturn's moon Iapetus on Sept. 10, 2007, and the visual and infrared mapping spectrometer obtained these images during that event. These two images show a higher resolution version of the equatorial region shown in PIA10010. The equatorial region includes the equatorial bulge which shows no differences in these compositions compared to surrounding regions. The color image on the right shows the results of mapping for three components of Iapetus' surface: carbon dioxide that is trapped or adsorbed in the surface (red), water in the form of ice (green), and a newly-discovered effect due to trace amount of dark particles in the ice creating what scientists call Rayleigh scattering (blue). The Rayleigh scattering effect is the main reason why the Earth's sky appears blue. There is a complex transition zone from the dark region, on the right, which is high in carbon dioxide, to the more ice-rich region on the left. Some crater floors are filled with carbon dioxide-rich dark material. As the ice becomes cleaner to the left, the small dark particles become more scattered and increase the Rayleigh scattering effect, again indicative of less than 2 percent dark sub-0.5-micron particles. The visual and infrared mapping spectrometer is like a digital camera, but instead of using three colors, it makes images in 352 colors, or wavelengths, from the ultraviolet to the near-infrared. The many wavelengths produce a continuous spectrum in each pixel, and these spectra measure how light is absorbed by different materials. By analyzing the absorptions expressed in each pixel, a map of the composition at each location on the moon can be constructed. http://photojournal.jpl.nasa.gov/catalog/PIA10011
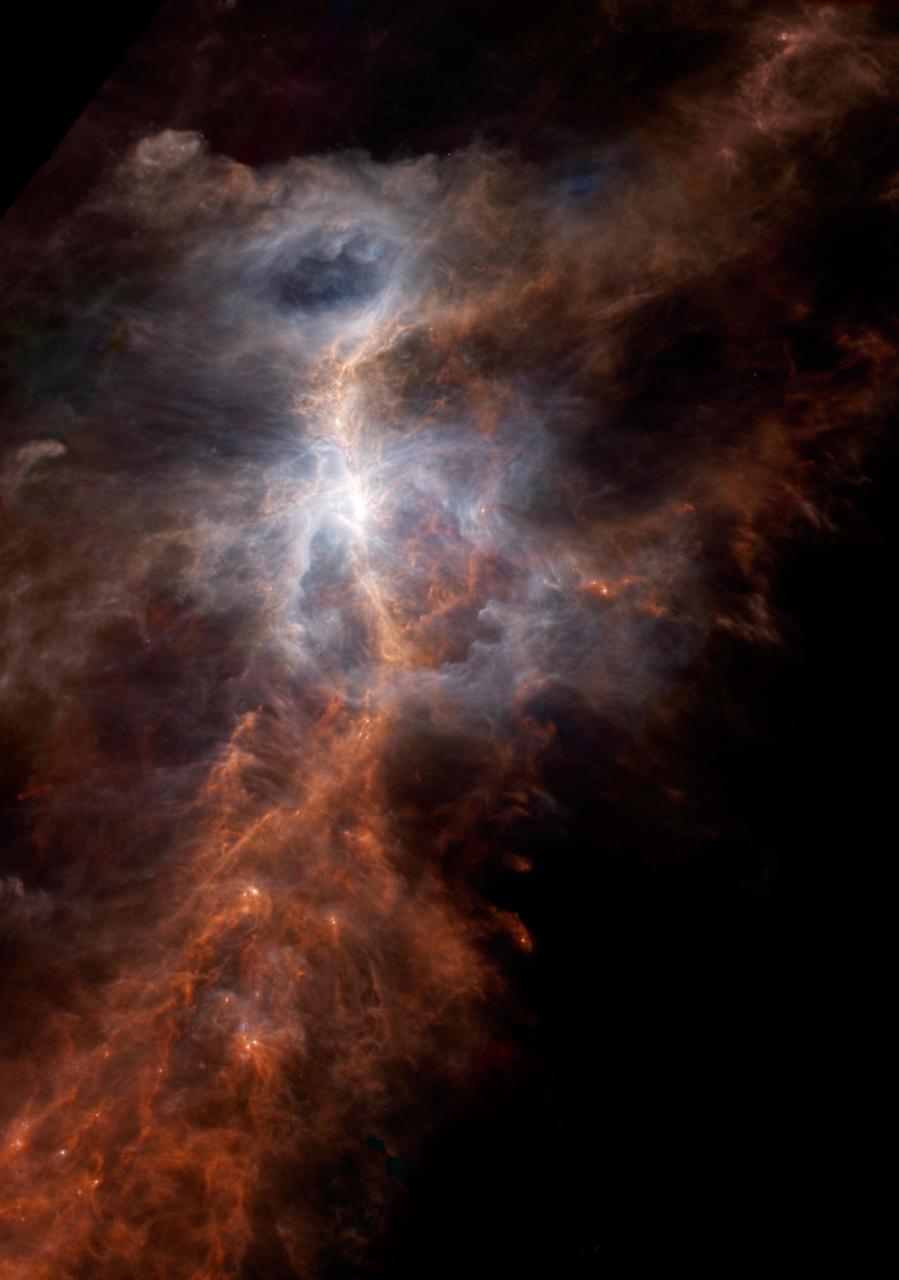
The dusty side of the Sword of Orion is illuminated in this striking infrared image from the European Space Agency's Hershel Space Observatory. This immense nebula is the closest large region of star formation, situated about 1,500 light years away in the constellation of Orion. The parts that are easily observed in visible light, known alternatively as the Orion Nebula or Messier 42, correspond to the light blue regions. This is the glow from the warmest dust, illuminated by clusters of hot stars that have only recently been born in this chaotic region. The red spine of material running from corner to corner reveals colder, denser filaments of dust and gas that are scattered throughout the Orion nebula. In visible light this would be a dark, opaque feature, hiding the reservoir of material from which stars have recently formed and will continue to form in the future. Herschel data from the PACS instrument observations, at wavelengths of 100 and 160 microns, is displayed in blue and green, respectively, while SPIRE 250-micron data is shown in red. Within the inset image, the emission from ionized carbon atoms (C+), overlaid in yellow, was isolated and mapped out from spectrographic data obtained by the HIFI instrument. http://photojournal.jpl.nasa.gov/catalog/PIA21073

This color image of the sun, Earth and Venus was taken by the Voyager 1 spacecraft Feb. 14, 1990, when it was approximately 32 degrees above the plane of the ecliptic and at a slant-range distance of approximately 4 billion miles. It is the first -- and may be the only -- time that we will ever see our solar system from such a vantage point. The image is a portion of a wide-angle image containing the sun and the region of space where the Earth and Venus were at the time with two narrow-angle pictures centered on each planet. The wide-angle was taken with the camera's darkest filter (a methane absorption band), and the shortest possible exposure (5 thousandths of a second) to avoid saturating the camera's vidicon tube with scattered sunlight. The sun is not large in the sky as seen from Voyager's perspective at the edge of the solar system but is still eight million times brighter than the brightest star in Earth's sky, Sirius. The image of the sun you see is far larger than the actual dimension of the solar disk. The result of the brightness is a bright burned out image with multiple reflections from the optics in the camera. The "rays" around the sun are a diffraction pattern of the calibration lamp which is mounted in front of the wide angle lens. The two narrow-angle frames containing the images of the Earth and Venus have been digitally mosaiced into the wide-angle image at the appropriate scale. These images were taken through three color filters and recombined to produce a color image. The violet, green and blue filters were used; exposure times were, for the Earth image, 0.72, 0.48 and 0.72 seconds, and for the Venus frame, 0.36, 0.24 and 0.36, respectively. Although the planetary pictures were taken with the narrow-angle camera (1500 mm focal length) and were not pointed directly at the sun, they show the effects of the glare from the nearby sun, in the form of long linear streaks resulting from the scattering of sunlight off parts of the camera and its sun shade. From Voyager's great distance both Earth and Venus are mere points of light, less than the size of a picture element even in the narrow-angle camera. Earth was a crescent only 0.12 pixel in size. Coincidentally, Earth lies right in the center of one of the scattered light rays resulting from taking the image so close to the sun. Detailed analysis also suggests that Voyager detected the moon as well, but it is too faint to be seen without special processing. Venus was only 0.11 pixel in diameter. The faint colored structure in both planetary frames results from sunlight scattered in the optics. http://photojournal.jpl.nasa.gov/catalog/PIA00450
A mosaic of four images taken through the clear filter (610 nanometers) of the solid state imaging (CCD) system aboard NASA's Galileo spacecraft on November 8, 1996, at a resolution of approximately 46 kilometers (28.5 miles) per picture element (pixel) along Jupiter's rings. Because the spacecraft was only about 0.5 degrees above the ring plane, the image is highly foreshortened in the vertical direction. The images were obtained when Galileo was in Jupiter's shadow, peering back toward the Sun; the ring was approximately 2.3 million kilometers (1.4 million miles) away. The arc on the far right of the image is produced when sunlight is scattered by small particles comprising Jupiter's upper atmospheric haze. The ring also efficiently scatters light, indicating that much of its brightness is due to particles that are microns or less in diameter. Such small particles are believed to have human-scale lifetimes, i.e., very brief compared to the solar system's age. http://photojournal.jpl.nasa.gov/catalog/PIA00701
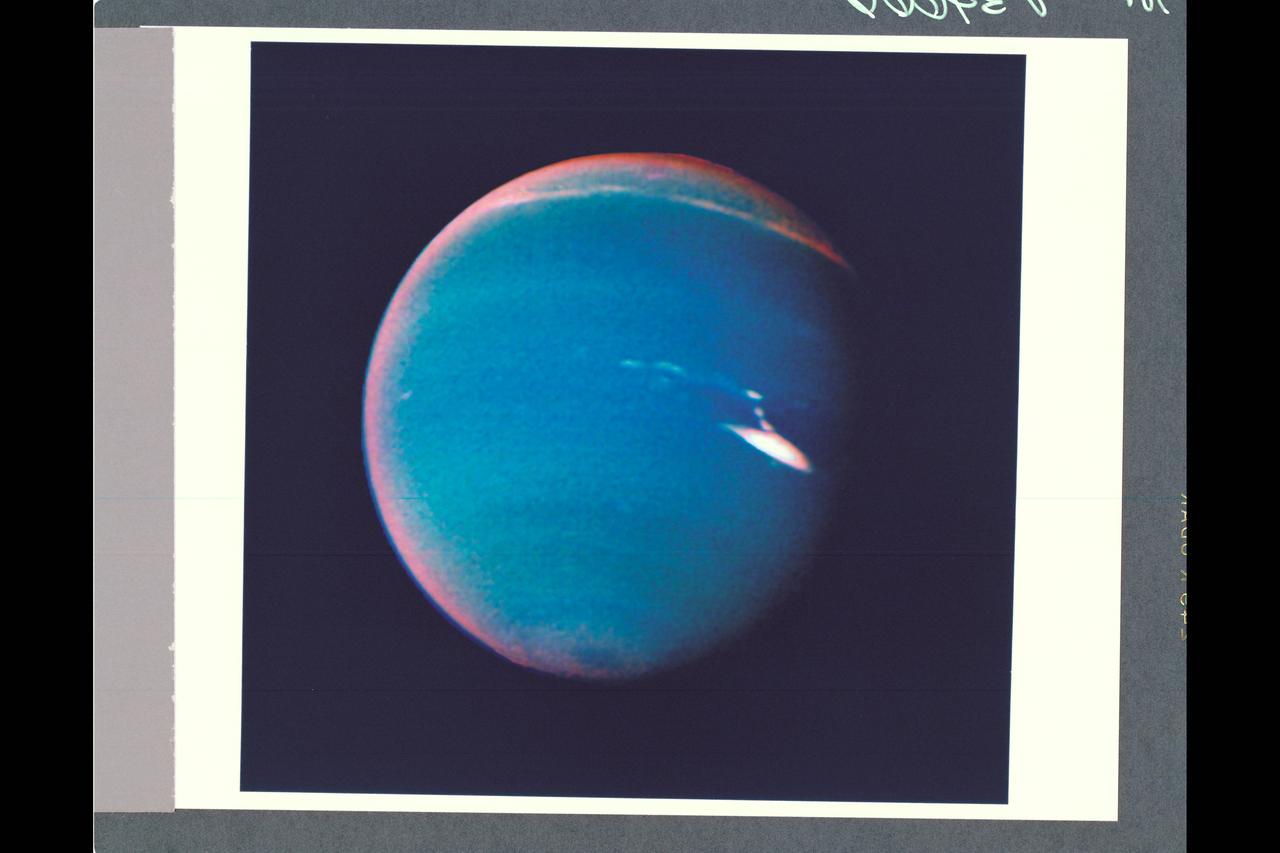
This false color photograph of Neptune was made from NASA's Voyager 2 images taken through three filters: blue, green, and a filter that passes light at a wavelength that is absorbed by methane gas. Thus, regions that appear white or bright red are those that reflect sunlight before it passes through a large quantity of methane. The image reveals the presence of a ubiquitous haze that covers Neptune in a semitransparent layer. Near the center of the disk, sunlight passes through the haze and deeper into the atmosphere, where some wavelengths are absorbed by methane gas, causing the center of the image to appear less red. Near the edge of the planet, the haze scatters sunlight at higher altitude, above most of the methane, causing the bright red edge around the planet. By measuring haze brightness at several wavelengths, scientists are able to estimate the thickness of the haze and its ability to scatter sunlight. The image is among the last full disk photos that Voyager 2 took before beginning its endless journey into interstellar space. http://photojournal.jpl.nasa.gov/catalog/PIA00057
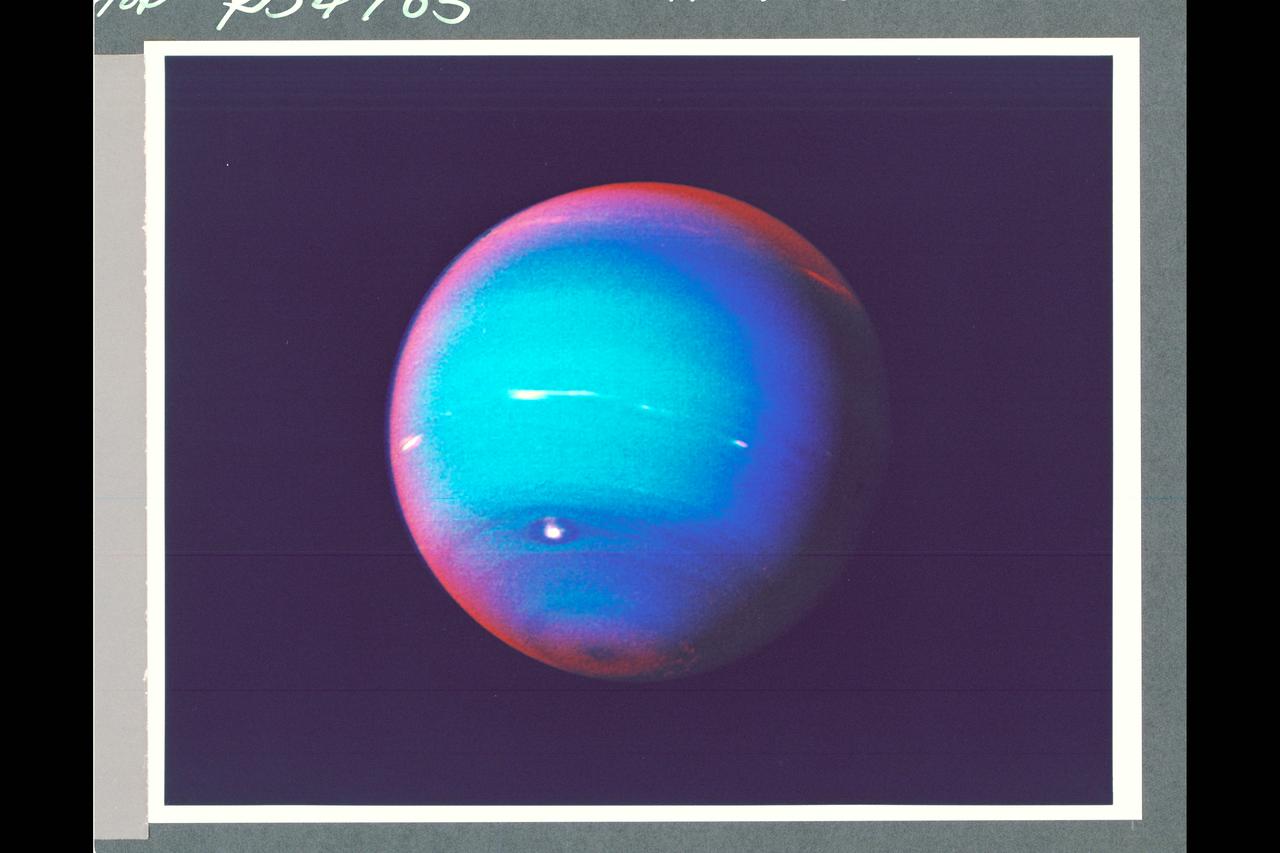
P-34705 This false-color photograph of Neptune was made from Voyager 2 images taken through three filters: blue, green, and a filter that passes light at a wavelength that is absorbed by methane gas. Thus, regions that appear white or bright red are those that reflect sunlight before it passes through a large quantity of methane. The image reveals the presence of a ubiquitous haze that covers Neptune in a semitransparent layer. Near the center of the disk, sunlight passes through the haze and deeper into the atmosphere, where some wavelenghths are absorbed by methane gas, causing the center to appear less red. Near the edge of the planet, the haze scatters sunlight at a higher altitude, above most of the methane, causing the bright red edge around the planet. By measuring haze brightness at several wavelengths, scientists are able to estimate the thickness of the haze and its ability to scatter sunlight. The image is among the last of the full-disk photos that Voyager 2 took before beginning its endless journey into interstellar space.
P-34709 Range: 157,000 kilometers (98,000 miles) This Voyager 2 high resolution color image, taken 2 hours before closest approach, provides obvious evidence of vertical relief in Neptune's bright cloud streaks. These clouds were observed at a latitude of 29° N near Neptune's east terminator. The linear cloud forms are stretched approximately along lines of constant latitude and the sun is toward the lower left. The bright sides of the clouds that face the sun are brighter than the surrounding cloud deck because they are more directly exposed to the sun. Shadows can be seen on the side directly opposite the sun. These shadows are less distinct at short wavelengths (violet filter) and more distinct at long wavelengths (orange filter). This can be understood if the underlying cloud deck on which the shadow is cast is at a relatively great depth, in which case scattering by molecules in the overlying atmopsphere will diffuse light into the shadow. Because molecules scatter blue light much more efficiently than red light, the shadows will be darkest at the longest (reddest) wavelengths, and will appear blue under white illumination. The resolution of this image is 11 kilometers (6.8 miles per pixel). The width of the cloud streaks range from 50 to 200 kilometers (31 to 124 miles), and their shadow widths range from 30 to 50 kilometers (18 to 31 miles). Cloud heights appear to be of the order of 50 kilometers (31 miles). This corresponds to 2 scale heights.
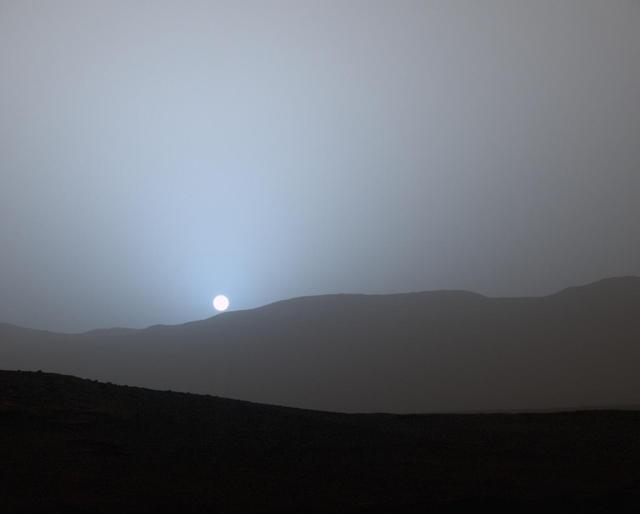
NASA's Curiosity Mars rover recorded this view of the sun setting at the close of the mission's 956th Martian day, or sol (April 15, 2015), from the rover's location in Gale Crater. This was the first sunset observed in color by Curiosity. The image comes from the left-eye camera of the rover's Mast Camera (Mastcam). The color has been calibrated and white-balanced to remove camera artifacts. Mastcam sees color very similarly to what human eyes see, although it is actually a little less sensitive to blue than people are. Dust in the Martian atmosphere has fine particles that permit blue light to penetrate the atmosphere more efficiently than longer-wavelength colors. That causes the blue colors in the mixed light coming from the sun to stay closer to sun's part of the sky, compared to the wider scattering of yellow and red colors. The effect is most pronounced near sunset, when light from the sun passes through a longer path in the atmosphere than it does at mid-day. Malin Space Science Systems, San Diego, built and operates the rover's Mastcam. NASA's Jet Propulsion Laboratory, a division of the California Institute of Technology, Pasadena, manages the Mars Science Laboratory Project for NASA's Science Mission Directorate, Washington. JPL designed and built the project's Curiosity rover. http://photojournal.jpl.nasa.gov/catalog/PIA19400
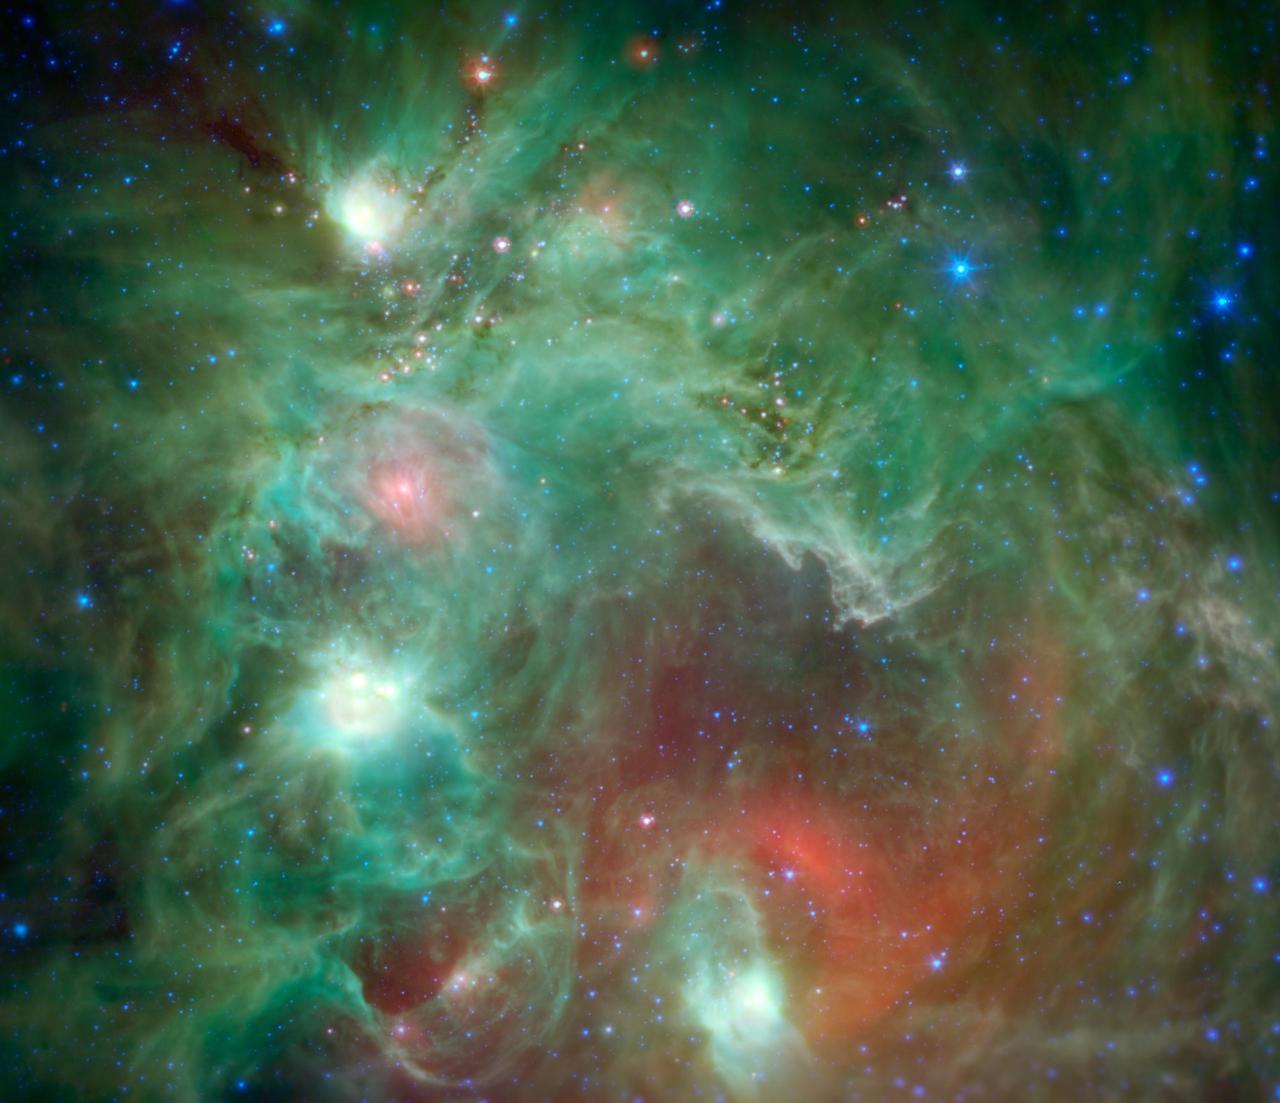
Scores of baby stars shrouded by dust are revealed in this infrared image of the star-forming region NGC 2174, as seen by NASA Spitzer Space Telescope. Found in the constellation Orion, NGC 2174 is located around 6,400 light-years away. Some of the clouds in the region resemble the face of a monkey in visible-light images, hence the nebula's nickname: the "Monkey Head." However, in infrared images such as this, the monkey disappears. That's because different clouds are highlighted in infrared and visible-light images. Found in the northern reaches of the constellation Orion, NGC 2174 is located around 6,400 light-years away. Columns of dust, slightly to the right of center in the image, are being carved out of the dust by radiation and stellar winds from the hottest young stars recently born in the area. Spitzer's infrared view provides us with a preview of the next clusters of stars that will be born in the coming millennia. The reddish spots of light scattered through the darker filaments are infant stars swaddled by blankets of warm dust. The warm dust glows brightly at infrared wavelengths. Eventually, these stars will pop out of their dusty envelopes and their light will carve away at the dust clouds surrounding them. In this image, infrared wavelengths have been assigned visible colors we see with our eyes. Light with a wavelength of 3.5 microns is shown in blue, 8.0 microns is green, and 24 microns in red. The greens show the organic molecules in the dust clouds, illuminated by starlight. Reds are caused by the thermal radiation emitted from the very hottest areas of dust. Areas around the edges that were not observed by Spitzer have been filled in using infrared observations from NASA's Wide Field Infrared Survey Explorer, or WISE. http://photojournal.jpl.nasa.gov/catalog/PIA19836
P-34666 This false color photograph of Neptune was reconstructed from two images taken by Voyager 2's wide angle camera, through the orange and two different methane filters. Objects that deep in the atmosphere are blue, while those at higher altitudes are white. Light at methane wavelengths is mostly absorbed in the deeper atmosphere. The bright, white feature is a high altitude cloud just south of the Great dark Spot. The hard, sharp inner boundary within the bright cloud is an artifact of computer processing on Earth. Other, smaller clouds associated with the Great Dark Spot are white or pink, and are also at high altitudes. Neptune's limb looks reddish because Voyager 2 is viewing it tangentially, and the sunlight is scattered back to space before it can be absorbed by methane. A long, narrow band of high-altitude clouds near the top of the image is located at 25 degrees north latitude, and faint hazes mark the equator and polor regions
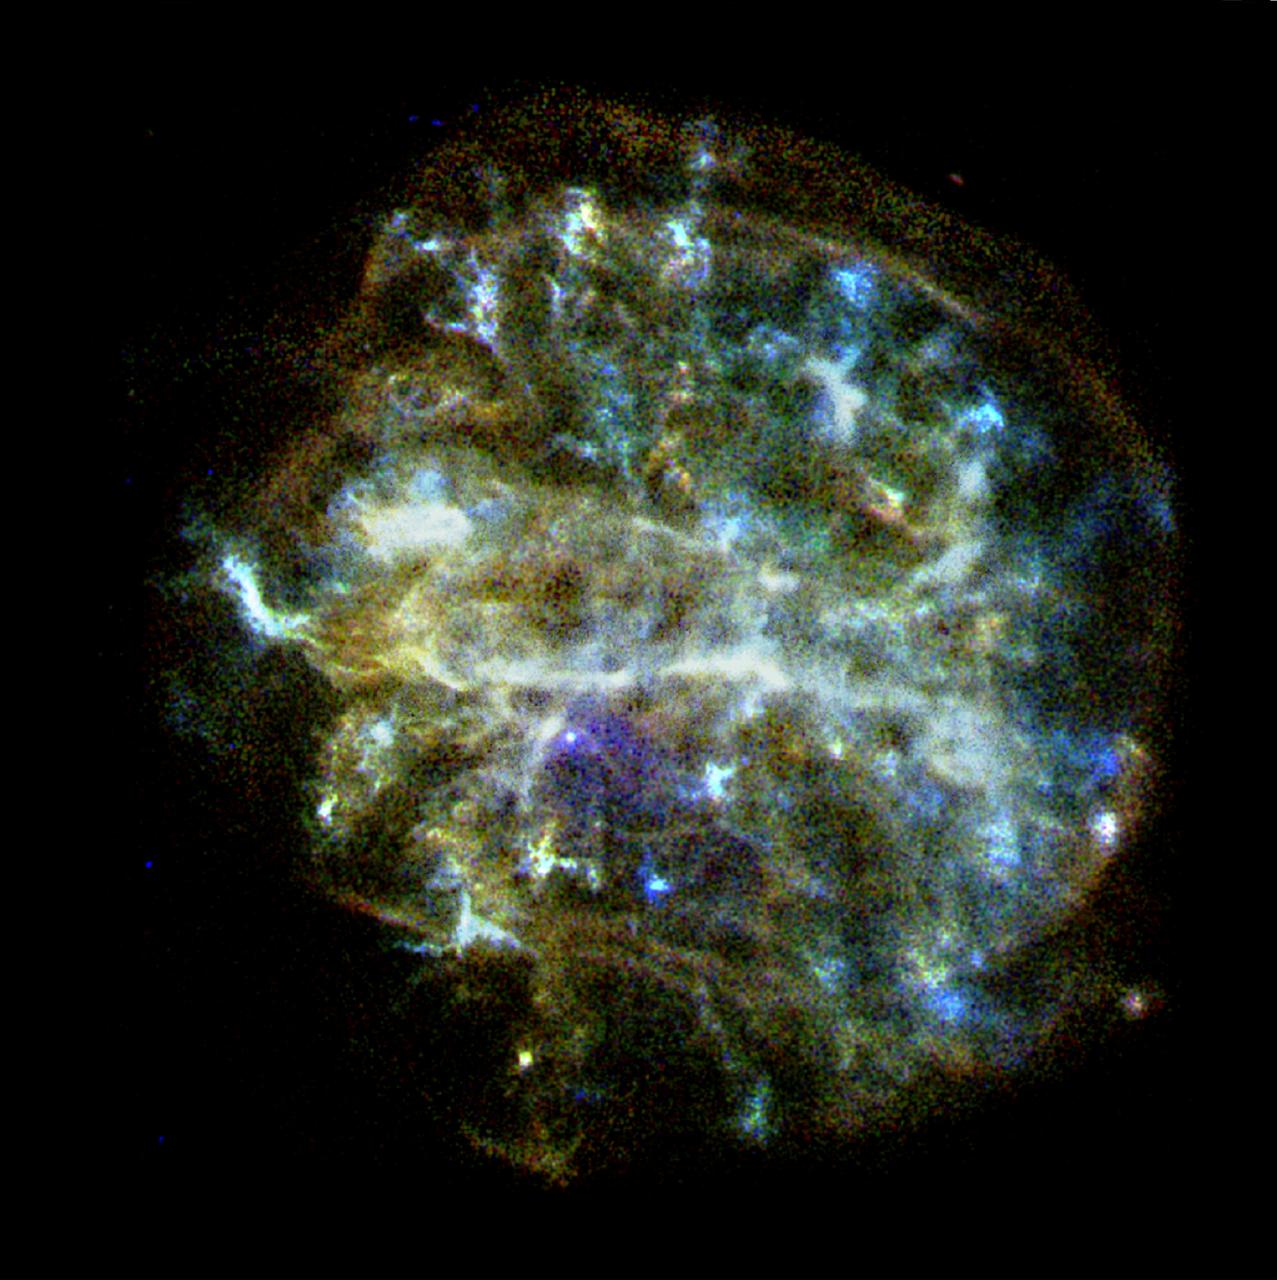
The Chandra X-Ray Observatory has captured this spectacular image of G292.0+1.8, a young, oxygen-rich supernova remnant with a pulsar at its center surrounded by outflowing material. This image shows a rapidly expanding shell of gas that is 36 light-years across and contains large amounts of elements such as oxygen, neon, magnesium, silicon and sulfur. Embedded in this cloud of multimillion-degree gas is a key piece of evidence linking neutron stars and supernovae produced by the collapse of massive stars. With an age estimated at 1,600 years, G292.0+1.8 is one of three known oxygen-rich supernovae in our galaxy. These supernovae are of great interest to astronomers because they are one of the primary sources of the heavy elements necessary to form planets and people. Scattered through the image are bluish knots of emissions containing material that is highly enriched in newly created oxygen, neon, and magnesium produced deep within the original star and ejected by the supernova explosion.
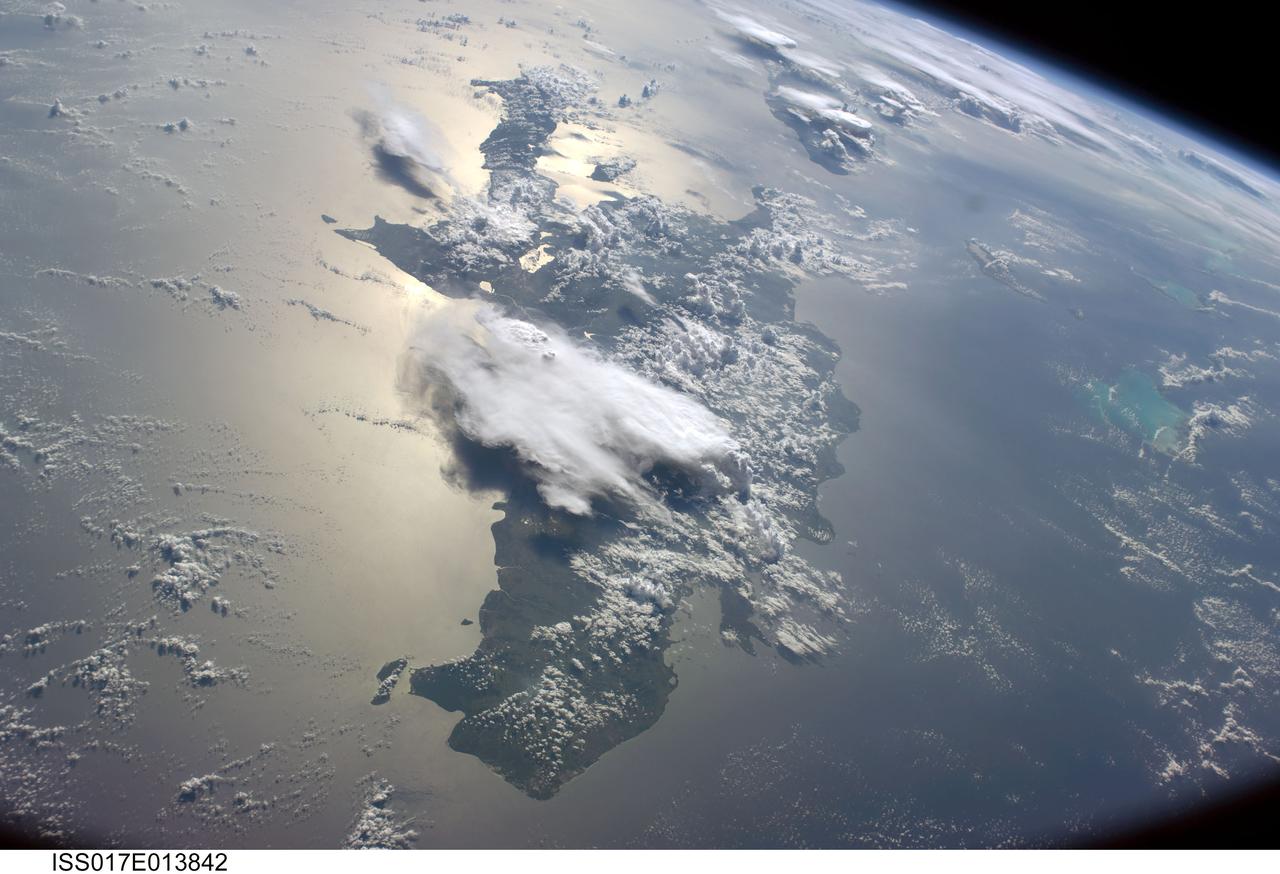
ISS017-E-013842 (19 Aug. 2008) --- A serene view of a portion of the Greater Antilles islands in the Caribbean Sea. The island of Hispaniola is in the foreground, comprised of the Dominican Republic and Haiti (in the sunglint). Looking toward the horizon, the eastern tip of Cuba is seen through the clouds and thunderstorms that are scattered over the islands. The light blue shallower areas, to the right or north of Hispaniola and extending toward the Earths limb, are the Turks and Caicos islands and the Acklins Islands. The Great Inagua island is off the coast of Haiti. These islands are located along the geological border of the North American Plate (to the right) and the Caribbean Plate (to the left). The photo was taken by the Expedition 17 crew onboard the International Space Station on Aug 19, 2008 with a 28 mm lens.
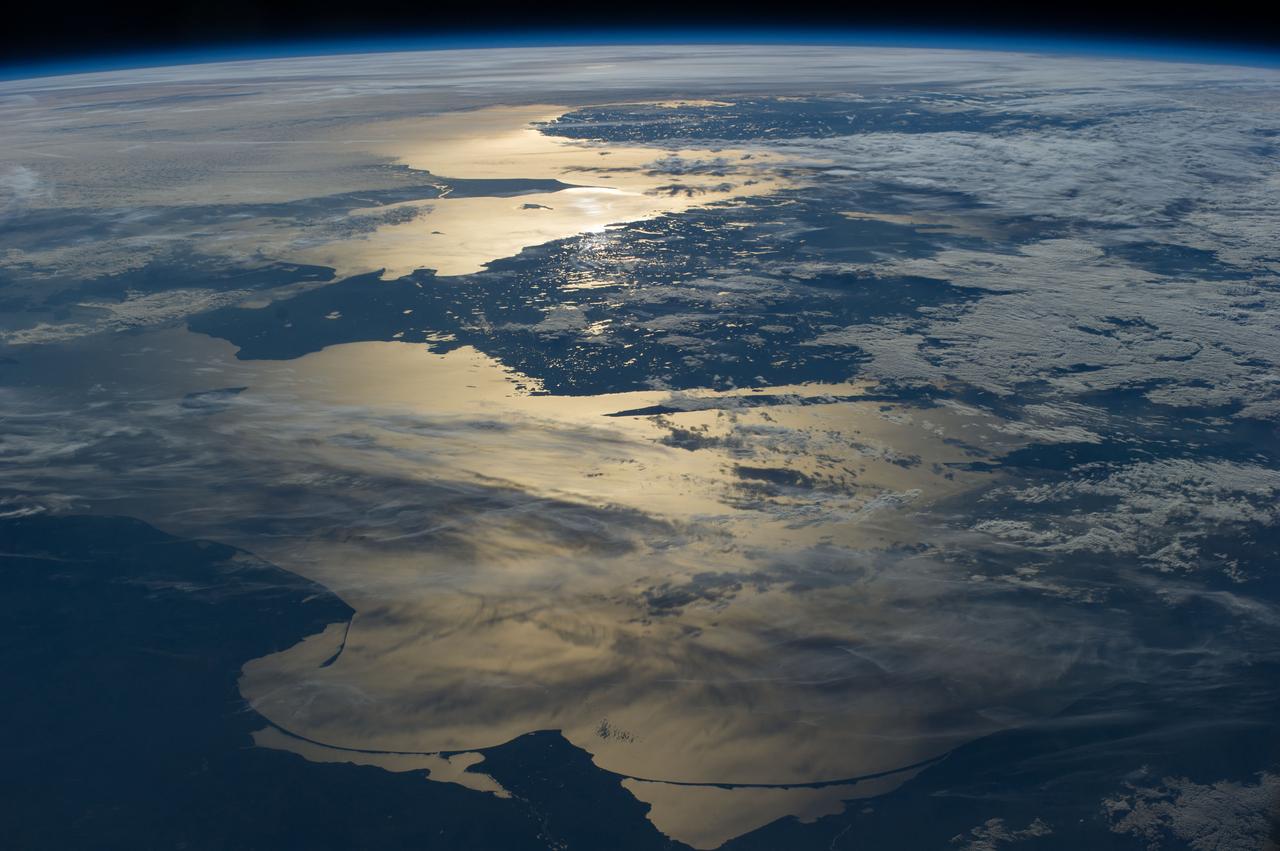
ISS040-E-012110 (15 June 2014) --- Coastlines of the southern Baltic Sea are featured in this image photographed by an Expedition 40 crew member on the International Space Station. The crew photographed this panorama looking aft (back along the orbital path) of the spacecraft as the sun was setting over the North Sea. Seen from the space station, the sun’s reflection point moves quickly across the landscape, momentarily lighting up water bodies. In this fleeting view the coast of southern Norway is outlined near the horizon. The strongest reflection of the sun highlights the narrow sea passage known as the Skagerrak—revealing the thin tip of Denmark. Numerous small lakes in southern Sweden appear at center, and scattered clouds cast complex shadows on the southern Baltic Sea. The sweeping curves of the sand spit on the Polish coast, and the long barrier islands on the Russian coast appear in the foreground at the edge of the sun’s reflection disc.

Range : 4.86 million km (3 million mi.) This dramatic view of the crescents of Neptune and Triton was acquired by Voyager 2 approx. 3 days, 6 1/2 hours after its closest approach to Neptune. The space craft was pluging southward at an angle of 48 degrees to the plane of the ecliptic. This direction, combined with the current season of southern summer in the Neptune system, gives this picture its unique geometry. The smallest detail discernible is approx. 90 km (56 mi.). Color was produced using images taken through the narrow-angle camera's clear, orange and green filters. Neptune does not appear as blue from this viewpoint because the forward scattering nature of its atmosphere is more important than its absorption of red light at this high phase angle (134 degrees).
Gale Crater is well-known as the landing site of NASA's Curiosity rover, which has explored the northwest crater floor since 2012. But the entire crater is full of fascinating geology, some beyond the rover's reach. This image covers a fan of sedimentary rock on the southeast crater floor. Ridges on the fan surface may be composed of coarse-grained sediment deposited in ancient streams. More recent wind erosion of the surrounding finer sediments could have left these channel deposits elevated in "inverted relief." A closeup shows some of these ridges, as well as light-toned layers of sediment exposed along the fan edge. The fan is also punctured by scattered circular impact craters. One of these craters appears to have a circular deposit of sedimentary rock filling its floor, suggesting that it formed during the span of time that streams were active here. Features like this help scientists to infer the geologic history of the region. https://photojournal.jpl.nasa.gov/catalog/PIA25988
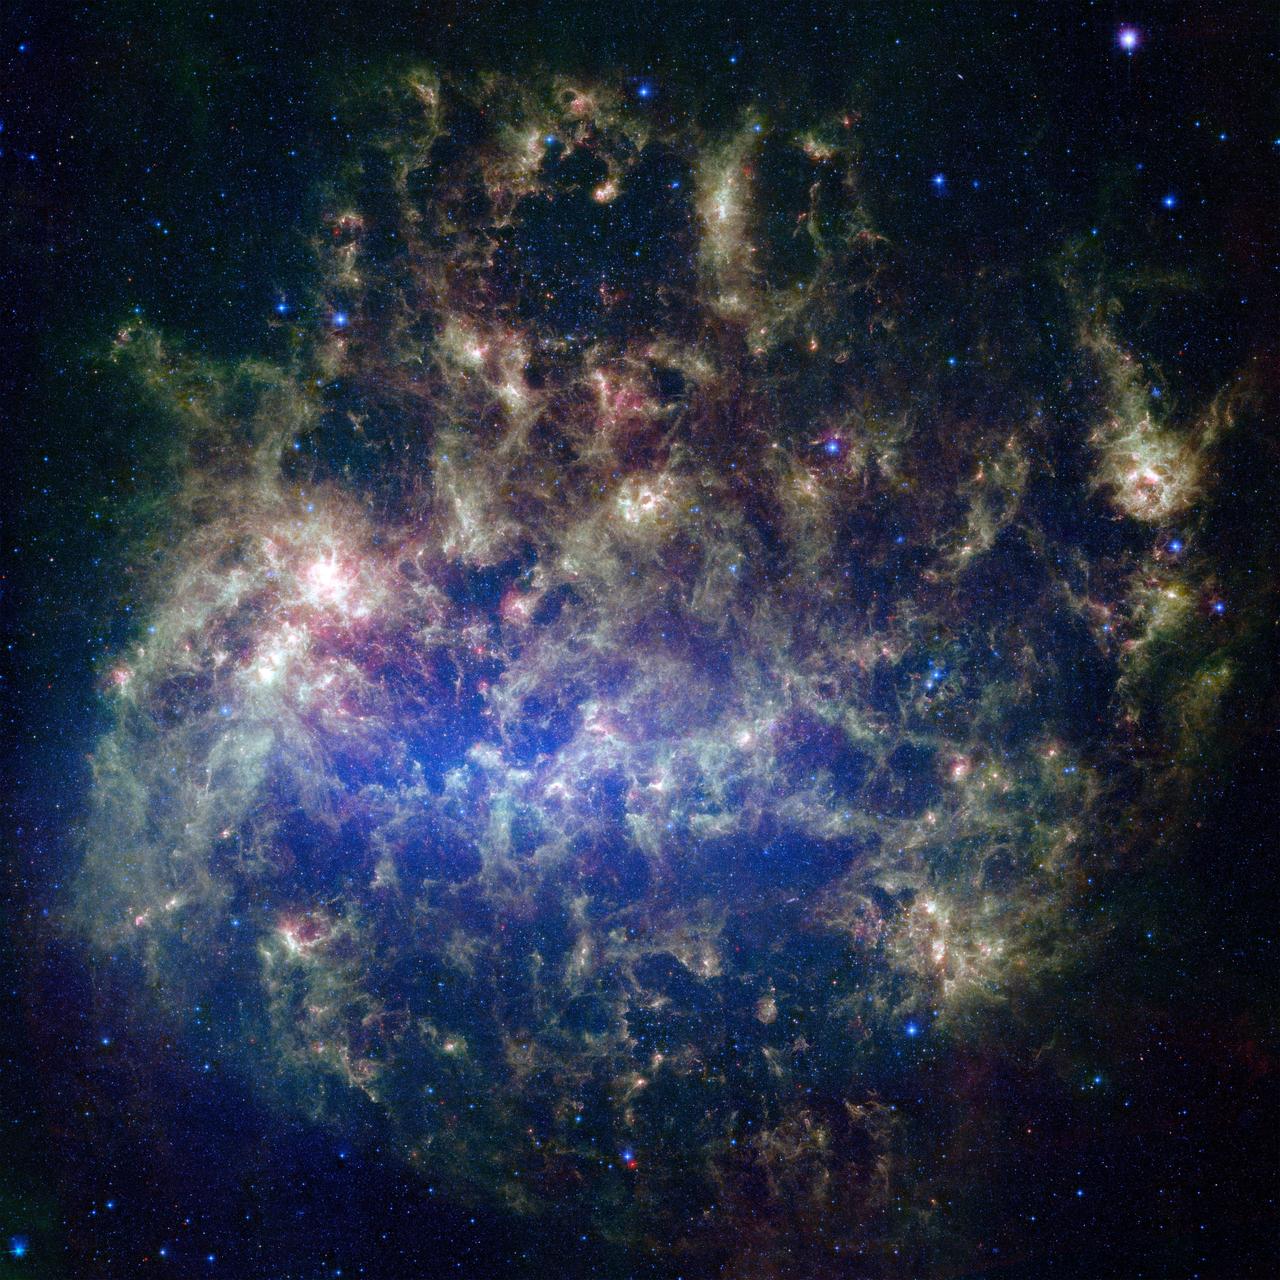
This vibrant image from NASA's Spitzer Space Telescope shows the Large Magellanic Cloud, a satellite galaxy to our own Milky Way galaxy. The infrared image, a mosaic of 300,000 individual tiles, offers astronomers a unique chance to study the lifecycle of stars and dust in a single galaxy. Nearly one million objects are revealed for the first time in this Spitzer view, which represents about a 1,000-fold improvement in sensitivity over previous space-based missions. Most of the new objects are dusty stars of various ages populating the Large Magellanic Cloud; the rest are thought to be background galaxies. The blue color in the picture, seen most prominently in the central bar, represents starlight from older stars. The chaotic, bright regions outside this bar are filled with hot, massive stars buried in thick blankets of dust. The red color around these bright regions is from dust heated by stars, while the red dots scattered throughout the picture are either dusty, old stars or more distant galaxies. The greenish clouds contain cooler interstellar gas and molecular-sized dust grains illuminated by ambient starlight. Astronomers say this image allows them to quantify the process by which space dust -- the same stuff that makes up planets and even people -- is recycled in a galaxy. The picture shows dust at its three main cosmic hangouts: around the young stars, where it is being consumed (red-tinted, bright clouds); scattered about in the space between stars (greenish clouds); and in expelled shells of material from old stars (randomly-spaced red dots). The Large Magellanic Cloud, located 160,000 light-years from Earth, is one of a handful of dwarf galaxies that orbit our own Milky Way. It is approximately one-third as wide as the Milky Way, and, if it could be seen in its entirety, would cover the same amount of sky as a grid of about 480 full moons. About one-third of the entire galaxy can be seen in the Spitzer image. This picture is a composite of infrared light captured by Spitzer. Light with wavelengths of 3.6 (blue) and 8 (green) microns was captured by the telescope's infrared array camera; 24-micron light (red) was detected by the multiband imaging photometer. http://photojournal.jpl.nasa.gov/catalog/PIA07137
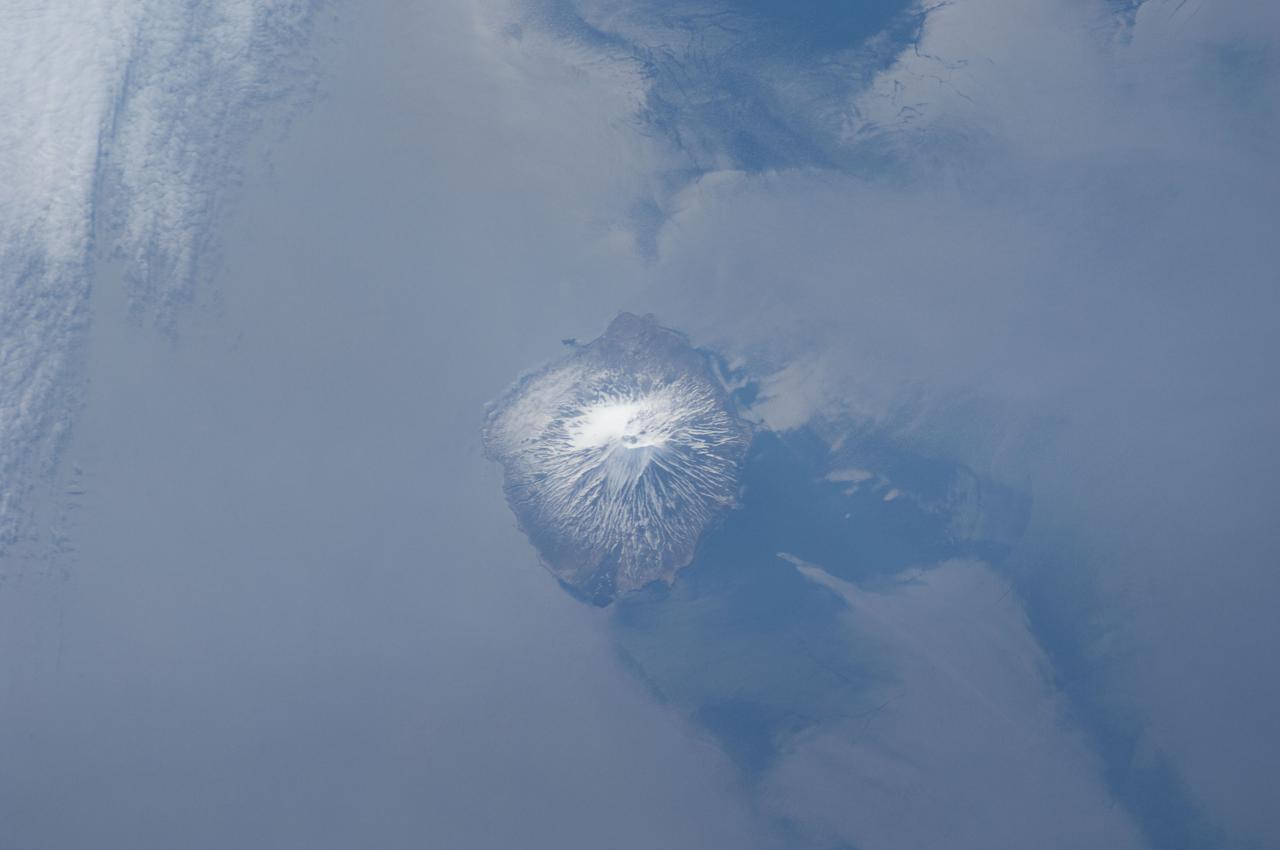
ISS031-E-041959 (18 May 2012) --- Alaid Volcano in the Kuril Islands of the Russian Federation is featured in this image photographed by an Expedition 31 crew member on the International Space Station. The Kurils chain extends from the Kamchatka Peninsula to the islands of Japan, and contains numerous active volcanoes along its length. Alaid is the highest (2,339 meters above sea level) volcano in the Kuril chain, as well as being the northernmost. The textbook conic morphology of this stratovolcano is marred only by the summit crater, which is breached to the south (center) and highlighted by snow cover. The volcano rises 3,000 meters directly from the floor of the Sea of Okhotsk, with the uppermost part of the volcanic edifice exposed as an island. Much of the sea surface surrounding the volcano has a silver-gray appearance. This mirror-like appearance is due to sunglint, where light reflects off the sea surface and is scattered directly towards the observer onboard the space station. Sunglint is largely absent from a zone directly to the west of the volcano, most likely due to surface wind or water current patterns that change the roughness?and light scattering properties?of the water surface in this area. Volcanoes in the Kurils, and similar island arcs in the Pacific ?ring of fire?, are fed by magma generated along the boundary between two tectonic plates, where one plate is being driven beneath the other (a process known as subduction). Alaid Volcano has been historically active with the most recent confirmed explosive activity occurring in 1996.
![This is the first photograph ever taken on the surface of the planet Mars. It was obtained by Viking 1 just minutes after the spacecraft landed successfully early today [July 20, 1976]. The center of the image is about 1.4 meters (five feet) from Viking Lander camera #2. We see both rocks and finely granulated material--sand or dust. Many of the small foreground rocks are flat with angular facets. Several larger rocks exhibit irregular surfaces with pits and the large rock at top left shows intersecting linear cracks. Extending from that rock toward the camera is a vertical linear dark band which may be due to a one-minute partial obscuration of the landscape due to clouds or dust intervening between the sun and the surface. Associated with several of the rocks are apparent signs of wind transport of granular material. The large rock in the center is about 10 centimeters (4 inches) across and shows three rough facets. To its lower right is a rock near a smooth portion of the Martian surface probably composed of very fine-grained material. It is possible that the rock was moved during Viking 1 descent maneuvers, revealing the finer-grained basement substratum; or that the fine-grained material has accumulated adjacent to the rock. There are a number of other furrows and depressions and places with fine-grained material elsewhere in the picture. At right is a portion of footpad #2. Small quantities of fine grained sand and dust are seen at the center of the footpad near the strut and were deposited at landing. The shadow to the left of the footpad clearly exhibits detail, due to scattering of light either from the Martian atmosphere or from the spacecraft, observable because the Martian sky scatters light into shadowed areas. http://photojournal.jpl.nasa.gov/catalog/PIA00381](https://images-assets.nasa.gov/image/PIA00381/PIA00381~thumb.jpg)
This is the first photograph ever taken on the surface of the planet Mars. It was obtained by Viking 1 just minutes after the spacecraft landed successfully early today [July 20, 1976]. The center of the image is about 1.4 meters (five feet) from Viking Lander camera #2. We see both rocks and finely granulated material--sand or dust. Many of the small foreground rocks are flat with angular facets. Several larger rocks exhibit irregular surfaces with pits and the large rock at top left shows intersecting linear cracks. Extending from that rock toward the camera is a vertical linear dark band which may be due to a one-minute partial obscuration of the landscape due to clouds or dust intervening between the sun and the surface. Associated with several of the rocks are apparent signs of wind transport of granular material. The large rock in the center is about 10 centimeters (4 inches) across and shows three rough facets. To its lower right is a rock near a smooth portion of the Martian surface probably composed of very fine-grained material. It is possible that the rock was moved during Viking 1 descent maneuvers, revealing the finer-grained basement substratum; or that the fine-grained material has accumulated adjacent to the rock. There are a number of other furrows and depressions and places with fine-grained material elsewhere in the picture. At right is a portion of footpad #2. Small quantities of fine grained sand and dust are seen at the center of the footpad near the strut and were deposited at landing. The shadow to the left of the footpad clearly exhibits detail, due to scattering of light either from the Martian atmosphere or from the spacecraft, observable because the Martian sky scatters light into shadowed areas. http://photojournal.jpl.nasa.gov/catalog/PIA00381
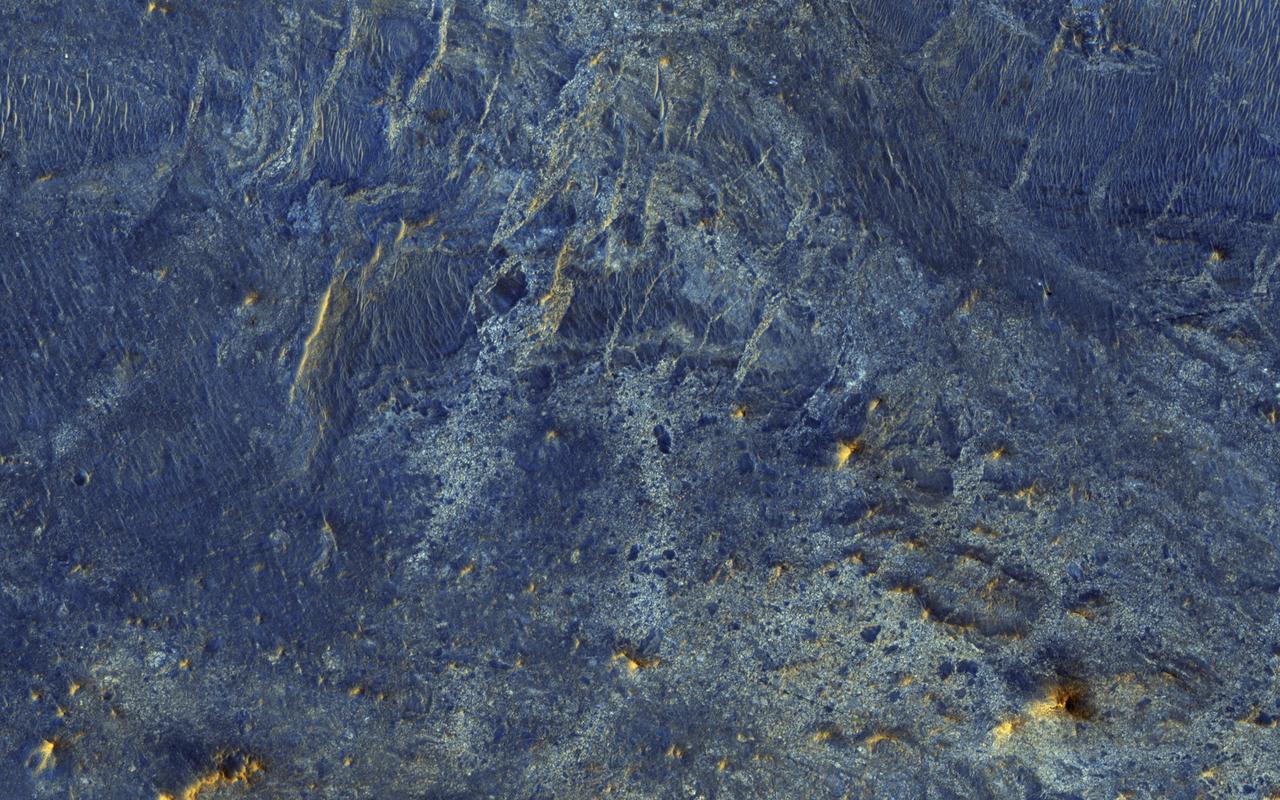
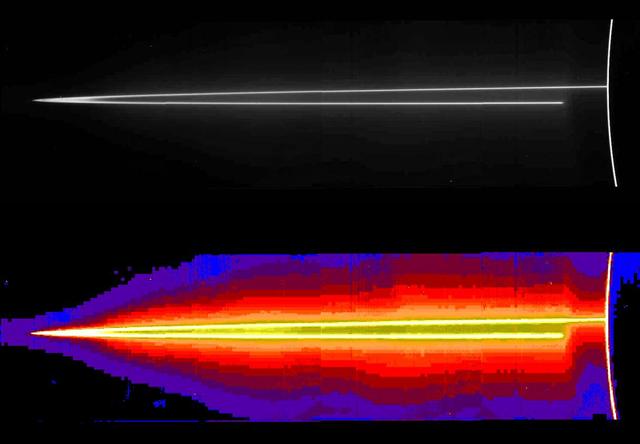
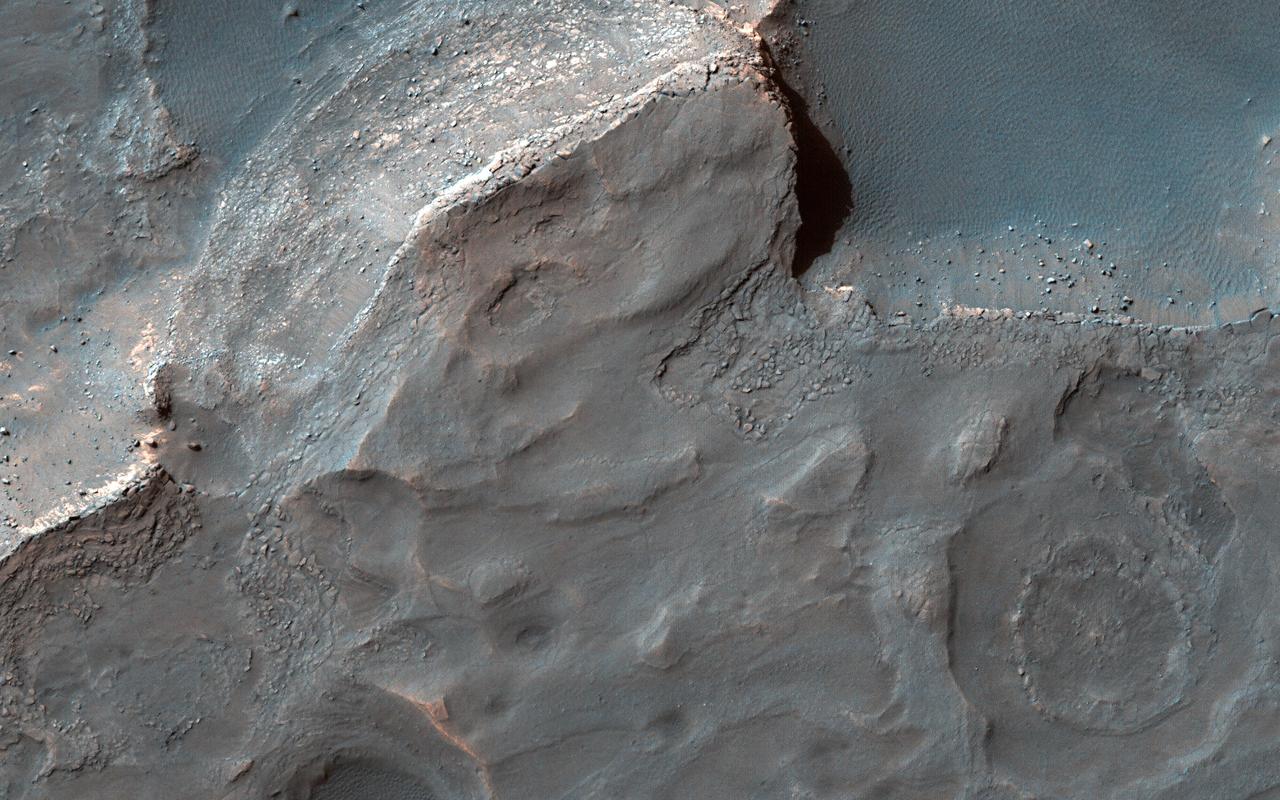
There have been several proposals to send people to Mars but not land them on the surface. Instead, they would either fly by Mars once and return to Earth, or orbit Mars for a period of time. Would they at least get spectacular naked-eye views of the Martian surface? Some parts of Mars would be interesting: for example the polar ice caps, and the bright (dust-covered) regions would be seen reasonably well, although the color is very uniform. The dark (low reflectance) regions of Mars are some of the most interesting and important regions studied by our orbiters and rovers, but they would appear very bland to humans outside of the planet's atmosphere. This is because the thin atmosphere of Mars is quite bright and dusty, so when looking at dark surface areas, most of what you would see is scattered light from the atmospheric dust, and the surface would have a very low contrast. It would also appear reddish, even if the surface materials are not reddish, from the scattered light. Here is an example from the Nili Patera region of Mars, a candidate future landing site. At the top is an approximation of the natural color as seen by people with normal color vision -- almost no surface detail is visible. In the middle is the standard HiRISE IRB color product, consisting of the infrared, red, and blue-green images displayed as red, green, and blue, respectively, and with a min-max stretch applied to each color. In other words, the darkest pixel in the entire image is set to black, the brightest pixel is set to white, and all others are linearly interpolated. At bottom is an enhanced color product, in which each bandpass is given a linear stretch for the local subimage, sometimes saturating a small percentage of data to black or white to give the rest of the scene more contrast, followed by color saturation enhancement. Now we can see a diversity of colors that distinguish different surface units: dust, sand, and rocks with different minerals. http://photojournal.jpl.nasa.gov/catalog/PIA21040
These six narrow-angle color images were made from the first ever portrait of the solar system taken by NASA’s Voyager 1, which was more than 4 billion miles from Earth and about 32 degrees above the ecliptic. The spacecraft acquired a total of 60 frames for a mosaic of the solar system which shows six of the planets. Mercury is too close to the sun to be seen. Mars was not detectable by the Voyager cameras due to scattered sunlight in the optics, and Pluto was not included in the mosaic because of its small size and distance from the sun. These blown-up images, left to right and top to bottom are Venus, Earth, Jupiter, and Saturn, Uranus, Neptune. The background features in the images are artifacts resulting from the magnification. The images were taken through three color filters -- violet, blue and green -- and recombined to produce the color images. Jupiter and Saturn were resolved by the camera but Uranus and Neptune appear larger than they really are because of image smear due to spacecraft motion during the long (15 second) exposure times. Earth appears to be in a band of light because it coincidentally lies right in the center of the scattered light rays resulting from taking the image so close to the sun. Earth was a crescent only 0.12 pixels in size. Venus was 0.11 pixel in diameter. The planetary images were taken with the narrow-angle camera (1500 mm focal length). http://photojournal.jpl.nasa.gov/catalog/PIA00453
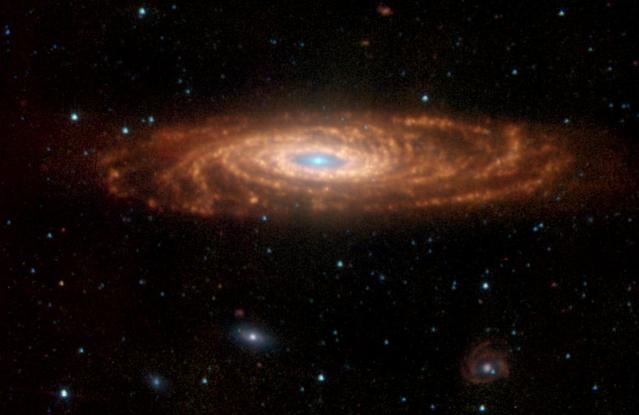
NASA's Spitzer Space Telescope has captured these infrared images of a nearby spiral galaxy that resembles our own Milky Way. The targeted galaxy, known as NGC 7331 and sometimes referred to as our galaxy's twin, is found in the constellation Pegasus at a distance of 50 million light-years. This inclined galaxy was discovered in 1784 by William Herschel, who also discovered infrared light. The evolution of this galaxy is a story that depends significantly on the amount and distribution of gas and dust, the locations and rates of star formation, and on how the energy from star formation is recycled by the local environment. The new Spitzer images are allowing astronomers to "read" this story by dissecting the galaxy into its separate components. The image, measuring 12.6 by 8.2 arcminutes, was obtained by Spitzer's infrared array camera. It is a four-color composite of invisible light, showing emissions from wavelengths of 3.6 microns (blue), 4.5 microns (green), 5.8 microns (yellow) and 8.0 microns (red). These wavelengths are roughly 10 times longer than those seen by the human eye. The infrared light seen in this image originates from two very different sources. At shorter wavelengths (3.6 to 4.5 microns), the light comes mainly from stars, particularly ones that are older and cooler than our Sun. This starlight fades at longer wavelengths (5.8 to 8.0 microns), where instead we see the glow from clouds of interstellar dust. This dust consists mainly of a variety of carbon-based organic molecules known collectively as polycyclic aromatic hydrocarbons. Wherever these compounds are found, there will also be dust granules and gas, which provide a reservoir of raw materials for future star formation. One feature that stands out in the Spitzer image is the ring of actively forming stars that surrounds the galaxy center (yellow). This ring, with a radius of nearly 20,000 light-years, is invisible at shorter wavelengths, yet has been detected at sub-millimeter and radio wavelengths. It is made up in large part of polycyclic aromatic hydrocarbons. Spitzer measurements suggest that the ring contains enough gas to produce four billion stars like the Sun. Three other galaxies are seen below NGC 7331, all about 10 times farther away. From left to right are NGC 7336, NGC 7335 and NGC 7337. The blue dots scattered throughout the images are foreground stars in the Milky Way; the red ones are galaxies that are even more distant. The Spitzer observations of NGC 7331 are part of a large 500-hour science project, known as the Spitzer Infrared Nearby Galaxy Survey, which will comprehensively study 75 nearby galaxies with infrared imaging and spectroscopy. http://photojournal.jpl.nasa.gov/catalog/PIA06322

Globular star cluster NGC 362, in a false-color image from NASA's Galaxy Evolution Explorer. Image credit: NASA/JPL-Caltech/Univ. of Virginia The Galaxy Evolution Explorer's ultraviolet eyes have captured a globular star cluster, called NGC 362, in our own Milky Way galaxy. In this new image, the cluster appears next to stars from a more distant neighboring galaxy, known as the Small Magellanic Cloud. "This image is so interesting because it allows a study of the final stages of evolution of low-mass stars in NGC 362, as well as the history of star formation in the Small Magellanic Cloud," said Ricardo Schiavon of the University of Virginia, Charlottesville, Va. Globular clusters are densely packed bunches of old stars scattered in galaxies throughout the universe. NGC 362, located 30,000 light-years away, can be spotted as the dense collection of mostly yellow-tinted stars surrounding a large white-yellow spot toward the top-right of this image. The white spot is actually the core of the cluster, which is made up of stars so closely packed together that the Galaxy Evolution Explorer cannot see them individually. The light blue dots surrounding the cluster core are called extreme horizontal branch stars. These stars used to be very similar to our sun and are nearing the end of their lives. They are very hot, with temperatures reaching up to about four times that of the surface of our sun (25,000 Kelvin or 45,500 degrees Fahrenheit). A star like our sun spends most of its life fusing hydrogen atoms in its core into helium. When the star runs out of hydrogen in its core, its outer envelope will expand. The star then becomes a red giant, which burns hydrogen in a shell surrounding its inner core. Throughout its life as a red giant, the star loses a lot of mass, then begins to burn helium at its core. Some stars will have lost so much mass at the end of this process, up to 85 percent of their envelopes, that most of the envelope is gone. What is left is a very hot ultraviolet-bright core, or extreme horizontal branch star. Blue dots scattered throughout the image are hot, young stars in the Small Magellanic Cloud, a satellite galaxy of the Milky Way located approximately 200,000 light-years away. The stars in this galaxy are much brighter intrinsically than extreme horizontal branch stars, but they appear just as bright because they are farther away. The blue stars in the Small Magellanic Cloud are only about a few tens of millions of years old, much younger than the approximately 10-million-year-old stars in NGC 362. Because NGC 362 sits on the northern edge of the Small Magellanic Cloud galaxy, the blue stars are denser toward the south, or bottom, of the image. Some of the yellow spots in this image are stars in the Milky Way galaxy that are along this line of sight. Astronomers believe that some of the other spots, particularly those closer to NGC 362, might actually be a relatively ultraviolet-dim family of stars called "blue stragglers." These stars are formed from collisions or close encounters between two closely orbiting stars in a globular cluster. "This observation could only be done with the Galaxy Evolution Explorer because it is the only ultraviolet imager available to the astronomical community with such a large field of view," said Schiavon. This image is a false-color composite, where light detected by the Galaxy Evolution Explorer's far-ultraviolet detector is colored blue, and light from the telescope's near-ultraviolet detector is red. Written by Linda Vu, Spitzer Science Center Media contact: Whitney Clavin/JPL (818) 354-4673
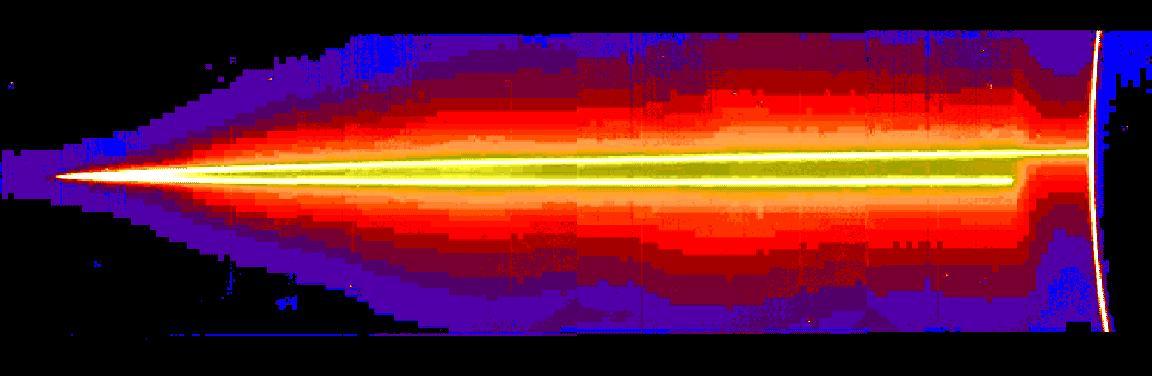
A mosaic of four images taken through the clear filter (610 nanometers) of the solid state imaging (CCD) system aboard NASA's Galileo spacecraft on November 8, 1996, at a resolution of approximately 46 kilometers (km) per picture element (pixel) along the rings; however, because the spacecraft was only about 0.5 degrees above the ring plane, the image is highly foreshortened in the vertical direction. The images were obtained when Galileo was in Jupiter's shadow peering back toward the Sun; the ring was approximately 2,300,000 kilometers (km) away. The arc on the far right of the image is produced by sunlight scattered by small particles comprising Jupiter's upper atmospheric haze. The ring also efficiently scatters light, indicating that much of its brightness is due to particles that are microns or less in diameter. Such small particles are believed to have human-scale lifetimes, i.e., very brief compared to the solar system's age. Jupiter's ring system is composed of three parts -- a flat main ring, a lenticular halo interior to the main ring, and the gossamer ring, which lies exterior to the main ring. The near and far arms of Jupiter's main ring extend horizontally across the mosaic, joining together at the ring's ansa, on the far left side of the figure. The near arm of the ring appears to be abruptly truncated close to the planet, at the point where it passes into Jupiter's shadow. A faint mist of particles can be seen above and below the main rings; this vertically extended, toroidal "halo" is unusual in planetary rings, and is probably caused by electromagnetic forces which can push small grains out of the ring plane. Halo material is present across this entire image, implying that it reaches more than 27,000 km above the ring plane. Because of shadowing, the halo is not visible close to Jupiter in the lower right part of the mosaic. In order to accentuate faint features in the image, different brightnesses are shown through color, with the brightest being white or yellow and the faintest purple. http://photojournal.jpl.nasa.gov/catalog/PIA00658
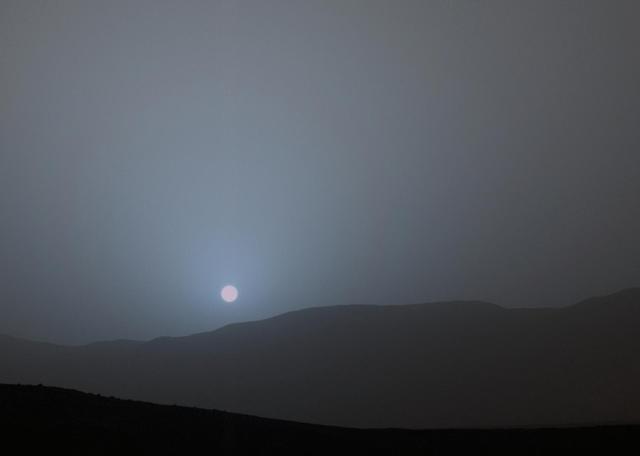
NASA's Curiosity Mars rover recorded this sequence of views of the sun setting at the close of the mission's 956th Martian day, or sol (April 15, 2015), from the rover's location in Gale Crater. The four images shown in sequence here were taken over a span of 6 minutes, 51 seconds. This was the first sunset observed in color by Curiosity. The images come from the left-eye camera of the rover's Mast Camera (Mastcam). The color has been calibrated and white-balanced to remove camera artifacts. Mastcam sees color very similarly to what human eyes see, although it is actually a little less sensitive to blue than people are. Dust in the Martian atmosphere has fine particles that permit blue light to penetrate the atmosphere more efficiently than longer-wavelength colors. That causes the blue colors in the mixed light coming from the sun to stay closer to sun's part of the sky, compared to the wider scattering of yellow and red colors. The effect is most pronounced near sunset, when light from the sun passes through a longer path in the atmosphere than it does at mid-day. Malin Space Science Systems, San Diego, built and operates the rover's Mastcam. NASA's Jet Propulsion Laboratory, a division of the California Institute of Technology, Pasadena, manages the Mars Science Laboratory Project for NASA's Science Mission Directorate, Washington. JPL designed and built the project's Curiosity rover. http://photojournal.jpl.nasa.gov/catalog/PIA19401
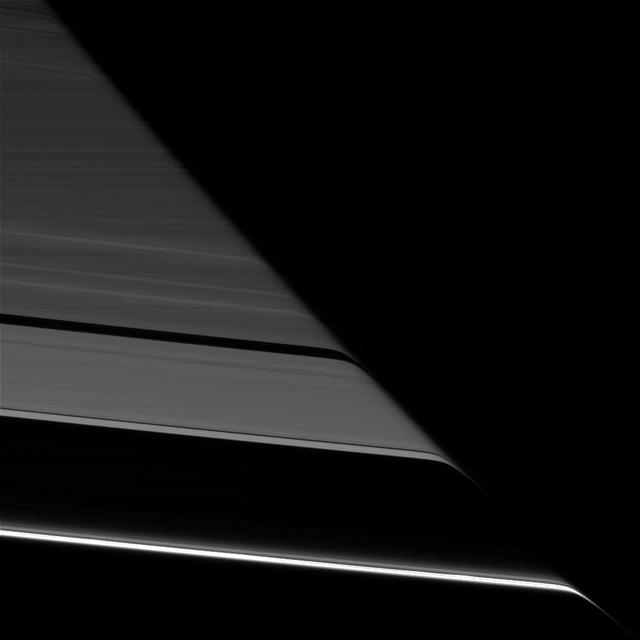
Saturn's rings appear to bend as they pass behind the planet's darkened limb due to refraction by Saturn's upper atmosphere. The effect is the same as that seen in an earlier Cassini view (see PIA20491), except this view looks toward the unlit face of the rings, while the earlier image viewed the rings' sunlit side. The difference in illumination brings out some noticeable differences. The A ring is much darker here, on the rings' unlit face, since its larger particles primarily reflect light back toward the sun (and away from Cassini's cameras in this view). The narrow F ring (at bottom), which was faint in the earlier image, appears brighter than all of the other rings here, thanks to the microscopic dust that is prevalent within that ring. Small dust tends to scatter light forward (meaning close to its original direction of travel), making it appear bright when backlit. (A similar effect has plagued many a driver with a dusty windshield when driving toward the sun.) This view looks toward the unilluminated side of the rings from about 19 degrees below the ring plane. The image was taken in red light with the Cassini spacecraft narrow-angle camera on July 24, 2016. The view was acquired at a distance of approximately 527,000 miles (848,000 kilometers) from Saturn and at a sun-Saturn-spacecraft, or phase, angle of 169 degrees. Image scale is 3 miles (5 kilometers) per pixel. http://photojournal.jpl.nasa.gov/catalog/PIA20497
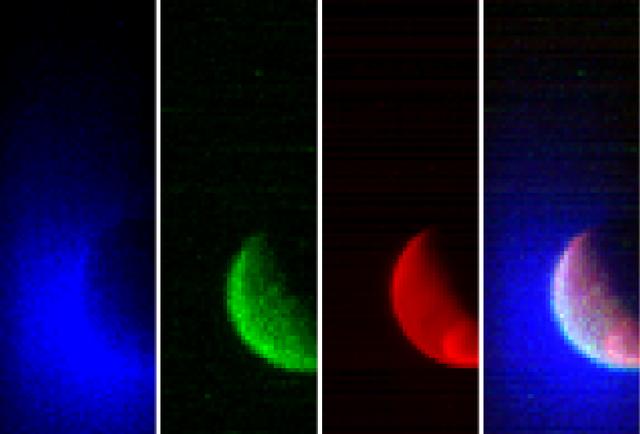
NASA’s Mars Atmosphere and Volatile Evolution (MAVEN) spacecraft has obtained its first observations of the extended upper atmosphere surrounding Mars. The Imaging Ultraviolet Spectrograph (IUVS) instrument obtained these false-color images eight hours after the successful completion of Mars orbit insertion by the spacecraft at 10:24 p.m. EDT Sunday, Sept. 21, after a 10-month journey. The image shows the planet from an altitude of 36,500 km in three ultraviolet wavelength bands. Blue shows the ultraviolet light from the sun scattered from atomic hydrogen gas in an extended cloud that goes to thousands of kilometers above the planet’s surface. Green shows a different wavelength of ultraviolet light that is primarily sunlight reflected off of atomic oxygen, showing the smaller oxygen cloud. Red shows ultraviolet sunlight reflected from the planet’s surface; the bright spot in the lower right is light reflected either from polar ice or clouds. The oxygen gas is held close to the planet by Mars’ gravity, while lighter hydrogen gas is present to higher altitudes and extends past the edges of the image. These gases derive from the breakdown of water and carbon dioxide in Mars’ atmosphere. Over the course of its one-Earth-year primary science mission, MAVEN observations like these will be used to determine the loss rate of hydrogen and oxygen from the Martian atmosphere. These observations will allow us to determine the amount of water that has escaped from the planet over time. MAVEN is the first spacecraft dedicated to exploring the tenuous upper atmosphere of Mars. Read more: <a href="http://1.usa.gov/1oj2Av3" rel="nofollow">1.usa.gov/1oj2Av3</a>
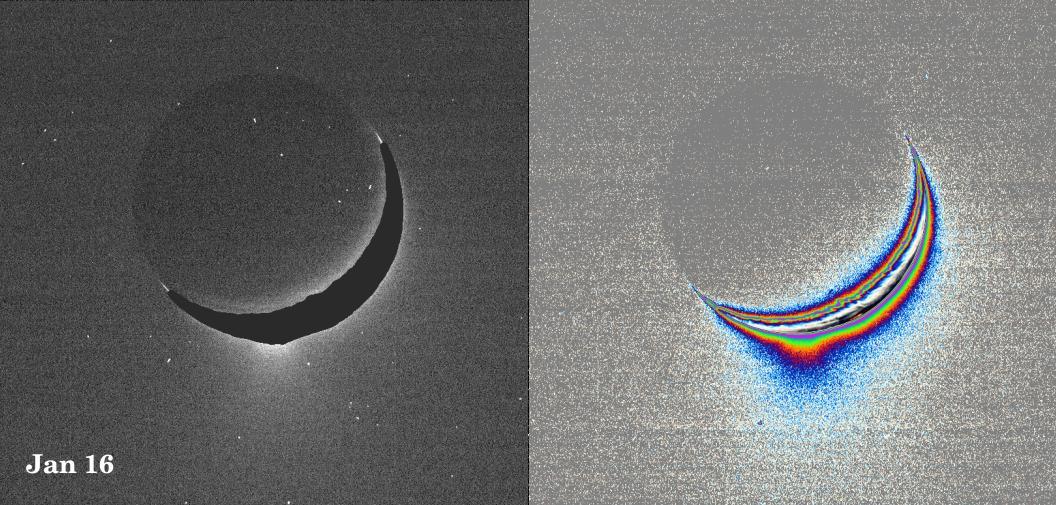
A fine spray of small, icy particles emanating from the warm, geologically unique province surrounding the south pole of Saturn’s moon Enceladus was observed in a Cassini narrow-angle camera image of the crescent moon taken on Jan. 16, 2005. Taken from a high-phase angle of 148 degrees -- a viewing geometry in which small particles become much easier to see -- the plume of material becomes more apparent in images processed to enhance faint signals. Imaging scientists have measured the light scattered by the plume's particles to determine their abundance and fall-off with height. Though the measurements of particle abundance are more certain within 100 kilometers (60 miles) of the surface, the values measured there are roughly consistent with the abundance of water ice particles measured by other Cassini instruments (reported in September, 2005) at altitudes as high as 400 kilometers (250 miles) above the surface. Imaging scientists, as reported in the journal Science on March 10, 2006, believe that the jets are geysers erupting from pressurized subsurface reservoirs of liquid water above 273 degrees Kelvin (0 degrees Celsius). The image at the left was taken in visible green light. A dark mask was applied to the moon's bright limb in order to make the plume feature easier to see. The image at the right has been color-coded to make faint signals in the plume more apparent. Images of other satellites (such as Tethys and Mimas) taken in the last 10 months from similar lighting and viewing geometries, and with identical camera parameters as this one, were closely examined to demonstrate that the plume towering above Enceladus' south pole is real and not a camera artifact. The images were acquired at a distance of about 209,400 kilometers (130,100 miles) from Enceladus. Image scale is about 1 kilometer (0.6 mile) per pixel. http://photojournal.jpl.nasa.gov/catalog/PIA07760
![These six infrared images of Saturn's moon Titan represent some of the clearest, most seamless-looking global views of the icy moon's surface produced so far. The views were created using 13 years of data acquired by the Visual and Infrared Mapping Spectrometer (VIMS) instrument on board NASA's Cassini spacecraft. The images are the result of a focused effort to smoothly combine data from the multitude of different observations VIMS made under a wide variety of lighting and viewing conditions over the course of Cassini's mission. Previous VIMS maps of Titan (for example, PIA02145) display great variation in imaging resolution and lighting conditions, resulting in obvious seams between different areas of the surface. With the seams now gone, this new collection of images is by far the best representation of how the globe of Titan might appear to the casual observer if it weren't for the moon's hazy atmosphere, and it likely will not be superseded for some time to come. Observing the surface of Titan in the visible region of the spectrum is difficult, due to the globe enshrouding haze that envelops the moon. This is primarily because small particles called aerosols in Titan's upper atmosphere strongly scatter visible light. But Titan's surface can be more readily imaged in a few infrared "windows" -- infrared wavelengths where scattering and absorption is much weaker. This is where the VIMS instrument excelled, parting the haze to obtain clear images of Titan's surface. (For comparison, Figure 1 shows Titan as it appears in visible light, as does PIA11603.) Making mosaics of VIMS images of Titan has always been a challenge because the data were obtained over many different flybys with different observing geometries and atmospheric conditions. One result is that very prominent seams appear in the mosaics that are quite difficult for imaging scientists to remove. But, through laborious and detailed analyses of the data, along with time consuming hand processing of the mosaics, the seams have been mostly removed. This is an update to the work previously discussed in PIA20022. Any full color image is comprised of three color channels: red, green and blue. Each of the three color channels combined to create these views was produced using a ratio between the brightness of Titan's surface at two different wavelengths (1.59/1.27 microns [red], 2.03/1.27 microns [green] and 1.27/1.08 microns [blue]). This technique (called a "band-ratio" technique) reduces the prominence of seams, as well as emphasizing subtle spectral variations in the materials on Titan's surface. For example, the moon's equatorial dune fields appear a consistent brown color here. There are also bluish and purplish areas that may have different compositions from the other bright areas, and may be enriched in water ice. For a map of Titan with latitudes, longitudes and labeled surface features, see PIA20713. It is quite clear from this unique set of images that Titan has a complex surface, sporting myriad geologic features and compositional units. The VIMS instrument has paved the way for future infrared instruments that could image Titan at much higher resolution, revealing features that were not detectable by any of Cassini's instruments. https://photojournal.jpl.nasa.gov/catalog/PIA21923](https://images-assets.nasa.gov/image/PIA21923/PIA21923~medium.jpg)
These six infrared images of Saturn's moon Titan represent some of the clearest, most seamless-looking global views of the icy moon's surface produced so far. The views were created using 13 years of data acquired by the Visual and Infrared Mapping Spectrometer (VIMS) instrument on board NASA's Cassini spacecraft. The images are the result of a focused effort to smoothly combine data from the multitude of different observations VIMS made under a wide variety of lighting and viewing conditions over the course of Cassini's mission. Previous VIMS maps of Titan (for example, PIA02145) display great variation in imaging resolution and lighting conditions, resulting in obvious seams between different areas of the surface. With the seams now gone, this new collection of images is by far the best representation of how the globe of Titan might appear to the casual observer if it weren't for the moon's hazy atmosphere, and it likely will not be superseded for some time to come. Observing the surface of Titan in the visible region of the spectrum is difficult, due to the globe enshrouding haze that envelops the moon. This is primarily because small particles called aerosols in Titan's upper atmosphere strongly scatter visible light. But Titan's surface can be more readily imaged in a few infrared "windows" -- infrared wavelengths where scattering and absorption is much weaker. This is where the VIMS instrument excelled, parting the haze to obtain clear images of Titan's surface. (For comparison, Figure 1 shows Titan as it appears in visible light, as does PIA11603.) Making mosaics of VIMS images of Titan has always been a challenge because the data were obtained over many different flybys with different observing geometries and atmospheric conditions. One result is that very prominent seams appear in the mosaics that are quite difficult for imaging scientists to remove. But, through laborious and detailed analyses of the data, along with time consuming hand processing of the mosaics, the seams have been mostly removed. This is an update to the work previously discussed in PIA20022. Any full color image is comprised of three color channels: red, green and blue. Each of the three color channels combined to create these views was produced using a ratio between the brightness of Titan's surface at two different wavelengths (1.59/1.27 microns [red], 2.03/1.27 microns [green] and 1.27/1.08 microns [blue]). This technique (called a "band-ratio" technique) reduces the prominence of seams, as well as emphasizing subtle spectral variations in the materials on Titan's surface. For example, the moon's equatorial dune fields appear a consistent brown color here. There are also bluish and purplish areas that may have different compositions from the other bright areas, and may be enriched in water ice. For a map of Titan with latitudes, longitudes and labeled surface features, see PIA20713. It is quite clear from this unique set of images that Titan has a complex surface, sporting myriad geologic features and compositional units. The VIMS instrument has paved the way for future infrared instruments that could image Titan at much higher resolution, revealing features that were not detectable by any of Cassini's instruments. https://photojournal.jpl.nasa.gov/catalog/PIA21923
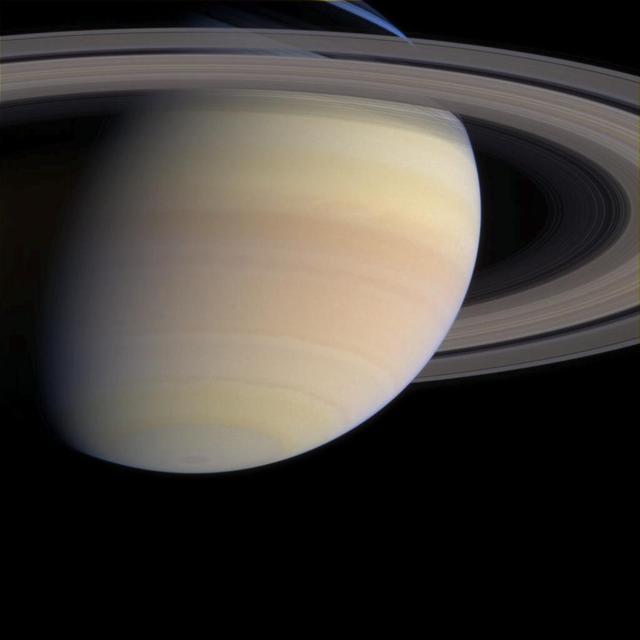
As Cassini coasts into the final month of its nearly seven-year trek, the serene majesty of its destination looms ahead. The spacecraft's cameras are functioning beautifully and continue to return stunning views from Cassini's position, 1.2 billion kilometers (750 million miles) from Earth and now 15.7 million kilometers (9.8 million miles) from Saturn. In this narrow angle camera image from May 21, 2004, the ringed planet displays subtle, multi-hued atmospheric bands, colored by yet undetermined compounds. Cassini mission scientists hope to determine the exact composition of this material. This image also offers a preview of the detailed survey Cassini will conduct on the planet's dazzling rings. Slight differences in color denote both differences in ring particle composition and light scattering properties. Images taken through blue, green and red filters were combined to create this natural color view. The image scale is 132 kilometers (82 miles) per pixel. http://photojournal.jpl.nasa.gov/catalog/PIA06060
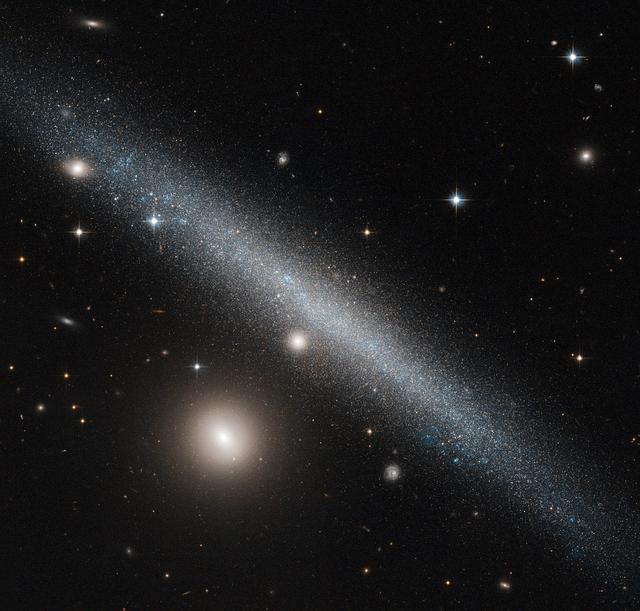
The galaxy cutting dramatically across the frame of this NASA/ESA Hubble Space Telescope image is a slightly warped dwarf galaxy known as UGC1281. Seen here from an edge-on perspective, this galaxy lies roughly 18 million light-years away in the constellation of Triangulum (The Triangle). The bright companion to the lower left of UGC 1281 is the small galaxy PGC 6700, officially known as 2MASX J01493473+3234464. Other prominent stars belonging to our own galaxy, the Milky Way, and more distant galaxies can be seen scattered throughout the sky. The side-on view we have of UGC 1281 makes it a perfect candidate for studies into how gas is distributed within galactic halos — the roughly spherical regions of diffuse gas extending outwards from a galaxy’s center. Astronomers have studied this galaxy to see how its gas vertically extends out from its central plane, and found it to be a quite typical dwarf galaxy. However, it does have a slightly warped shape to its outer edges, and is forming stars at a particularly low rate. European Space Agency Credit: ESA/NASA, Acknowledgement Luca Limatola
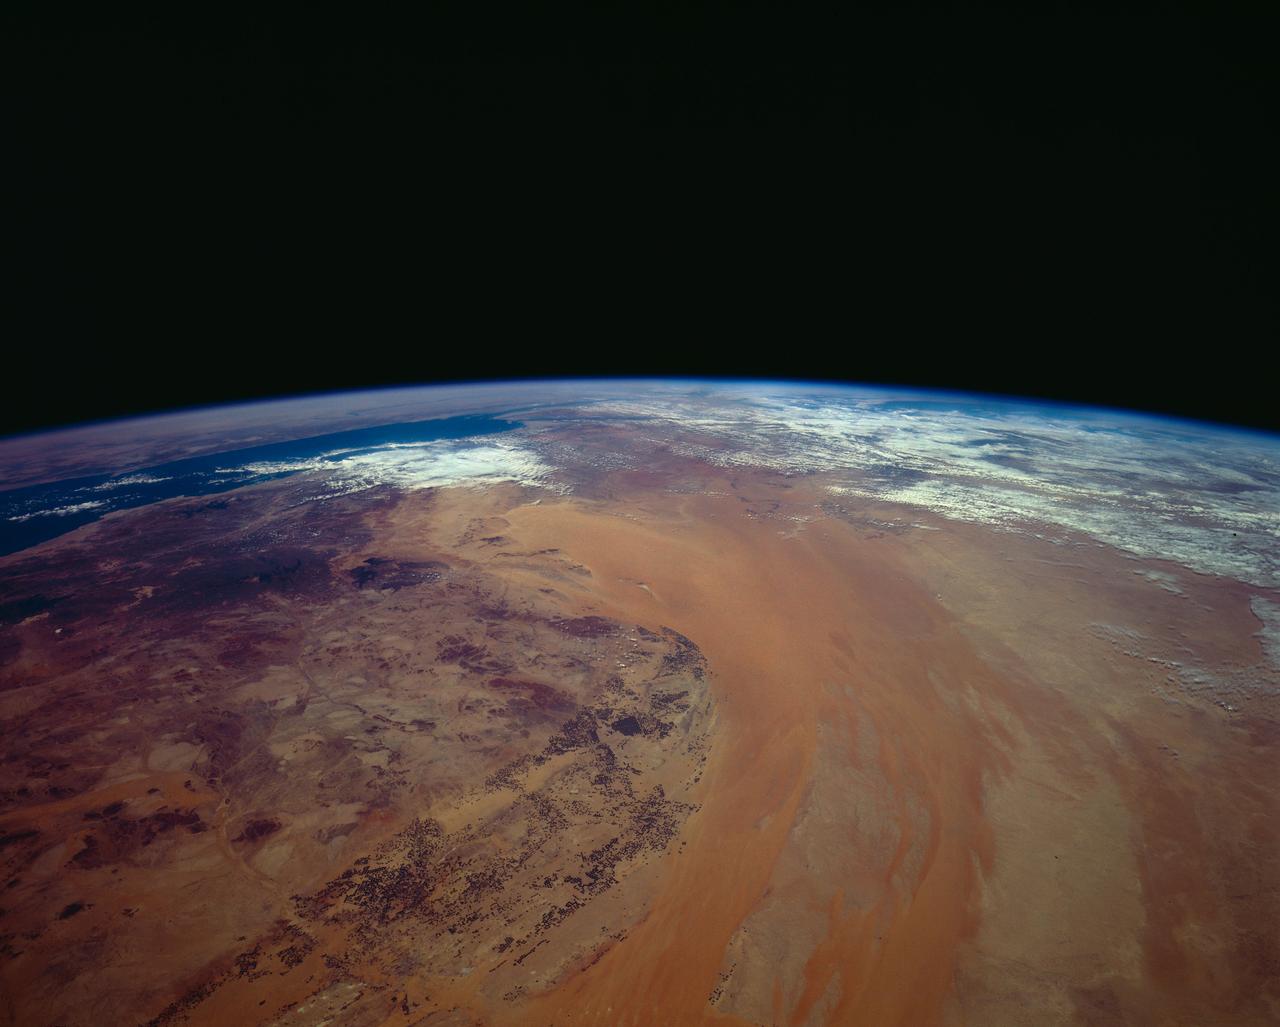
STS062-151-220 (4-18 March 1994) --- Great numbers of circular, center-pivot irrigation plots appear in this west-looking view of the northern Saudi Arabia (center to lower left). So many plots now exist that the face of Saudi Arabia as seen from low earth orbit has changed. Until a few years ago, there were only a few scattered center-pivots. Now the entire swath of country between the shifting sands of the Ad Dahna Sand Sea (light colors center and right) and the almost soilless Nejd Plateau (left) has been darkened by thousands of these agricultural fields. The Nejd Plateau is a mass of dark rocks, some volcanic, in NW Saudi Arabia. Water from this higher country flows east towards the agricultural region where it is pumped up from underground aquifers. The weep of the Ad Dahna Sand Sea is one of the major features of Saudi Arabia (center and right) as seen from the orbiter. The dunes follow the trend of regional winds (northwesterly in the center of the view) which circulate around the Nejd plateau. The north end of the Red Sea can be seen top left with the Sinai Peninsula and Mediterranean are just visible center top. Iraq is under cloud top right.
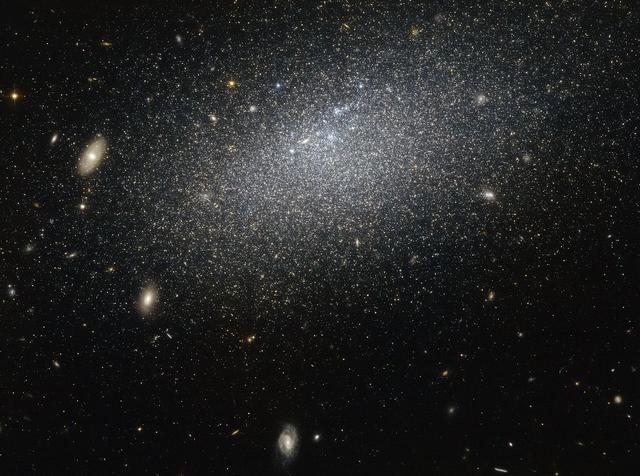
The drizzle of stars scattered across this image forms a galaxy known as UGC 4879. UGC 4879 is an irregular dwarf galaxy — as the name suggests, galaxies of this type are a little smaller and messier than their cosmic cousins, lacking the majestic swirl of a spiral or the coherence of an elliptical. This galaxy is also very isolated. There are about 2.3 million light years between UGC 4879 and its closest neighbour, Leo A, which is about the same distance as that between the Andromeda Galaxy and the Milky Way. This galaxy’s isolation means that it has not interacted with any surrounding galaxies, making it an ideal laboratory for studying star formation uncomplicated by interactions with other galaxies. Studies of UGC 4879 have revealed a significant amount of star formation in the first 4-billion-years after the Big Bang, followed by a strange nine-billion-year lull in star formation, ended 1-billion-years ago by a more recent reignition. The reason for this behaviour, however, remains mysterious, and the solitary galaxy continues to provide ample study material for astronomers looking to understand the complex mysteries of starbirth throughout the Universe.
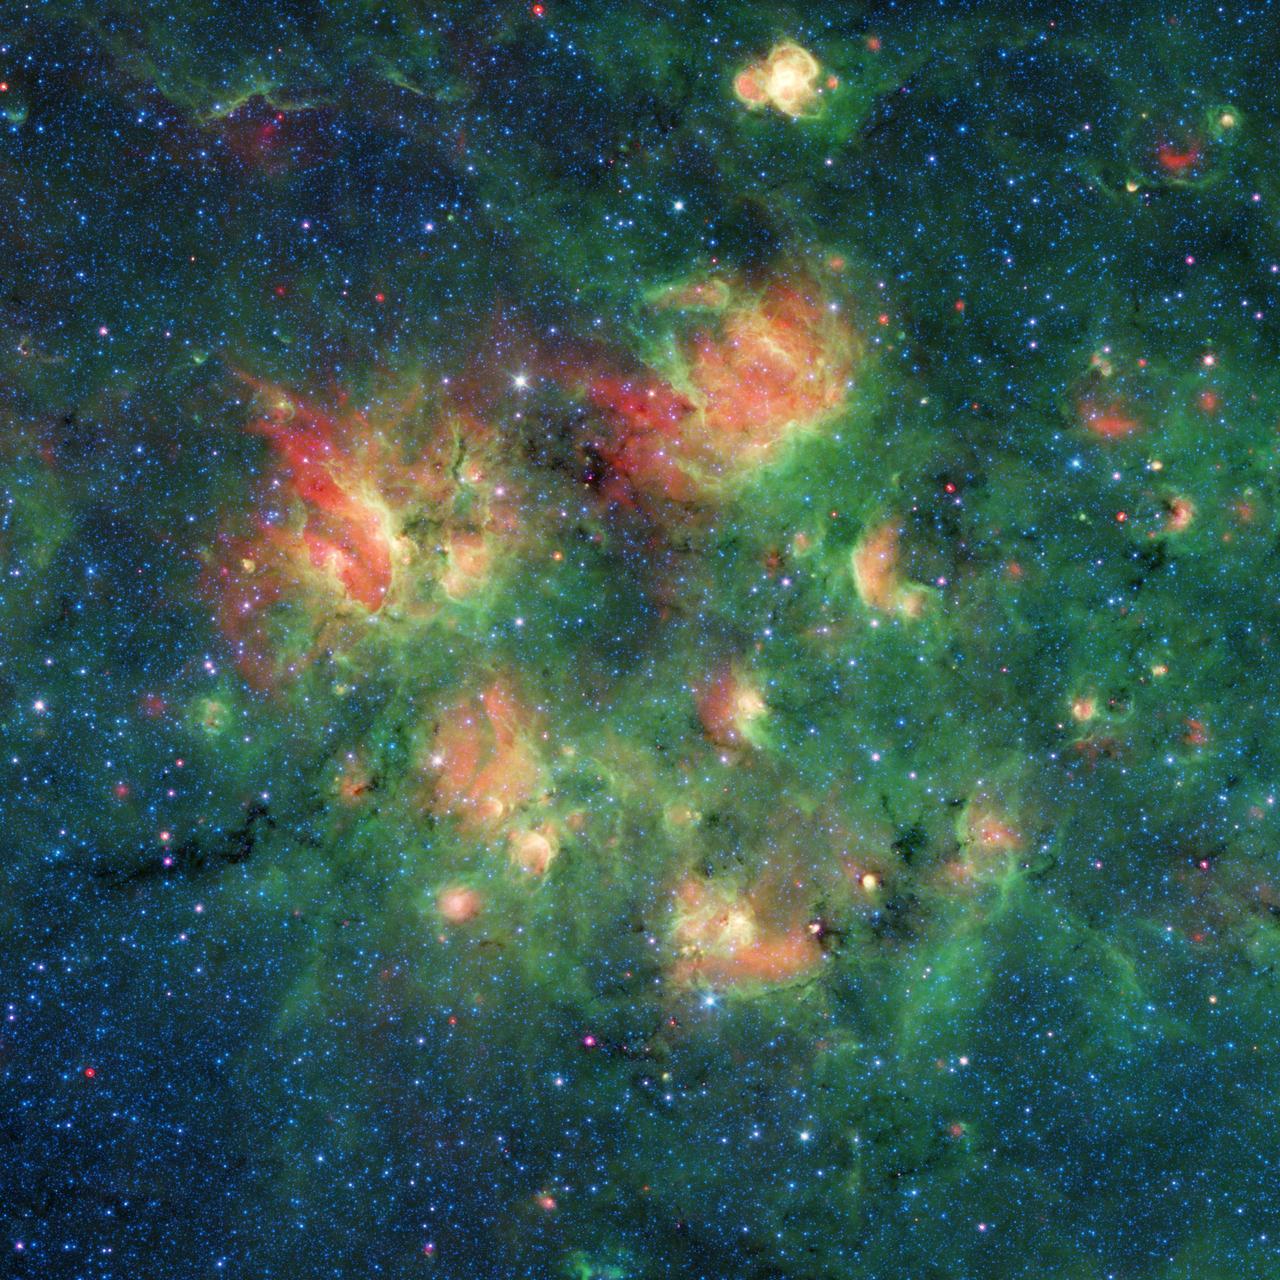
This infrared image from NASA's Spitzer Space Telescope shows a cloud of gas and dust full of bubbles, which are inflated by wind and radiation from massive young stars. Each bubble is filled with hundreds to thousands of stars, which form from dense clouds of gas and dust. The bubbles are estimated to be 10 to 30 light-years across, based on what astronomers know about them and other cosmic bubbles. However, determining the exact sizes of individual bubbles can be difficult, because their distance from Earth is challenging to measure and objects appear smaller the farther away they are. Flows of particles called stellar winds emitted by the stars, as well as the pressure of the light those winds produce, can push the surrounding material outward, sometimes creating a distinct perimeter. In Figure 1, the yellow circles and ovals outline more than 30 bubbles. This active region of star formation is located inside the Milky Way galaxy, in the constellation Aquila (also known as the Eagle). Black veins running throughout the cloud are regions of especially dense cold dust and gas where even more new stars are likely to form. The colors in this image represent different wavelengths of infrared light. Blue represents a wavelength of light primarily emitted by stars; dust and organic molecules called hydrocarbons appear green, and warm dust that's been heated by stars appears red. Also visible are four bow shocks — red arcs of warm dust formed as winds from fast-moving stars push aside dust grains scattered sparsely through most of the nebula. The locations of the bow shocks are indicated by squares in Figure 1. Figure 2 shows zoomed-in views of the four bow shocks. The bubbles and bow shocks in this image were identified as part of The Milky Way Project, a citizen science initiative on Zooniverse.org that seeks to map star formation throughout the galaxy. Participating citizen scientists looked through images from Spitzer's public data archive and identified as many bubbles as they could. More than 78,000 unique user accounts contributed. Astronomers running this program recently published a catalog of the bubble candidates that multiple citizen scientists had identified. The full Milky Way Project catalogs, which list a total of 2,600 bubbles and 599 bow shocks, are described in a paper published recently in Monthly Notices of the Royal Astronomical Society. Animation available at https://photojournal.jpl.nasa.gov/catalog/PIA23402
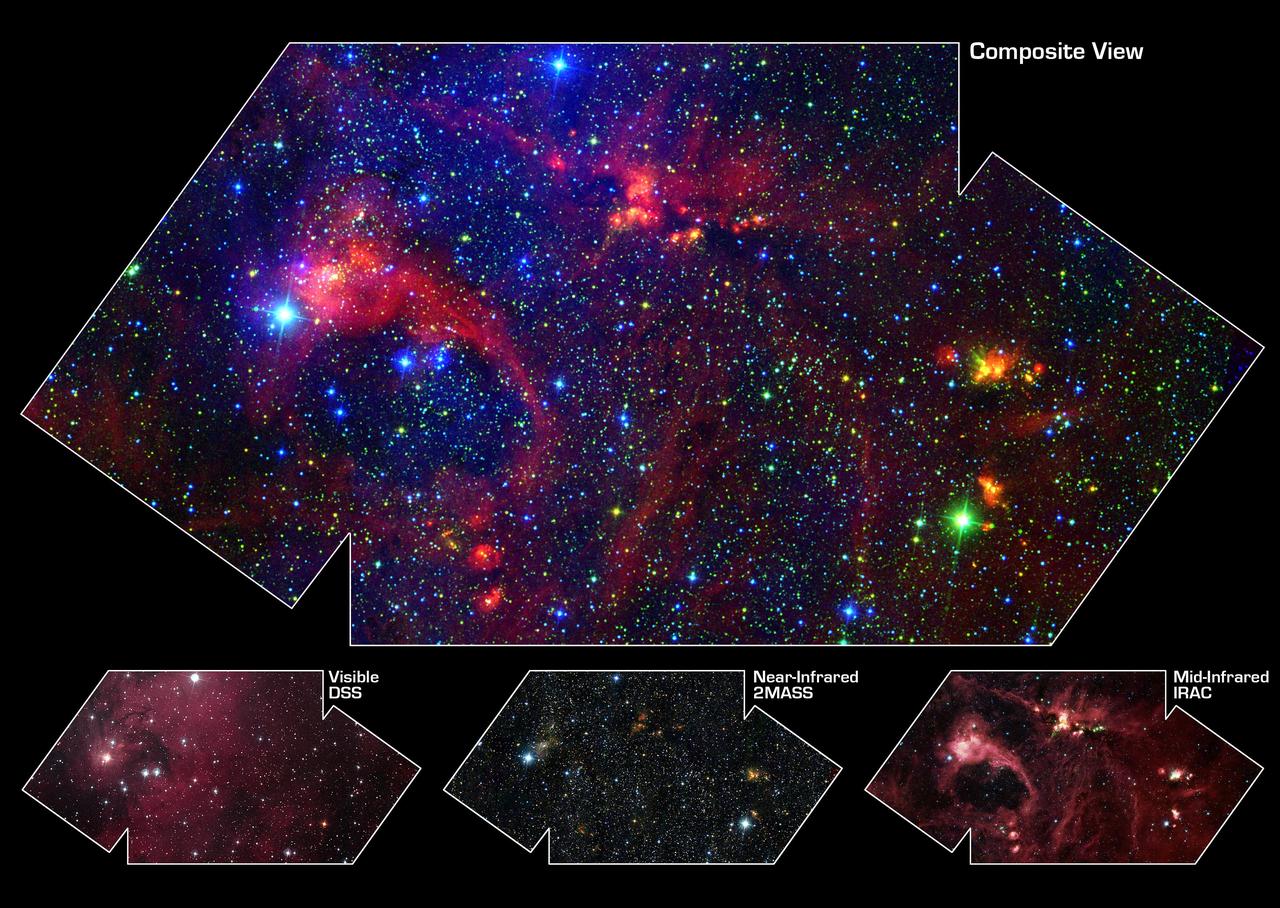
Hidden behind a shroud of dust in the constellation Cygnus is a stellar nursery called DR21, which is giving birth to some of the most massive stars in our galaxy. Visible light images reveal no trace of this interstellar cauldron because of heavy dust obscuration. In fact, visible light is attenuated in DR21 by a factor of more than 10,000,000,000,000,000,000,000,000,000,000,000,000,000 (ten thousand trillion heptillion). New images from NASA's Spitzer Space Telescope allow us to peek behind the cosmic veil and pinpoint one of the most massive natal stars yet seen in our Milky Way galaxy. The never-before-seen star is 100,000 times as bright as the Sun. Also revealed for the first time is a powerful outflow of hot gas emanating from this star and bursting through a giant molecular cloud. The colorful image (top panel) is a large-scale composite mosaic assembled from data collected at a variety of different wavelengths. Views at visible wavelengths appear blue, near-infrared light is depicted as green, and mid-infrared data from the InfraRed Array Camera (IRAC) aboard NASA's Spitzer Space Telescope is portrayed as red. The result is a contrast between structures seen in visible light (blue) and those observed in the infrared (yellow and red). A quick glance shows that most of the action in this image is revealed to the unique eyes of Spitzer. The image covers an area about two times that of a full moon. Each of the constituent images is shown below the large mosaic. The Digital Sky Survey (DSS) image (lower left) provides a familiar view of deep space, with stars scattered around a dark field. The reddish hue is from gas heated by foreground stars in this region. This fluorescence fades away in the near-infrared Two-Micron All-Sky Survey (2MASS) image (lower center), but other features start to appear through the obscuring clouds of dust, now increasingly transparent. Many more stars are discerned in this image because near-infrared light pierces through some of the obscuration of the interstellar dust. Note that some stars seen as very bright in the visible image are muted in the near-infrared image, whereas other stars become more prominent. Embedded nebulae revealed in the Spitzer image are only hinted at in this picture. The Spitzer image (lower right) provides a vivid contrast to the other component images, revealing star-forming complexes and large-scale structures otherwise hidden from view. The Spitzer image is composed of photographs obtained at four wavelengths: 3.6 microns (blue), 4.5 microns (green), 5.8 microns (orange) and 8 microns (red). The brightest infrared cloud near the top center corresponds to DR21, which presumably contains a cluster of newly forming stars at a distance of nearly 10,000 light-years. The red filaments stretching across the Spitzer image denote the presence of polycyclic aromatic hydrocarbons. These organic molecules, comprised of carbon and hydrogen, are excited by surrounding interstellar radiation and become luminescent at wavelengths near 8 microns. The complex pattern of filaments is caused by an intricate combination of radiation pressure, gravity, and magnetic fields. The result is a tapestry in which winds, outflows, and turbulence move and shape the interstellar medium. http://photojournal.jpl.nasa.gov/catalog/PIA05735
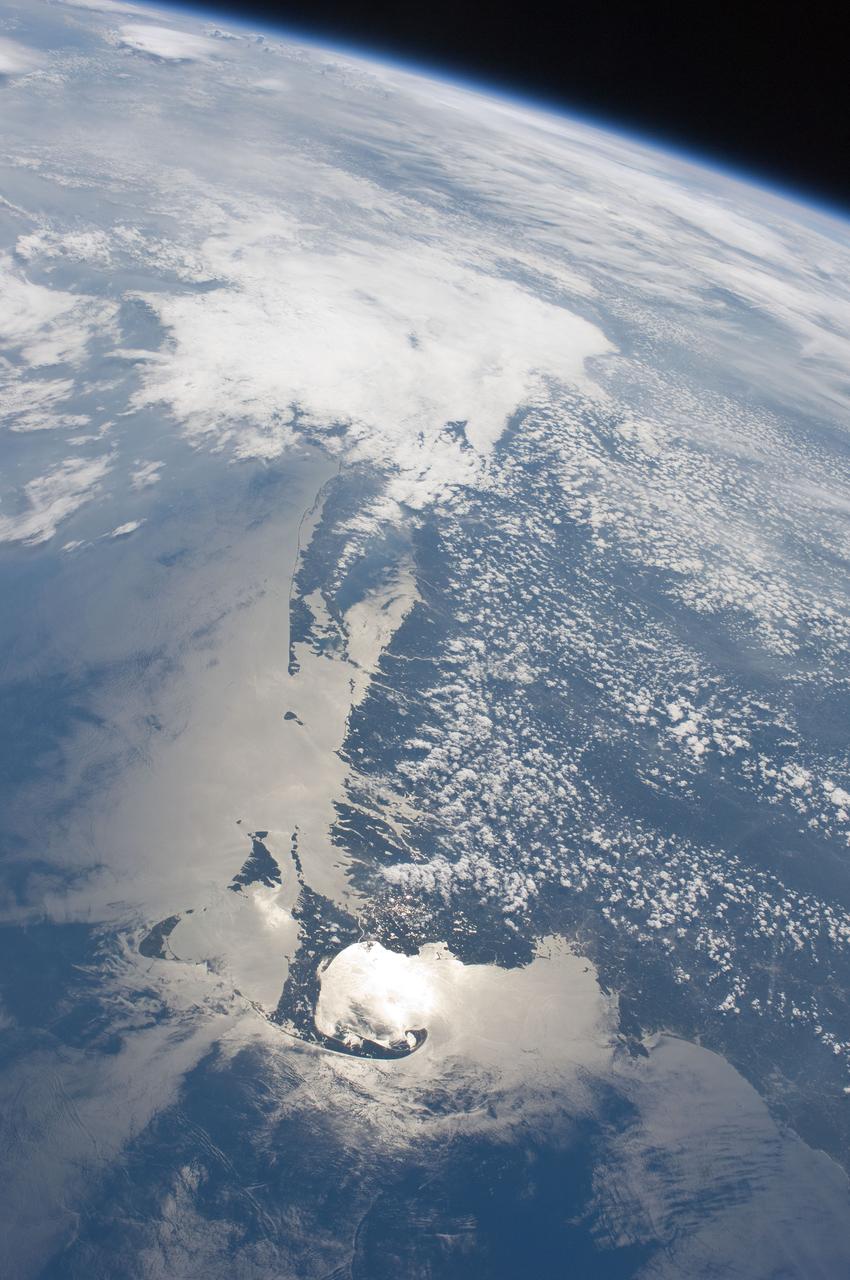
ISS028-E-009979 (27 June 2011) --- The Massachusetts coastline is featured in this image photographed by an Expedition 28 crew member on the International Space Station. The Crew Earth Observations team at NASA Johnson Space Center sends specific ground targets for photography up to the station crew on a daily basis, but sometimes the crew takes imagery on their own of striking displays visible from orbit. One such display, often visible to the ISS crew due to their ability to look outwards at angles between 0 and 90 degrees, is sunglint on the waters of Earth. Sunglint is caused by sunlight reflecting off of a water surface?much as light reflects from a mirror?directly towards the observer. Roughness variations of the water surface scatter the light, blurring the reflection and producing the typical silvery sheen of the sunglint area. The point of maximum sunglint is centered within Cape Cod Bay, the body of water partially enclosed by the ?hook? of Cape Cod in Massachusetts (bottom). Cape Cod was formally designated a National Seashore in 1966. Sunglint off the water provides sharp contrast with the coastline and the nearby islands of Martha?s Vineyard and Nantucket (lower left), both popular destinations for tourists and summer residents. To the north, rocky Cape Ann extends out into the Atlantic Ocean; the border with New Hampshire is located approximately 30 kilometers up the coast. Further to the west, the eastern half of Long Island, New York is visible emerging from extensive cloud cover over the mid-Atlantic and Midwestern States. Persistent storm tracks had been contributing to record flooding along rivers in the Midwest at the time this image was taken in late June 2011. Thin blue layers of the atmosphere, contrasted against the darkness of space, are visible extending along the Earth?s curvature at top.

This galaxy, known as NGC 2337, resides 25 million light-years away in the constellation of Lynx. NGC 2337 is an irregular galaxy, meaning that it — along with a quarter of all galaxies in the Universe — lacks a distinct, regular appearance. The galaxy was discovered in 1877 by the French astronomer Édouard Stephan who, in the same year, discovered the galactic group Stephan’s Quintet (heic0910i). Although irregular galaxies may never win a beauty prize when competing with their more symmetrical spiral and elliptical peers, astronomers consider them to be very important. Some irregular galaxies may have once fallen into one of the regular classes of the Hubble sequence, but were warped and deformed by a passing cosmic companion. As such, irregular galaxies provide astronomers with a valuable opportunity to learn more about galactic evolution and interaction. Despite the disruption, gravitational interactions between galaxies can kickstart star formation activity within the affected galaxies, which may explain the pockets of blue light scattered throughout NGC 2337. These patches and knots of blue signal the presence of young, newly formed, hot stars. Image credit: ESA/Hubble & NASA Text credit: European Space Agency <b><a href="http://www.nasa.gov/audience/formedia/features/MP_Photo_Guidelines.html" rel="nofollow">NASA image use policy.</a></b> <b><a href="http://www.nasa.gov/centers/goddard/home/index.html" rel="nofollow">NASA Goddard Space Flight Center</a></b> enables NASA’s mission through four scientific endeavors: Earth Science, Heliophysics, Solar System Exploration, and Astrophysics. Goddard plays a leading role in NASA’s accomplishments by contributing compelling scientific knowledge to advance the Agency’s mission. <b>Follow us on <a href="http://twitter.com/NASAGoddardPix" rel="nofollow">Twitter</a></b> <b>Like us on <a href="http://www.facebook.com/pages/Greenbelt-MD/NASA-Goddard/395013845897?ref=tsd" rel="nofollow">Facebook</a></b> <b>Find us on <a href="http://instagrid.me/nasagoddard/?vm=grid" rel="nofollow">Instagram</a></b>

This irregular dwarf galaxy's closes neighbor is 2.3 million light years away, so yeah, we're calling it "isolated". The drizzle of stars scattered across this image forms a galaxy known as UGC 4879. UGC 4879 is an irregular dwarf galaxy — as the name suggests, galaxies of this type are a little smaller and messier than their cosmic cousins, lacking the majestic swirl of a spiral or the coherence of an elliptical. This galaxy is also very isolated. There are about 2.3 million light years between UGC 4879 and its closest neighbor, Leo A, which is about the same distance as that between the Andromeda Galaxy and the Milky Way. This galaxy’s isolation means that it has not interacted with any surrounding galaxies, making it an ideal laboratory for studying star formation uncomplicated by interactions with other galaxies. Studies of UGC 4879 have revealed a significant amount of star formation in the first 4 billion years after the Big Bang, followed by a strange 9-billion-year lull in star formation that ended 1 billion years ago by a more recent re-ignition. The reason for this behavior, however, remains mysterious, and the solitary galaxy continues to provide ample study material for astronomers looking to understand the complex mysteries of star birth throughout the universe. Image credit: NASA/ESA <b><a href="http://www.nasa.gov/audience/formedia/features/MP_Photo_Guidelines.html" rel="nofollow">NASA image use policy.</a></b> <b><a href="http://www.nasa.gov/centers/goddard/home/index.html" rel="nofollow">NASA Goddard Space Flight Center</a></b> enables NASA’s mission through four scientific endeavors: Earth Science, Heliophysics, Solar System Exploration, and Astrophysics. Goddard plays a leading role in NASA’s accomplishments by contributing compelling scientific knowledge to advance the Agency’s mission. <b>Follow us on <a href="http://twitter.com/NASAGoddardPix" rel="nofollow">Twitter</a></b> <b>Like us on <a href="http://www.facebook.com/pages/Greenbelt-MD/NASA-Goddard/395013845897?ref=tsd" rel="nofollow">Facebook</a></b> <b>Find us on <a href="http://instagrid.me/nasagoddard/?vm=grid" rel="nofollow">Instagram</a></b>
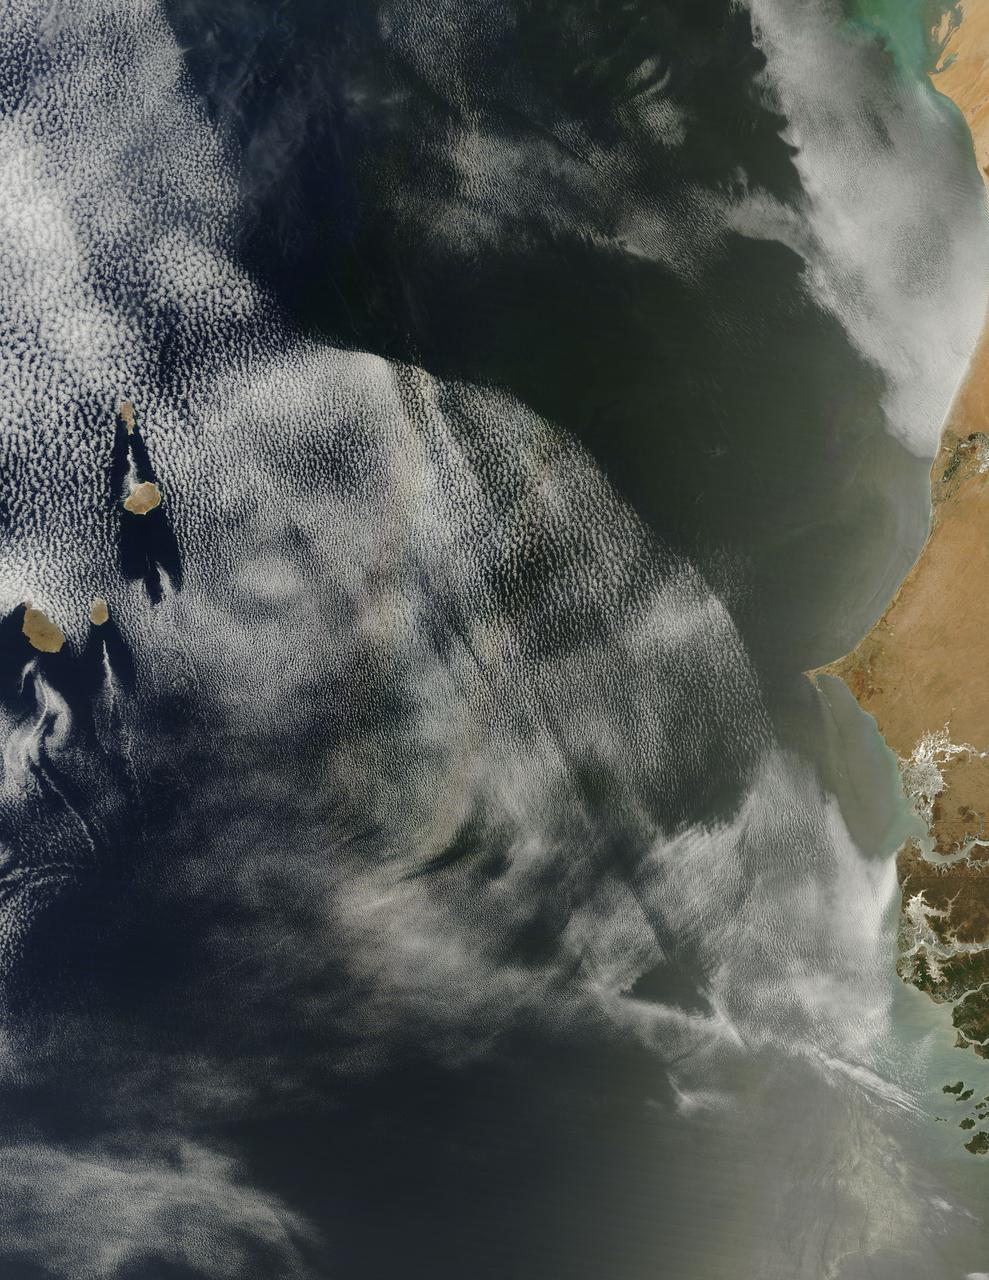
On April 23, 2013 NASA’s Terra satellite passed off the coast of West Africa, allowing the Moderate Resolution Imaging Spectroradiometer (MODIS) flying aboard to capture a curious phenomenon over the cloud deck below. The rainbow-like discoloration that can be seen streaking across the bank of marine cumulus clouds near the center of this image is known as a “glory”. A glory is caused by the scattering of sunlight by a cloud made of water droplets that are all roughly the same size, and is only produced when the light is just right. In order for a glory to be viewed, the observer’s anti-solar point must fall on the cloud deck below. In this case the observer is the Terra satellite, and the anti-solar point is where the sun is directly behind you – 180° from the MODIS line of sight. Water and ice particles in the cloud bend the light, breaking it into all its wavelengths, and the result is colorful flare, which may contain all of the colors of the rainbow. Credit: NASA/GSFC/Jeff Schmaltz/MODIS Land Rapid Response Team <b><a href="http://www.nasa.gov/audience/formedia/features/MP_Photo_Guidelines.html" rel="nofollow">NASA image use policy.</a></b> <b><a href="http://www.nasa.gov/centers/goddard/home/index.html" rel="nofollow">NASA Goddard Space Flight Center</a></b> enables NASA’s mission through four scientific endeavors: Earth Science, Heliophysics, Solar System Exploration, and Astrophysics. Goddard plays a leading role in NASA’s accomplishments by contributing compelling scientific knowledge to advance the Agency’s mission. <b>Follow us on <a href="http://twitter.com/NASA_GoddardPix" rel="nofollow">Twitter</a></b> <b>Like us on <a href="http://www.facebook.com/pages/Greenbelt-MD/NASA-Goddard/395013845897?ref=tsd" rel="nofollow">Facebook</a></b> <b>Find us on <a href="http://instagram.com/nasagoddard?vm=grid" rel="nofollow">Instagram</a></b>
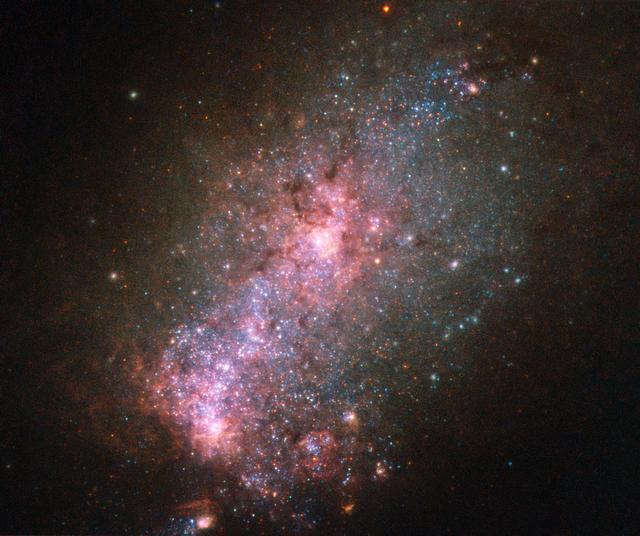
This NASA/ESA Hubble Space Telescope image reveals the vibrant core of the galaxy NGC 3125. Discovered by John Herschel in 1835, NGC 3125 is a great example of a starburst galaxy — a galaxy in which unusually high numbers of new stars are forming, springing to life within intensely hot clouds of gas. Located approximately 50 million light-years away in the constellation of Antlia (The Air Pump), NGC 3125 is similar to, but unfathomably brighter and more energetic than, one of the Magellanic Clouds. Spanning 15,000 light-years, the galaxy displays massive and violent bursts of star formation, as shown by the hot, young, and blue stars scattered throughout the galaxy’s rose-tinted core. Some of these clumps of stars are notable — one of the most extreme Wolf–Rayet star clusters in the local Universe, NGC 3125-A1, resides within NGC 3125. Despite their appearance, the fuzzy white blobs dotted around the edge of this galaxy are not stars, but globular clusters. Found within a galaxy’s halo, globular clusters are ancient collections of hundreds of thousands of stars. They orbit around galactic centers like satellites — the Milky Way, for example, hosts over 150 of them. Image credit: ESA/Hubble & NASA, Acknowledgement: Judy Schmidt <b><a href="http://www.nasa.gov/audience/formedia/features/MP_Photo_Guidelines.html" rel="nofollow">NASA image use policy.</a></b> <b><a href="http://www.nasa.gov/centers/goddard/home/index.html" rel="nofollow">NASA Goddard Space Flight Center</a></b> enables NASA’s mission through four scientific endeavors: Earth Science, Heliophysics, Solar System Exploration, and Astrophysics. Goddard plays a leading role in NASA’s accomplishments by contributing compelling scientific knowledge to advance the Agency’s mission. <b>Follow us on <a href="http://twitter.com/NASAGoddardPix" rel="nofollow">Twitter</a></b> <b>Like us on <a href="http://www.facebook.com/pages/Greenbelt-MD/NASA-Goddard/395013845897?ref=tsd" rel="nofollow">Facebook</a></b> <b>Find us on <a href="http://instagrid.me/nasagoddard/?vm=grid" rel="nofollow">Instagram</a></b>
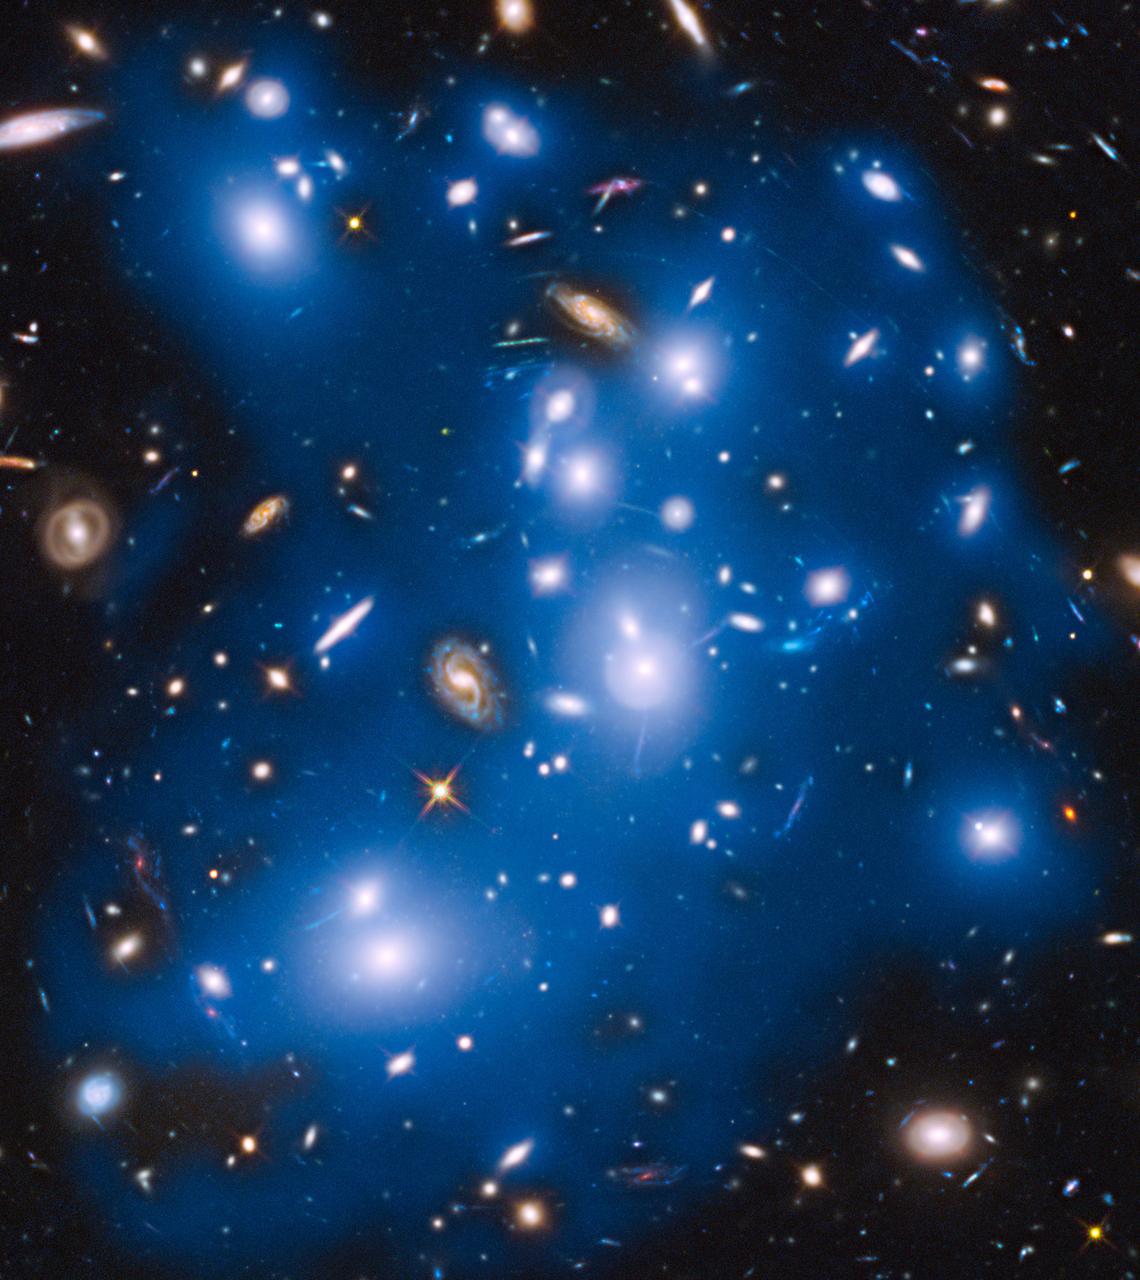
NASA’s Hubble Space Telescope has picked up the faint, ghostly glow of stars ejected from ancient galaxies that were gravitationally ripped apart several billion years ago. The mayhem happened 4 billion light-years away, inside an immense collection of nearly 500 galaxies nicknamed “Pandora’s Cluster,” also known as Abell 2744. The scattered stars are no longer bound to any one galaxy, and drift freely between galaxies in the cluster. By observing the light from the orphaned stars, Hubble astronomers have assembled forensic evidence that suggests as many as six galaxies were torn to pieces inside the cluster over a stretch of 6 billion years. Read more: <a href="http://1.usa.gov/1yK2Ucp" rel="nofollow">1.usa.gov/1yK2Ucp</a> Credit: NASA/ESA/IAC/HFF Team, STScI <b><a href="http://www.nasa.gov/audience/formedia/features/MP_Photo_Guidelines.html" rel="nofollow">NASA image use policy.</a></b> <b><a href="http://www.nasa.gov/centers/goddard/home/index.html" rel="nofollow">NASA Goddard Space Flight Center</a></b> enables NASA’s mission through four scientific endeavors: Earth Science, Heliophysics, Solar System Exploration, and Astrophysics. Goddard plays a leading role in NASA’s accomplishments by contributing compelling scientific knowledge to advance the Agency’s mission. <b>Follow us on <a href="http://twitter.com/NASAGoddardPix" rel="nofollow">Twitter</a></b> <b>Like us on <a href="http://www.facebook.com/pages/Greenbelt-MD/NASA-Goddard/395013845897?ref=tsd" rel="nofollow">Facebook</a></b> <b>Find us on <a href="http://instagram.com/nasagoddard?vm=grid" rel="nofollow">Instagram</a></b>
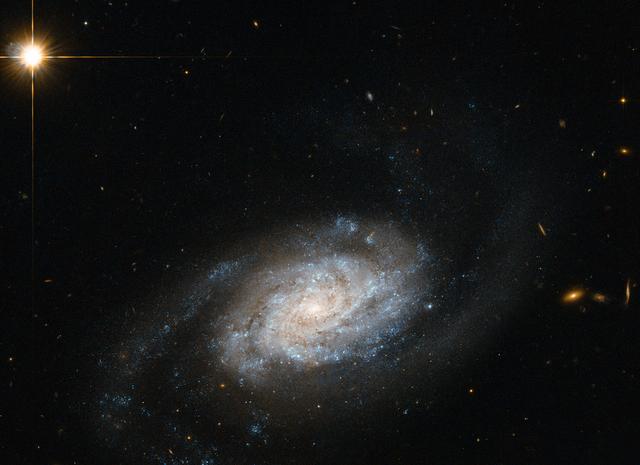
Shown here is a spiral galaxy known as NGC 3455, which lies some 65 million light-years away from us in the constellation of Leo (the Lion). Galaxies are classified into different types according to their structure and appearance. This classification system is known as the Hubble Sequence, named after its creator Edwin Hubble. In this image released 14, April, 2014, NGC 3455 is known as a type SB galaxy — a barred spiral. Barred spiral galaxies account for approximately two thirds of all spirals. Galaxies of this type appear to have a bar of stars slicing through the bulge of stars at their center. The SB classification is further sub-divided by the appearance of a galaxy's pinwheeling spiral arms; SBa types have more tightly wound arms, whereas SBc types have looser ones. SBb types, such as NGC 3455, lie in between. NGC 3455 is part of a pair of galaxies — its partner, NGC 3454, lies out of frame. This cosmic duo belong to a group known as the NGC 3370 group, which is in turn one of the Leo II groups, a large collection of galaxies scattered some 30 million light-years to the right of the Virgo cluster. This image is from Hubble's Advanced Camera for Surveys. Credit: ESA/Hubble & NASA, Acknowledgement: Nick Rose <b><a href="http://www.nasa.gov/audience/formedia/features/MP_Photo_Guidelines.html" rel="nofollow">NASA image use policy.</a></b> <b><a href="http://www.nasa.gov/centers/goddard/home/index.html" rel="nofollow">NASA Goddard Space Flight Center</a></b> enables NASA’s mission through four scientific endeavors: Earth Science, Heliophysics, Solar System Exploration, and Astrophysics. Goddard plays a leading role in NASA’s accomplishments by contributing compelling scientific knowledge to advance the Agency’s mission. <b>Follow us on <a href="http://twitter.com/NASAGoddardPix" rel="nofollow">Twitter</a></b> <b>Like us on <a href="http://www.facebook.com/pages/Greenbelt-MD/NASA-Goddard/395013845897?ref=tsd" rel="nofollow">Facebook</a></b> <b>Find us on <a href="http://instagram.com/nasagoddard?vm=grid" rel="nofollow">Instagram</a></b>
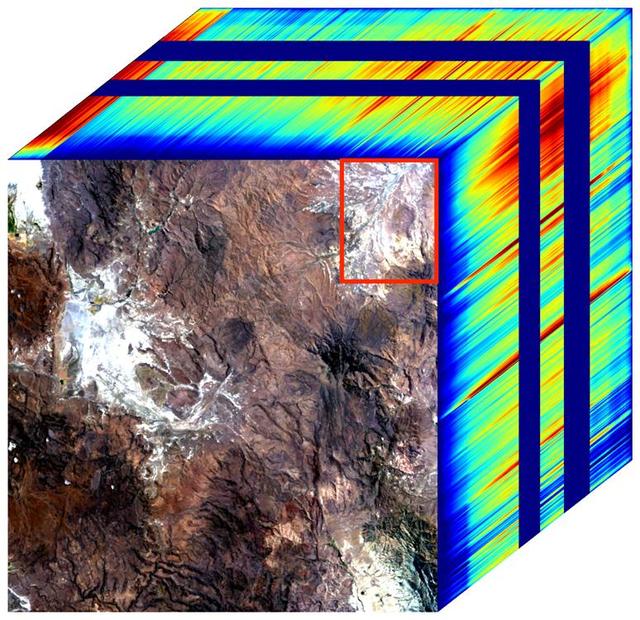
The front panel of this image cube shows the true-color view of an area in northwest Nevada observed by NASA's Earth Surface Mineral Dust Source Investigation (EMIT) imaging spectrometer. The side panels depict the spectral fingerprint for every point in the image, which shows an area about 130 miles (209 kilometers) northeast of Lake Tahoe. The instrument works by measuring reflected solar energy from Earth across hundreds of wavelengths from the visible to the infrared range of the spectrum. The intensity of the reflected light varies by wavelength based on the material. Scientists are using these patterns, called spectral fingerprints, to identify surface minerals and pinpoint their locations on a map. The cube was among the first created by EMIT scientists as they confirmed that the instrument was collecting data accurately before the start of science operations. Analysis of the patterns indicate areas dominated by kaolinite, a light-colored clay mineral. When dust from the kaolinite-dominated areas is lofted into the atmosphere, the particles tend to scatter sunlight and reflect it back to space, cooling the air. Over the course of its 12-month mission, EMIT will collect measurements of 10 important surface minerals – kaolinite, hematite, goethite, illite, vermiculite, calcite, dolomite, montmorillonite, chlorite, and gypsum – in arid regions between 50-degree south and north latitudes in Africa, Asia, North and South America, and Australia. The data EMIT collects will help scientists better understand the role of airborne dust particles in heating and cooling Earth's atmosphere on global and regional scales. Since EMIT was installed on the International Space Station in late July 2022, the science team has been validating the data it collects against data gathered in 2018 by the Airborne Visible/Infrared Imaging Spectrometer (AVIRIS). EMIT and AVIRIS were developed at NASA's Jet Propulsion Laboratory, which is managed for the agency by Caltech in Pasadena, California. https://photojournal.jpl.nasa.gov/catalog/PIA25427
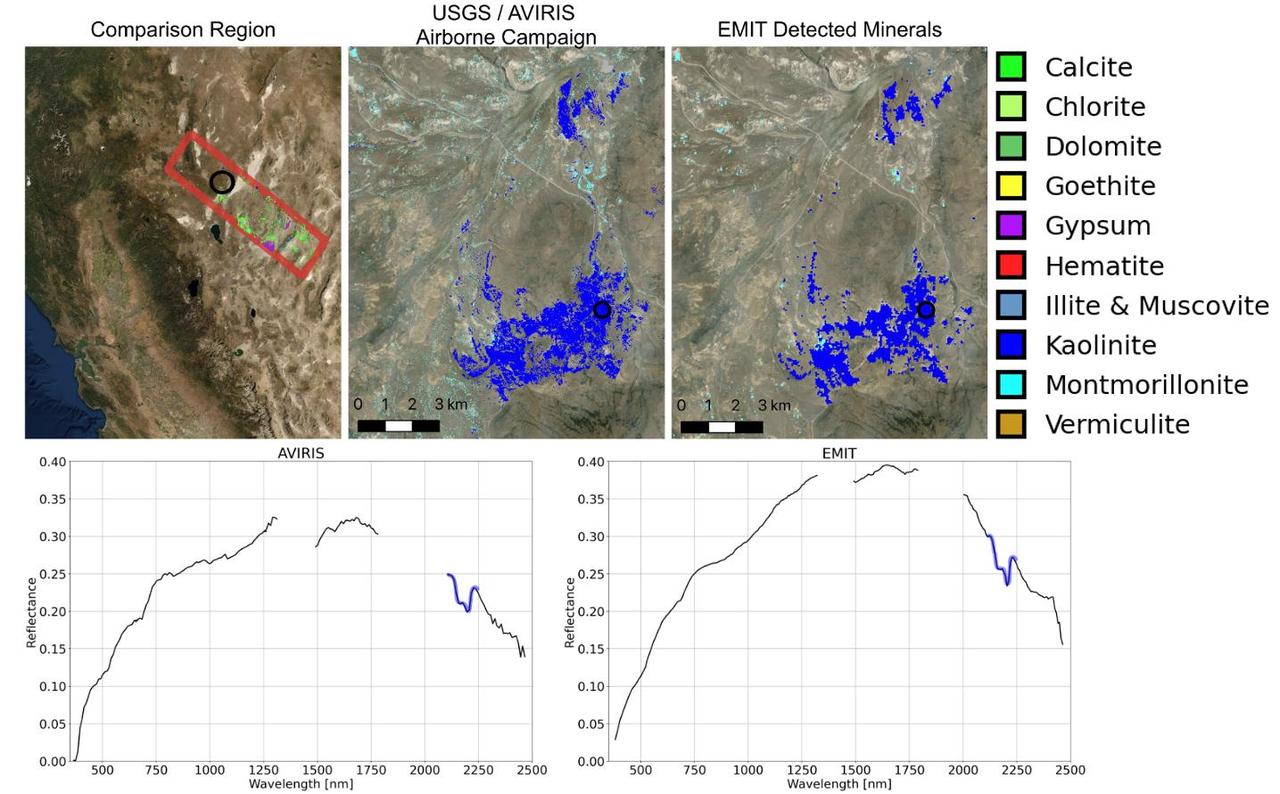
Since NASA's Earth Surface Mineral Dust Source Investigation (EMIT) imaging spectrometer was installed on the International Space Station in late July 2022, the EMIT science team has been validating its data against data gathered in 2018 by NASA's Airborne Visible/Infrared Imaging Spectrometer (AVIRIS). EMIT recently collected data from a mountainous area of Nevada about 130 miles (209 kilometers) northeast of Lake Tahoe. The instrument measures reflected solar energy from Earth across hundreds of wavelengths from the visible to the infrared range of the spectrum. The intensity of the reflected light varies by wavelength based on the material. Scientists use these patterns, called spectral fingerprints, to pinpoint the locations of surface minerals on a map. The top left map shows the region both the EMIT and AVIRIS data sets cover. The center image is a mineral map featuring AVIRIS data. At right is a map generated with EMIT data. The center and right images reveal portions of the landscape dominated by kaolinite, a light-colored clay mineral that scatters sunlight. This comparison, which shows a close match of the data, was one of many that confirmed the accuracy of EMIT's data. The bottom row features an AVIRIS spectral fingerprint, left, beside EMIT data for the same location. The graphs show agreement in the kaolinite fingerprint region, which is marked in blue. Over the course of its 12-month mission, EMIT will collect measurements of 10 important surface minerals – kaolinite, hematite, goethite, illite, vermiculite, calcite, dolomite, montmorillonite, chlorite, and gypsum – in arid regions between 50-degree south and north latitudes in Africa, Asia, North and South America, and Australia. The data EMIT collects will help scientists better understand the role of airborne dust particles in heating and cooling Earth's atmosphere on global and regional scales. https://photojournal.jpl.nasa.gov/catalog/PIA25428