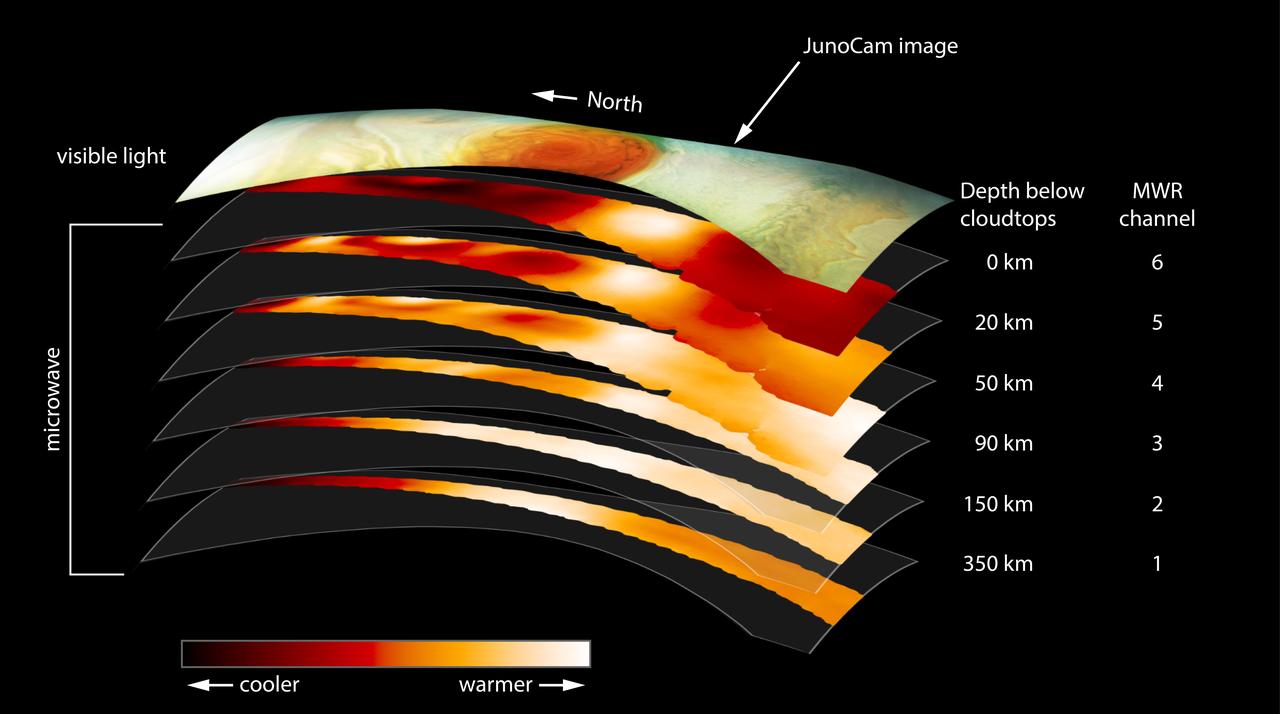
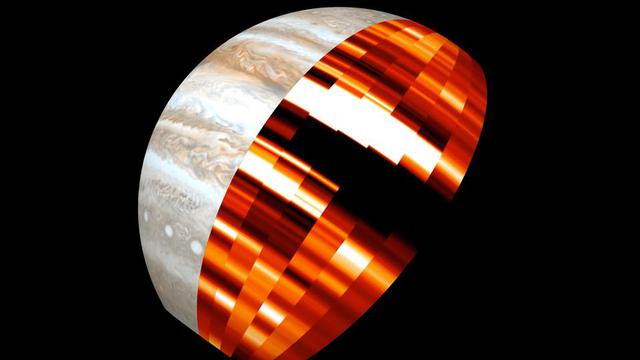
This figure shows data from the six channels of the microwave radiometer (MWR) instrument onboard NASA's Juno spacecraft. The data were collected in the mission's sixth science orbit (referred to as "perijove 7"), during which the spacecraft passed over Jupiter's Great Red Spot. The top layer in the figure is a visible light image from the mission's JunoCam instrument, provided for context. The MWR instrument enables Juno to see deeper into Jupiter than any previous spacecraft or Earth-based observations. Each MWR channel peers progressively deeper below the visible cloud tops. Channel 1 is sensitive to longer microwave wavelengths; each of the other channels is sensitive to progressively shorter wavelengths. The large-scale structure of the Great Red Spot is visible in the data as deep into Jupiter as MWR can observe. https://photojournal.jpl.nasa.gov/catalog/PIA22177
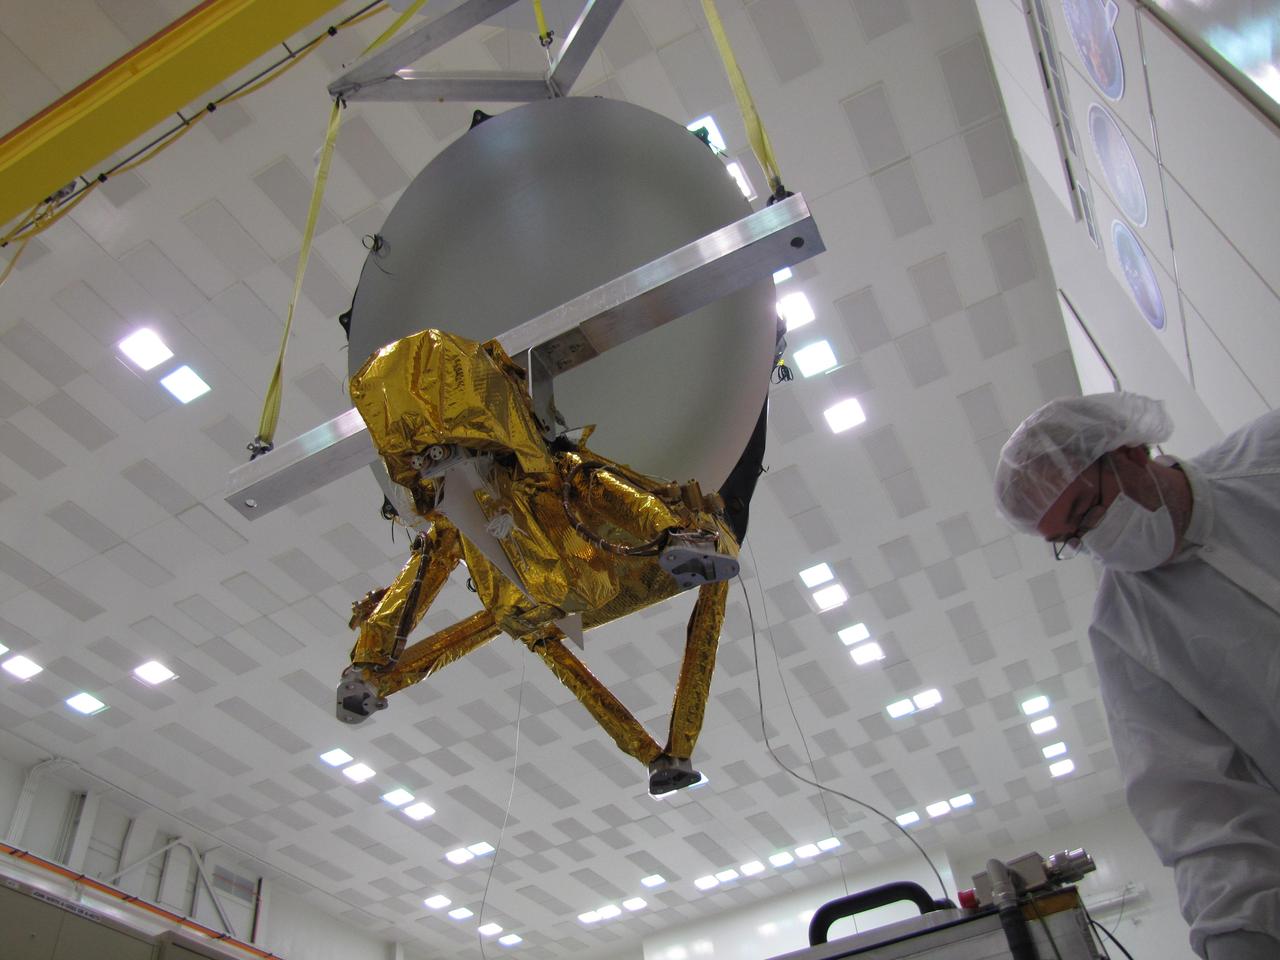
JPL technicians perform a practice run of the mechanical integration sequence that will be used to mate the Jason-3 spacecraft Advanced Microwave Radiometer instrument to the Jason-3 satellite.
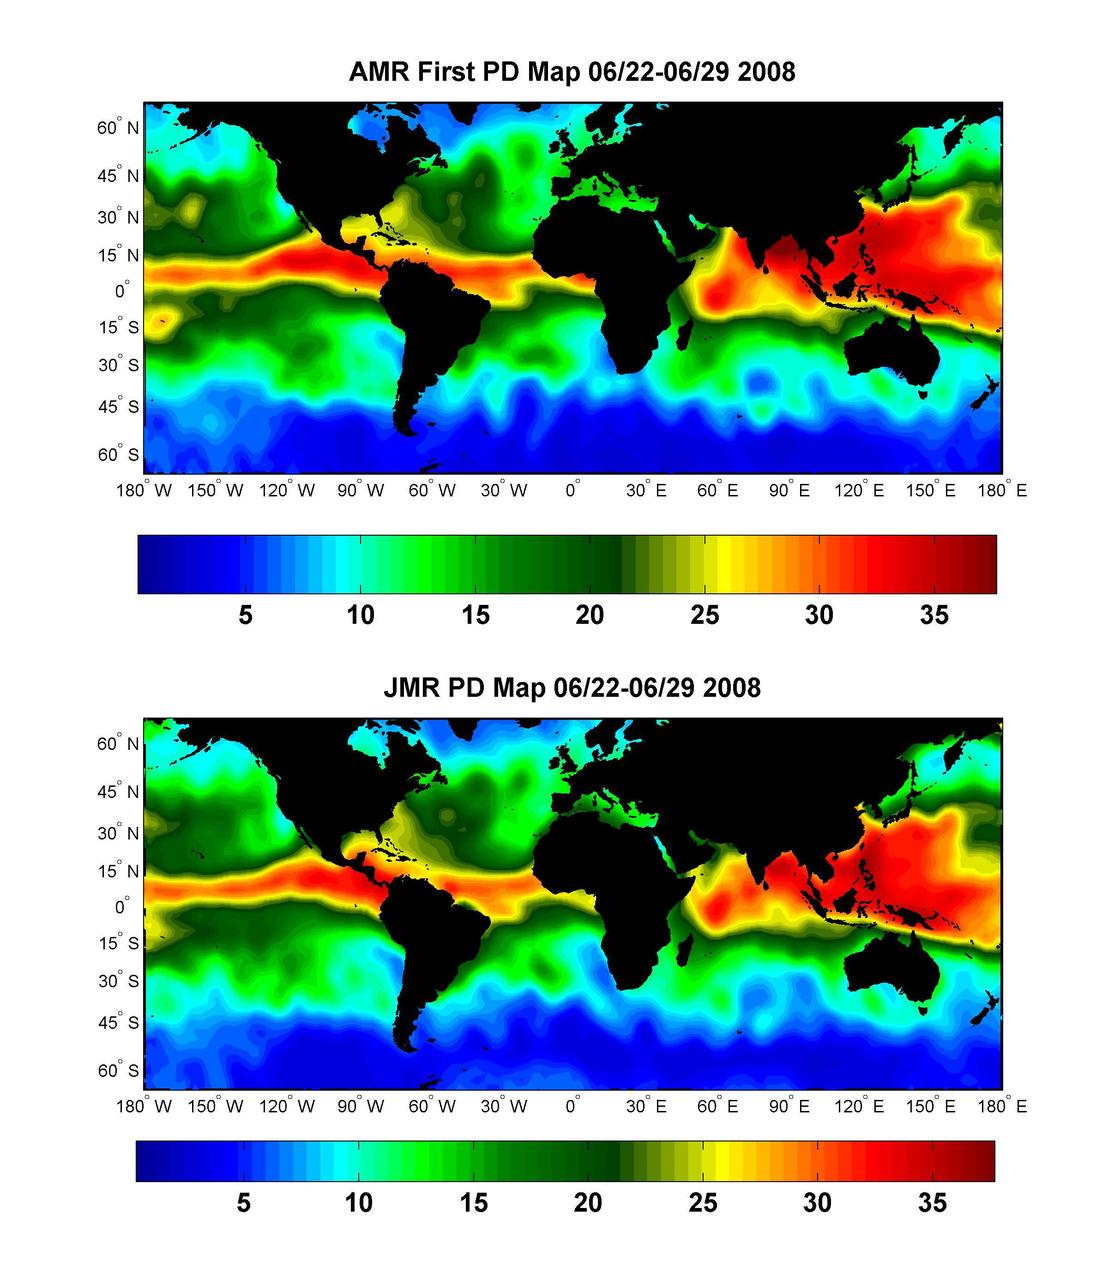
Global Views of Atmospheric Water Vapor:<br />First Data from OSTM/Jason-2 Advanced Microwave Radiometer
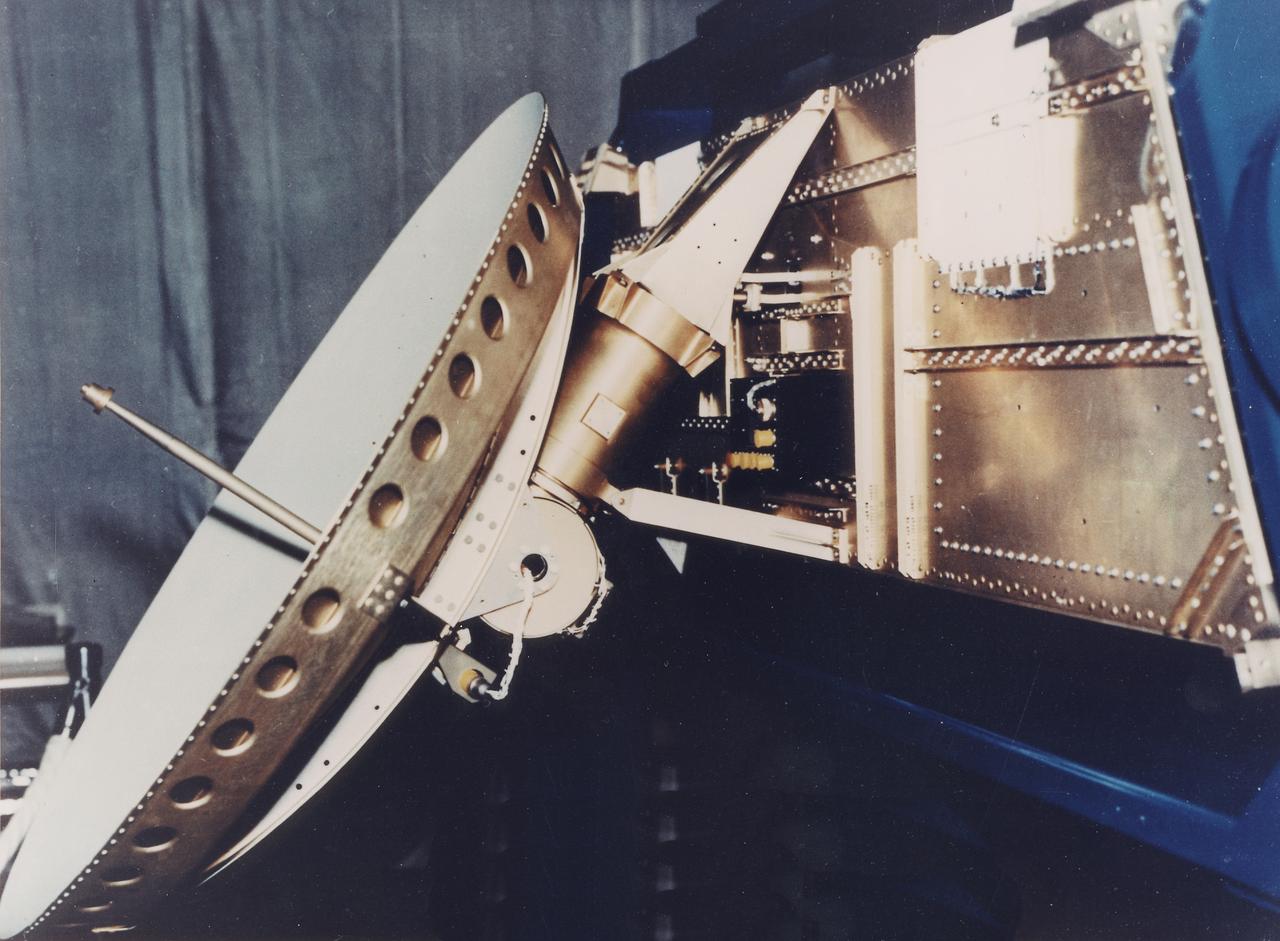
This 1970 photograph shows Skylab's Microwave Radiometer/Scatterometer and Altimeter, one of the major components for an Earth Resources Experiment Package (EREP). It was designed to study varying ocean surface, soil erosion, sea and lake ice, snow cover, seasonal vegetational changes, flooding, rainfall and soil types. The overall purpose of the EREP was to test the use of sensors that operated in the visible, infrared, and microwave portions of the electromagnetic spectrum to monitor and study Earth resources. The Marshall Space Flight Center had program management responsibility for the development of Skylab hardware and experiments.
This animation depicts Jupiter's banded appearance in microwave light as seen by the microwave radiometer instrument (MWR) aboard NASA's Juno spacecraft. The instrument contains six microwave channels that peer progressively deeper below the visible cloud tops. The bottom layer is MWR's channel 1 which is the longest wavelength channel and is sensitive to the deepest depths. Each of the other channels is sensitive to progressively shallower depths. The three shallowest channels are shown on the left, where Jupiter's mid-latitude "belts" are microwave-bright in the microwave portion of the electromagnetic spectrum, and "zones" are microwave-dark. The three deepest channels, which probe below the water clouds, are on the right, where belts and zones become dark in microwave light. The Juno science team uses the term "Jovicline" to describe the transition zone where belts become microwave-dark as depth increases, and where zones become microwave bright. It generally occurs between MWR's third and fourth channels – the same region as Jupiter's water clouds, some 40 miles (65 kilometers) down into the atmosphere. The MWR instrument enables Juno to see deeper into Jupiter than any previous spacecraft or Earth-based observations. Movie available at https://photojournal.jpl.nasa.gov/catalog/PIA24961
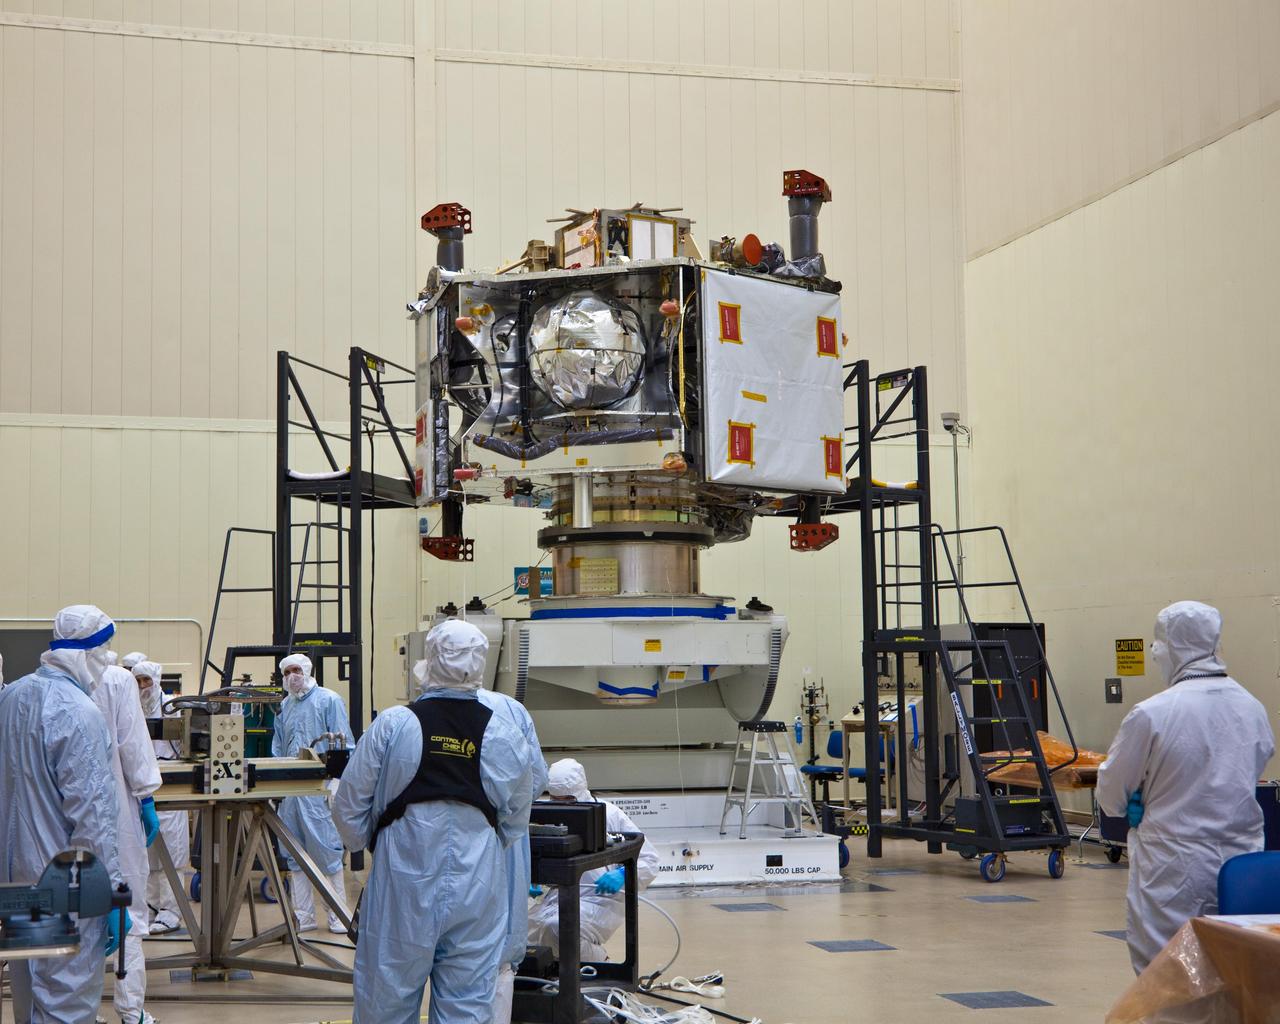
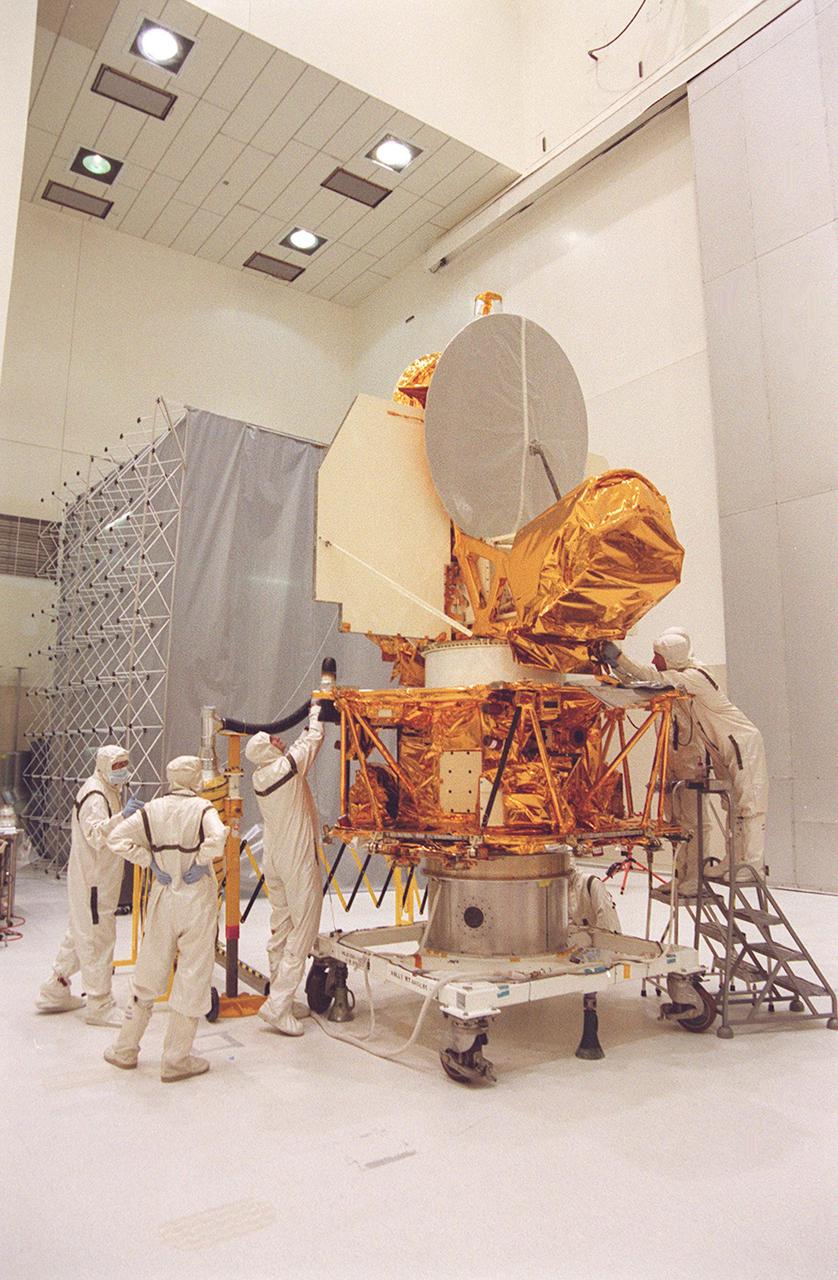
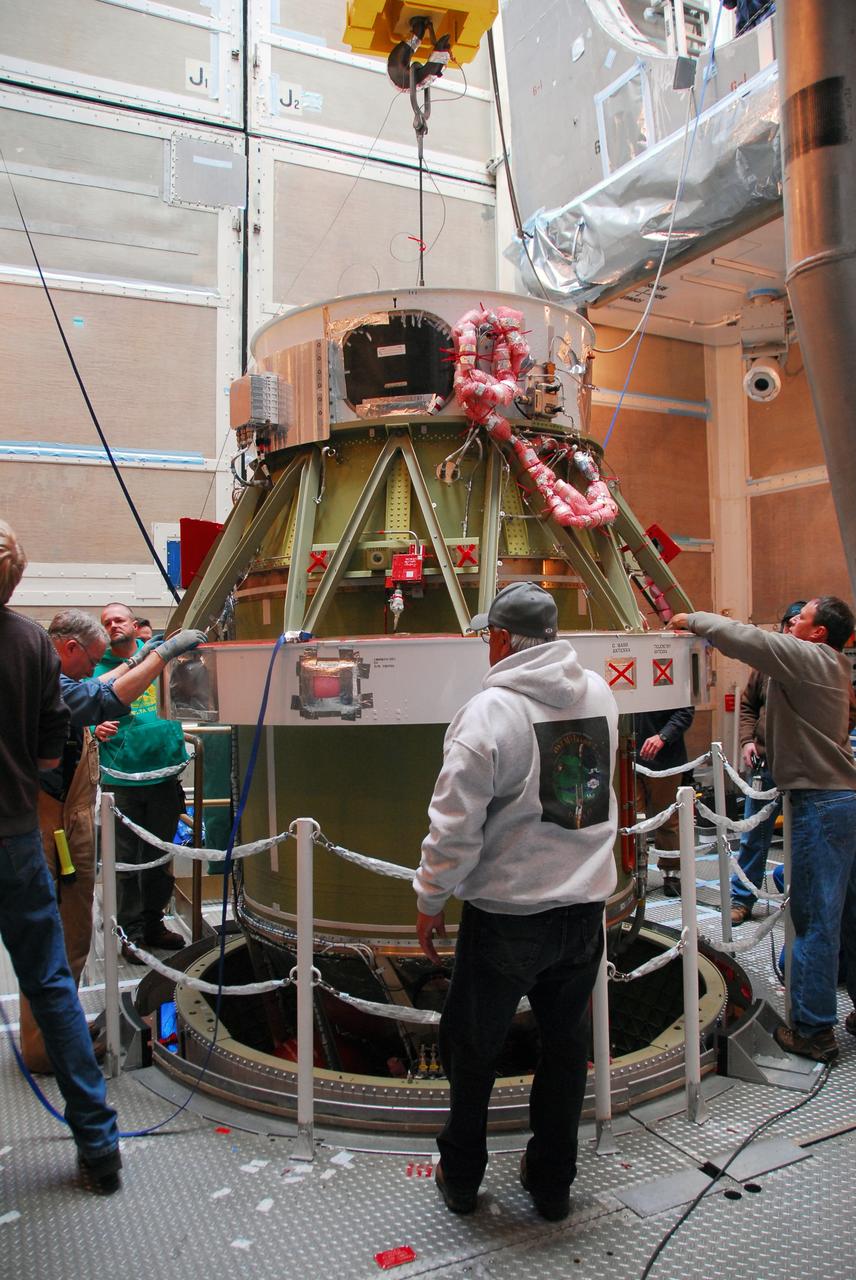
NASA Juno spacecraft rests atop its rotation fixture awaiting transfer to a shipping crate prior to environmental testing; the large white square on the spacecraft right is largest of six microwave radiometer antennas, masked by protective covering.
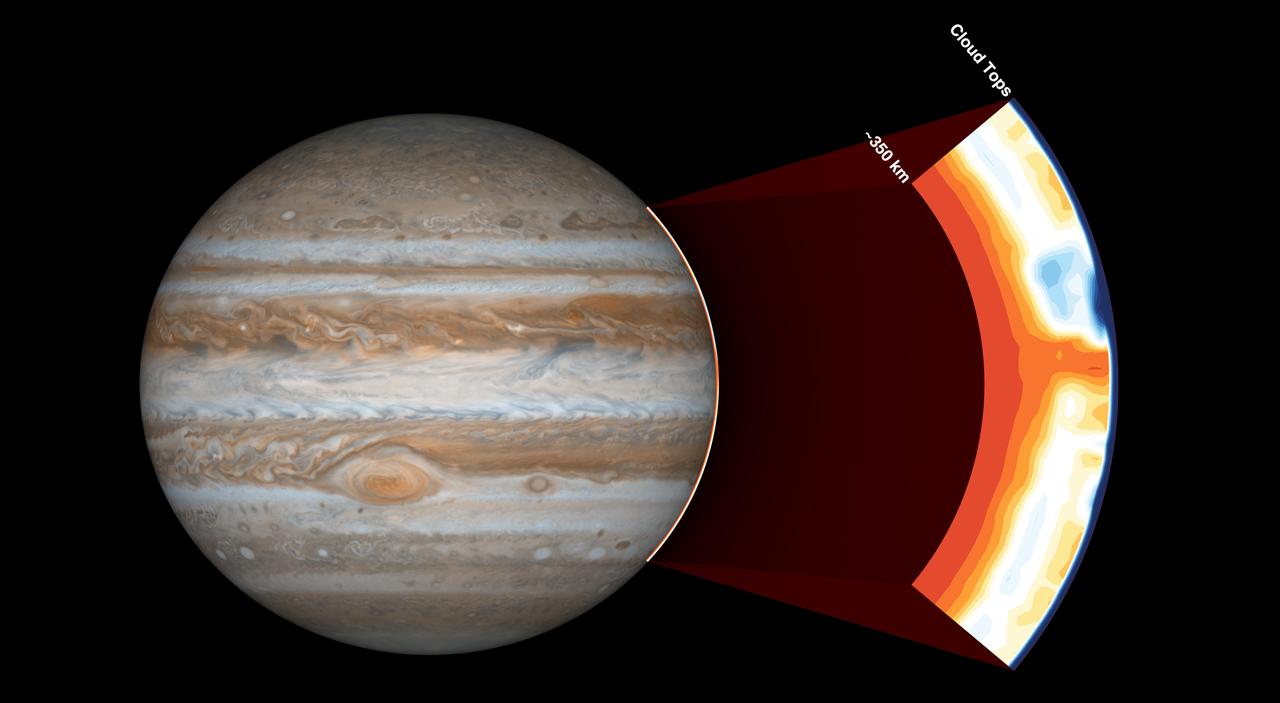
NASA's Juno spacecraft carries an instrument called the Microwave Radiometer, which examines Jupiter's atmosphere beneath the planet's cloud tops. This image shows the instrument's view of the outer part of Jupiter's atmosphere. Before Juno began using this instrument, scientists expected the atmosphere to be uniform at depths greater than 60 miles (100 kilometers). But with the Microwave Radiometer, scientists have discovered that the atmosphere has variations down to at least 220 miles (350 kilometers), as deep as the instrument can see. In the cut-out image to the right, orange signifies high ammonia abundance and blue signifies low ammonia abundance. Jupiter appears to have a band around its equator high in ammonia abundance, with a column shown in orange. This is contrary to scientists' expectations that ammonia would be uniformly mixed. https://photojournal.jpl.nasa.gov/catalog/PIA21642

This animation shows the overlap of the field of view of Juno's Stellar Reference Unit (SRU) star camera (in yellow) and Juno's Microwave Radiometer (MWR) Antenna-1 beam (in red). The animation depicts Juno flying over Jupiter's North pole where the planet's massive northern aurora is located. Juno observes Jupiter's lightning using multiple instruments which detect lightning at different parts of its spectrum. Animation avaiable at https://photojournal.jpl.nasa.gov/catalog/PIA22967
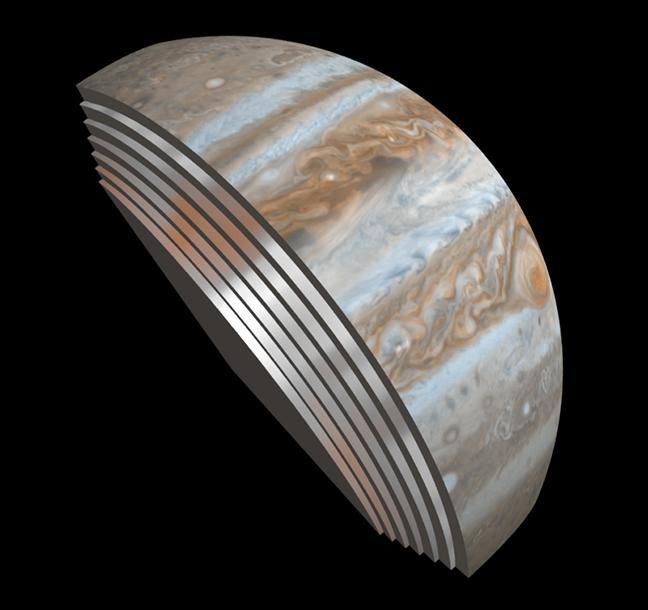
This composite image depicts Jupiter's cloud formations as seen through the eyes of Juno's Microwave Radiometer (MWR) instrument as compared to the top layer, a Cassini Imaging Science Subsystem image of the planet. The MWR can see a couple of hundred miles (kilometers) into Jupiter's atmosphere with its largest antenna. The belts and bands visible on the surface are also visible in modified form in each layer below. http://photojournal.jpl.nasa.gov/catalog/PIA21107
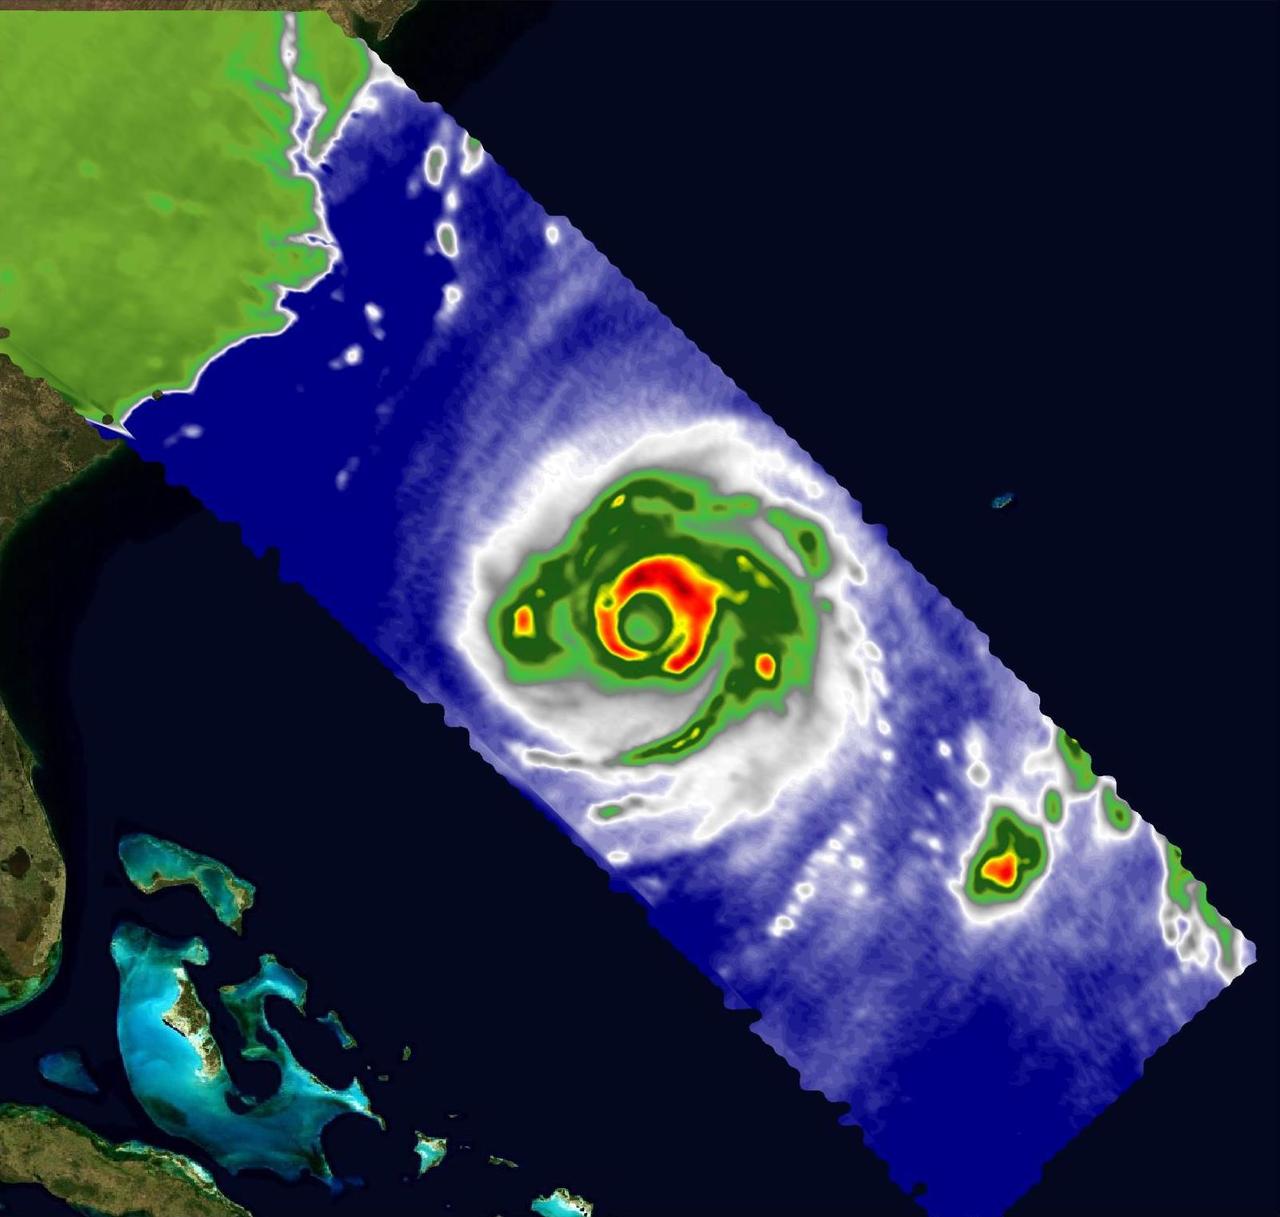
JPL's High-Altitude Monolithic Microwave Integrated Circuit Sounding Radiometer (HAMSR) instrument captured this look inside Hurricane Matthew's spiral clouds on Oct. 7, 2016, flying on a NASA Global Hawk unmanned aircraft. Red colors show cloud bands without precipitation; blues show rain bands. http://photojournal.jpl.nasa.gov/catalog/PIA21093
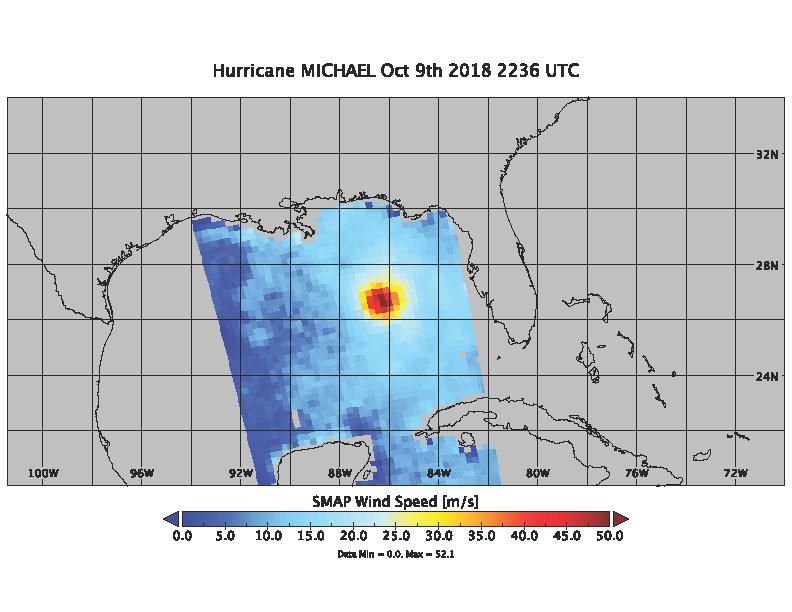
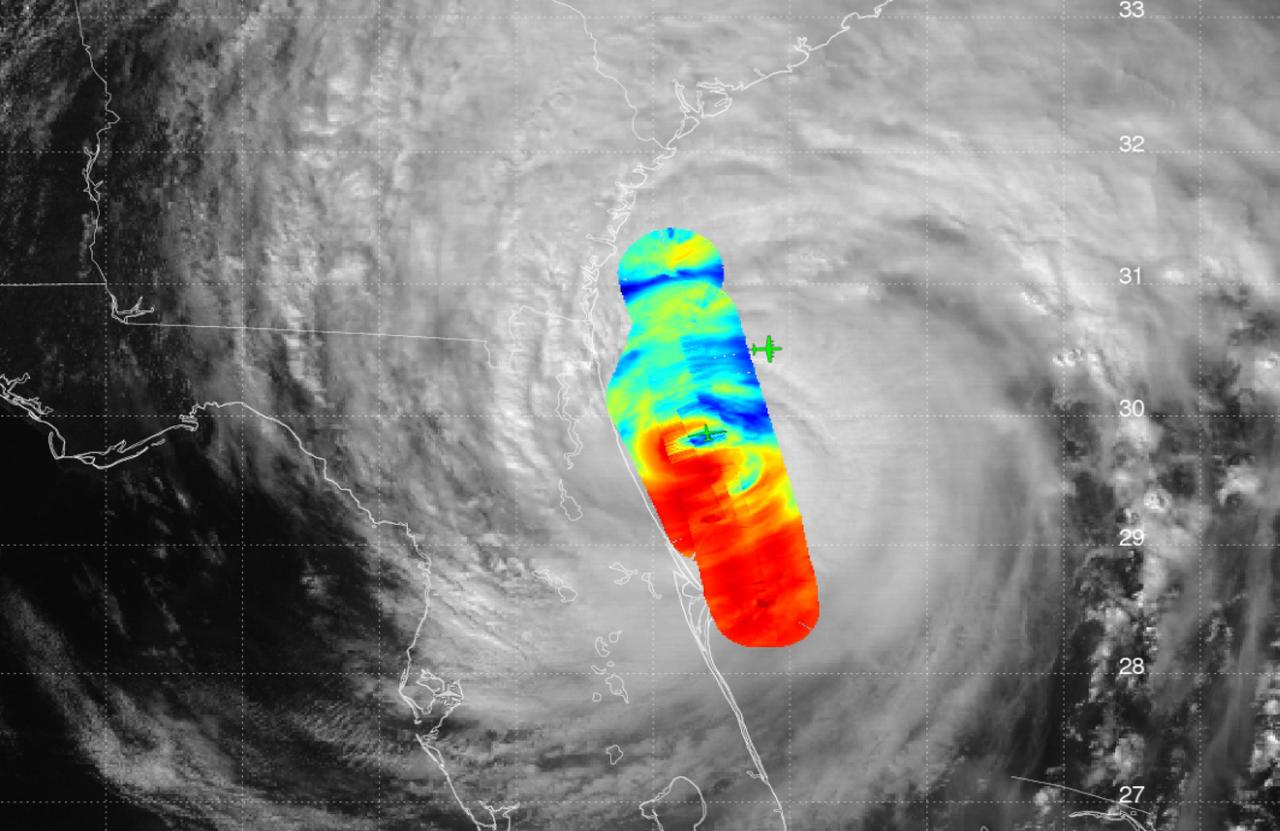
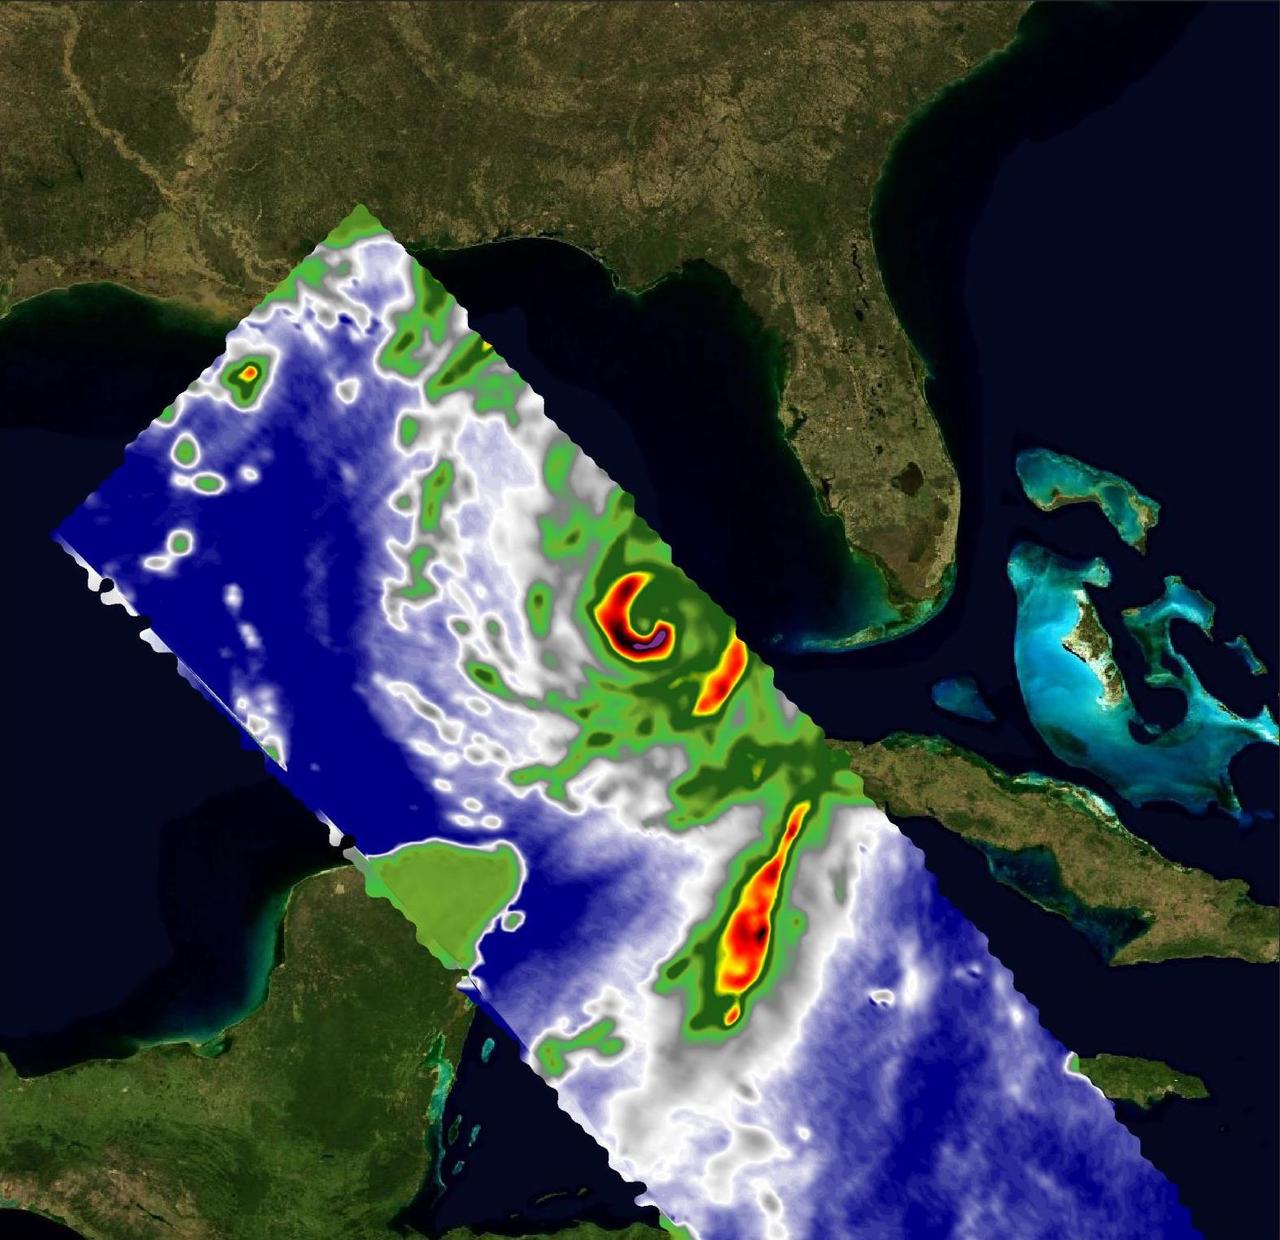
On Oct. 9, 2018 at about 4:30pm EDT, the NASA Soil Moisture Active Passive (SMAP) Radiometer got one more snap shot of Hurricane Michael. The radiance acquired by the SMAP L-band Microwave Radiometer can see through clouds and rain, and is sensitive to the extreme ocean surface winds under a tropical storm or hurricane. Hurricane Michael made landfall in the Florida panhandle Wednesday as a major Category 4 storm. https://photojournal.jpl.nasa.gov/catalog/PIA22751
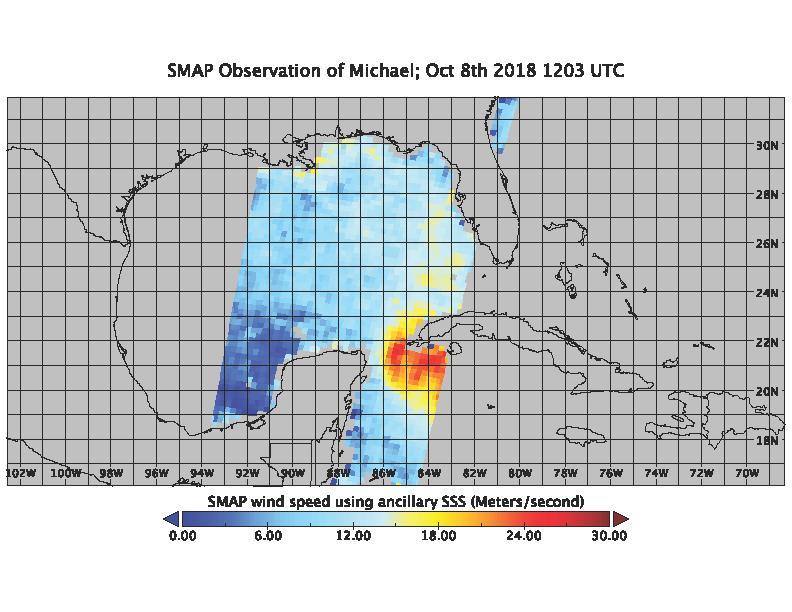
On the morning of Oct. 8, 2018, the NASA Soil Moisture Active Passive (SMAP) Radiometer got a snapshot of Hurricane Michael, which has intensified to a Category 2 hurricane over the warm waters of the Gulf of Mexico. The radiance acquired by the SMAP L-band Microwave Radiometer can see through clouds and rains, and is sensitive to the extreme ocean surface winds under a tropical storm or hurricane. Areas in red represent higher wind speeds; areas in blue have lower wind speeds. https://photojournal.jpl.nasa.gov/catalog/PIA22747
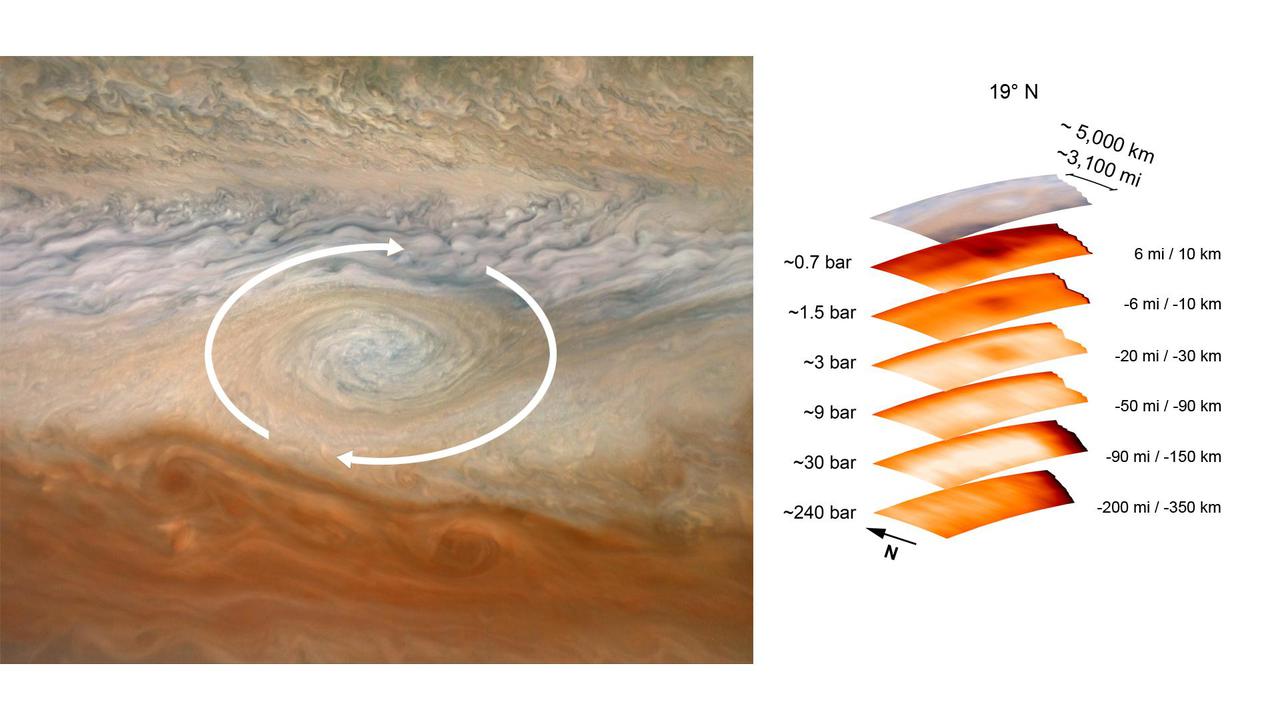
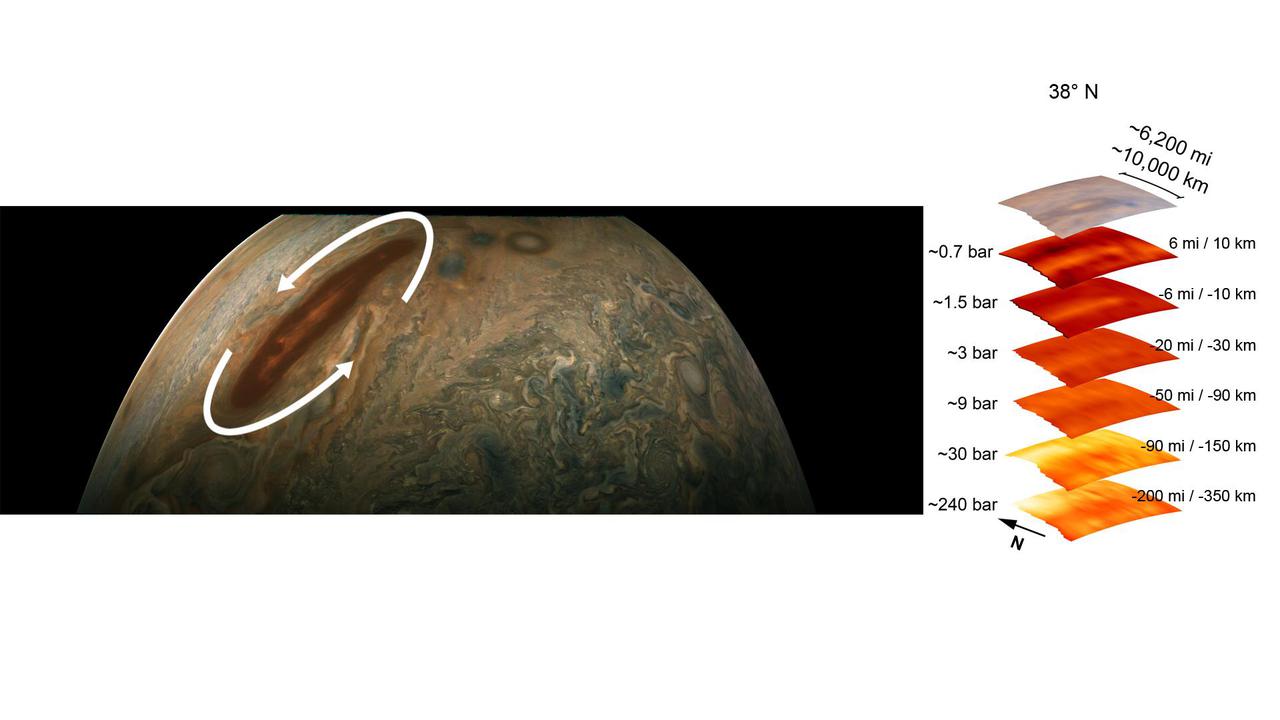
The image on the left, taken by the JunoCam imager aboard NASA's Juno spacecraft, has been annotated to depict the clockwise rotation of a vortex at Jupiter. The graphic on the right highlights the large-scale structure of the feature as seen by the spacecraft's microwave radiometer (MWR) instrument. Data for the image and the microwave radiometer results were collected during a low flyby of Jupiter that took place on July 21, 2019. The radiometer data was acquired from the six channels of MWR. Each MWR channel peers progressively deeper below the visible cloud tops. In fact, the MWR instrument enables Juno to see deeper into Jupiter than any previous spacecraft or Earth-based observations. Unlike Earth, which as a solid surface, Jupiter is a gas giant with no discernable solid surface. So the planetary science community has defined the "base" of Jupiter's atmosphere as the location where its pressure is equivalent to 1 bar. A bar is a metric unit of pressure that, at 14.5 pounds per square inch, is slightly less than the average atmospheric pressure on Earth at sea level. The numbers to the left of each layer of MWR data above indicate the pressure at the location in the atmosphere where the MWR reading occurred. The measurements to the right of each layer of MWR data provide the distance – either above or below the 1 bar level – from which the corresponding MWR measurement was taken. For context, the top layer in the figure is a visible-light image depicting Jupiter's different levels of clouds, with an average altitude about 6 miles above the 1 bar pressure region. https://photojournal.jpl.nasa.gov/catalog/PIA24975
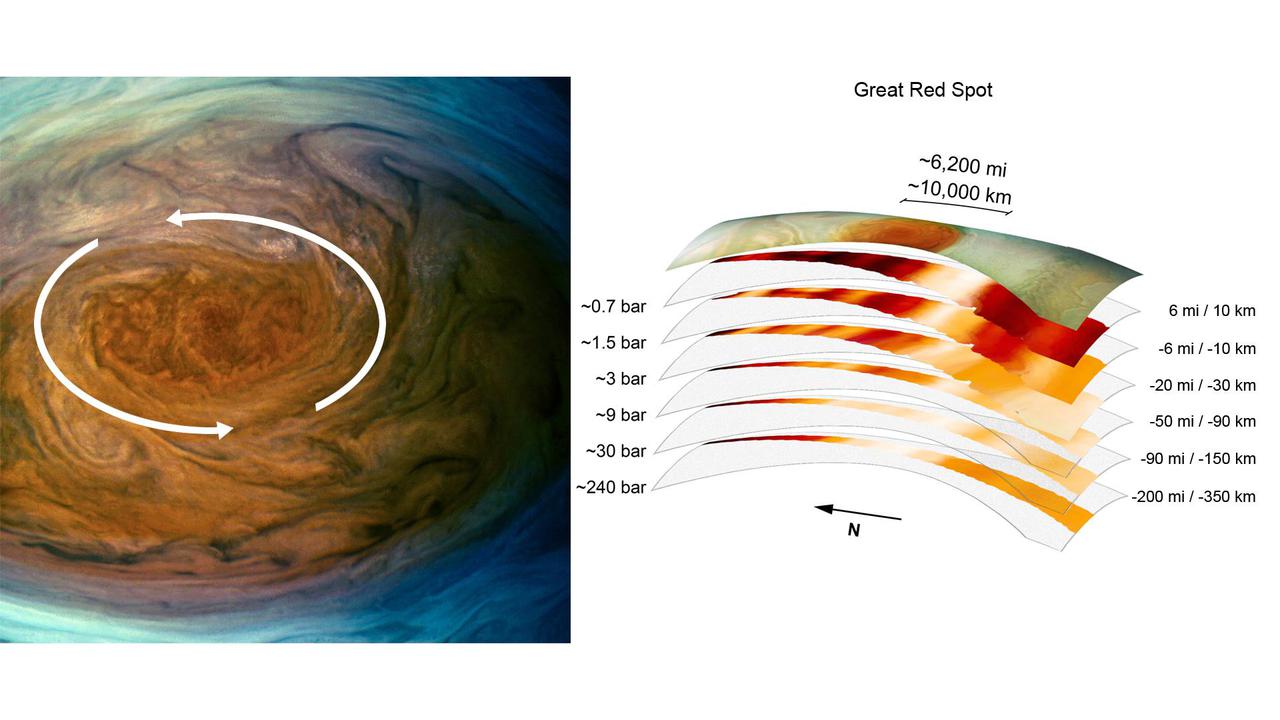
The annotated image on the left from the JunoCam imager aboard NASA's Juno spacecraft depicts the anticyclonic (counterclockwise) rotation of Jupiter's Great Red Spot. The graphic on the right highlights the large-scale structure of the Great Red Spot as seen by the spacecraft's microwave radiometer (MWR) instrument. Data for the image and the microwave radiometer results were collected during a low flyby of Jupiter which took place on July 11, 2017. The radiometer data was acquired from the six channels of MWR. Each MWR channel peers progressively deeper below the visible cloud tops. In fact, the MWR instrument enables Juno to see deeper into Jupiter than any previous spacecraft or Earth-based observations. Unlike Earth, which as a solid surface, Jupiter is a gas giant with no discernable solid surface. So the planetary science community has defined the "base" of Jupiter's atmosphere to be defined as the location where its pressure is equivalent to is 1 bar. The bar is a metric unit of pressure which at 14.5 pounds per square inch is slightly less than the average atmospheric pressure on Earth at sea level. The numbers noted to the left of each layer of MWR data indicates the pressure (in bars) that is present at the location in the atmosphere where the MWR reading occurred. The distance measurements to the right of each layer of MWR data provides the distance – either above or below the 1 bar level – that the corresponding MWR measurement was taken. For context, the top layer in the figure is a visible-light image depicting Jupiter's different levels of clouds, with an average altitude about 6 miles above the 1 bar pressure region. https://photojournal.jpl.nasa.gov/catalog/PIA24819
The color-enhanced image on the left is from the JunoCam imager aboard NASA's Juno spacecraft and has been annotated to depict the anticyclonic (counterclockwise) rotation of one of Jupiter's intriguing atmospheric phenomena – a long, brown oval cyclonic region known as a "brown barge." The graphic on the right highlights the large-scale structure of the brown barge as seen by the spacecraft's microwave radiometer (MWR) instrument. Data for the image and the microwave radiometer results were collected during a low flyby of Jupiter. Brown barges usually lie within Jupiter's dark North Equatorial Belt, although they are sometimes found in the similarly dark South Equatorial Belt as well. They can often be difficult to detect visually because their color blends in with the dark surroundings. Brown barges usually dissipate after the entire cloud belt undergoes an upheaval and reorganizes itself. Juno is providing the first glimpses of the detailed structure within such a barge. The radiometer data was acquired from the six channels of MWR. Each MWR channel peers progressively deeper below the visible cloud tops. In fact, the MWR instrument enables Juno to see deeper into Jupiter than any previous spacecraft or Earth-based observations. Unlike Earth, which as a solid surface, Jupiter is a gas giant with no discernable solid surface. So the planetary science community has defined the "base" of Jupiter's atmosphere as the location where its pressure is equivalent to 1 bar. The bar is a metric unit of pressure that, at 14.5 pounds per square inch, is slightly less than the average atmospheric pressure on Earth at sea level. The numbers to the left of each layer of MWR data indicates the pressure that is present at the location in the atmosphere where the MWR reading occurred. The distance measurements to the right of each layer of MWR data provides the distance – either above or below the 1 bar level – at which the corresponding MWR measurement was taken. For context, the top layer in the figure is a visible-light image depicting Jupiter's different levels of clouds, with an average altitude about 6 miles above the 1 bar pressure region. https://photojournal.jpl.nasa.gov/catalog/PIA24974
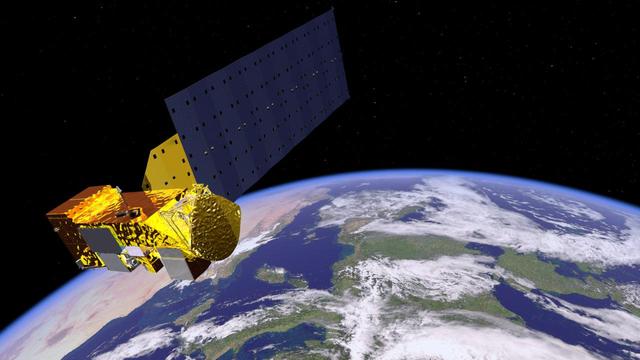
NASA Aqua satellite carries six state-of-the-art instruments in a near-polar low-Earth orbit. Aqua is seen in this artist concept orbiting Earth. The six instruments are the Atmospheric Infrared Sounder (AIRS), the Advanced Microwave Sounding Unit (AMSU-A), the Humidity Sounder for Brazil (HSB), the Advanced Microwave Scanning Radiometer for EOS (AMSR-E), the Moderate Resolution Imaging Spectroradiometer (MODIS), and Clouds and the Earth's Radiant Energy System (CERES). Each has unique characteristics and capabilities, and all six serve together to form a powerful package for Earth observations. http://photojournal.jpl.nasa.gov/catalog/PIA18156
jsc2021e048036 (10/22/2021) --- A preflight view of COWVR during EMC Testing. Space Test Program-Houston 8-Compact Ocean Wind Vector Radiometer (STP-H8-COWVR) demonstrates on-orbit use of a new terrestrial microwave meteorological sensor. It is designed to deliver accurate sea surface wind direction and speed data that are critical to naval surface operations and forecasting and tracking hurricanes and typhoons. Image courtesy of JPL.
jsc2021e0480388 (10/22/2021) --- A preflight view of COWVR during TVAC Testing. Space Test Program-Houston 8-Compact Ocean Wind Vector Radiometer (STP-H8-COWVR) demonstrates on-orbit use of a new terrestrial microwave meteorological sensor. It is designed to deliver accurate sea surface wind direction and speed data that are critical to naval surface operations and forecasting and tracking hurricanes and typhoons. Image courtesy of JPL.
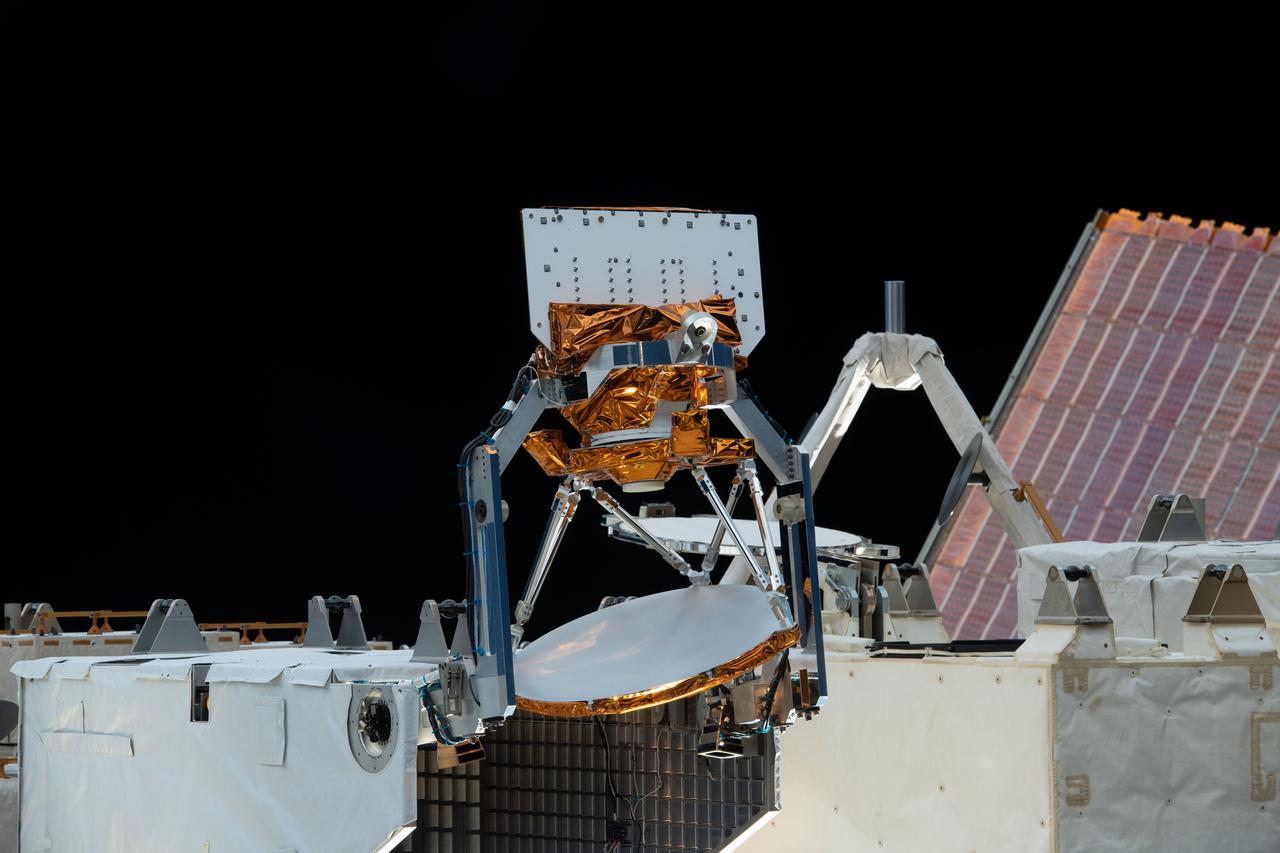
iss066e113944 (1/15/2022) --- A view of the STP-H8-COWVR aboard the International Space Station (ISS). The Space Test Program-Houston 8-Compact Ocean Wind Vector Radiometer (STP-H8-COWVR) demonstrates on-orbit use of a new terrestrial microwave meterological sensor designed to deliver accurate sea surface wind direction and speed data .
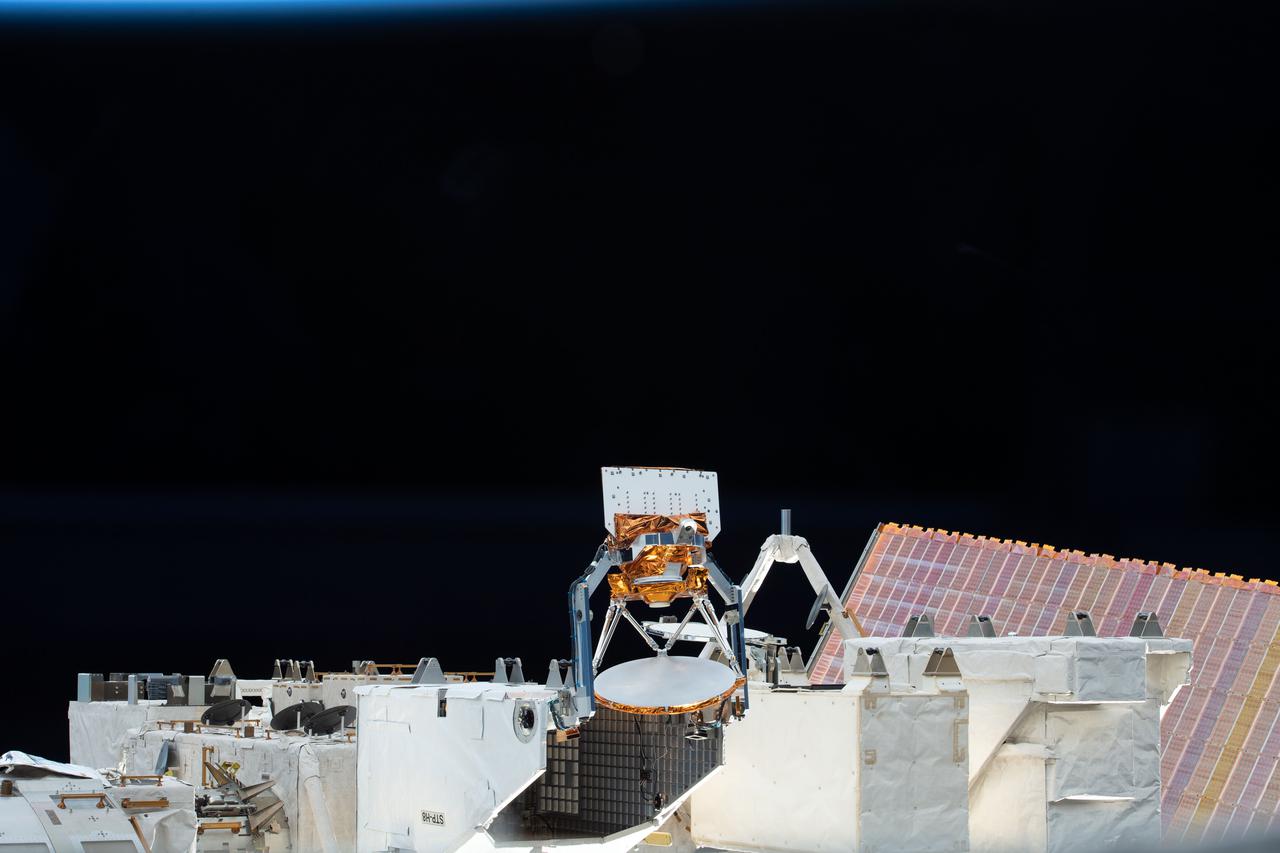
iss066e113950 (1/15/2022) --- A view of the STP-H8-COWVR aboard the International Space Station (ISS). The Space Test Program-Houston 8-Compact Ocean Wind Vector Radiometer (STP-H8-COWVR) demonstrates on-orbit use of a new terrestrial microwave meterological sensor designed to deliver accurate sea surface wind direction and speed data .
jsc2021e048037 (10/22/2021) --- A preflight view of COWVR during Antenna Range Testing. Space Test Program-Houston 8-Compact Ocean Wind Vector Radiometer (STP-H8-COWVR) demonstrates on-orbit use of a new terrestrial microwave meteorological sensor. It is designed to deliver accurate sea surface wind direction and speed data that are critical to naval surface operations and forecasting and tracking hurricanes and typhoons. Image courtesy of JPL.
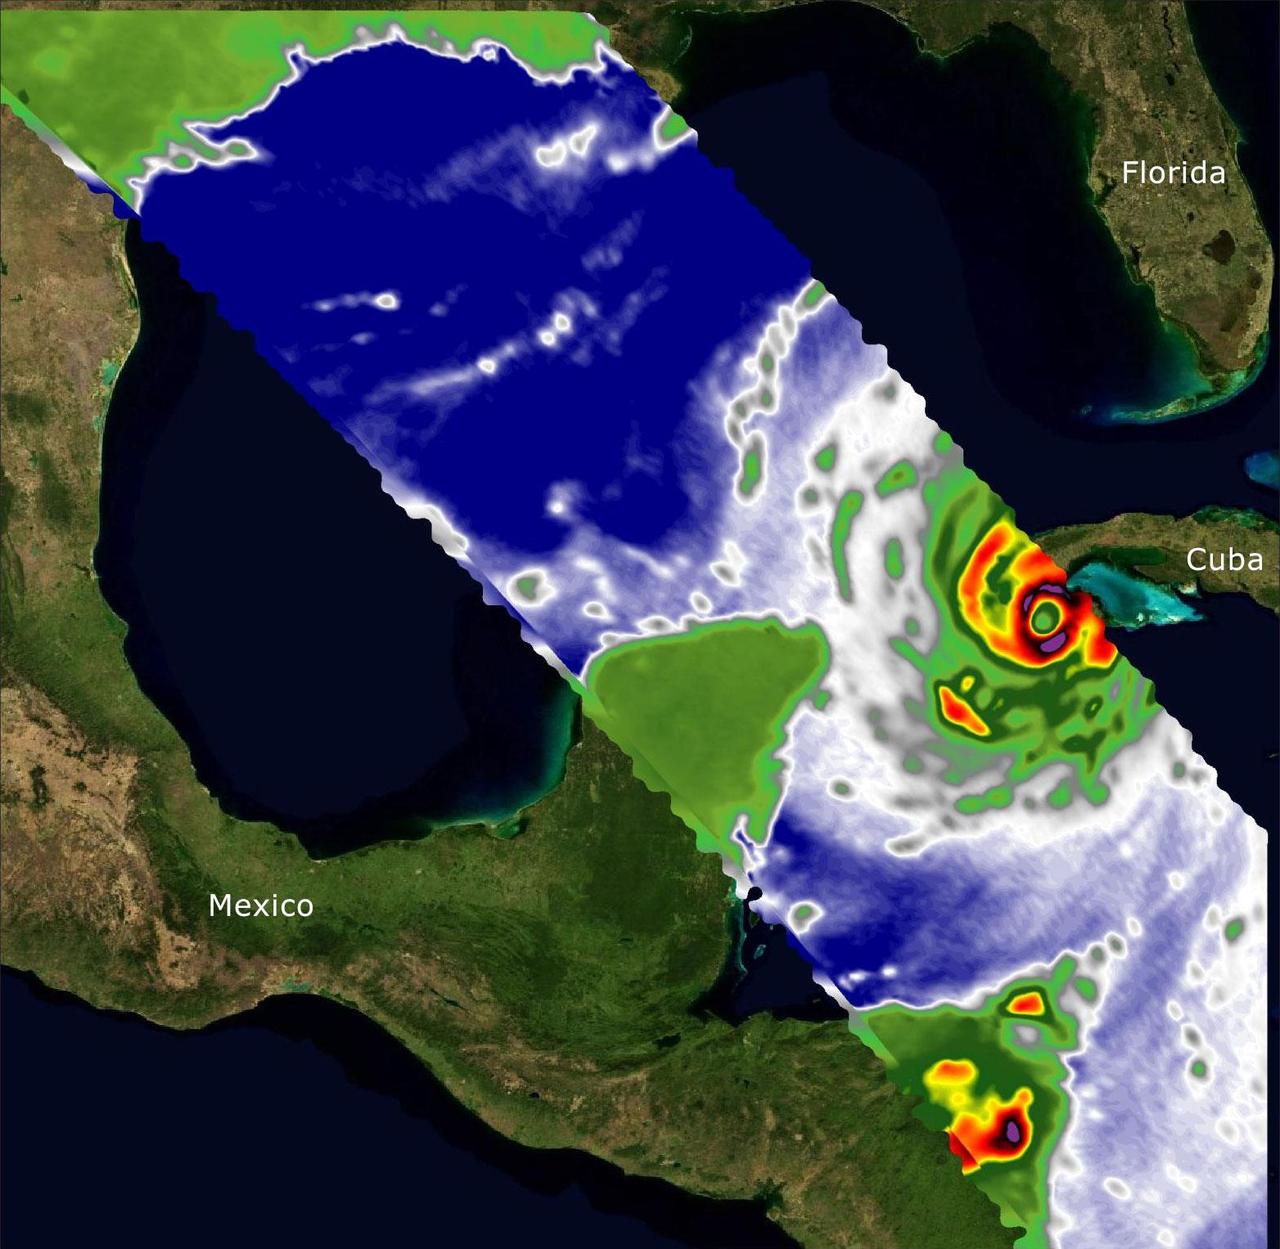
Two recently launched instruments that were designed and built at NASA's Jet Propulsion Laboratory in Southern California to provide forecasters data on weather over the open ocean captured images of Hurricane Ian on Sept. 27, 2022, as the storm approached Cuba on its way north toward the U.S. mainland. The instruments, Compact Ocean Wind Vector Radiometer (COWVR) and Temporal Experiment for Storms and Tropical Systems (TEMPEST), observe the planet's atmosphere and surface from aboard the International Space Station, which passed in low-Earth orbit over the Caribbean Sea at about 12:30 a.m. EDT. Ian made landfall in Cuba's Pinar del Rio province at 4:30 a.m. EDT, according to the National Hurricane Center. At that time, it was a Category 3 hurricane, with estimated wind speeds of 125 mph (205 kph). The image above combines microwave emissions measurements from both COWVR and TEMPEST. White sections indicate the presence of clouds. Green portions indicate rain. Yellow, red, and black indicate where air and water vapor were moving most swiftly. Ian's center is seen just off of Cuba's southern coast, and the storm is shown covering the island with rain and wind. COWVR and TEMPEST sent the data for this image back to Earth in a direct stream via NASA's tracking and data relay satellite (TDRS) constellation. The data were processed at JPL and made available to forecasters less than two hours after collection. About the size of a minifridge, COWVR measures natural microwave emissions over the ocean. The magnitude of the emissions increases with the amount of rain in the atmosphere, and the strongest rain produces the strongest microwave emissions. TEMPEST – comparable in size to a cereal box – tracks microwaves at a much shorter wavelength, allowing it to see ice particles within the hurricane's cloudy regions that are thrust into the upper atmosphere by the storm. Both microwave radiometers were conceived to demonstrate that smaller, more energy-efficient, more simply designed sensors can perform most of the same measurements as current space-based weather instruments that are heavier, consume more power, and cost much more to construct. COWVR's development was funded by the U.S. Space Force, and TEMPEST was developed with NASA funding. The U.S. Space Test Program-Houston 8 (STP-H8) is responsible for hosting the instruments on the space station under Space Force funding in partnership with NASA. Data from the instruments are being used by government and university weather forecasters and scientists. The mission will inform development of future space-based weather sensors, and scientists are working on mission concepts that would take advantage of the low-cost microwave sensor technologies to study long-standing questions, such as how heat from the ocean fuels global weather patterns. https://photojournal.jpl.nasa.gov/catalog/PIA25425

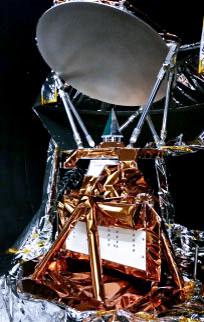
KENNEDY SPACE CENTER, FLA. -- The Microwave Anisotropy Probe (MAP) satellite arrives at Kennedy Space Center. The Vehicle Assembly Building is in the background. MAP is scheduled to launch on June 30 from Cape Canaveral Air Force Station on a Delta II rocket into a lunar-assisted trajectory to the Sun-Earth for a 27-month mission (3 months transit, 24 months observing). The MAP instrument consists of a set of passively cooled microwave radiometers with 1.4x 1.6-meter diameter primary reflectors to provide the desired angular resolution. MAP measures small fluctuations in the temperature of the cosmic microwave background radiation to an accuracy of one millionth of a degree. These measurements should reveal the size, matter content, age, geometry and fate of the universe. They will also reveal the primordial structure that grew to form galaxies and will test ideas about the origins of these primordial structures. The MAP instrument will be continuously shaded from the Sun, Earth, and Moon by the spacecraft. It is a product of Goddard Space Flight Center in partnership with Princeton University

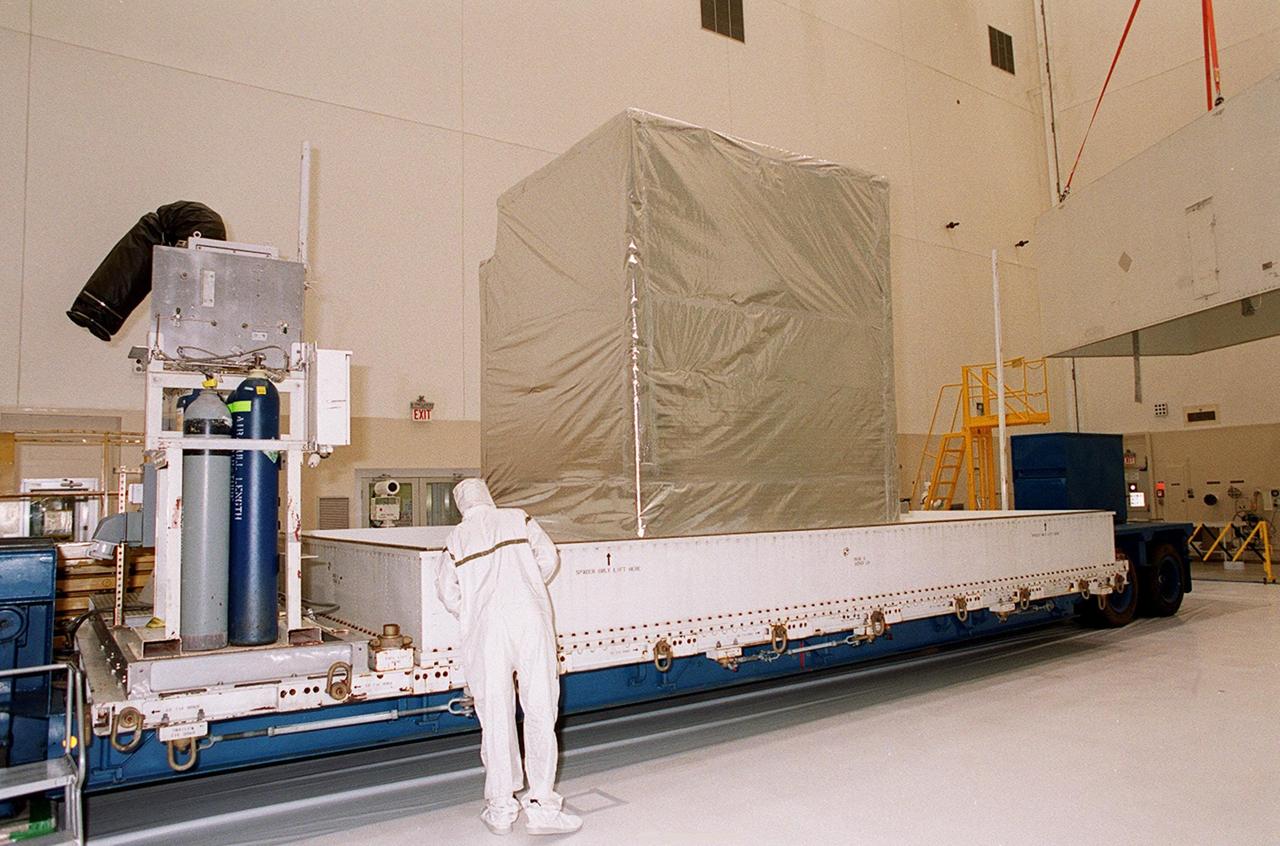
KENNEDY SPACE CENTER, FLA. -- The container with the Microwave Anisotropy Probe (MAP) satellite inside moves into the Spacecraft Assembly and Encapsulation Facility 2. MAP will undergo testing in the SAEF-2 before its scheduled launch June 30 from Cape Canaveral Air Force Station on a Delta II rocket into a lunar-assisted trajectory to the Sun-Earth for a 27-month mission (3 months transit, 24 months observing). The MAP instrument consists of a set of passively cooled microwave radiometers with 1.4x 1.6-meter diameter primary reflectors to provide the desired angular resolution. MAP measures small fluctuations in the temperature of the cosmic microwave background radiation to an accuracy of one millionth of a degree. These measurements should reveal the size, matter content, age, geometry and fate of the universe. They will also reveal the primordial structure that grew to form galaxies and will test ideas about the origins of these primordial structures. The MAP instrument will be continuously shaded from the Sun, Earth, and Moon by the spacecraft. It is a product of Goddard Space Flight Center in partnership with Princeton University
KENNEDY SPACE CENTER, FLA. -- In the Spacecraft Assembly and Encapsulation Facility 2, workers check out parts of the Microwave Anisotropy Probe (MAP. Several milestones must be completed while MAP is at SAEF-2, including antenna and solar array installation, solar array deployment and illumination testing, a spacecraft comprehensive performance test, fueling with hydrazine propellant and a spin balance test. MAP will then be ready for integration with the solid propellant Payload Assist Module upper stage booster. MAP is scheduled for launch June 30 from Cape Canaveral Air Force Station on a Delta II rocket into a lunar-assisted trajectory to the Sun-Earth for a 27-month mission. The MAP instrument consists of a set of passively cooled microwave radiometers with 1.4x 1.6-meter diameter primary reflectors to provide the desired angular resolution. MAP measures small fluctuations in the temperature of the cosmic microwave background radiation to an accuracy of one millionth of a degree These measurements should reveal the size, matter content, age, geometry and fate of the universe. They will also reveal the primordial structure that grew to form galaxies and will test ideas about the origins of these primordial structures. The MAP instrument will be continuously shaded from the Sun, Earth, and Moon by the spacecraft. It is a product of Goddard Space Flight Center in partnership with Princeton University
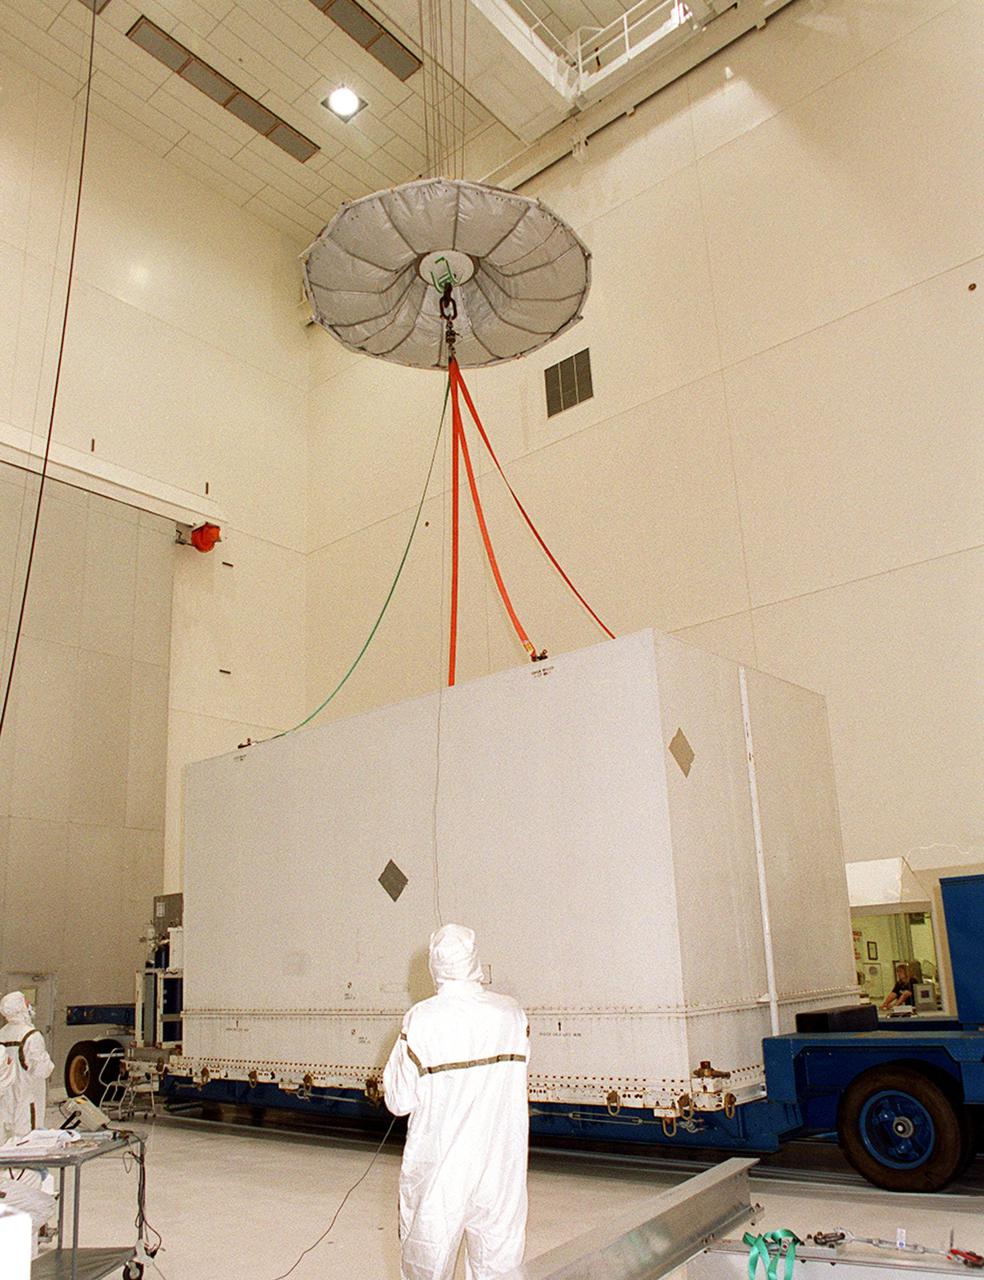
KENNEDY SPACE CENTER, FLA. -- Inside the Spacecraft Assembly and Encapsulation Facility 2, an overhead crane is attached to the container surrounding the Microwave Anisotropy Probe (MAP) satellite. MAP will undergo testing in the SAEF-2 before its scheduled launch June 30 from Cape Canaveral Air Force Station on a Delta II rocket into a lunar-assisted trajectory to the Sun-Earth for a 27-month mission (3 months transit, 24 months observing). The MAP instrument consists of a set of passively cooled microwave radiometers with 1.4x 1.6-meter diameter primary reflectors to provide the desired angular resolution. MAP measures small fluctuations in the temperature of the cosmic microwave background radiation to an accuracy of one millionth of a degree. These measurements should reveal the size, matter content, age, geometry and fate of the universe. They will also reveal the primordial structure that grew to form galaxies and will test ideas about the origins of these primordial structures. The MAP instrument will be continuously shaded from the Sun, Earth, and Moon by the spacecraft. It is a product of Goddard Space Flight Center in partnership with Princeton University

KENNEDY SPACE CENTER, FLA. -- The Microwave Anisotropy Probe (MAP) satellite arrives at KSC’s Spacecraft Assembly and Encapsulation Facility 2. MAP will undergo testing in the SAEF-2 before its scheduled launch June 30 from Cape Canaveral Air Force Station on a Delta II rocket into a lunar-assisted trajectory to the Sun-Earth for a 27-month mission (3 months transit, 24 months observing). The MAP instrument consists of a set of passively cooled microwave radiometers with 1.4x 1.6-meter diameter primary reflectors to provide the desired angular resolution. MAP measures small fluctuations in the temperature of the cosmic microwave background radiation to an accuracy of one millionth of a degree. These measurements should reveal the size, matter content, age, geometry and fate of the universe. They will also reveal the primordial structure that grew to form galaxies and will test ideas about the origins of these primordial structures. The MAP instrument will be continuously shaded from the Sun, Earth, and Moon by the spacecraft. It is a product of Goddard Space Flight Center in partnership with Princeton University
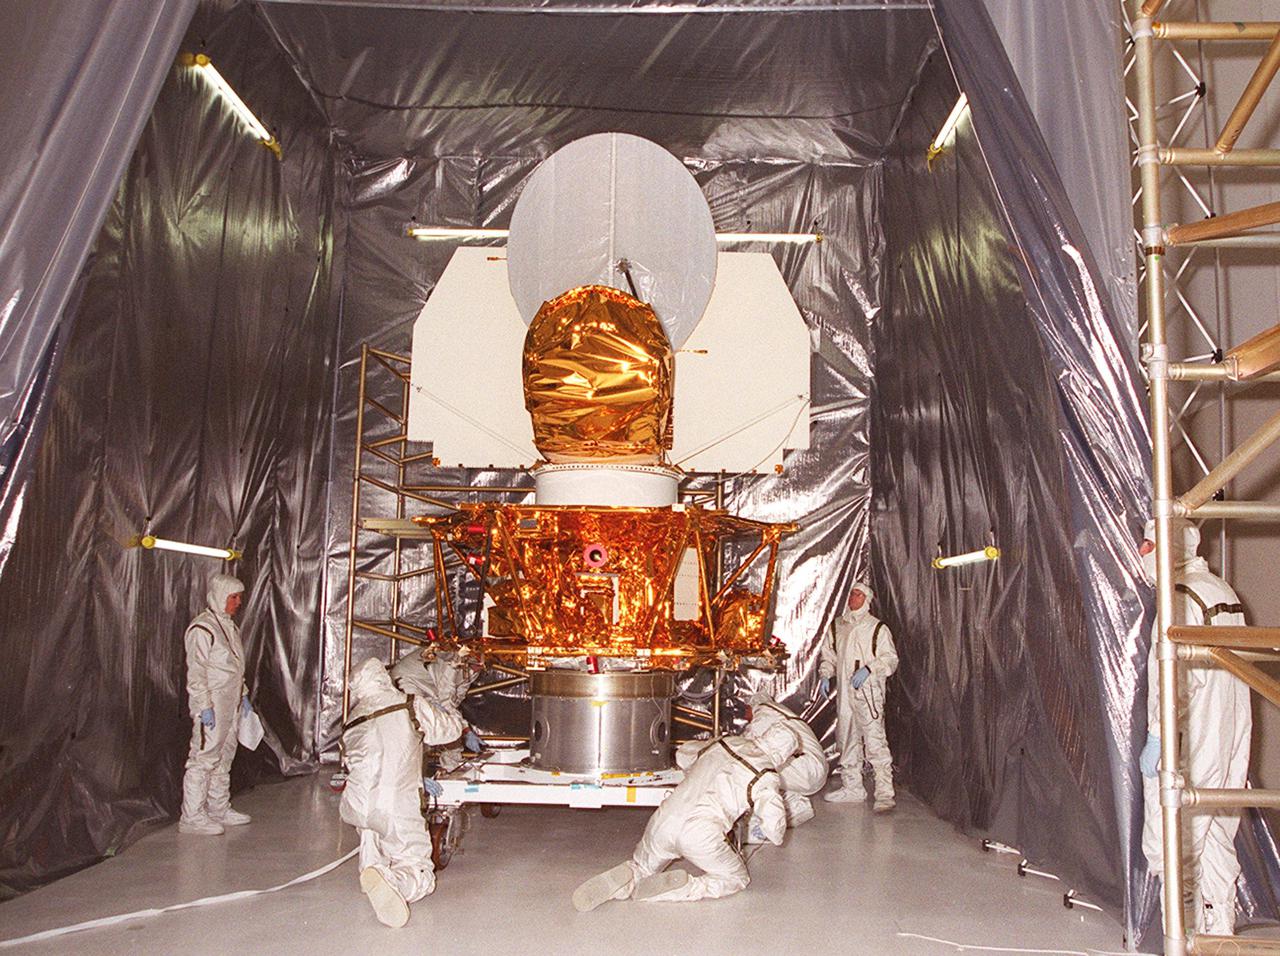
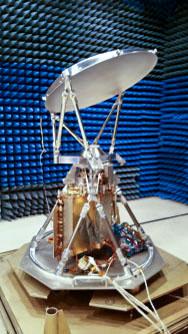
KENNEDY SPACE CENTER, FLA. -- Workers in the Spacecraft Assembly and Encapsulation Facility 2 secure the Microwave Anisotropy Probe (MAP) on a workstand inside a tent. Several milestones must be completed while MAP is at SAEF-2, including antenna installations, solar array installation, solar array deployment and illumination testing, a spacecraft comprehensive performance test, fueling with hydrazine propellant and a spin balance test. MAP will then be ready for integration with the solid propellant Payload Assist Module upper stage booster. MAP is scheduled for launch June 30 from Cape Canaveral Air Force Station on a Delta II rocket into a lunar-assisted trajectory to the Sun-Earth for a 27-month mission. The MAP instrument consists of a set of passively cooled microwave radiometers with 1.4x 1.6-meter diameter primary reflectors to provide the desired angular resolution. MAP measures small fluctuations in the temperature of the cosmic microwave background radiation to an accuracy of one millionth of a degree These measurements should reveal the size, matter content, age, geometry and fate of the universe. They will also reveal the primordial structure that grew to form galaxies and will test ideas about the origins of these primordial structures. The MAP instrument will be continuously shaded from the Sun, Earth, and Moon by the spacecraft. It is a product of Goddard Space Flight Center in partnership with Princeton University
KENNEDY SPACE CENTER, FLA. -- Inside the Spacecraft Assembly and Encapsulation Facility 2, a covered Microwave Anisotropy Probe (MAP) satellite is revealed after removal of the container (far right). MAP will undergo testing in the SAEF-2 before its scheduled launch June 30 from Cape Canaveral Air Force Station on a Delta II rocket into a lunar-assisted trajectory to the Sun-Earth for a 27-month mission (3 months transit, 24 months observing). The MAP instrument consists of a set of passively cooled microwave radiometers with 1.4x 1.6-meter diameter primary reflectors to provide the desired angular resolution. MAP measures small fluctuations in the temperature of the cosmic microwave background radiation to an accuracy of one millionth of a degree. These measurements should reveal the size, matter content, age, geometry and fate of the universe. They will also reveal the primordial structure that grew to form galaxies and will test ideas about the origins of these primordial structures. The MAP instrument will be continuously shaded from the Sun, Earth, and Moon by the spacecraft. It is a product of Goddard Space Flight Center in partnership with Princeton University
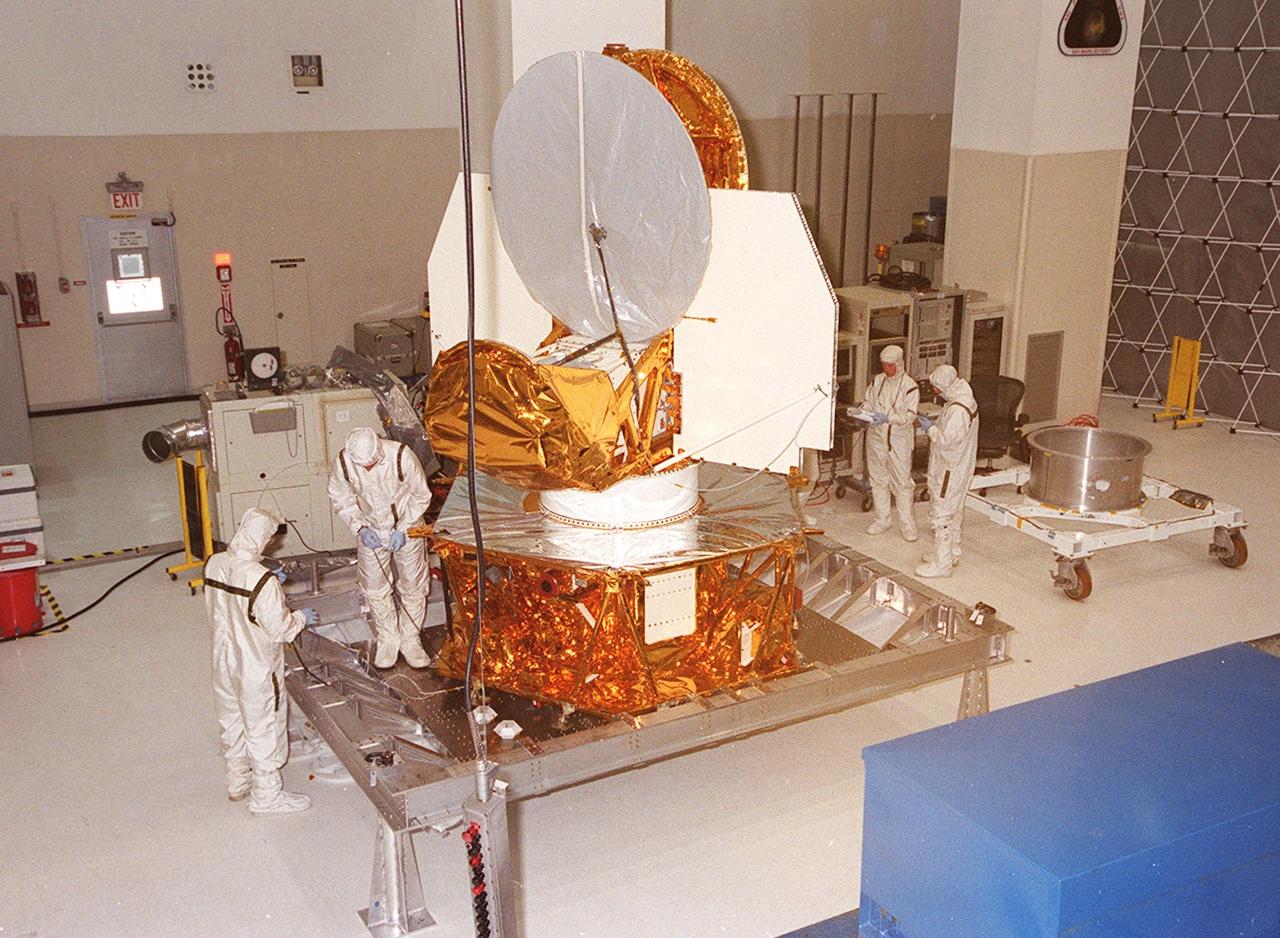
KENNEDY SPACE CENTER, FLA. -- The Microwave Anisotropy Probe (MAP) is worked on in the Spacecraft Assembly and Encapsulation Facility 2. Several milestones must be completed while MAP is at SAEF-2, including antenna installations, solar array installation, solar array deployment and illumination testing, a spacecraft comprehensive performance test, fueling with hydrazine propellant and a spin balance test. MAP will then be ready for integration with the solid propellant Payload Assist Module upper stage booster. MAP is scheduled for launch June 30 from Cape Canaveral Air Force Station on a Delta II rocket into a lunar-assisted trajectory to the Sun-Earth for a 27-month mission. The MAP instrument consists of a set of passively cooled microwave radiometers with 1.4x 1.6-meter diameter primary reflectors to provide the desired angular resolution. MAP measures small fluctuations in the temperature of the cosmic microwave background radiation to an accuracy of one millionth of a degree These measurements should reveal the size, matter content, age, geometry and fate of the universe. They will also reveal the primordial structure that grew to form galaxies and will test ideas about the origins of these primordial structures. The MAP instrument will be continuously shaded from the Sun, Earth, and Moon by the spacecraft. It is a product of Goddard Space Flight Center in partnership with Princeton University

KENNEDY SPACE CENTER, FLA. -- In the Spacecraft Assembly and Encapsulation Facility 2, the Microwave Anisotropy Probe (MAP) undergoes testing and checkout. Several milestones must be completed while MAP is at SAEF-2, including antenna and solar array installation, solar array deployment and illumination testing, a spacecraft comprehensive performance test, fueling with hydrazine propellant and a spin balance test. MAP will then be ready for integration with the solid propellant Payload Assist Module upper stage booster. MAP is scheduled for launch June 30 from Cape Canaveral Air Force Station on a Delta II rocket into a lunar-assisted trajectory to the Sun-Earth for a 27-month mission. The MAP instrument consists of a set of passively cooled microwave radiometers with 1.4x 1.6-meter diameter primary reflectors to provide the desired angular resolution. MAP measures small fluctuations in the temperature of the cosmic microwave background radiation to an accuracy of one millionth of a degree These measurements should reveal the size, matter content, age, geometry and fate of the universe. They will also reveal the primordial structure that grew to form galaxies and will test ideas about the origins of these primordial structures. The MAP instrument will be continuously shaded from the Sun, Earth, and Moon by the spacecraft. It is a product of Goddard Space Flight Center in partnership with Princeton University
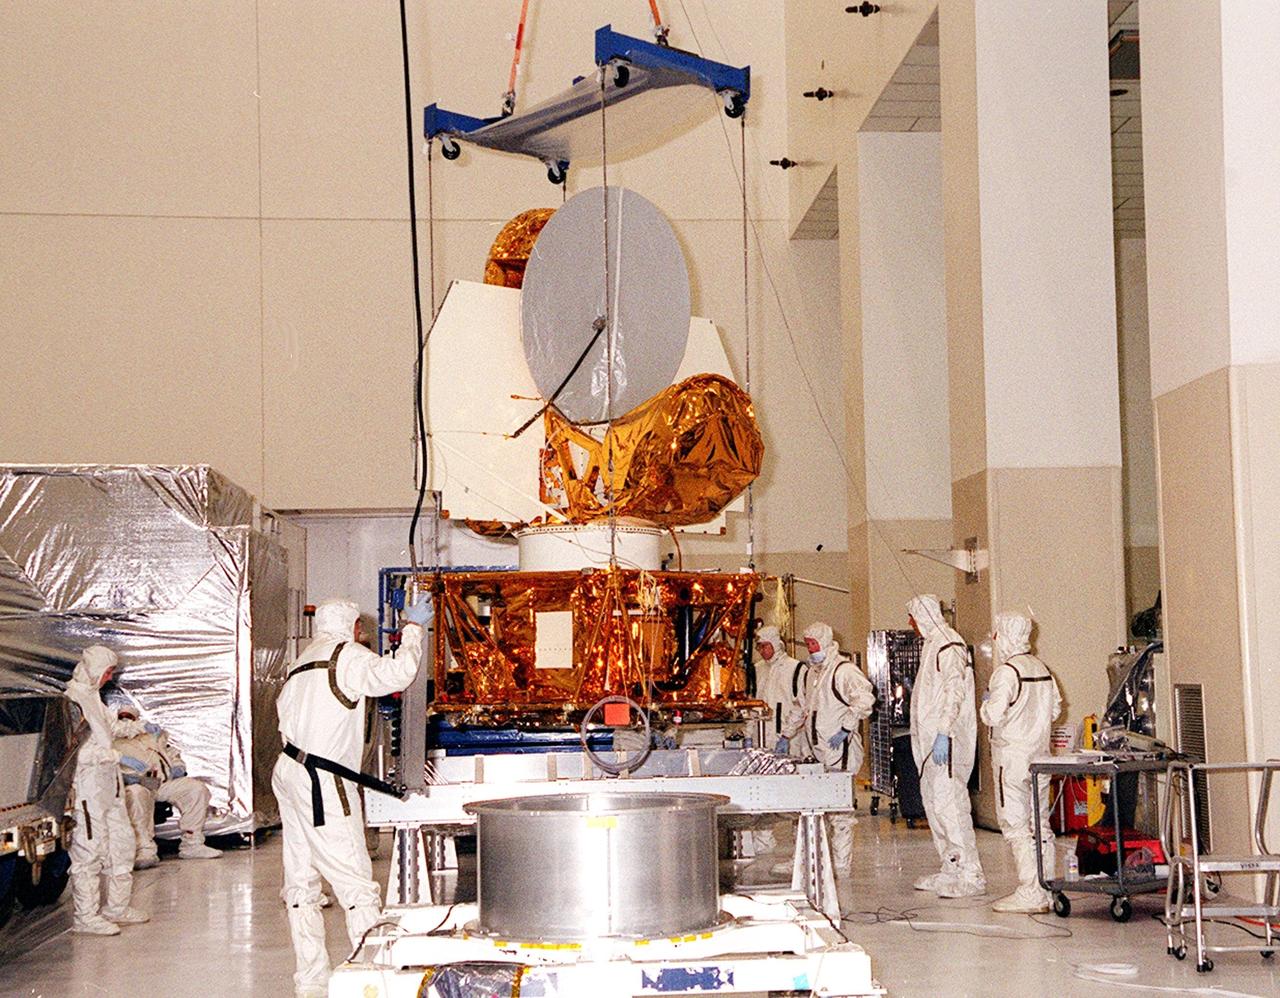
KENNEDY SPACE CENTER, FLA. -- Workers in the Spacecraft Assembly and Encapsulation Facility 2 stand by while the Microwave Anisotropy Probe (MAP) is lifted to place it on a workstand. Several milestones must be completed while MAP is at SAEF-2, including antenna installations, solar array installation, solar array deployment and illumination testing, a spacecraft comprehensive performance test, fueling with hydrazine propellant and a spin balance test. MAP will then be ready for integration with the solid propellant Payload Assist Module upper stage booster. MAP is scheduled for launch June 30 from Cape Canaveral Air Force Station on a Delta II rocket into a lunar-assisted trajectory to the Sun-Earth for a 27-month mission. The MAP instrument consists of a set of passively cooled microwave radiometers with 1.4x 1.6-meter diameter primary reflectors to provide the desired angular resolution. MAP measures small fluctuations in the temperature of the cosmic microwave background radiation to an accuracy of one millionth of a degree These measurements should reveal the size, matter content, age, geometry and fate of the universe. They will also reveal the primordial structure that grew to form galaxies and will test ideas about the origins of these primordial structures. The MAP instrument will be continuously shaded from the Sun, Earth, and Moon by the spacecraft. It is a product of Goddard Space Flight Center in partnership with Princeton University
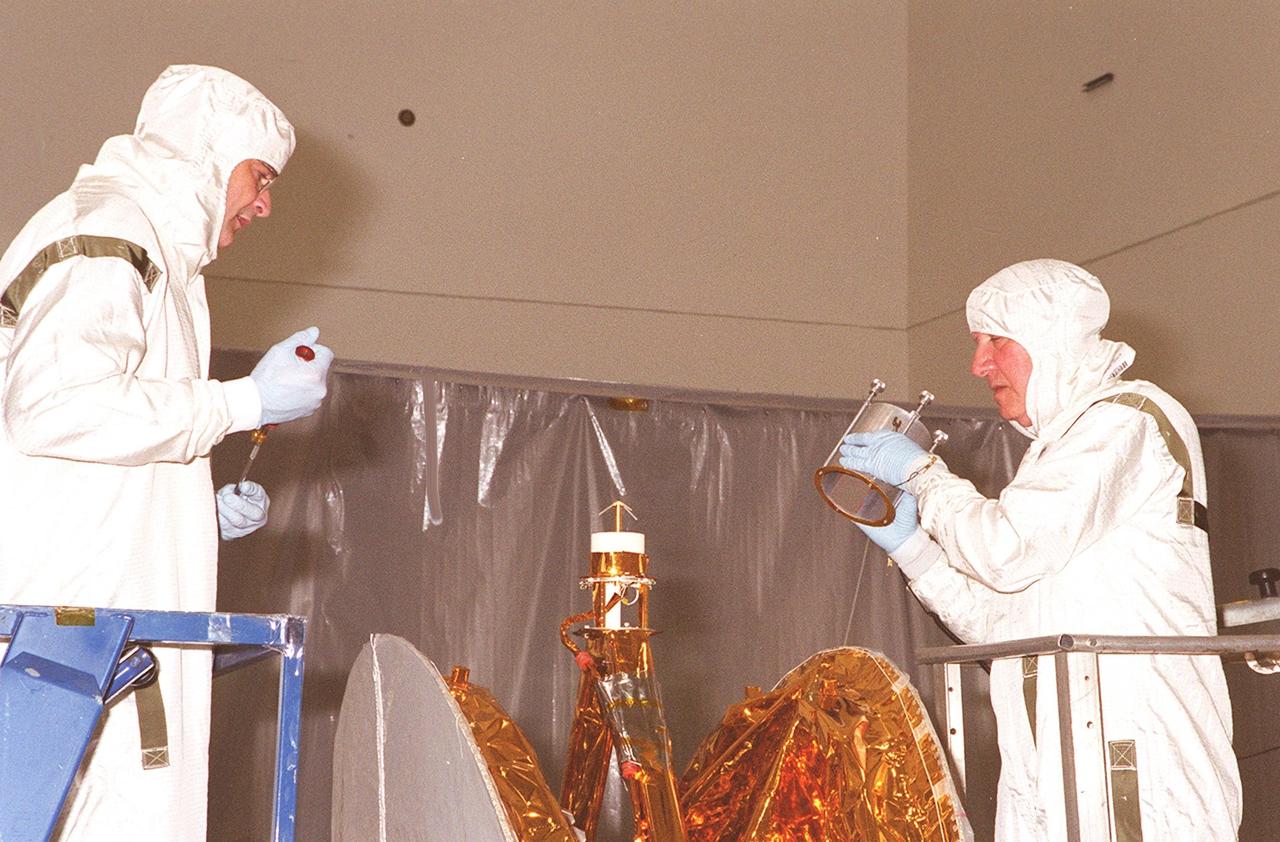
KENNEDY SPACE CENTER, FLA. -- Workers in the Spacecraft Assembly and Encapsulation Facility 2 place an antenna on the Microwave Anisotropy Probe (MAP). Several other milestones must be completed while MAP is at SAEF-2, including solar array installation, solar array deployment and illumination testing, a spacecraft comprehensive performance test, fueling with hydrazine propellant and a spin balance test. MAP will then be ready for integration with the solid propellant Payload Assist Module upper stage booster. MAP is scheduled for launch June 30 from Cape Canaveral Air Force Station on a Delta II rocket into a lunar-assisted trajectory to the Sun-Earth for a 27-month mission. The MAP instrument consists of a set of passively cooled microwave radiometers with 1.4x 1.6-meter diameter primary reflectors to provide the desired angular resolution. MAP measures small fluctuations in the temperature of the cosmic microwave background radiation to an accuracy of one millionth of a degree These measurements should reveal the size, matter content, age, geometry and fate of the universe. They will also reveal the primordial structure that grew to form galaxies and will test ideas about the origins of these primordial structures. The MAP instrument will be continuously shaded from the Sun, Earth, and Moon by the spacecraft. It is a product of Goddard Space Flight Center in partnership with Princeton University
KENNEDY SPACE CENTER, FLA. -- The container with the Microwave Anisotropy Probe (MAP) satellite inside is backed into the Spacecraft Assembly and Encapsulation Facility 2. MAP will undergo testing in the SAEF-2 before its scheduled launch June 30 from Cape Canaveral Air Force Station on a Delta II rocket into a lunar-assisted trajectory to the Sun-Earth for a 27-month mission (3 months transit, 24 months observing). The MAP instrument consists of a set of passively cooled microwave radiometers with 1.4x 1.6-meter diameter primary reflectors to provide the desired angular resolution. MAP measures small fluctuations in the temperature of the cosmic microwave background radiation to an accuracy of one millionth of a degree. These measurements should reveal the size, matter content, age, geometry and fate of the universe. They will also reveal the primordial structure that grew to form galaxies and will test ideas about the origins of these primordial structures. The MAP instrument will be continuously shaded from the Sun, Earth, and Moon by the spacecraft. It is a product of Goddard Space Flight Center in partnership with Princeton University
This map, made using the Compact Ocean Wind Vector Radiometer (COWVR) instrument's observations from Jan. 16 to 23, 2022, shows Earth's microwave emissions at a frequency of 34 gigahertz. This frequency provides information on the strength of winds at the ocean surface, the amount of water in clouds, and the amount of water vapor in the atmosphere. Green and white indicate higher water vapor and clouds, while dark blue over the ocean indicates drier air and clear sky. Typical weather patterns for January, such as tropical moisture and rain (the green band stretching across the center of the map), are visible. https://photojournal.jpl.nasa.gov/catalog/PIA24985
Data from two weather instruments developed at NASA's Jet Propulsion Laboratory in Southern California to provide forecasters data on weather over the open ocean were used to create this image of Tropical Cyclone Mandous on Dec. 9, 2022, as the storm approached the southeastern coast of India. Forecasters at the U.S. Joint Typhoon Warning Center in Pearl Harbor, Hawaii, used the image and others like it to understand the storm's intensity and track its path. The instruments, Compact Ocean Wind Vector Radiometer (COWVR) and Temporal Experiment for Storms and Tropical Systems (TEMPEST), observe the planet's atmosphere and surface from aboard the International Space Station. The image above uses 33.9 gigahertz microwave emissions measured from COWVR to detect structural features of Mandous, including its center, which is about 160 miles (250 kilometers) northeast of the northern tip of Sri Lanka. The colored portions over water indicate the presence of precipitation, with yellow and orange indicating where the storm is strongest, while blue shows where it's weakest. COWVR and TEMPEST sent the data for this image back to Earth in a direct stream via NASA's tracking and data relay satellite (TDRS) constellation. The data was processed at JPL, and meteorologists at the U.S. Naval Research Laboratory in Monterey, California, created the image, which they shared with the Joint Typhoon Warning Center. About the size of a minifridge, COWVR measures natural microwave emissions over the ocean. The magnitude of the emissions increases with the amount of rain in the atmosphere. TEMPEST – comparable in size to a cereal box – tracks microwaves at a much shorter wavelength, allowing it to detect atmospheric water vapor. Both microwave radiometers were conceived to demonstrate that smaller, more energy-efficient, more simply designed sensors can perform most of the same measurements as current space-based weather instruments that are heavier, consume more power, and cost much more to construct. COWVR's development was funded by the U.S. Space Force, and TEMPEST was developed with NASA funding. The U.S. Space Test Program-Houston 8 (STP-H8) is responsible for hosting the instruments on the space station under Space Force funding in partnership with NASA. Data from the instruments is being used by government and university weather forecasters and scientists. The mission will inform development of future space-based weather sensors, and scientists are working on mission concepts that would take advantage of the low-cost microwave sensor technologies to study long-standing questions, such as how heat from the ocean fuels global weather patterns. https://photojournal.jpl.nasa.gov/catalog/PIA25565
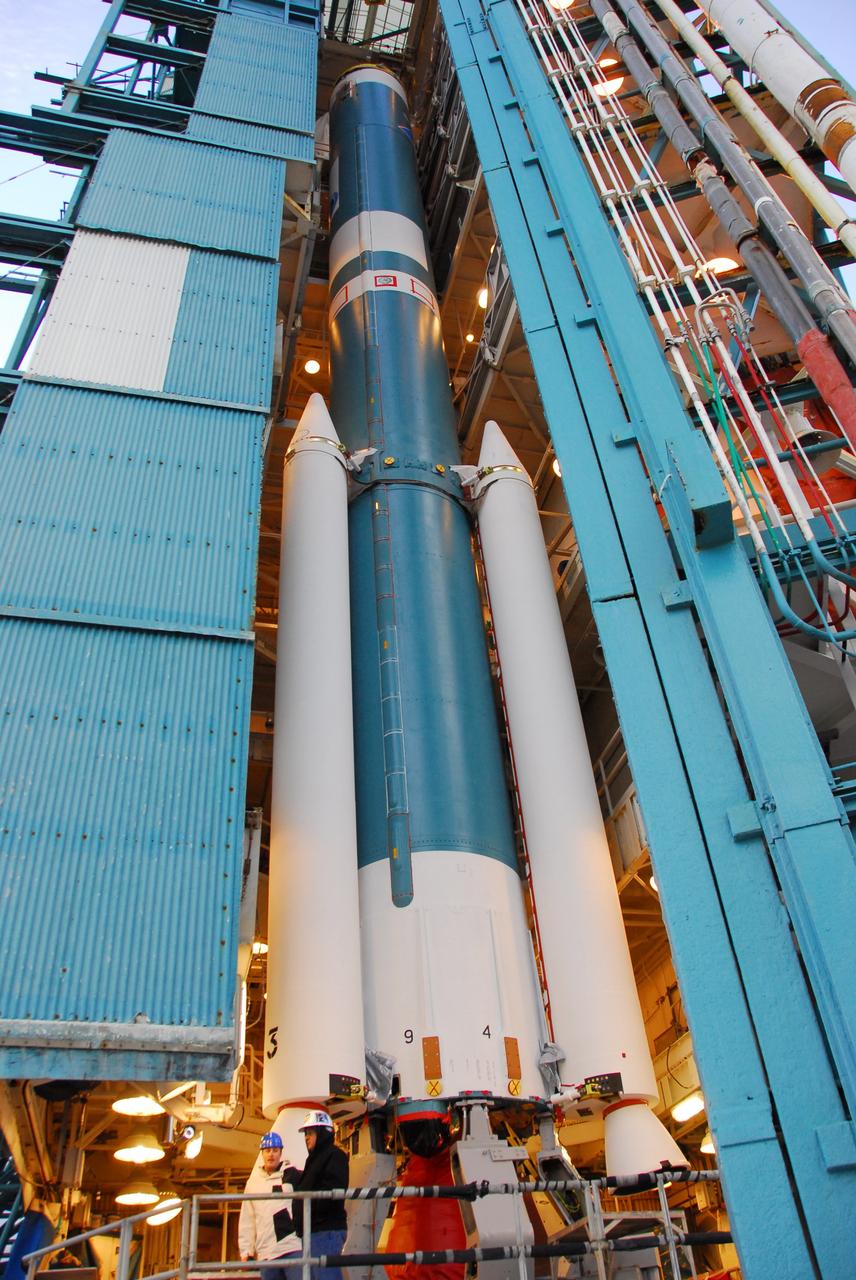
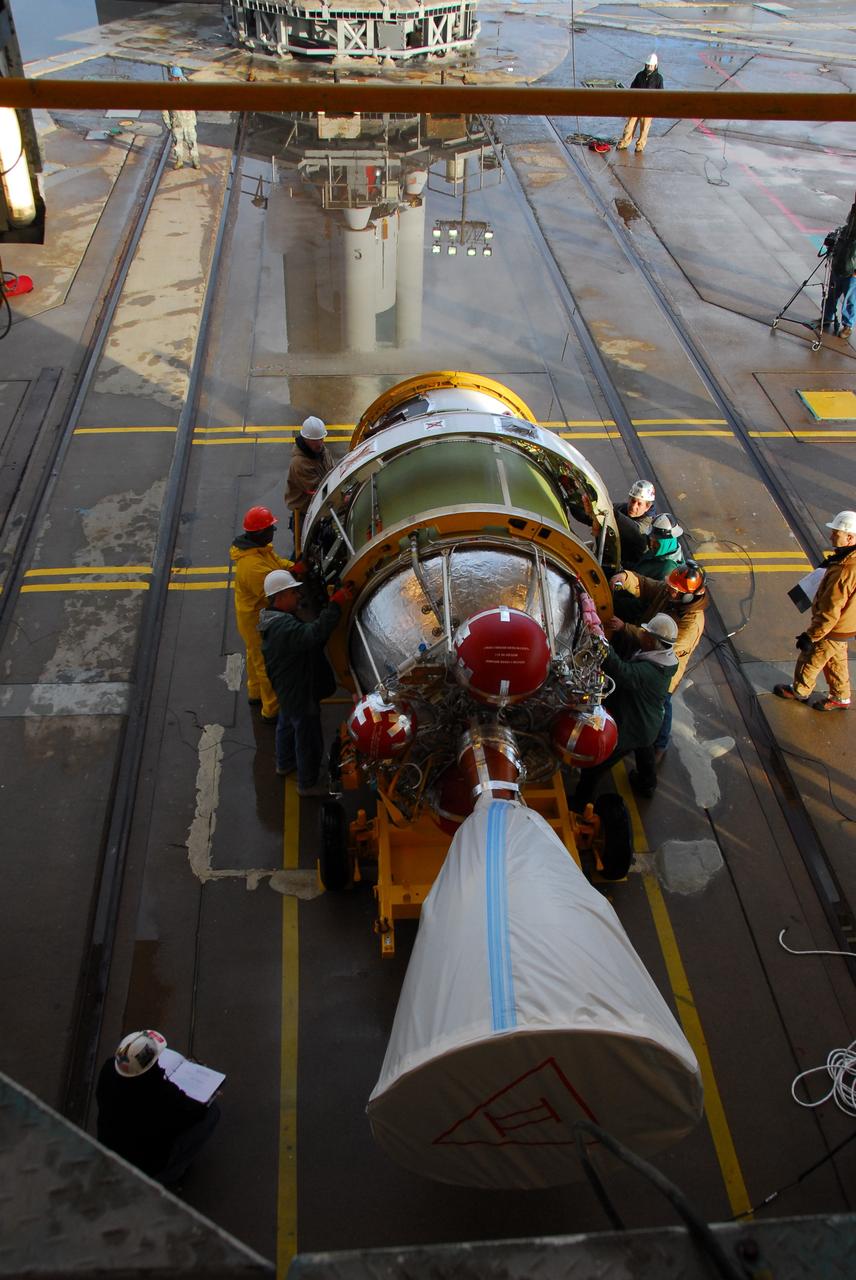
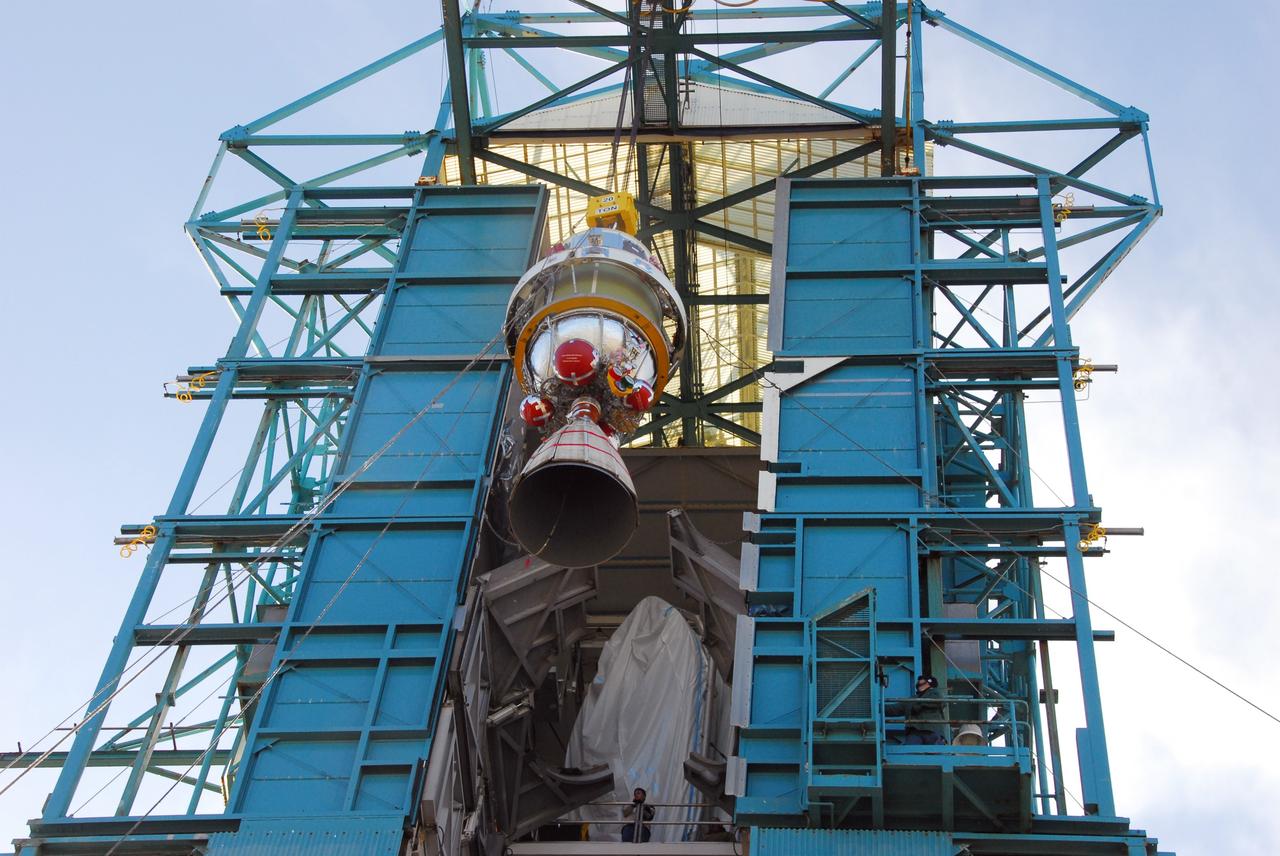
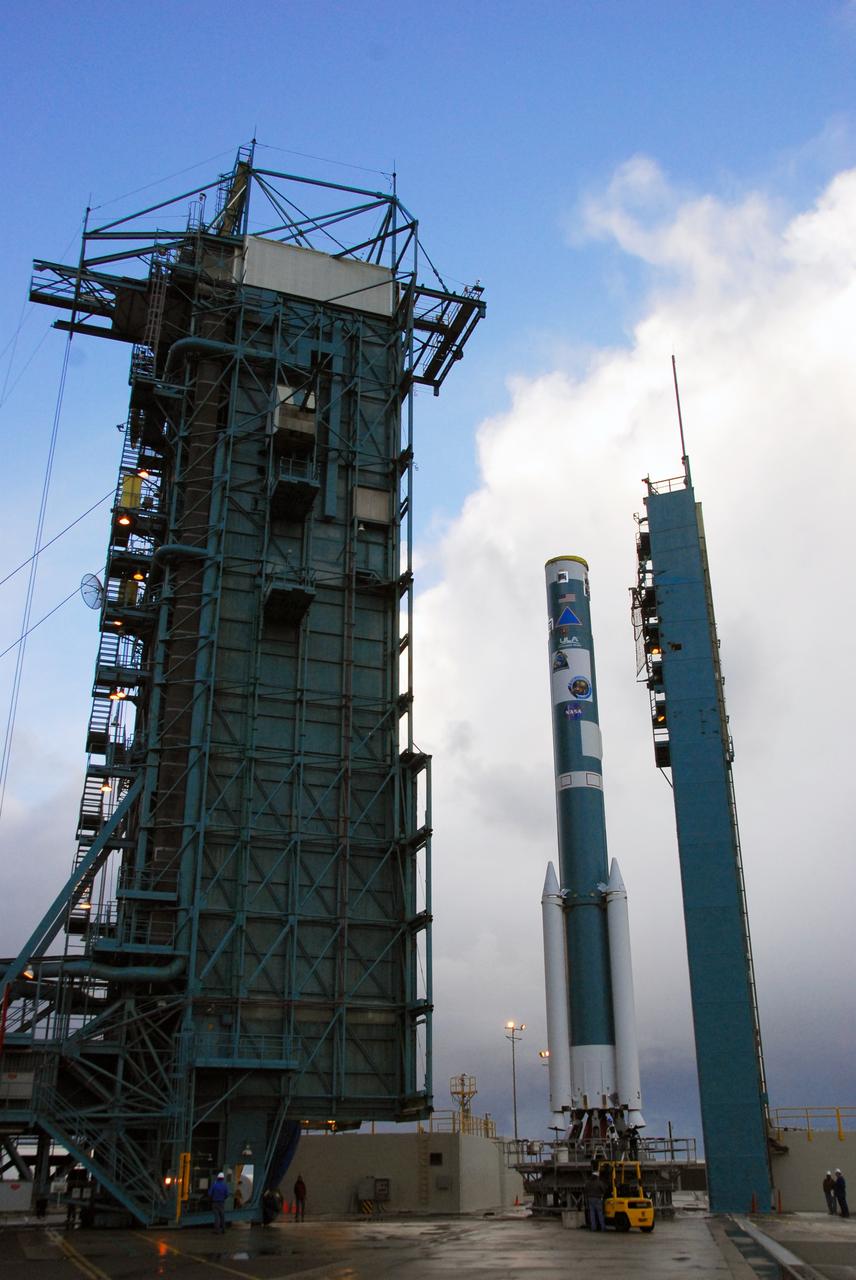
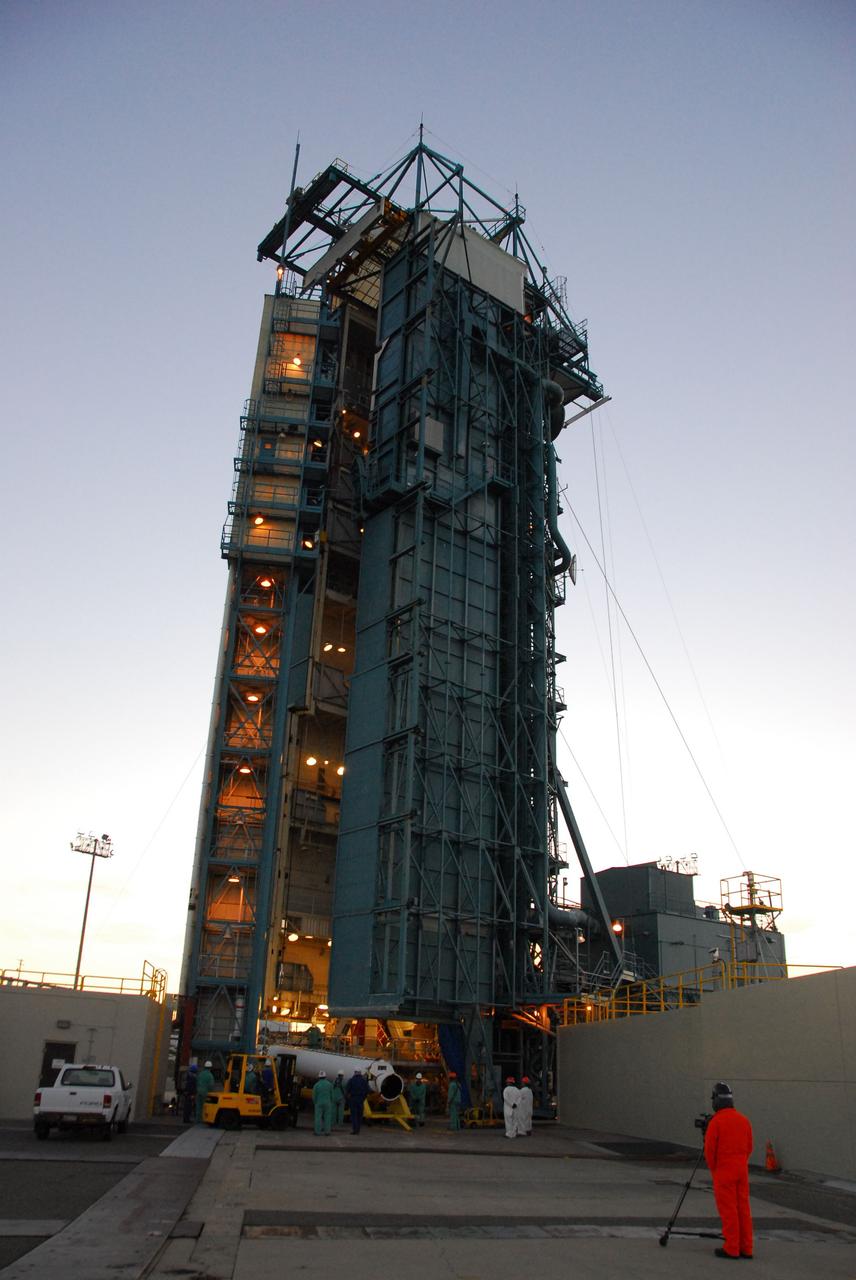
VANDENBERG AIR FORCE BASE, Calif. --At Vandenberg Air Force Base in California, a crane raises one of three United Launch Alliance Delta II solid rocket motors on the pad at Space Launch Complex-2 West (SLC-2W). Scheduled to launch in June, the Delta II rocket will carry NASA's Aquarius satellite into low Earth orbit. Aquarius' mission will be to provide monthly maps of global changes in sea surface salinity. By measuring ocean salinity from space, Aquarius will provide new insights into how the massive natural exchange of freshwater between the ocean, atmosphere and sea ice influences ocean circulation, weather and climate. Also going up with the satellite are optical and thermal cameras, a microwave radiometer and the SAC-D spacecraft, which were developed with the help of institutions in Italy, France, Canada and Argentina. Photo credit: VAFB/30th Space Wing

VANDENBERG AIR FORCE BASE, Calif. --As the sun rises over Vandenberg Air Force Base in California, a crane begins to raise one of three United Launch Alliance Delta II solid rocket motors on the pad at Space Launch Complex-2 West (SLC-2W). Scheduled to launch in June, the Delta II rocket will carry NASA's Aquarius satellite into low Earth orbit. Aquarius' mission will be to provide monthly maps of global changes in sea surface salinity. By measuring ocean salinity from space, Aquarius will provide new insights into how the massive natural exchange of freshwater between the ocean, atmosphere and sea ice influences ocean circulation, weather and climate. Also going up with the satellite are optical and thermal cameras, a microwave radiometer and the SAC-D spacecraft, which were developed with the help of institutions in Italy, France, Canada and Argentina. Photo credit: VAFB/30th Space Wing
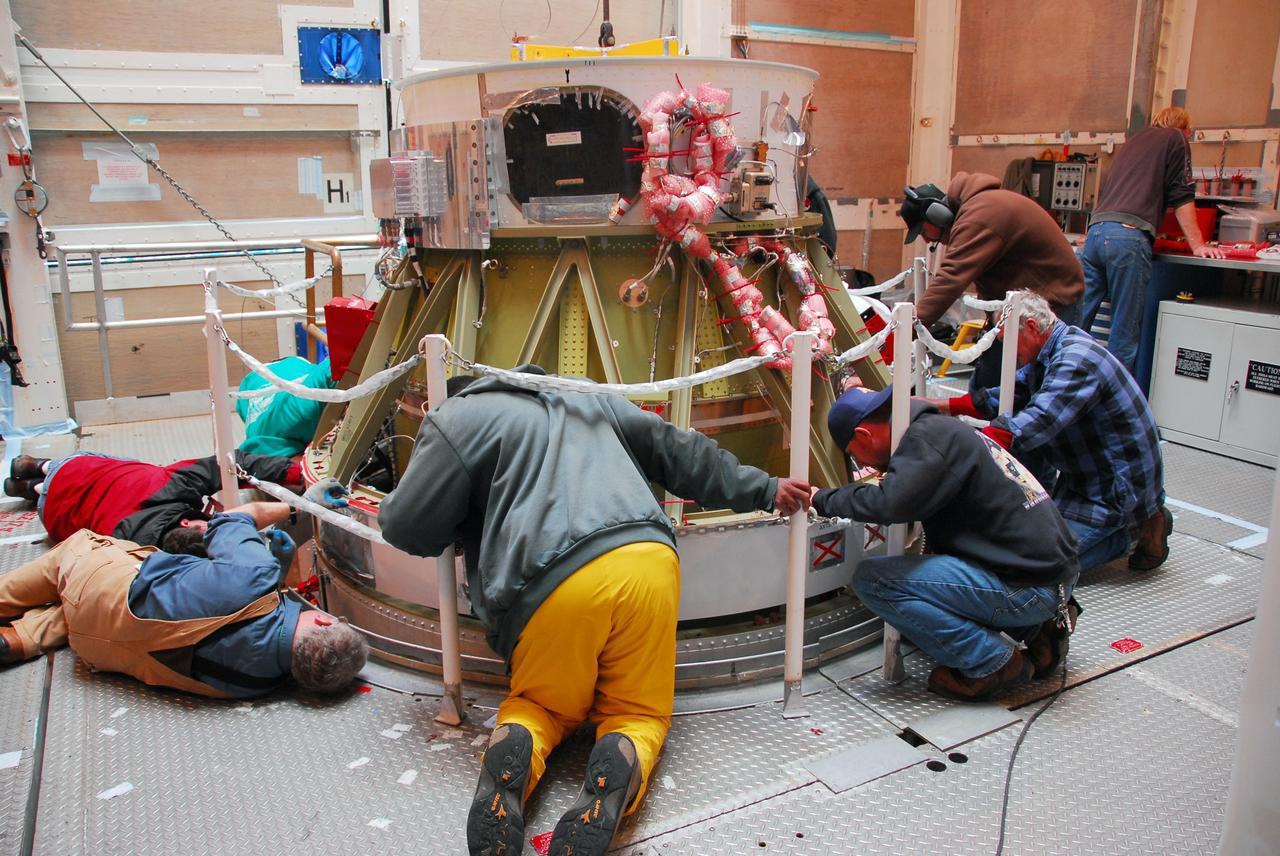
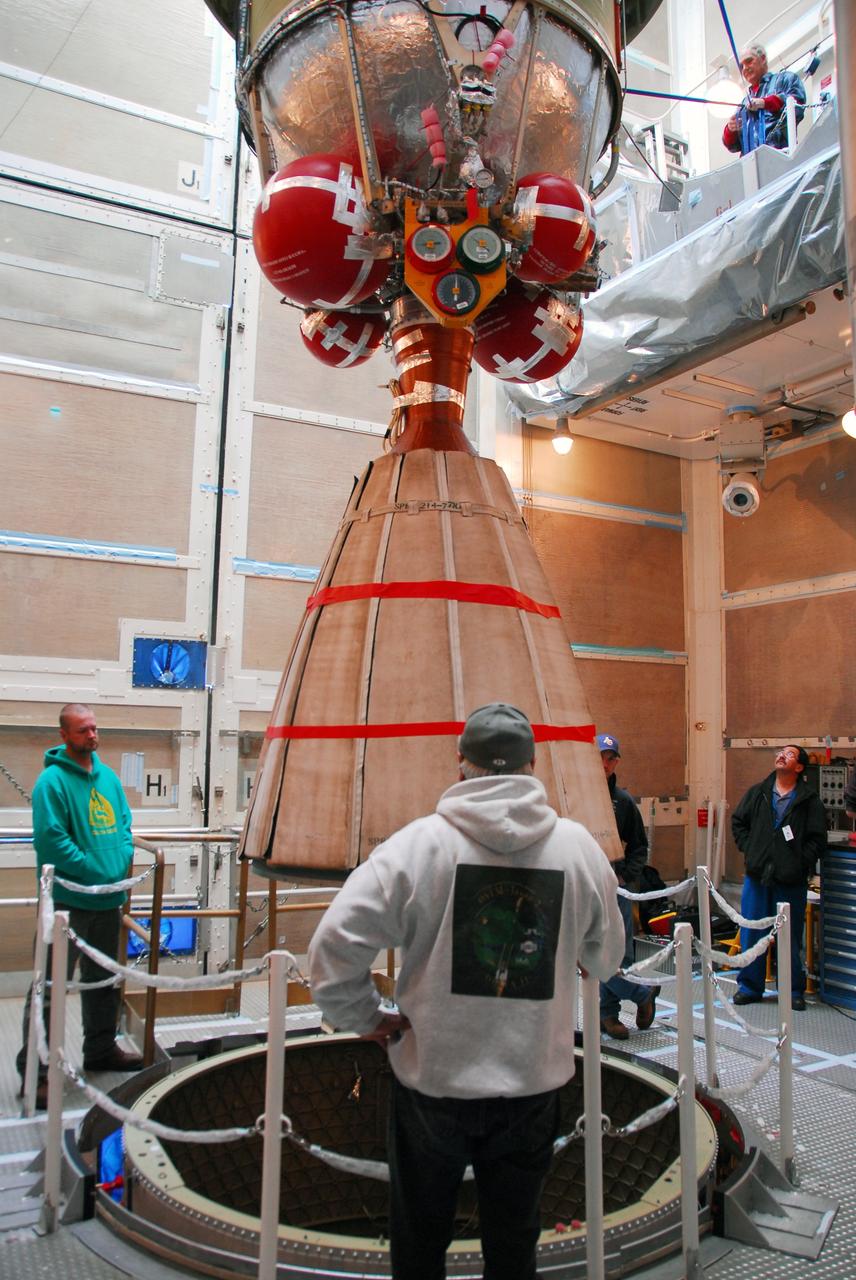
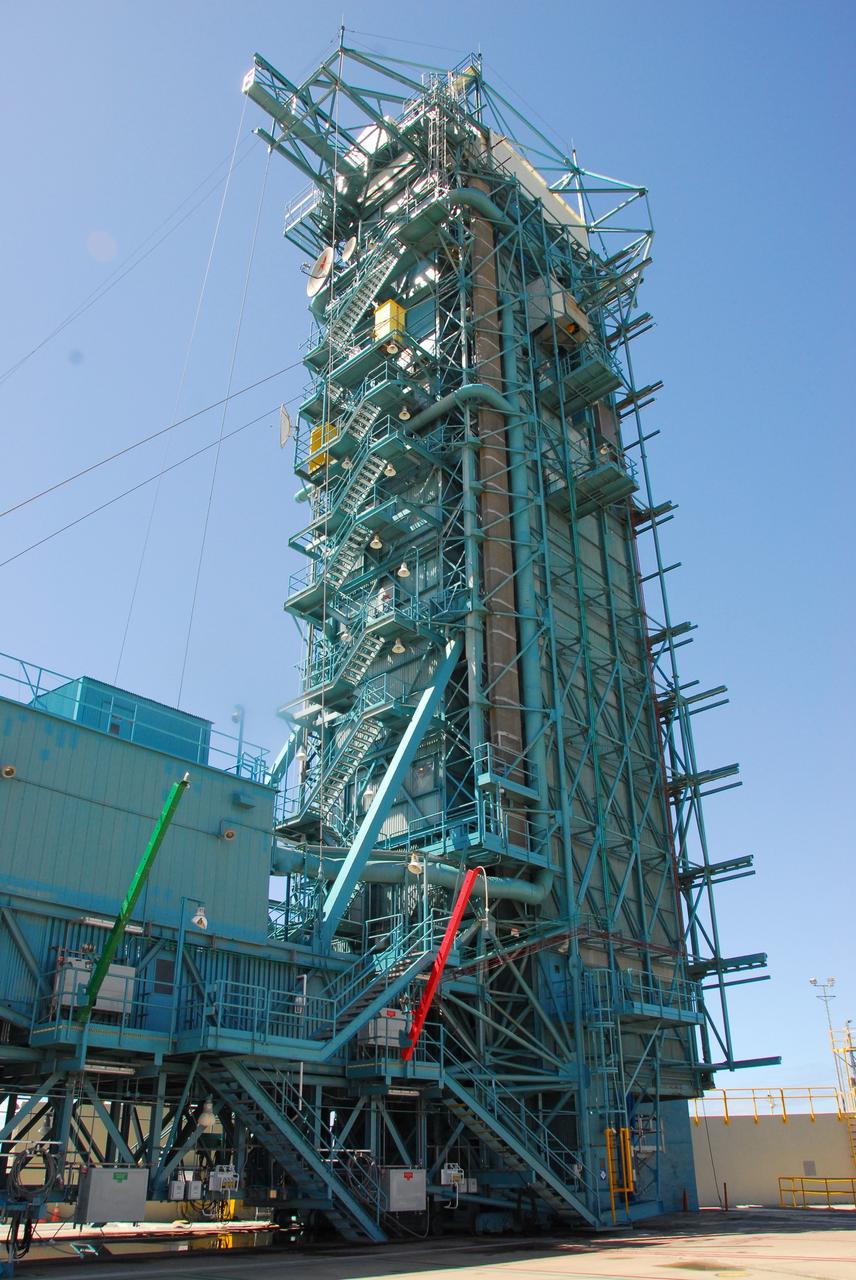
VANDENBERG AIR FORCE BASE, Calif. -- United Space Alliance technicians prepare to move the Space Launch Complex-2 (SLC-2) service tower at Vandenberg Air Force Base in California. The move will allow technicians to hoist into position the second stage of the Delta II rocket that will carry NASA's Aquarius satellite into low Earth orbit. Scheduled to launch in June, Aquarius' mission will be to provide monthly maps of global changes in sea surface salinity. By measuring ocean salinity from space, Aquarius will provide new insights into how the massive natural exchange of freshwater between the ocean, atmosphere and sea ice influences ocean circulation, weather and climate. Also going up with the satellite are optical and thermal cameras, a microwave radiometer and the SAC-D spacecraft, which were developed with the help of institutions in Italy, France, Canada and Argentina. Photo credit: VAFB/30th Space Wing
VANDENBERG AIR FORCE BASE, Calif. -- With the Space Launch Complex-2 (SLC-2) service tower at Vandenberg Air Force Base in California back in place, United Space Alliance technicians complete the installation of the second stage of a Delta II rocket to the first stage. The rocket is being prepared to launch NASA's Aquarius satellite into low Earth orbit. Scheduled to launch in June, Aquarius' mission will be to provide monthly maps of global changes in sea surface salinity. By measuring ocean salinity from space, Aquarius will provide new insights into how the massive natural exchange of freshwater between the ocean, atmosphere and sea ice influences ocean circulation, weather and climate. Also going up with the satellite are optical and thermal cameras, a microwave radiometer and the SAC-D spacecraft, which were developed with the help of institutions in Italy, France, Canada and Argentina. Photo credit: VAFB/30th Space Wing
VANDENBERG AIR FORCE BASE, Calif. --As the sun rises over Vandenberg Air Force Base in California, a crane raises one of three United Launch Alliance Delta II solid rocket motors on the pad at Space Launch Complex-2 West (SLC-2W). Scheduled to launch in June, the Delta II rocket will carry NASA's Aquarius satellite into low Earth orbit. Aquarius' mission will be to provide monthly maps of global changes in sea surface salinity. By measuring ocean salinity from space, Aquarius will provide new insights into how the massive natural exchange of freshwater between the ocean, atmosphere and sea ice influences ocean circulation, weather and climate. Also going up with the satellite are optical and thermal cameras, a microwave radiometer and the SAC-D spacecraft, which were developed with the help of institutions in Italy, France, Canada and Argentina. Photo credit: VAFB/30th Space Wing
VANDENBERG AIR FORCE BASE, Calif. --At Vandenberg Air Force Base in California, one of three United Space Alliance Delta II solid rocket motors is atop a tug for the move from the solid motor facility to Space Launch Complex-2 West (SLC-2W). Scheduled to launch in June, the Delta II rocket will carry NASA's Aquarius satellite into low Earth orbit. Aquarius' mission will be to provide monthly maps of global changes in sea surface salinity. By measuring ocean salinity from space, Aquarius will provide new insights into how the massive natural exchange of freshwater between the ocean, atmosphere and sea ice influences ocean circulation, weather and climate. Also going up with the satellite are optical and thermal cameras, a microwave radiometer and the SAC-D spacecraft, which were developed with the help of institutions in Italy, France, Canada and Argentina. Photo credit: VAFB/30th Space Wing
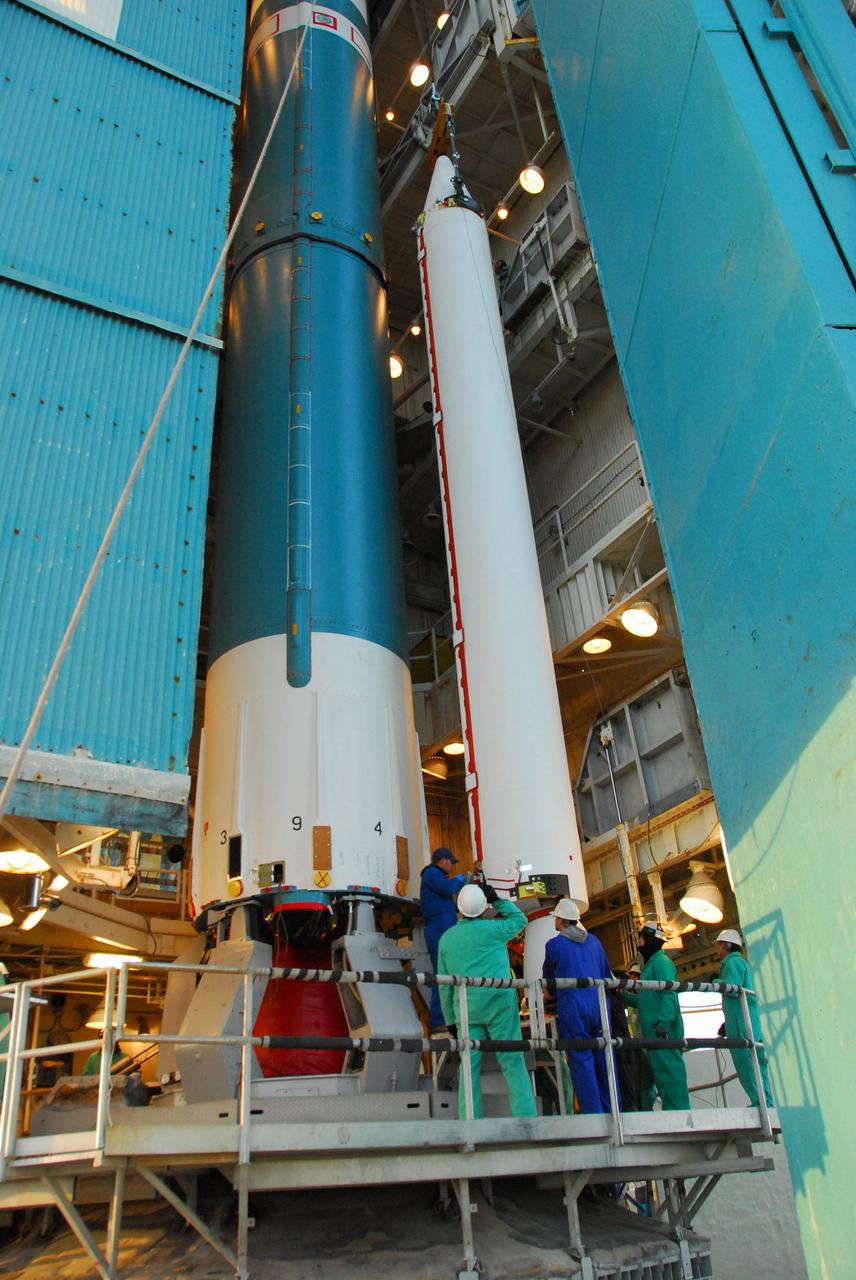
VANDENBERG AIR FORCE BASE, Calif. -- United Space Alliance technicians prepare to hoist the second stage of a Delta II rocket into position in the Space Launch Complex-2 (SLC-2) service tower at Vandenberg Air Force Base in California. The rocket is being prepared to launch NASA's Aquarius satellite into low Earth orbit. Scheduled to launch in June, Aquarius' mission will be to provide monthly maps of global changes in sea surface salinity. By measuring ocean salinity from space, Aquarius will provide new insights into how the massive natural exchange of freshwater between the ocean, atmosphere and sea ice influences ocean circulation, weather and climate. Also going up with the satellite are optical and thermal cameras, a microwave radiometer and the SAC-D spacecraft, which were developed with the help of institutions in Italy, France, Canada and Argentina. Photo credit: VAFB/30th Space Wing
VANDENBERG AIR FORCE BASE, Calif. -- With the Space Launch Complex-2 (SLC-2) service tower at Vandenberg Air Force Base in California back in place, United Space Alliance technicians lower the second stage of a Delta II rocket into position over the first stage. The rocket is being prepared to launch NASA's Aquarius satellite into low Earth orbit. Scheduled to launch in June, Aquarius' mission will be to provide monthly maps of global changes in sea surface salinity. By measuring ocean salinity from space, Aquarius will provide new insights into how the massive natural exchange of freshwater between the ocean, atmosphere and sea ice influences ocean circulation, weather and climate. Also going up with the satellite are optical and thermal cameras, a microwave radiometer and the SAC-D spacecraft, which were developed with the help of institutions in Italy, France, Canada and Argentina. Photo credit: VAFB/30th Space Wing
VANDENBERG AIR FORCE BASE, Calif. --As the sun rises over Vandenberg Air Force Base in California, United Launch Alliance technicians prepare to raise one of three Delta II solid rocket motors on the pad at Space Launch Complex-2 West (SLC-2W). Scheduled to launch in June, the Delta II rocket will carry NASA's Aquarius satellite into low Earth orbit. Aquarius' mission will be to provide monthly maps of global changes in sea surface salinity. By measuring ocean salinity from space, Aquarius will provide new insights into how the massive natural exchange of freshwater between the ocean, atmosphere and sea ice influences ocean circulation, weather and climate. Also going up with the satellite are optical and thermal cameras, a microwave radiometer and the SAC-D spacecraft, which were developed with the help of institutions in Italy, France, Canada and Argentina. Photo credit: VAFB/30th Space Wing
VANDENBERG AIR FORCE BASE, Calif. --As the sun rises over Vandenberg Air Force Base in California, a crane raises one of three United Launch Alliance Delta II solid rocket motors on the pad at Space Launch Complex-2 West (SLC-2W). Scheduled to launch in June, the Delta II rocket will carry NASA's Aquarius satellite into low Earth orbit. Aquarius' mission will be to provide monthly maps of global changes in sea surface salinity. By measuring ocean salinity from space, Aquarius will provide new insights into how the massive natural exchange of freshwater between the ocean, atmosphere and sea ice influences ocean circulation, weather and climate. Also going up with the satellite are optical and thermal cameras, a microwave radiometer and the SAC-D spacecraft, which were developed with the help of institutions in Italy, France, Canada and Argentina. Photo credit: VAFB/30th Space Wing
VANDENBERG AIR FORCE BASE, Calif. -- United Space Alliance technicians hoist the second stage of a Delta II rocket into position in the Space Launch Complex-2 (SLC-2) service tower at Vandenberg Air Force Base in California. The rocket is being prepared to launch NASA's Aquarius satellite into low Earth orbit. Scheduled to launch in June, Aquarius' mission will be to provide monthly maps of global changes in sea surface salinity. By measuring ocean salinity from space, Aquarius will provide new insights into how the massive natural exchange of freshwater between the ocean, atmosphere and sea ice influences ocean circulation, weather and climate. Also going up with the satellite are optical and thermal cameras, a microwave radiometer and the SAC-D spacecraft, which were developed with the help of institutions in Italy, France, Canada and Argentina. Photo credit: VAFB/30th Space Wing

This animation depicts Jupiter's planet wrapping cloud structure, commonly referred to as "belts" and "zones," and the jet streams that encompass them. The belts (white bands) and zones (reddish bands) are separated by strong east-west winds, or jet streams (depicted by black arrows), that move in opposite directions. These jets penetrate about 1,800 miles (3,000 kilometers) below the cloud level of Jupiter. Other components of the winds including north-south and up-down movements – have been a mystery and have now been uncovered with the latest data from the microwave radiometer instrument aboard NASA's Juno spacecraft. The base composite image of Jupiter was created from images obtained by NASA's Cassini spacecraft. Movie available at https://photojournal.jpl.nasa.gov/catalog/PIA24964
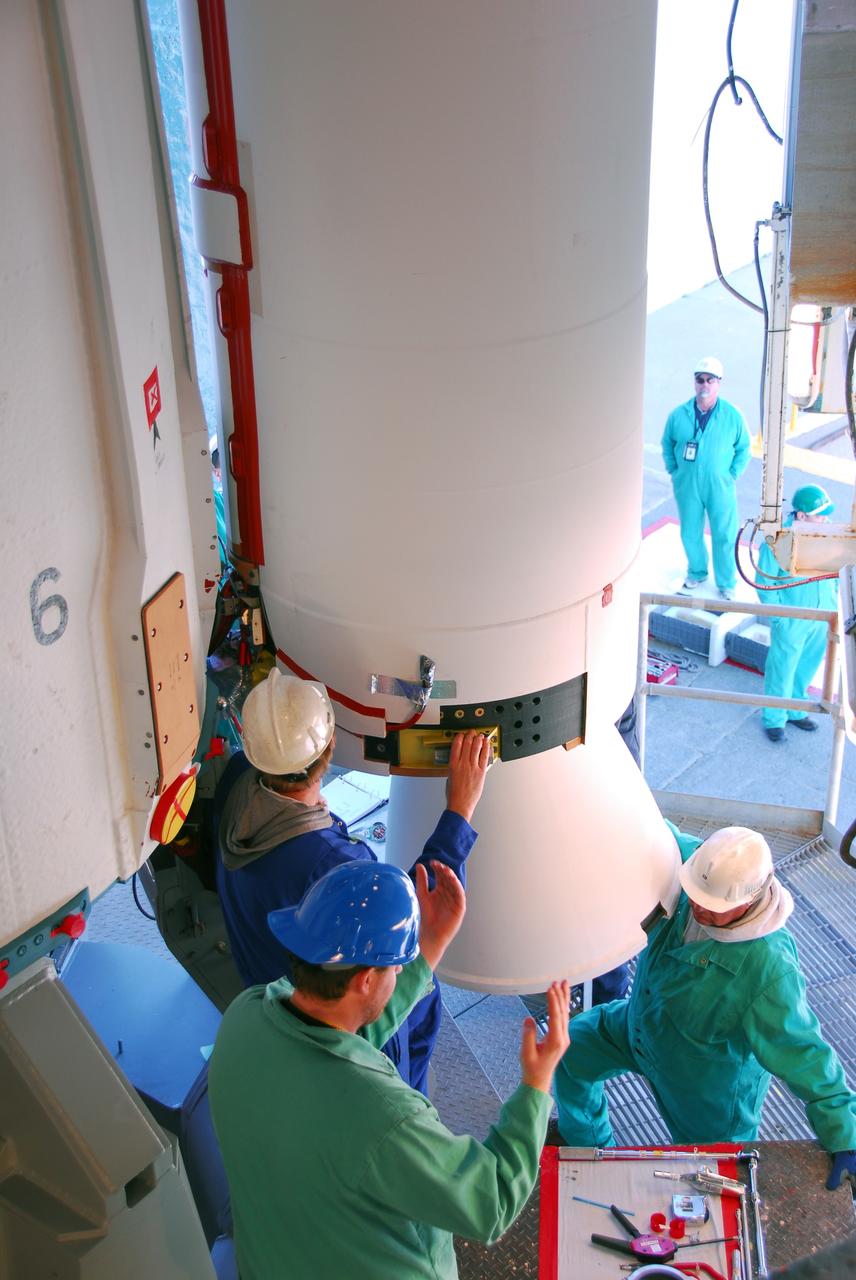
VANDENBERG AIR FORCE BASE, Calif. --At Vandenberg Air Force Base in California, United Launch Alliance technicians finish installing one of three Delta II solid rocket motors on the pad at Space Launch Complex-2 West (SLC-2W). Scheduled to launch in June, the Delta II rocket will carry NASA's Aquarius satellite into low Earth orbit. Aquarius' mission will be to provide monthly maps of global changes in sea surface salinity. By measuring ocean salinity from space, Aquarius will provide new insights into how the massive natural exchange of freshwater between the ocean, atmosphere and sea ice influences ocean circulation, weather and climate. Also going up with the satellite are optical and thermal cameras, a microwave radiometer and the SAC-D spacecraft, which were developed with the help of institutions in Italy, France, Canada and Argentina. Photo credit: VAFB/30th Space Wing
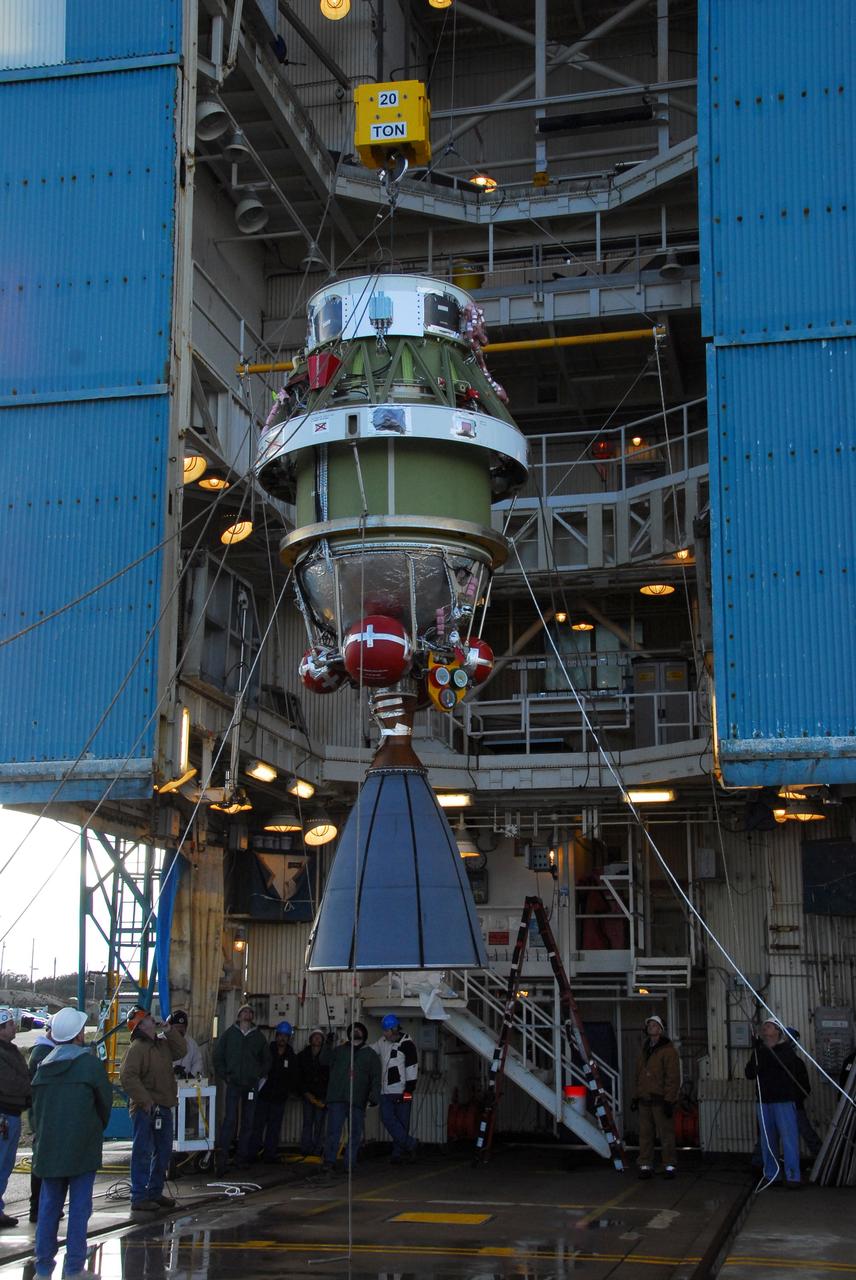
VANDENBERG AIR FORCE BASE, Calif. -- United Space Alliance technicians hoist the second stage of a Delta II rocket into position in the Space Launch Complex-2 (SLC-2) service tower at Vandenberg Air Force Base in California. The rocket is being prepared to launch NASA's Aquarius satellite into low Earth orbit. Scheduled to launch in June, Aquarius' mission will be to provide monthly maps of global changes in sea surface salinity. By measuring ocean salinity from space, Aquarius will provide new insights into how the massive natural exchange of freshwater between the ocean, atmosphere and sea ice influences ocean circulation, weather and climate. Also going up with the satellite are optical and thermal cameras, a microwave radiometer and the SAC-D spacecraft, which were developed with the help of institutions in Italy, France, Canada and Argentina. Photo credit: VAFB/30th Space Wing
VANDENBERG AIR FORCE BASE, Calif. --At Vandenberg Air Force Base in California, a crane raises one of three United Launch Alliance Delta II solid rocket motors on the pad at Space Launch Complex-2 West (SLC-2W). A second motor was installed earlier in the morning. Scheduled to launch in June, the Delta II rocket will carry NASA's Aquarius satellite into low Earth orbit. Aquarius' mission will be to provide monthly maps of global changes in sea surface salinity. By measuring ocean salinity from space, Aquarius will provide new insights into how the massive natural exchange of freshwater between the ocean, atmosphere and sea ice influences ocean circulation, weather and climate. Also going up with the satellite are optical and thermal cameras, a microwave radiometer and the SAC-D spacecraft, which were developed with the help of institutions in Italy, France, Canada and Argentina. Photo credit: VAFB/30th Space Wing
A pair of weather instruments built at NASA's Jet Propulsion Laboratory in Southern California captured images of Hurricane Idalia as the storm approached the Gulf Coast of Florida on Aug. 29, 2023. COWVR (short for Compact Ocean Wind Vector Radiometer) and TEMPEST (Temporal Experiment for Storms and Tropical Systems) observe the planet's atmosphere and surface from aboard the International Space Station, which passed in low Earth orbit over this area at about 11:34 a.m. EDT. Idalia was forecast to make landfall in Florida on Aug. 30. This image combines microwave emissions measurements from both COWVR and TEMPEST. White sections indicate the presence of clouds. Green portions indicate rain. Yellow, red, and black indicate where air and water vapor were moving most vigorously. Idalia's center is seen about 200 miles (322 kilometers) west of the Florida Keys, and rainfall is indicated on the western end of Cuba. https://photojournal.jpl.nasa.gov/catalog/PIA25569
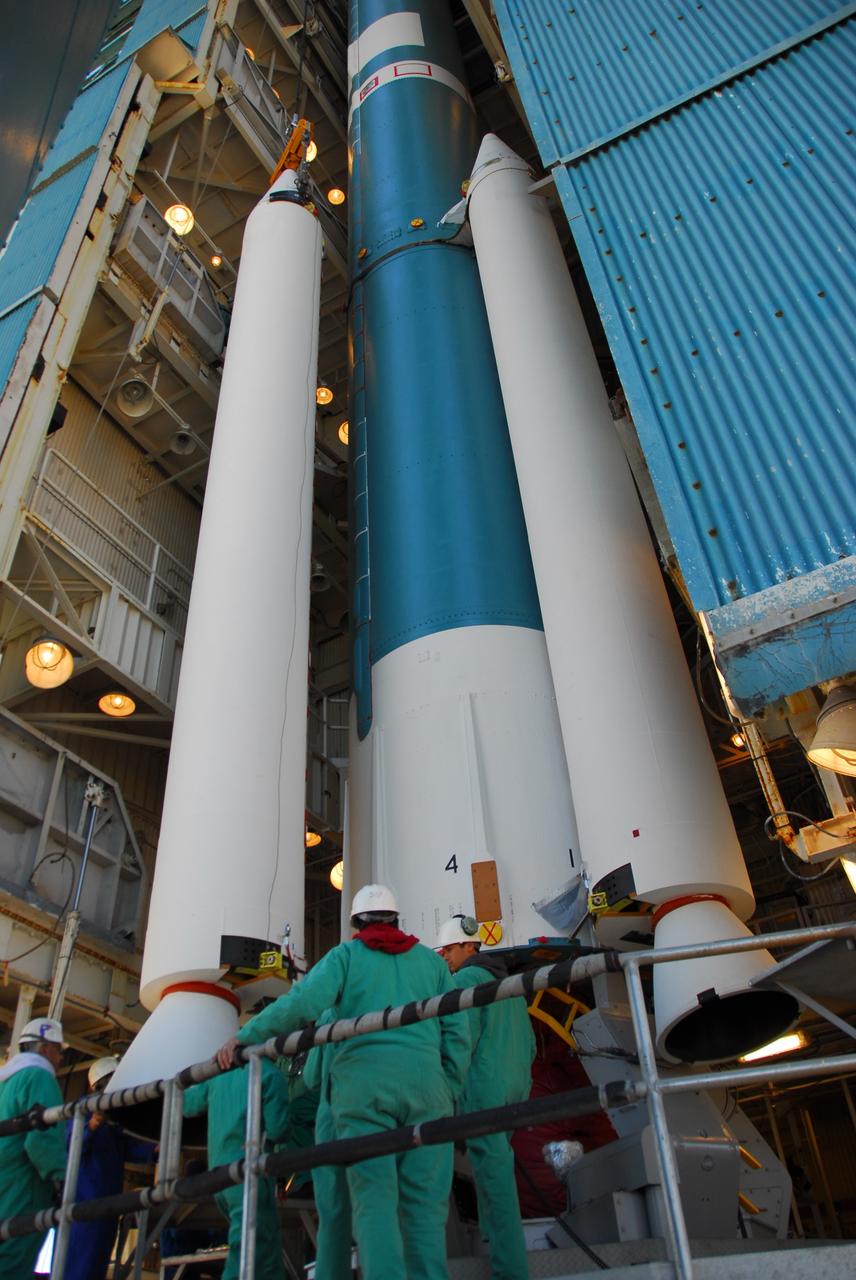
VANDENBERG AIR FORCE BASE, Calif. -- With the Space Launch Complex-2 (SLC-2) service tower at Vandenberg Air Force Base in California back in place, the first and second stages, and three solid rocket motors of a Delta II rocket are in their launch configuration. The rocket is being prepared to launch NASA's Aquarius satellite into low Earth orbit. Scheduled to launch in June, Aquarius' mission will be to provide monthly maps of global changes in sea surface salinity. By measuring ocean salinity from space, Aquarius will provide new insights into how the massive natural exchange of freshwater between the ocean, atmosphere and sea ice influences ocean circulation, weather and climate. Also going up with the satellite are optical and thermal cameras, a microwave radiometer and the SAC-D spacecraft, which were developed with the help of institutions in Italy, France, Canada and Argentina. Photo credit: VAFB/30th Space Wing
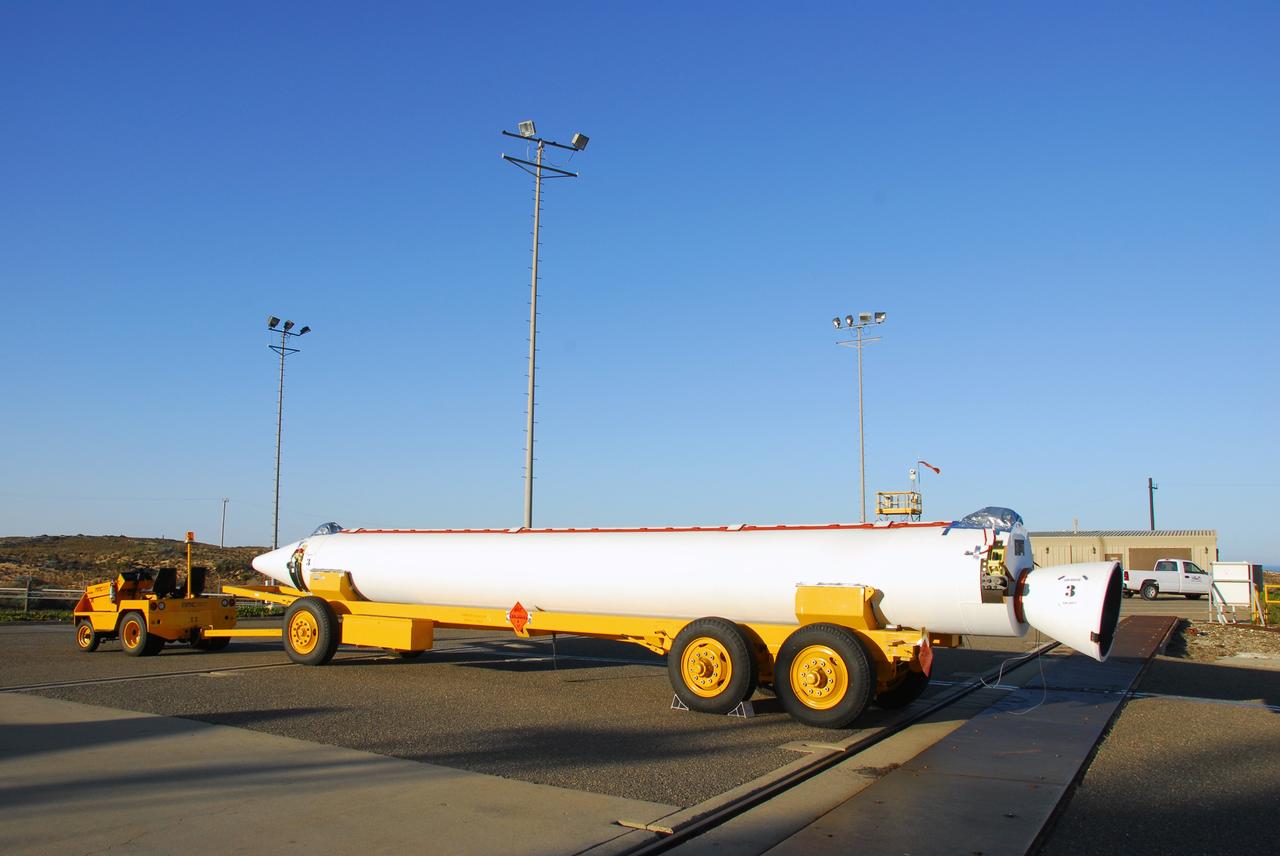
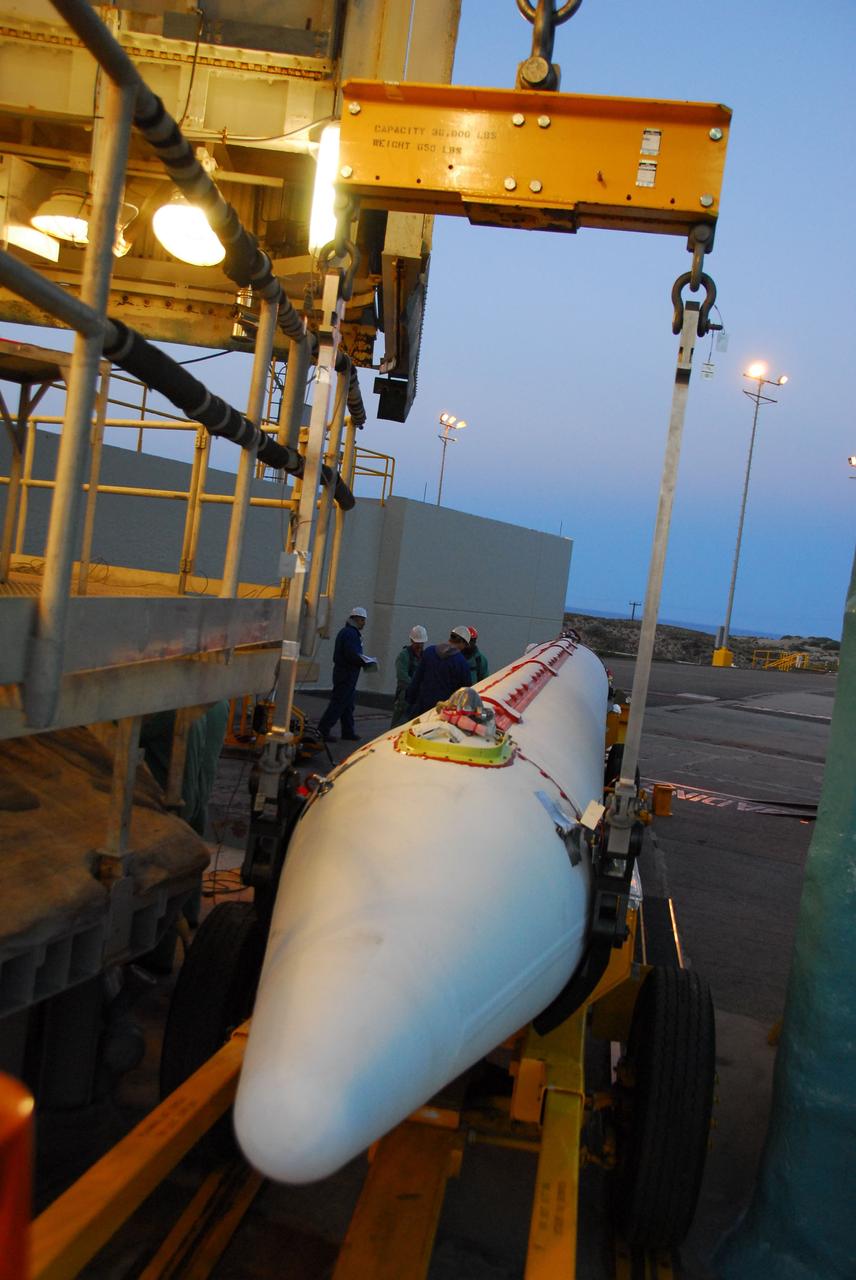
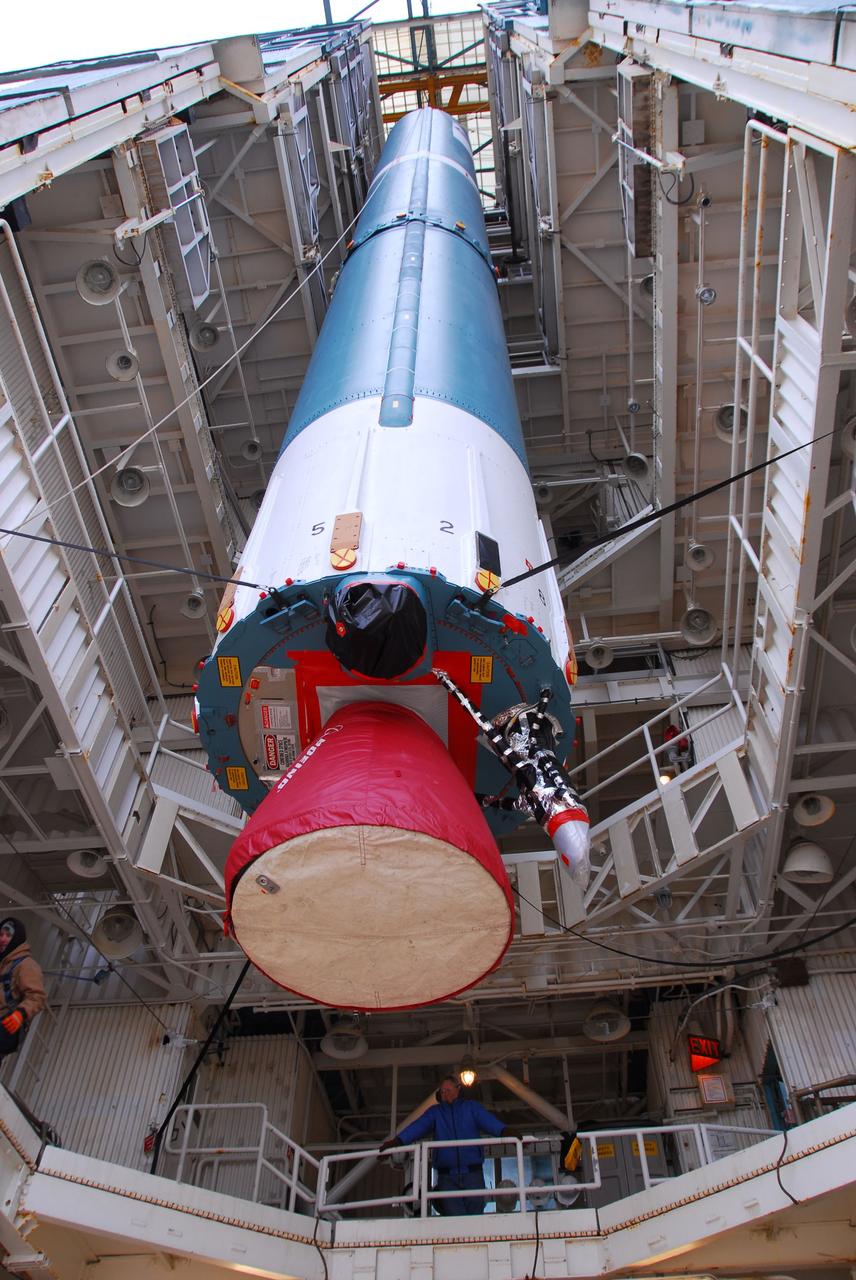
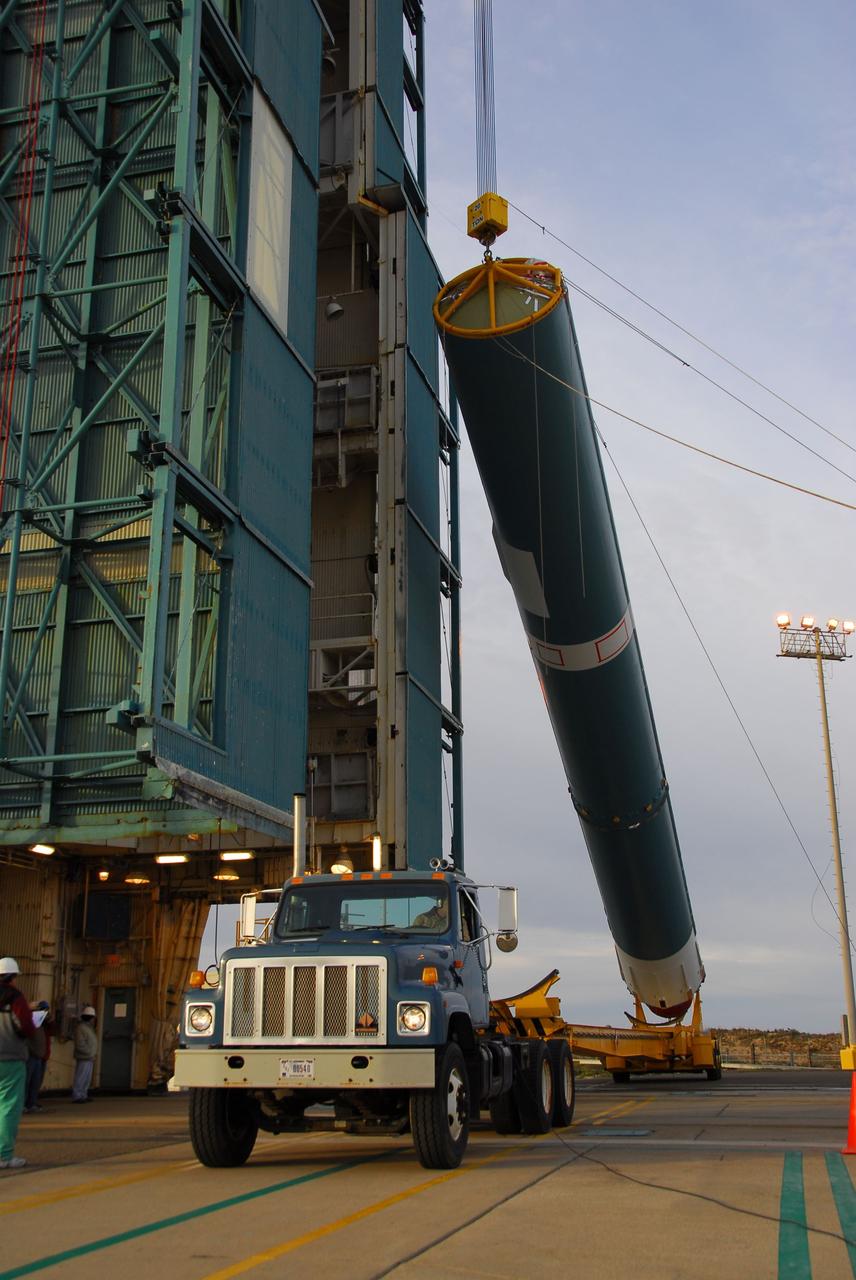
VANDENBERG AIR FORCE BASE, Calif. -- As the sun rises over Vandenberg Air Force Base in California, the first stage of the United Launch Alliance Delta II rocket that will carry the Aquarius/SAC-D satellite into low Earth orbit is prepared for its move to Space Launch Complex-2 (SLC-2). Scheduled to launch in June, Aquarius' mission will be to provide monthly maps of global changes in sea surface salinity. By measuring ocean salinity from space, Aquarius will provide new insights into how the massive natural exchange of freshwater between the ocean, atmosphere and sea ice influences ocean circulation, weather and climate. Also going up with the satellite are optical and thermal cameras, a microwave radiometer and the SAC-D spacecraft, which were developed with the help of institutions in Italy, France, Canada and Argentina. Photo credit: NASA/VAFB
VANDENBERG AIR FORCE BASE, Calif. -- With the Space Launch Complex-2 (SLC-2) service tower at Vandenberg Air Force Base in California back in place, United Space Alliance technicians lower the second stage of a Delta II rocket into position over the first stage and three solid rocket motors. The rocket is being prepared to launch NASA's Aquarius satellite into low Earth orbit. Scheduled to launch in June, Aquarius' mission will be to provide monthly maps of global changes in sea surface salinity. By measuring ocean salinity from space, Aquarius will provide new insights into how the massive natural exchange of freshwater between the ocean, atmosphere and sea ice influences ocean circulation, weather and climate. Also going up with the satellite are optical and thermal cameras, a microwave radiometer and the SAC-D spacecraft, which were developed with the help of institutions in Italy, France, Canada and Argentina. Photo credit: VAFB/30th Space Wing
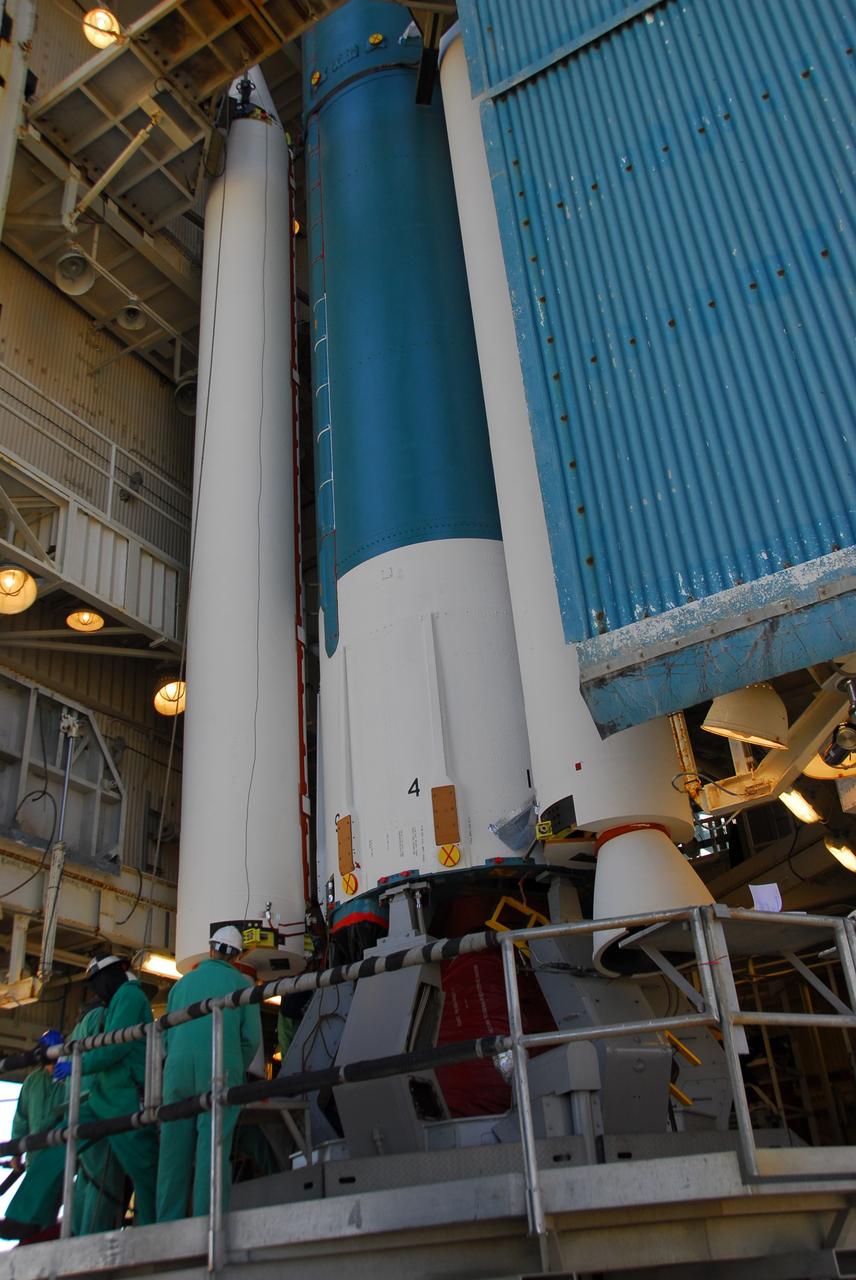
VANDENBERG AIR FORCE BASE, Calif. --At Vandenberg Air Force Base in California, United Launch Alliance technicians finish installing one of three Delta II solid rocket motors on the pad at Space Launch Complex-2 West (SLC-2W). A second motor was installed earlier in the morning. Scheduled to launch in June, the Delta II rocket will carry NASA's Aquarius satellite into low Earth orbit. Aquarius' mission will be to provide monthly maps of global changes in sea surface salinity. By measuring ocean salinity from space, Aquarius will provide new insights into how the massive natural exchange of freshwater between the ocean, atmosphere and sea ice influences ocean circulation, weather and climate. Also going up with the satellite are optical and thermal cameras, a microwave radiometer and the SAC-D spacecraft, which were developed with the help of institutions in Italy, France, Canada and Argentina. Photo credit: VAFB/30th Space Wing
A pair of weather instruments built at NASA's Jet Propulsion Laboratory in Southern California captured images of Hurricane Franklin as the Category 4 storm moved off the East Coast of the United States on Aug. 29, 2023. COWVR (short for Compact Ocean Wind Vector Radiometer) and TEMPEST (Temporal Experiment for Storms and Tropical Systems) observe the planet's atmosphere and surface from aboard the International Space Station, which passed in low Earth orbit over the storm at about 9:58 a.m. EDT. This image combines microwave emissions measurements from both COWVR and TEMPEST. White sections indicate the presence of clouds. Green portions indicate rain. Yellow, red, and black indicate where air and water vapor were moving most vigorously. Franklin's center is seen about 700 miles (1,127 kilometers) east of Jacksonville, Florida, over the Atlantic Ocean. https://photojournal.jpl.nasa.gov/catalog/PIA25870
VANDENBERG AIR FORCE BASE, Calif. -- The Space Launch Complex-2 (SLC-2) service tower at Vandenberg Air Force Base in California is moved to allow United Launch Alliance technicians to hoist into position the second stage of the Delta II rocket that will carry NASA's Aquarius satellite into low Earth orbit. Scheduled to launch in June, Aquarius' mission will be to provide monthly maps of global changes in sea surface salinity. By measuring ocean salinity from space, Aquarius will provide new insights into how the massive natural exchange of freshwater between the ocean, atmosphere and sea ice influences ocean circulation, weather and climate. Also going up with the satellite are optical and thermal cameras, a microwave radiometer and the SAC-D spacecraft, which were developed with the help of institutions in Italy, France, Canada and Argentina. Photo credit: VAFB/30th Space Wing
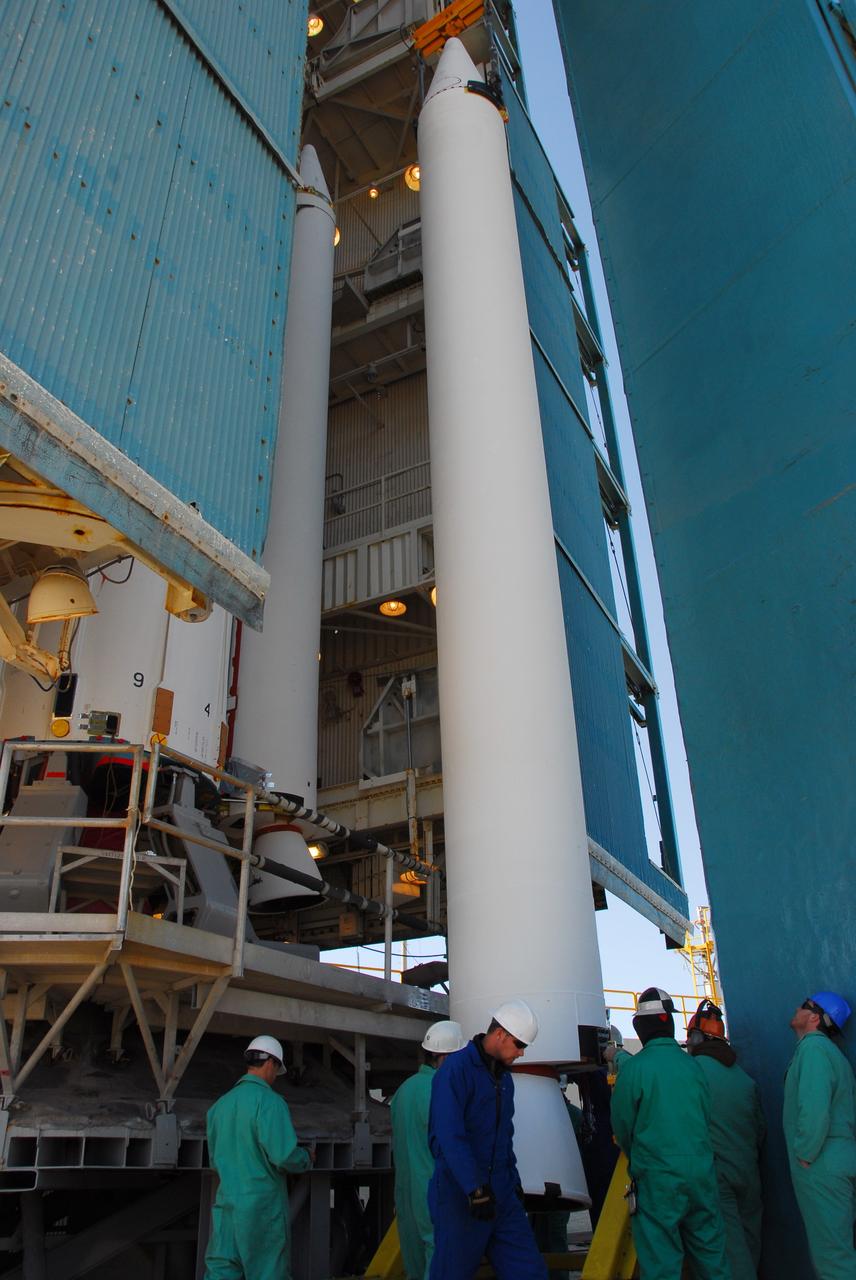
VANDENBERG AIR FORCE BASE, Calif. --At Vandenberg Air Force Base in California, a crane raises one of three United Launch Alliance Delta II solid rocket motors on the pad at Space Launch Complex-2 West (SLC-2W). A second motor was installed earlier in the morning. Scheduled to launch in June, the Delta II rocket will carry NASA's Aquarius satellite into low Earth orbit. Aquarius' mission will be to provide monthly maps of global changes in sea surface salinity. By measuring ocean salinity from space, Aquarius will provide new insights into how the massive natural exchange of freshwater between the ocean, atmosphere and sea ice influences ocean circulation, weather and climate. Also going up with the satellite are optical and thermal cameras, a microwave radiometer and the SAC-D spacecraft, which were developed with the help of institutions in Italy, France, Canada and Argentina. Photo credit: VAFB/30th Space Wing
VANDENBERG AIR FORCE BASE, Calif. --As the sun rises over Vandenberg Air Force Base in California, United Launch Alliance technicians prepare to raise one of three Delta II solid rocket motors on the pad at Space Launch Complex-2 West (SLC-2W). Scheduled to launch in June, the Delta II rocket will carry NASA's Aquarius satellite into low Earth orbit. Aquarius' mission will be to provide monthly maps of global changes in sea surface salinity. By measuring ocean salinity from space, Aquarius will provide new insights into how the massive natural exchange of freshwater between the ocean, atmosphere and sea ice influences ocean circulation, weather and climate. Also going up with the satellite are optical and thermal cameras, a microwave radiometer and the SAC-D spacecraft, which were developed with the help of institutions in Italy, France, Canada and Argentina. Photo credit: VAFB/30th Space Wing

This synthetic-aperture radar (SAR) image was obtained by NASA's Cassini spacecraft on July 25, 2016, during its "T-121" pass over Titan's southern latitudes. The image shows an area nicknamed the "Xanadu annex" by members of the Cassini radar team, earlier in the mission. This area had not been imaged by until now, but measurements of its brightness temperature from Cassini's microwave radiometer were quite similar to that of the large region on Titan named Xanadu (see PIA20713), which lies just to the north. Cassini's radiometer is essentially a very sensitive thermometer, and brightness temperature is a measure of the intensity of microwave radiation received from a feature by the instrument. Radar team members predicted at the time that, if this area were ever imaged, it would be similar in appearance to Xanadu. That earlier hunch appears to have been borne out, as features in this scene bear a strong similarity to the mountainous terrains Cassini's radar has imaged in Xanadu. Xanadu -- and now perhaps its annex -- remains something of a mystery. First imaged in 1994 by the Hubble Space Telescope (just three years before Cassini's launch from Earth), Xanadu was the first surface feature to be recognized on Titan. Once thought to be a raised plateau, the region is now understood to be slightly tilted, but not higher than, the darker surrounding regions. It blocks the formation of sand dunes, which otherwise extend all the way around Titan at its equator. The area shown here is illuminated by the radar from the bottom at a 30-degree incidence angle. It measures about 155 by 310 miles (250 by 500 kilometers) and is centered at about 30 degrees south latitude, 60 degrees west longitude. http://photojournal.jpl.nasa.gov/catalog/PIA20712
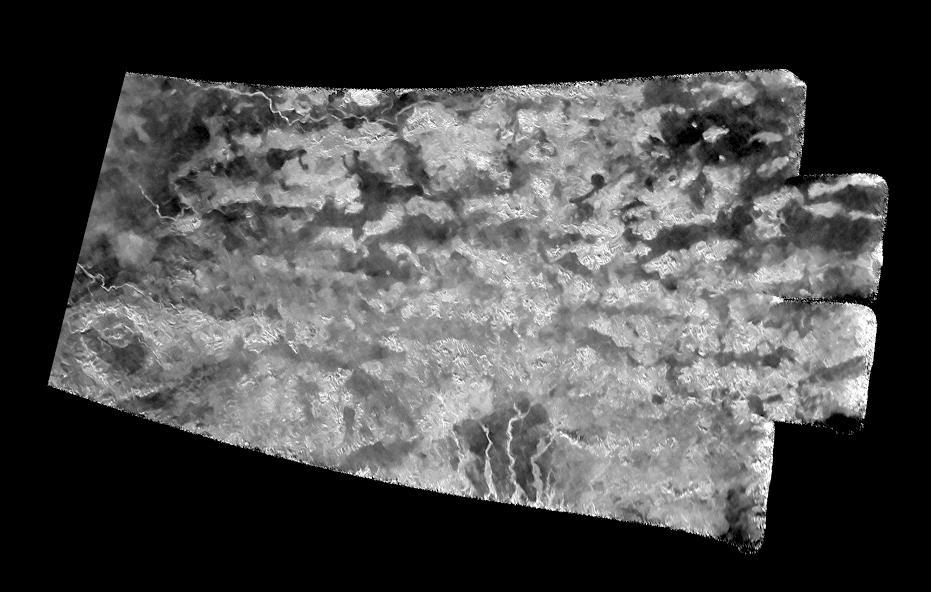
This synthetic-aperture radar (SAR) image was obtained by NASA's Cassini spacecraft on July 25, 2016, during its 'T-121' pass over Titan's southern latitudes. The improved contrast provided by the denoising algorithm helps river channels (at bottom and upper left) stand out, as well as the crater-like feature at left. The image shows an area nicknamed the "Xanadu annex" by members of the Cassini radar team, earlier in the mission. This area had not been imaged by Cassini's radar until now, but measurements of its brightness temperature from Cassini's microwave radiometer were quite similar to that of the large region on Titan named Xanadu. Cassini's radiometer is essentially a very sensitive thermometer, and brightness temperature is a measure of the intensity of microwave radiation received from a feature by the instrument. Radar team members predicted at the time that, if this area were ever imaged, it would be similar in appearance to Xanadu, which lies just to the north. That earlier hunch appears to have been borne out, as features in this scene bear a strong similarity to the mountainous terrains Cassini's radar has imaged in Xanadu. Xanadu -- and now perhaps its annex -- remains something of a mystery. First imaged in 1994 by the Hubble Space Telescope (just three years before Cassini's launch from Earth), Xanadu was the first surface feature to be recognized on Titan. Once thought to be a raised plateau, the region is now understood to be slightly tilted, but not higher than, the darker surrounding regions. It blocks the formation of sand dunes, which otherwise extend all the way around Titan at its equator. The image was taken by the Cassini Synthetic Aperture radar (SAR) on July 25, 2016 during the mission's 122nd targeted Titan encounter. The image has been modified by the denoising method described in A. Lucas, JGR:Planets (2014). http://photojournal.jpl.nasa.gov/catalog/PIA20714
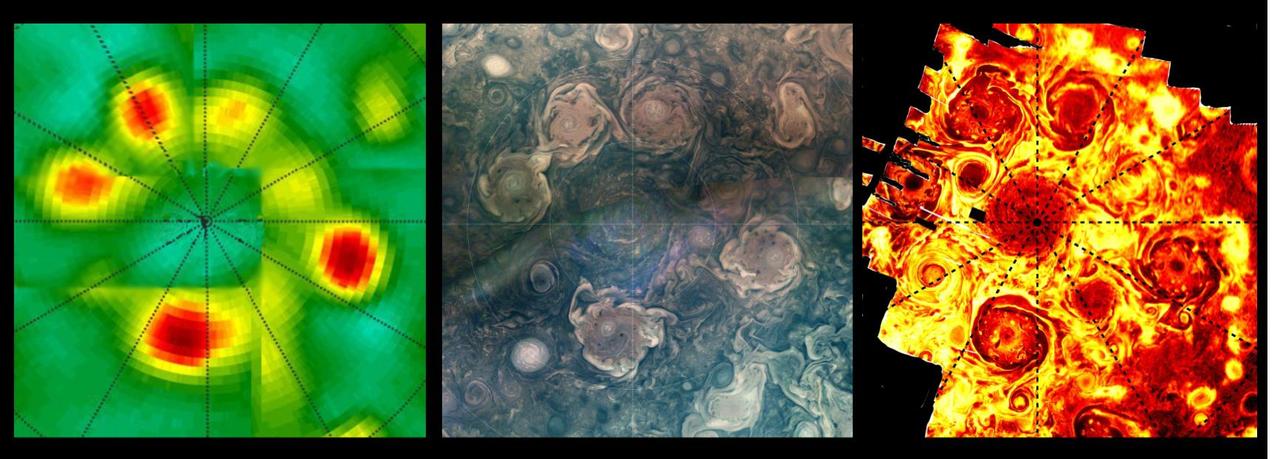
This composite shows views of Jupiter's northern polar cyclones in three different wavelengths of light – microwave, visible, and ultraviolet – as captured by NASA's Juno mission. These differing perspectives allowed Juno scientists to deduce that all Jovian polar cyclones are not created equal. The infrared image, on the far right, was derived from data collected by the spacecraft's Jovian Infrared Auroral Mapper (JIRAM) instrument. The composite image at center was collected by the JunoCam visible-light imager. Though taken with separate instruments that record different wavelengths of light, both images depict Jupiter's northern polar storms as well defined and of similar size. The data on the left, collected by Juno's Microwave Radiometer (MWR), shows the polar storms in another light. MWR enables Juno to see deep into Jupiter by recording the planet's microwave emissions. In the MWR graphic, the polar storms at the 4 and 6 o'clock positions have bright microwave signatures, indicating they extend well beneath the cloud tops, at least 62 miles (100 kilometers) below. The size of those two storms is comparable to what's found in the visible light and infrared light images, but the other storms, as seen through MWR, have a notably reduced emissions intensity. Another disparity in the MWR graphic versus visible light and infrared can be seen in how the central cyclone is depicted by the data. In the infrared and visible light images, the central cyclone is evident; with MWR data, it all but disappears. This disparity indicates that the central cyclone's subsurface structure must be very different from the surrounding storms. JIRAM "sees" in infrared light not visible to the human eye. It captures the infrared glow from the heat of Jupiter's upper atmosphere, probing the top of the weather layer, and gaps in the clouds allow glimpses as deep as 30 to 45 miles (50 to 70 kilometers) below Jupiter's cloud tops. JunoCam's visible light images catch reflected sunlight, with a view that is very similar to what a human eye would see if a person could ride along with Juno. JunoCam's raw images are available for the public to peruse and process into image products at https://missionjuno.swri.edu/junocam/processing. Like JIRAM, the MWR instrument records the glow of Jupiter's atmosphere, but the brightness results from the temperature at depths below anything achievable with previous spacecraft or Earth-based observations. The MWR's six radio channels peer progressively deeper below the visible cloud tops, with a range from the top of the clouds (for the highest frequency channel) to 200 miles (320 kilometers) or more below (for the lowest frequency channel). https://photojournal.jpl.nasa.gov/catalog/PIA26295
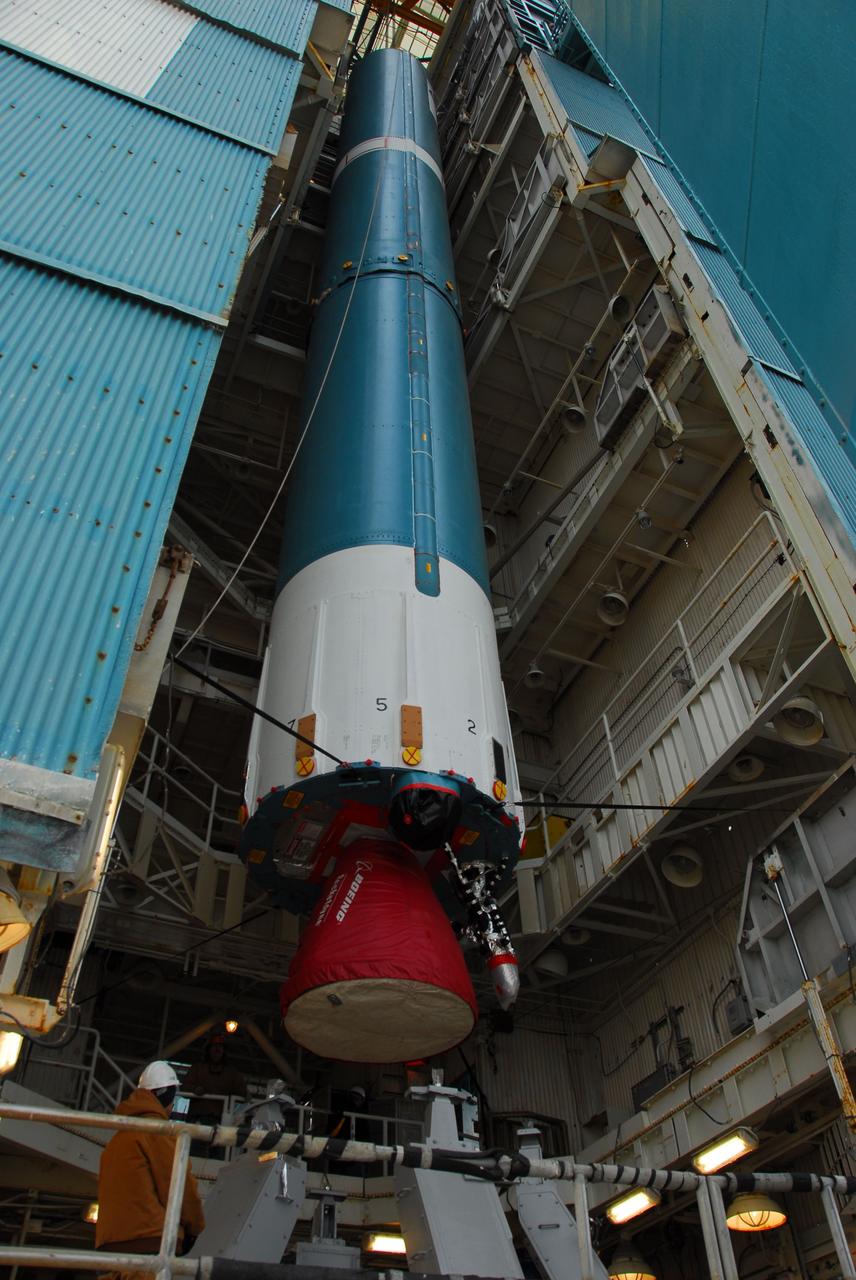
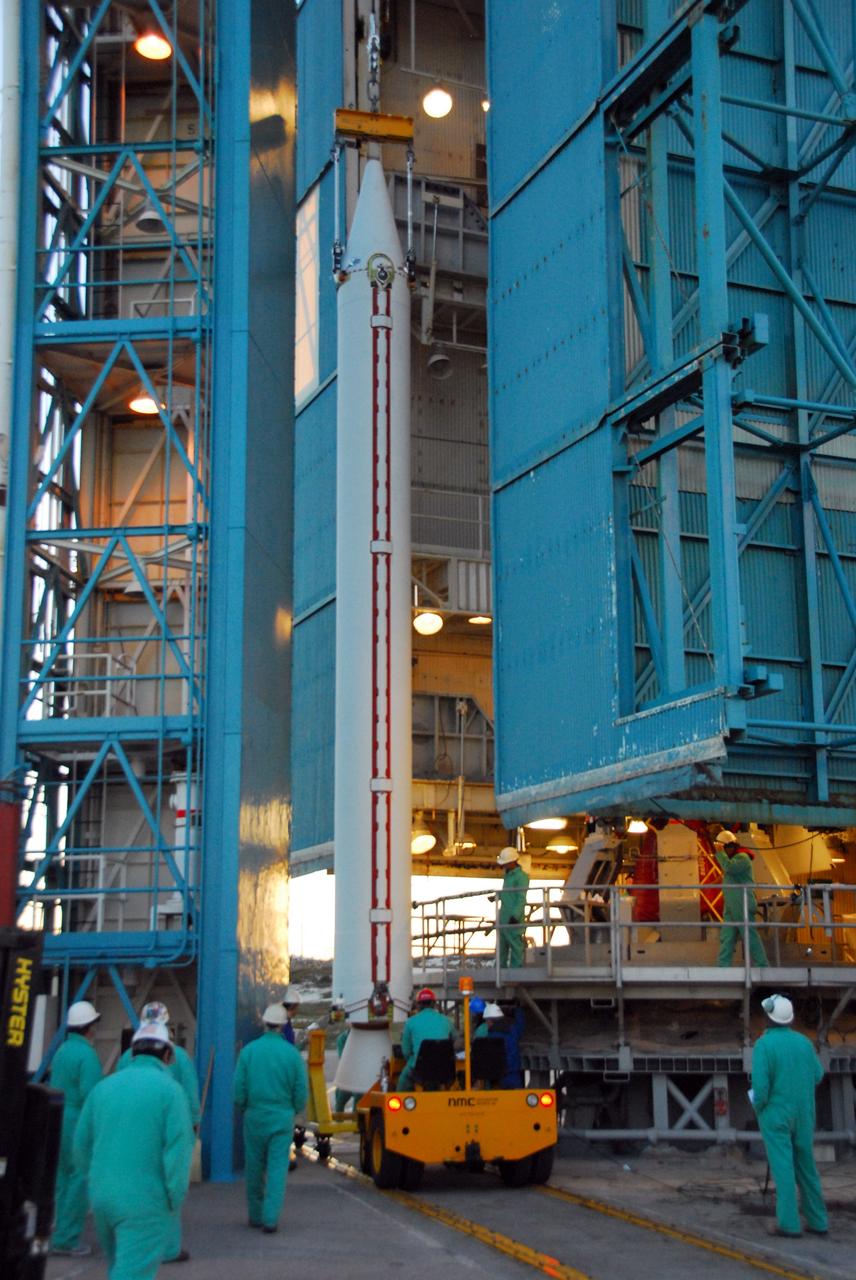
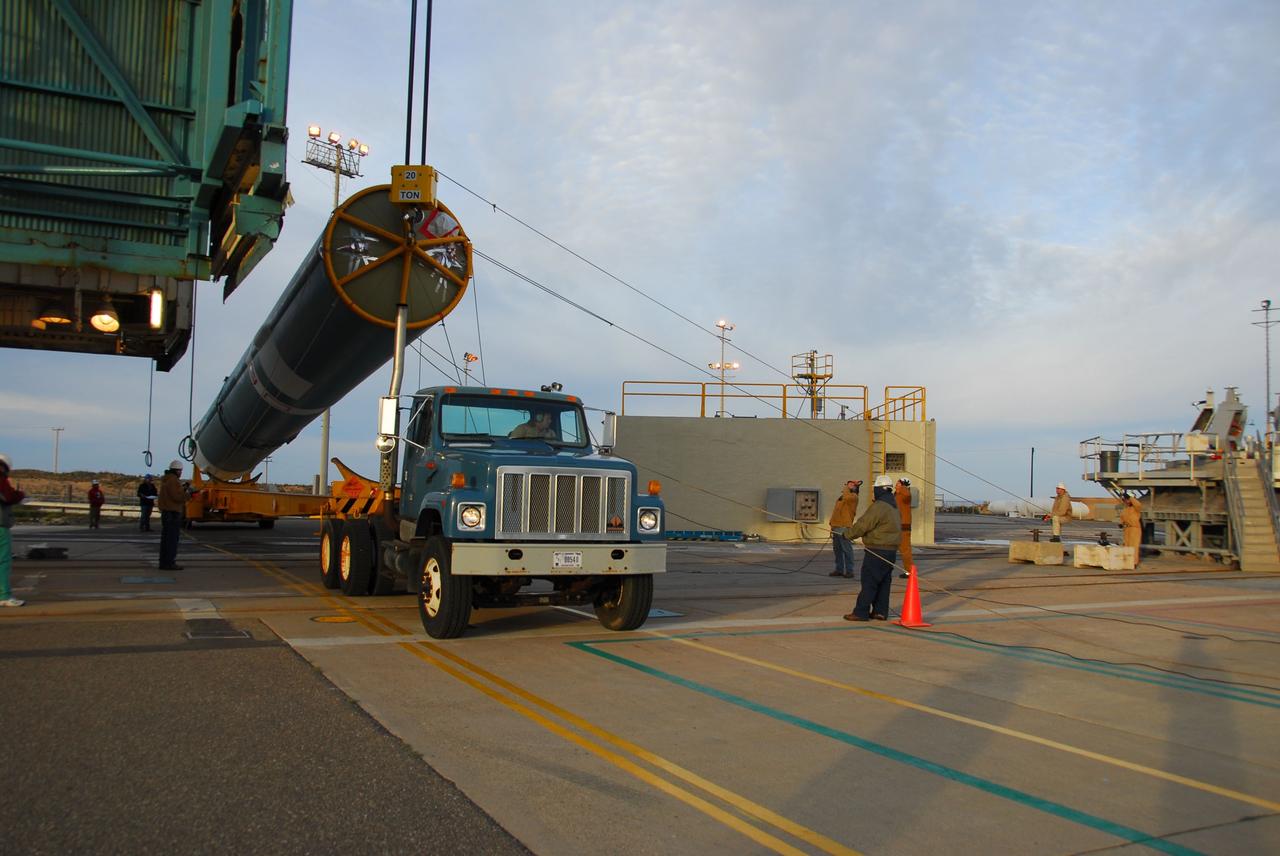
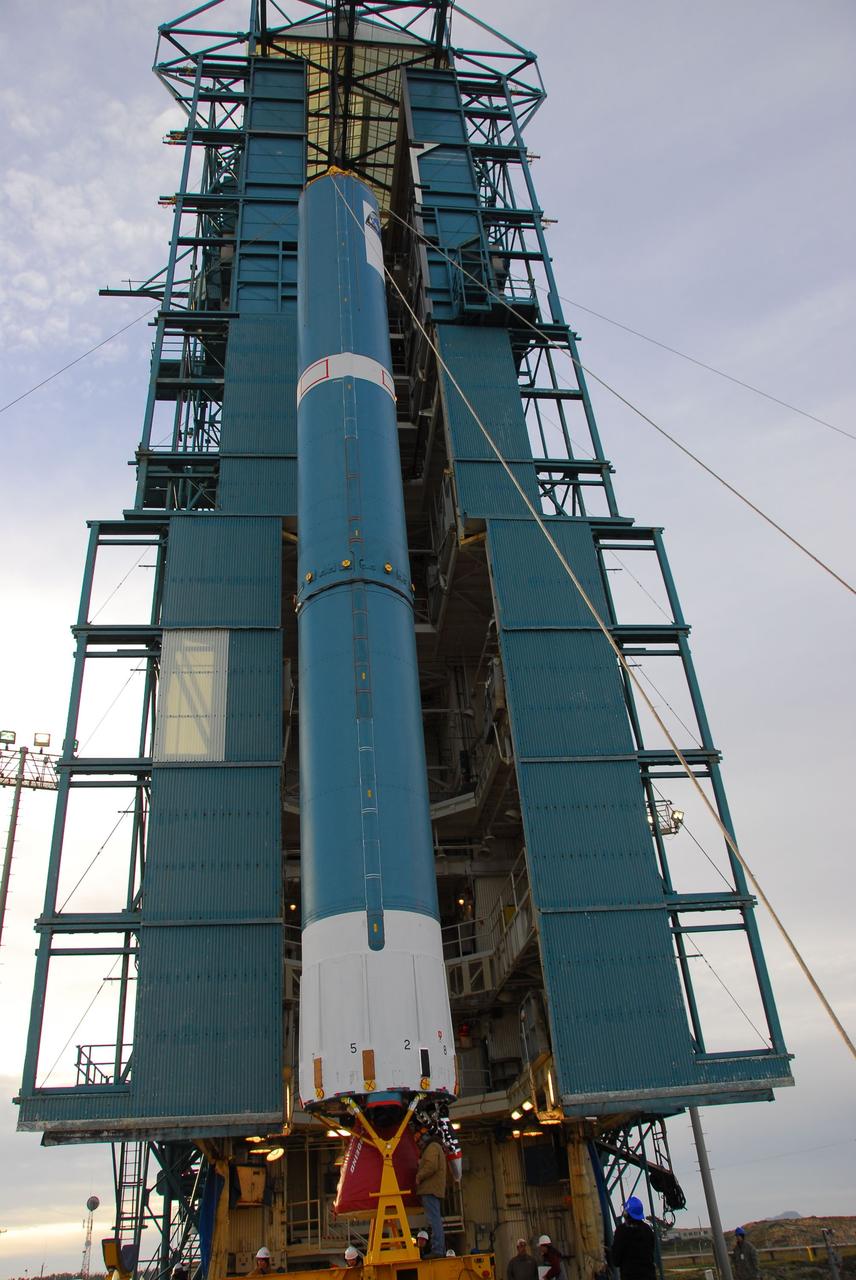
VANDENBERG AIR FORCE BASE, Calif. -- The first stage of the Delta II rocket that will carry NASA's Aquarius satellite into low Earth orbit is raised onto the launch pad at Vandenberg Air Force Base's Space Launch Complex-2 (SLC-2) in California. While the Delta II rocket is stacked on SLC-2, teams for NASA's Glory spacecraft and Orbital Sciences Taurus XL rocket are in launch preparation mode at Vandenberg's nearby Space Launch Complex 576-E. Scheduled to launch in June, Aquarius' mission will be to provide monthly maps of global changes in sea surface salinity. By measuring ocean salinity from space, Aquarius will provide new insights into how the massive natural exchange of freshwater between the ocean, atmosphere and sea ice influences ocean circulation, weather and climate. Also going up with the satellite are optical and thermal cameras, a microwave radiometer and the SAC-D spacecraft, which were developed with the help of institutions in Italy, France, Canada and Argentina. Photo credit: NASA/VAFB
VANDENBERG AIR FORCE BASE, Calif. -- The first stage of the Delta II rocket that will carry NASA's Aquarius satellite into low Earth orbit is raised onto the launch pad at Vandenberg Air Force Base's Space Launch Complex-2 (SLC-2) in California. While the Delta II rocket is stacked on SLC-2, teams for NASA's Glory spacecraft and Orbital Sciences Taurus XL rocket are in launch preparation mode at Vandenberg's nearby Space Launch Complex 576-E. Scheduled to launch in June, Aquarius' mission will be to provide monthly maps of global changes in sea surface salinity. By measuring ocean salinity from space, Aquarius will provide new insights into how the massive natural exchange of freshwater between the ocean, atmosphere and sea ice influences ocean circulation, weather and climate. Also going up with the satellite are optical and thermal cameras, a microwave radiometer and the SAC-D spacecraft, which were developed with the help of institutions in Italy, France, Canada and Argentina. Photo credit: NASA/VAFB

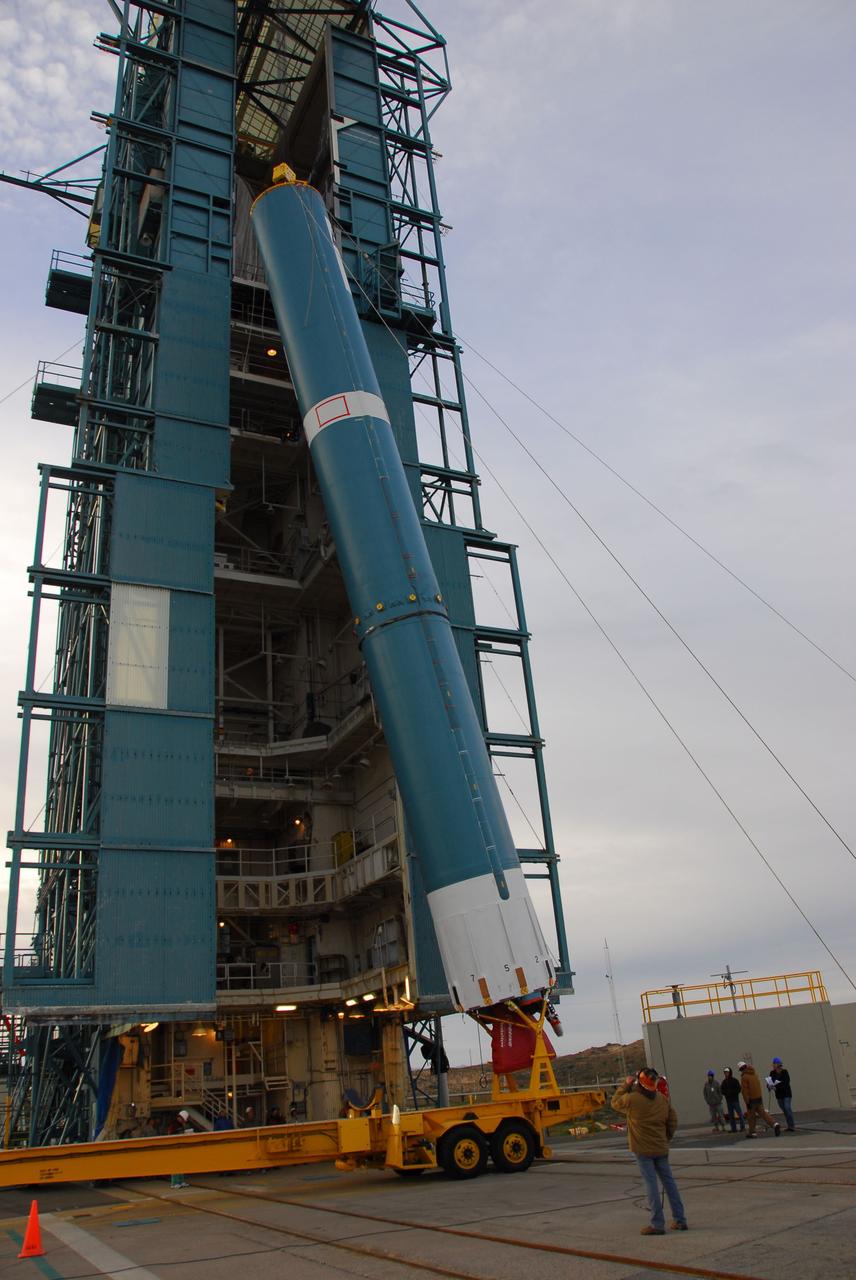
VANDENBERG AIR FORCE BASE, Calif. -- The first stage of the Delta II rocket that will carry NASA's Aquarius satellite into low Earth orbit arrives to the launch pad at Vandenberg Air Force Base's Space Launch Complex-2 (SLC-2) in California. While the Delta II rocket is stacked on SLC-2, teams for NASA's Glory spacecraft and Orbital Sciences Taurus XL rocket are in launch preparation mode at Vandenberg's nearby Space Launch Complex 576-E. Scheduled to launch in June, Aquarius' mission will be to provide monthly maps of global changes in sea surface salinity. By measuring ocean salinity from space, Aquarius will provide new insights into how the massive natural exchange of freshwater between the ocean, atmosphere and sea ice influences ocean circulation, weather and climate. Also going up with the satellite are optical and thermal cameras, a microwave radiometer and the SAC-D spacecraft, which were developed with the help of institutions in Italy, France, Canada and Argentina. Photo credit: NASA/VAFB
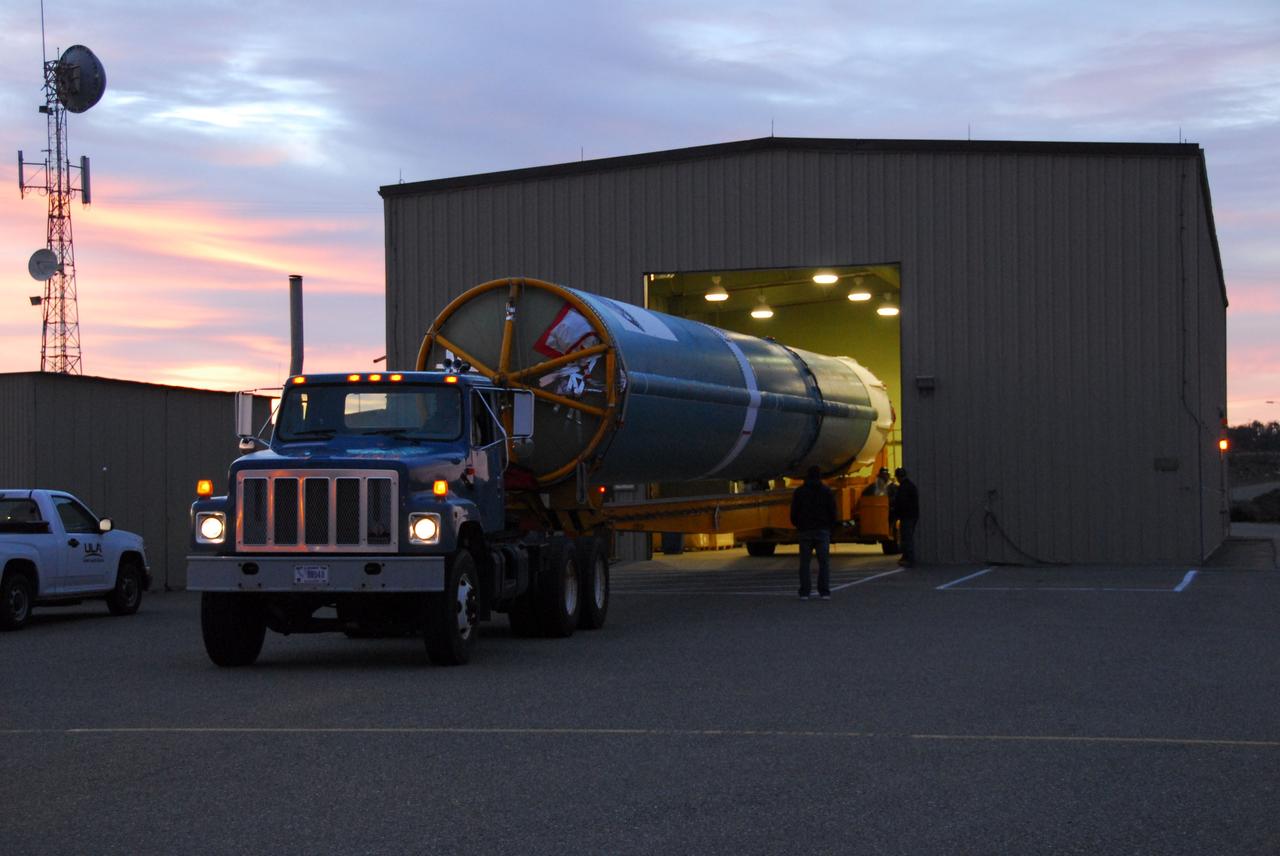
VANDENBERG AIR FORCE BASE, Calif. -- As the sun rises over Vandenberg Air Force Base in California, the first stage of the Delta II rocket that will carry NASA's Aquarius satellite into low Earth orbit is on its way to Space Launch Complex-2 (SLC-2). While the Delta II rocket is stacked on SLC-2, teams for NASA's Glory spacecraft and Orbital Sciences Taurus XL rocket are in launch preparation mode at Vandenberg's nearby Space Launch Complex 576-E. Scheduled to launch in June, Aquarius' mission will be to provide monthly maps of global changes in sea surface salinity. By measuring ocean salinity from space, Aquarius will provide new insights into how the massive natural exchange of freshwater between the ocean, atmosphere and sea ice influences ocean circulation, weather and climate. Also going up with the satellite are optical and thermal cameras, a microwave radiometer and the SAC-D spacecraft, which were developed with the help of institutions in Italy, France, Canada and Argentina. Photo credit: NASA/VAFB
VANDENBERG AIR FORCE BASE, Calif. -- The first stage of the Delta II rocket that will carry NASA's Aquarius satellite into low Earth orbit is raised onto the launch pad at Vandenberg Air Force Base's Space Launch Complex-2 (SLC-2) in California. While the Delta II rocket is stacked on SLC-2, teams for NASA's Glory spacecraft and Orbital Sciences Taurus XL rocket are in launch preparation mode at Vandenberg's nearby Space Launch Complex 576-E. Scheduled to launch in June, Aquarius' mission will be to provide monthly maps of global changes in sea surface salinity. By measuring ocean salinity from space, Aquarius will provide new insights into how the massive natural exchange of freshwater between the ocean, atmosphere and sea ice influences ocean circulation, weather and climate. Also going up with the satellite are optical and thermal cameras, a microwave radiometer and the SAC-D spacecraft, which were developed with the help of institutions in Italy, France, Canada and Argentina. Photo credit: NASA/VAFB
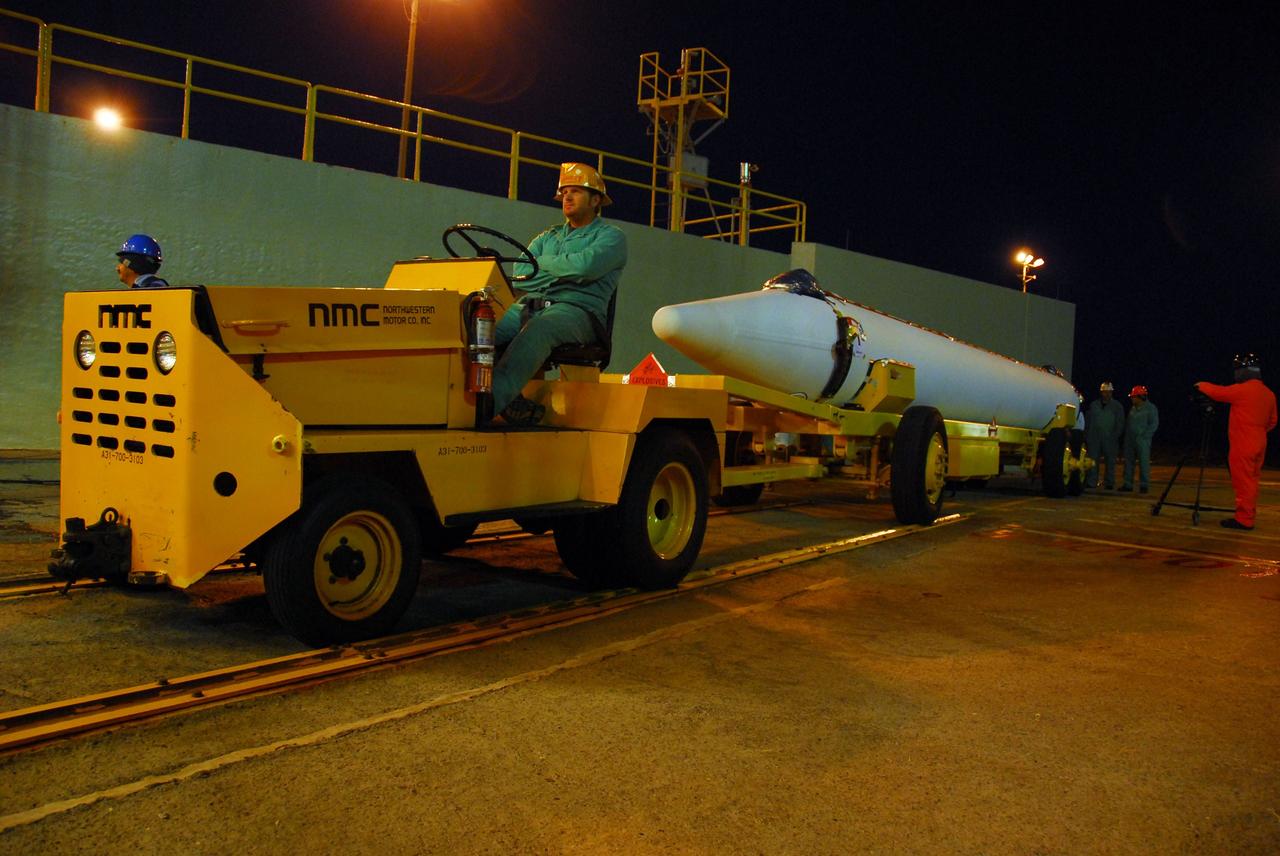
VANDENBERG AIR FORCE BASE, Calif. --Before the sun rises over Vandenberg Air Force Base in California, United Launch Alliance technicians prepare to move one of three Delta II solid rocket motors from the solid motor facility to Space Launch Complex-2 West (SLC-2W) atop a tug. ULA technician Eric Chambless is in the tug's driver seat. Scheduled to launch in June, the Delta II rocket will carry NASA's Aquarius satellite into low Earth orbit. Aquarius' mission will be to provide monthly maps of global changes in sea surface salinity. By measuring ocean salinity from space, Aquarius will provide new insights into how the massive natural exchange of freshwater between the ocean, atmosphere and sea ice influences ocean circulation, weather and climate. Also going up with the satellite are optical and thermal cameras, a microwave radiometer and the SAC-D spacecraft, which were developed with the help of institutions in Italy, France, Canada and Argentina. Photo credit: VAFB/30th Space Wing
VANDENBERG AIR FORCE BASE, Calif. -- The first stage of the Delta II rocket that will carry NASA's Aquarius satellite into low Earth orbit is raised onto the launch pad at Vandenberg Air Force Base's Space Launch Complex-2 (SLC-2) in California. While the Delta II rocket is stacked on SLC-2, teams for NASA's Glory spacecraft and Orbital Sciences Taurus XL rocket are in launch preparation mode at Vandenberg's nearby Space Launch Complex 576-E. Scheduled to launch in June, Aquarius' mission will be to provide monthly maps of global changes in sea surface salinity. By measuring ocean salinity from space, Aquarius will provide new insights into how the massive natural exchange of freshwater between the ocean, atmosphere and sea ice influences ocean circulation, weather and climate. Also going up with the satellite are optical and thermal cameras, a microwave radiometer and the SAC-D spacecraft, which were developed with the help of institutions in Italy, France, Canada and Argentina. Photo credit: NASA/VAFB
VANDENBERG AIR FORCE BASE, Calif. -- Technicians guide the first stage of the Delta II rocket that will carry NASA's Aquarius satellite into low Earth orbit onto the launch pad at Vandenberg Air Force Base's Space Launch Complex-2 (SLC-2) in California. While the Delta II rocket is stacked on SLC-2, teams for NASA's Glory spacecraft and Orbital Sciences Taurus XL rocket are in launch preparation mode at Vandenberg's nearby Space Launch Complex 576-E. Scheduled to launch in June, Aquarius' mission will be to provide monthly maps of global changes in sea surface salinity. By measuring ocean salinity from space, Aquarius will provide new insights into how the massive natural exchange of freshwater between the ocean, atmosphere and sea ice influences ocean circulation, weather and climate. Also going up with the satellite are optical and thermal cameras, a microwave radiometer and the SAC-D spacecraft, which were developed with the help of institutions in Italy, France, Canada and Argentina. Photo credit: NASA/VAFB
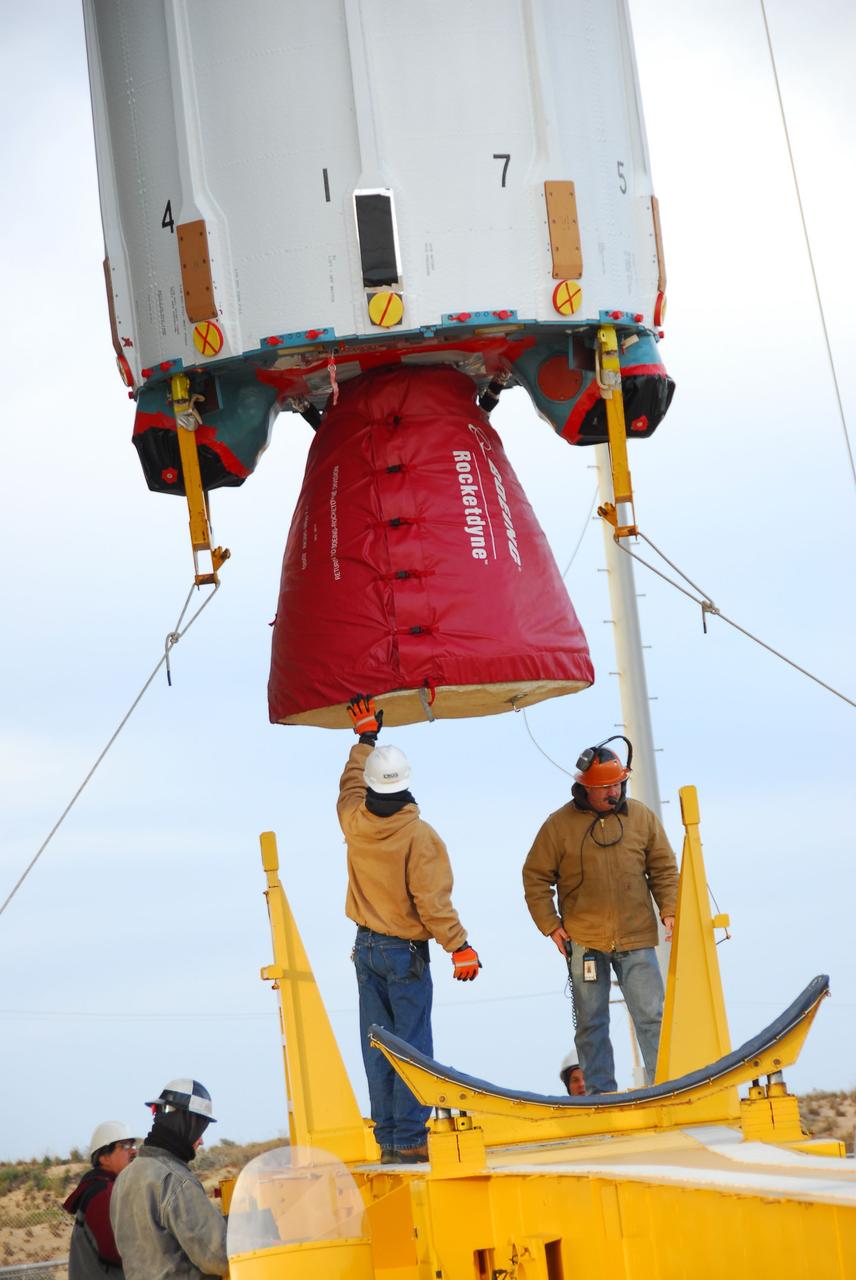
VANDENBERG AIR FORCE BASE, Calif. -- Technicians guide the first stage of the Delta II rocket that will carry NASA's Aquarius satellite into low Earth orbit onto the launch pad at Vandenberg Air Force Base's Space Launch Complex-2 (SLC-2) in California. While the Delta II rocket is stacked on SLC-2, teams for NASA's Glory spacecraft and Orbital Sciences Taurus XL rocket are in launch preparation mode at Vandenberg's nearby Space Launch Complex 576-E. Scheduled to launch in June, Aquarius' mission will be to provide monthly maps of global changes in sea surface salinity. By measuring ocean salinity from space, Aquarius will provide new insights into how the massive natural exchange of freshwater between the ocean, atmosphere and sea ice influences ocean circulation, weather and climate. Also going up with the satellite are optical and thermal cameras, a microwave radiometer and the SAC-D spacecraft, which were developed with the help of institutions in Italy, France, Canada and Argentina. Photo credit: NASA/VAFB
VANDENBERG AIR FORCE BASE, Calif. -- The first stage of the Delta II rocket that will carry NASA's Aquarius satellite into low Earth orbit is raised onto the launch pad at Vandenberg Air Force Base's Space Launch Complex-2 (SLC-2) in California. While the Delta II rocket is stacked on SLC-2, teams for NASA's Glory spacecraft and Orbital Sciences Taurus XL rocket are in launch preparation mode at Vandenberg's nearby Space Launch Complex 576-E. Scheduled to launch in June, Aquarius' mission will be to provide monthly maps of global changes in sea surface salinity. By measuring ocean salinity from space, Aquarius will provide new insights into how the massive natural exchange of freshwater between the ocean, atmosphere and sea ice influences ocean circulation, weather and climate. Also going up with the satellite are optical and thermal cameras, a microwave radiometer and the SAC-D spacecraft, which were developed with the help of institutions in Italy, France, Canada and Argentina. Photo credit: NASA/VAFB
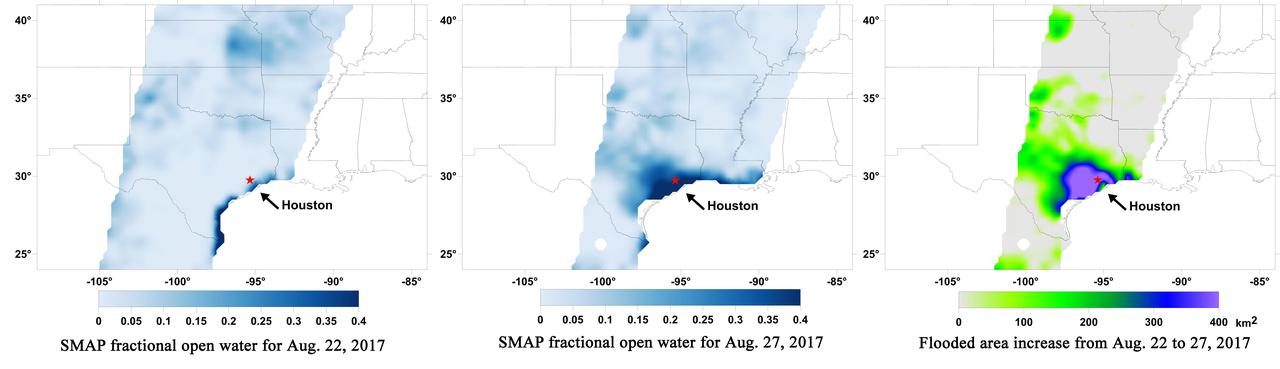
A new series of images generated with data from NASA's Soil Moisture Active Passive (SMAP) satellite illustrate the surface flooding caused by Hurricane Harvey from before its initial landfall through August 27, 2017. The SMAP observations detect the proportion of the ground covered by surface water within the satellite's field of view. The sequence of images depicts successive satellite orbital swath observations showing the surface water conditions on August 22, before Harvey's landfall (left), and then on Aug. 27, two days after landfall (middle). The resulting increase in surface flooding from record rainfall over the three-day period, shown at right, depicts regionally heavy flooding around the Houston metropolitan area. The hardest hit areas (blue and purple shades) cover more than 23,000 square miles (about 59,600 square kilometers) and indicate a more than 1,000-fold increase in surface water cover from rainfall-driven flooding. SMAP's low-frequency (L-band) microwave radiometer features enhanced capabilities for detecting surface water changes in nearly all weather conditions and under low-to-moderate vegetation cover. The satellite provides global coverage with one to three-day repeat sampling, which is well suited for monitoring dynamic inland waters around the world. https://photojournal.jpl.nasa.gov/catalog/PIA21930
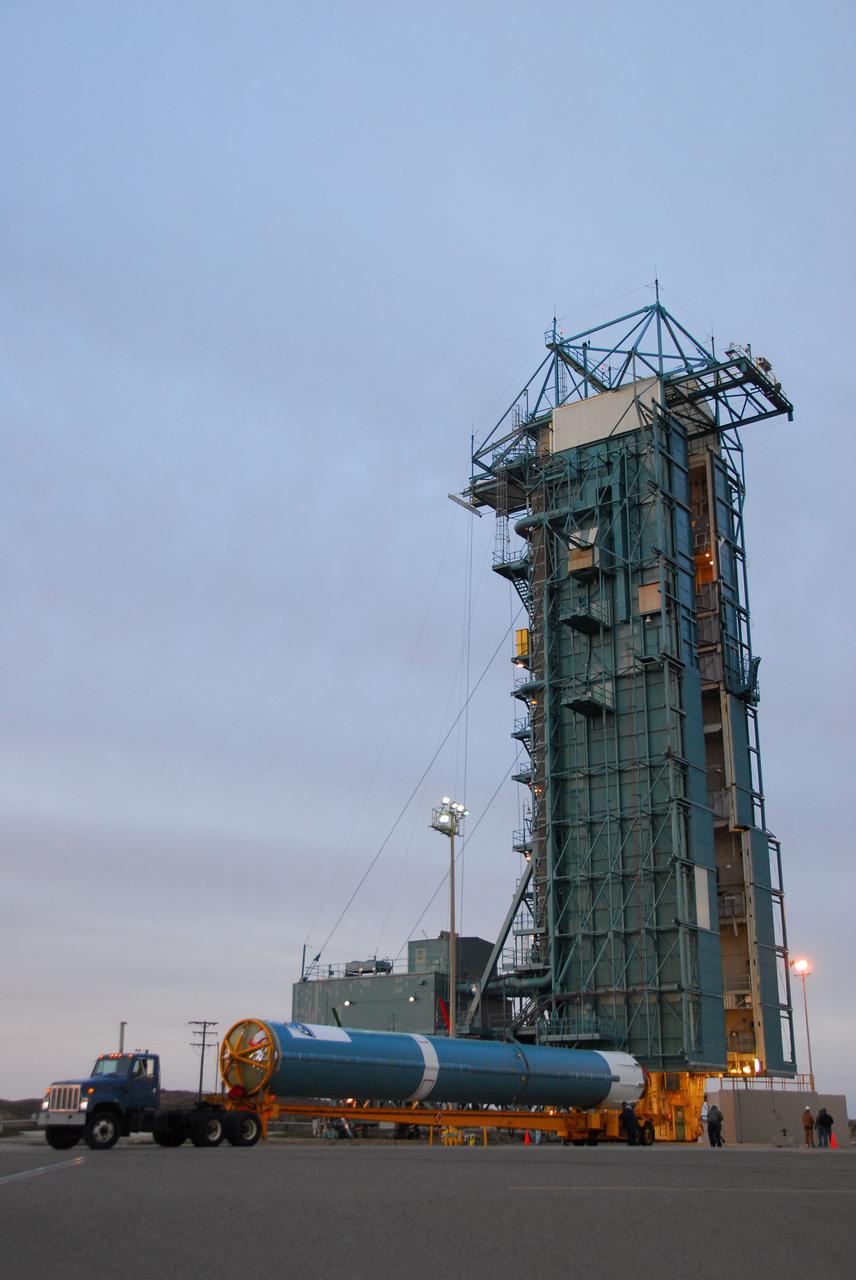
VANDENBERG AIR FORCE BASE, Calif. -- The first stage of the Delta II rocket that will carry NASA's Aquarius satellite into low Earth orbit arrives to the launch pad at Vandenberg Air Force Base's Space Launch Complex-2 (SLC-2) in California. While the Delta II rocket is stacked on SLC-2, teams for NASA's Glory spacecraft and Orbital Sciences Taurus XL rocket are in launch preparation mode at Vandenberg's nearby Space Launch Complex 576-E. Scheduled to launch in June, Aquarius' mission will be to provide monthly maps of global changes in sea surface salinity. By measuring ocean salinity from space, Aquarius will provide new insights into how the massive natural exchange of freshwater between the ocean, atmosphere and sea ice influences ocean circulation, weather and climate. Also going up with the satellite are optical and thermal cameras, a microwave radiometer and the SAC-D spacecraft, which were developed with the help of institutions in Italy, France, Canada and Argentina. Photo credit: NASA/VAFB
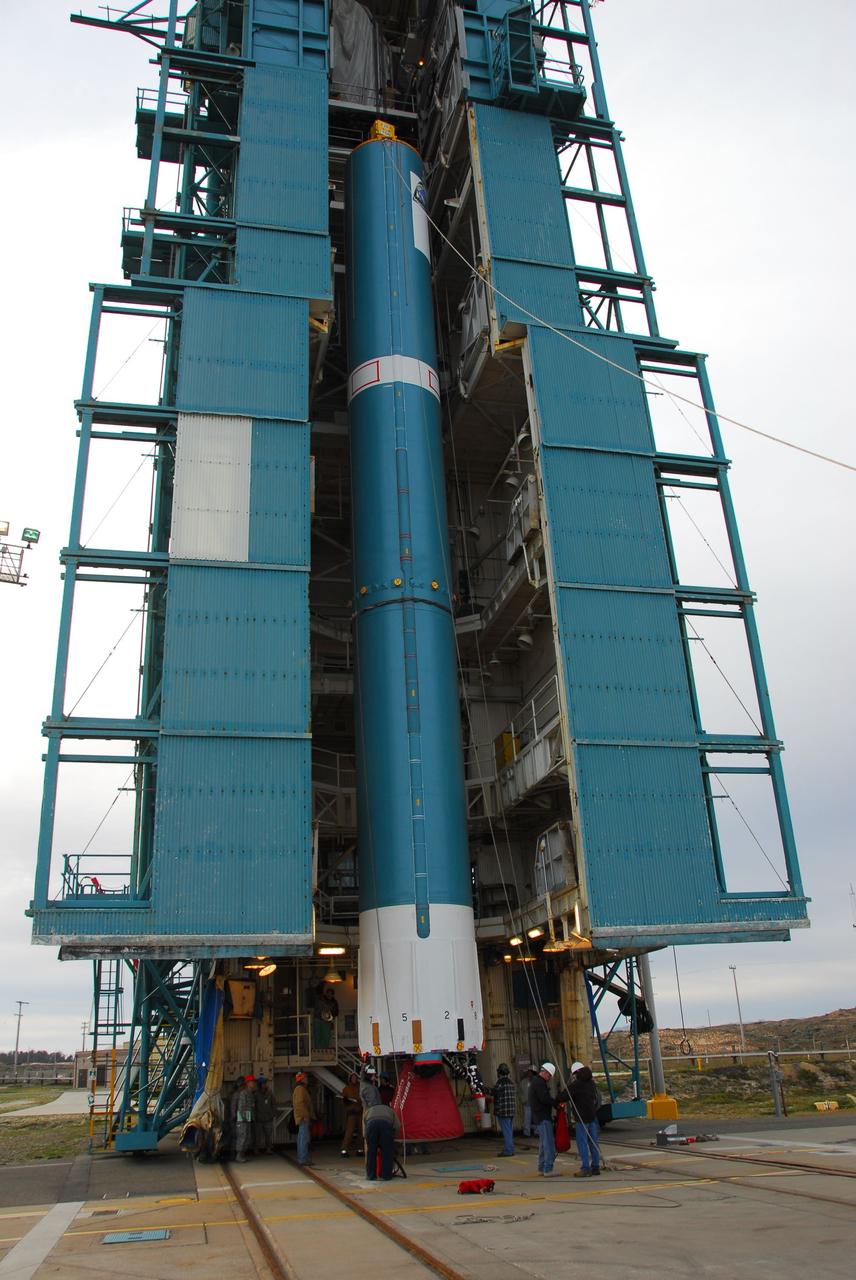
VANDENBERG AIR FORCE BASE, Calif. -- Technicians guide the first stage of the Delta II rocket that will carry NASA's Aquarius satellite into low Earth orbit onto the launch pad at Vandenberg Air Force Base's Space Launch Complex-2 (SLC-2) in California. While the Delta II rocket is stacked on SLC-2, teams for NASA's Glory spacecraft and Orbital Sciences Taurus XL rocket are in launch preparation mode at Vandenberg's nearby Space Launch Complex 576-E. Scheduled to launch in June, Aquarius' mission will be to provide monthly maps of global changes in sea surface salinity. By measuring ocean salinity from space, Aquarius will provide new insights into how the massive natural exchange of freshwater between the ocean, atmosphere and sea ice influences ocean circulation, weather and climate. Also going up with the satellite are optical and thermal cameras, a microwave radiometer and the SAC-D spacecraft, which were developed with the help of institutions in Italy, France, Canada and Argentina. Photo credit: NASA/VAFB
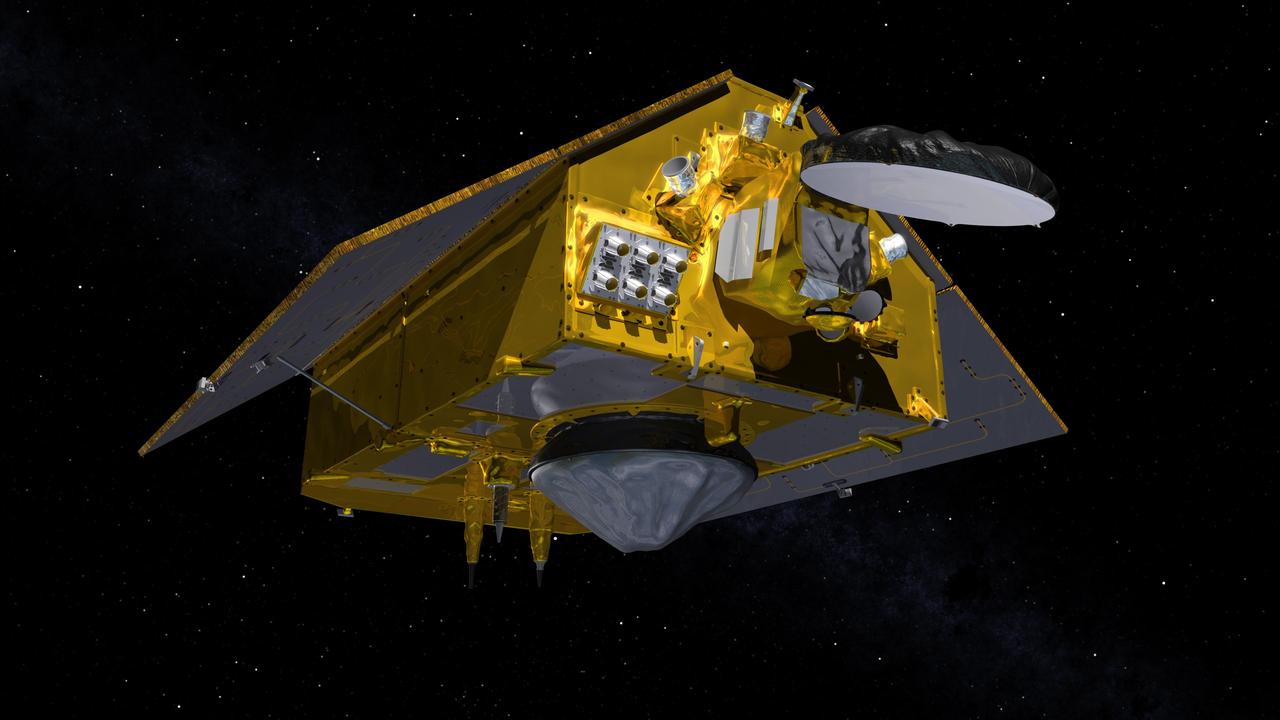
This illustration shows the front of the Sentinel-6 Michael Freilich spacecraft in orbit above Earth with its deployable solar panels extended. As the world's latest ocean-monitoring satellite, it is launching on Nov. 10, 2020, to collect the most accurate data yet on global sea level and how our oceans are rising in response to climate change. The mission will also collect precise data of atmospheric temperature and humidity that will help improve weather forecasts and climate models. The conelike instrument on the bottom (Earth-facing side) of the spacecraft is the satellite's Poseidon-4 radar altimeter. The disklike instrument at the front of the spacecraft is the Advanced Microwave Radiometer (AMR-C). Both instruments will be used together to measure ocean surface height. The gray rectangle with six cones attached at the front-left of the spacecraft is part of the Global Navigation Satellite System - Radio Occultation (GNSS-RO) instrument. Sentinel-6 Michael Freilich extends the near-30-year record of satellite measurements of sea level initiated by the U.S.-European TOPEX/Poseidon mission in 1992 and that continued with the Jason-1, 2, and 3 series of sea level observation satellites. Launched in 2016, Jason-3 is currently providing data. The satellite is named after Dr. Michael Freilich, the former director of NASA's Earth Science Division and an instrumental figure in advancing ocean observations from space. Sentinel-6 Michael Freilich is one of two identical spacecraft that compose the Sentinel-6/Jason-CS (Continuity of Service) mission developed in partnership with ESA (the European Space Agency). Other partners include the National Oceanic and Atmospheric Administration (NOAA), the intergovernmental European Organisation for the Exploitation of Meteorological Satellites (EUMETSAT), and France's National Centre for Space Studies (CNES). ESA is developing the new Sentinel family of missions to support the operational needs of the European Union's Copernicus program, the EU's Earth observation program managed by the European Commission. The spacecraft's twin, Sentinel-6B, will launch in 2025. https://photojournal.jpl.nasa.gov/catalog/PIA24106
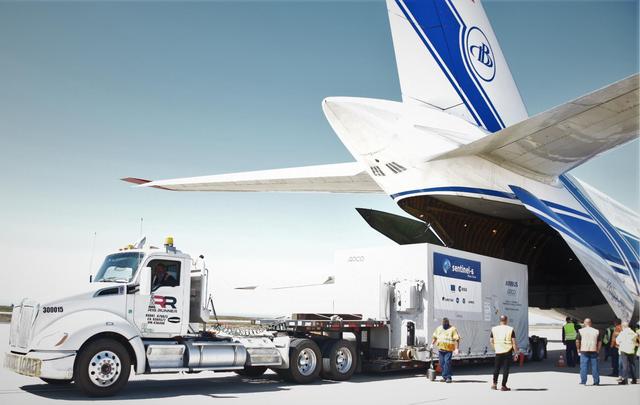
A shipping container containing the Sentinel-6 Michael Freilich satellite is transported on a truck to the SpaceX payload processing facility at Vandenberg Air Force Base after arriving in California on Sept. 24, 2020. An Antonov aircraft carrying the spacecraft arrived at around 10:40 a.m. PDT (1:40 p.m. EDT) after a two-day journey from an IABG engineering facility near Munich, Germany. The ocean-monitoring satellite will undergo prelaunch tests before its scheduled launch on Nov. 10, 2020. Sentinel-6 Michael Freilich will begin a five-and-a-half-year mission to collect sea surface height measurements down to the centimeter for 90% of the world's oceans. The satellite is named after Dr. Michael Freilich, the former director of NASA's Earth Science Division and an instrumental figure in advancing ocean observations from space. Sentinel-6 Michael Freilich is one of two identical spacecraft that compose the Sentinel-6/Jason-CS (Continuity of Service) mission developed in partnership with ESA (the European Space Agency). ESA is developing the new Sentinel family of missions to support the operational needs of the European Union's Copernicus program, the EU's Earth observation program managed by the European Commission. The spacecraft's twin, Sentinel-6B, will launch in 2025. Sentinel-6/Jason-CS is being jointly developed by ESA, the European Organisation for the Exploitation of Meteorological Satellites (EUMETSAT), NASA, and the National Oceanic and Atmospheric Administration, with funding support from the European Commission and technical support from France's National Centre for Space Studies (CNES). JPL, a division of Caltech in Pasadena, is contributing three science instruments for each Sentinel-6 satellite: the Advanced Microwave Radiometer, the Global Navigation Satellite System - Radio Occultation, and the Laser Retroreflector Array. NASA is also contributing launch services, ground systems supporting operation of the NASA science instruments, the science data processors for two of these instruments, and support for the international Ocean Surface Topography Science Team. https://photojournal.jpl.nasa.gov/catalog/PIA24104
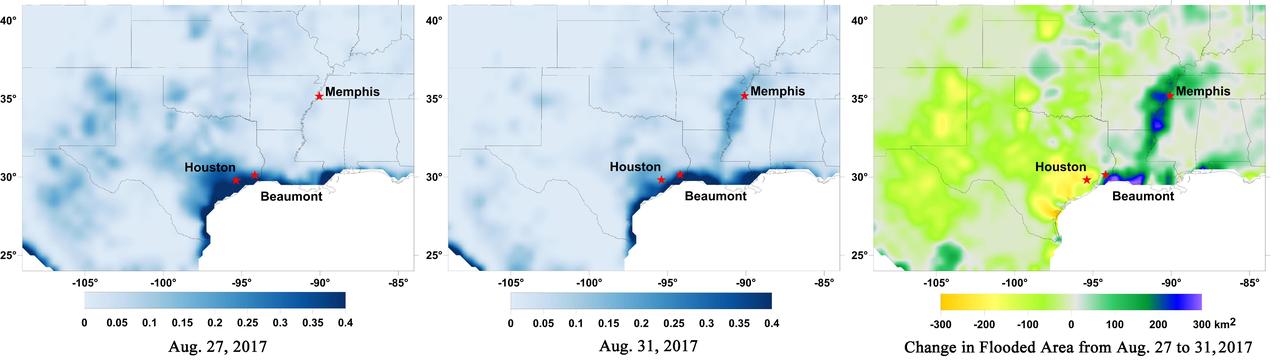
Data from NASA's Soil Moisture Active Passive (SMAP) satellite have been used to create new surface flooding maps of Southeast Texas and the Tennessee Valley following Hurricane Harvey. The SMAP observations detect the proportional cover of surface water within the satellite sensor's field of view. This sequence of images shows changes in the extent of surface flooding from successive five-day SMAP observation composite images. Widespread flooding can be seen in the Houston metropolitan area on Aug. 27 following record rainfall from the Category 4 hurricane, which made landfall on Aug. 25th, 2017 (left image). Flood waters around Houston had substantially receded by Aug. 31 (middle image), while flooding had increased across Louisiana, eastern Arkansas, and western Tennessee as then Tropical Storm Harvey passed over the area. The far right image shows the change in flooded area between Aug. 27 and Aug. 31, with regions showing the most flooding recession depicted in yellow and orange shades and those where flooding had increased depicted in blue shades. The SMAP satellite has a low-frequency (L-band) microwave radiometer with enhanced capabilities for detecting surface water changes in nearly all weather conditions and under low-to-moderate vegetation cover. SMAP provides global coverage with one-to-three-day repeat sampling that is well suited for global monitoring of inland surface water cover dynamics. https://photojournal.jpl.nasa.gov/catalog/PIA21951
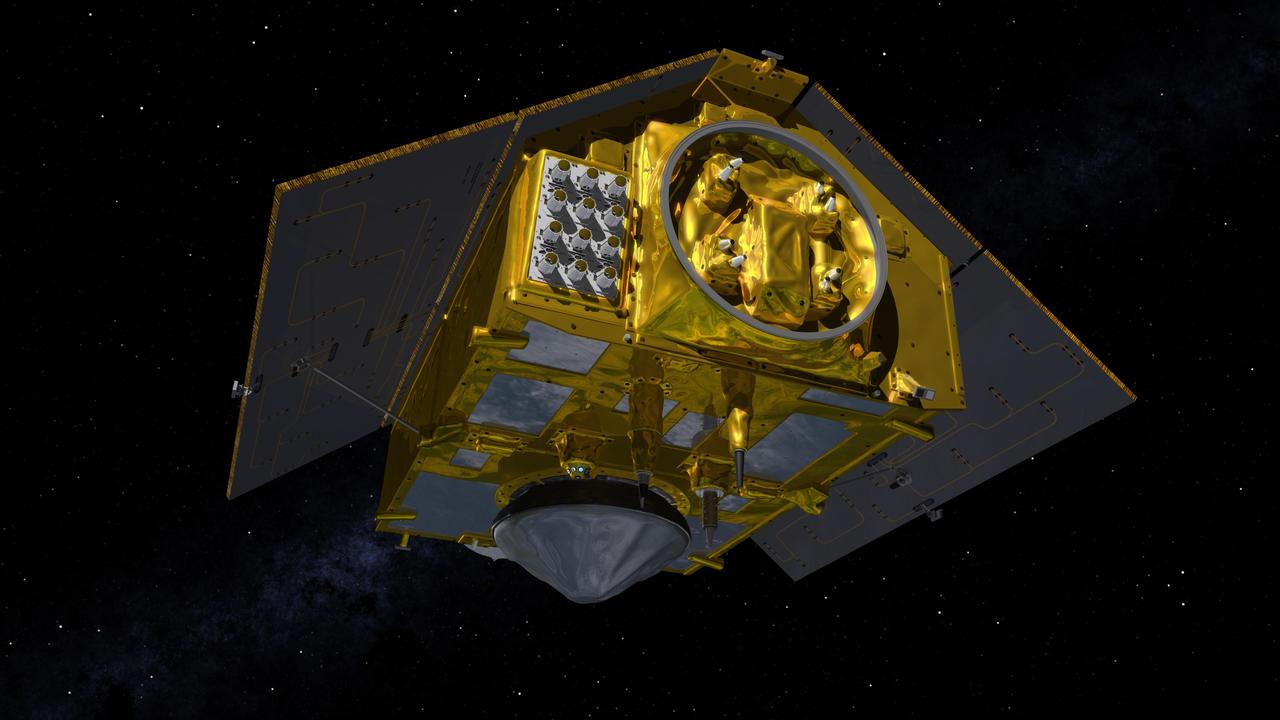
This illustration shows the rear of the Sentinel-6 Michael Freilich spacecraft in orbit above Earth with its deployable solar panels extended. As the world's latest ocean-monitoring satellite, it is launching on Nov. 10, 2020, to collect the most accurate data yet on global sea level and how our oceans are rising in response to climate change. The mission will also collect precise data of atmospheric temperature and humidity that will help improve weather forecasts and climate models. The conelike instrument on the bottom (Earth-facing side) of the spacecraft is the satellite's Poseidon-4 radar altimeter. When used with the Advanced Microwave Radiometer (AMR-C) attached to the front of the spacecraft, both instruments will be used to make precise measurements of sea surface height. The gray rectangle with 12 cones attached at the rear-left of the spacecraft is part of the Global Navigation Satellite System - Radio Occultation (GNSS-RO) instrument. Sentinel-6 Michael Freilich extends the near-30-year record of satellite measurements of sea level initiated by the U.S.-European TOPEX/Poseidon mission in 1992 and that continued with the Jason-1, 2, and 3 series of sea level observation satellites. Launched in 2016, Jason-3 is currently providing data. The satellite is named after Dr. Michael Freilich, the former director of NASA's Earth Science Division and an instrumental figure in advancing ocean observations from space. Sentinel-6 Michael Freilich is one of two identical spacecraft that compose the Sentinel-6/Jason-CS (Continuity of Service) mission developed in partnership with ESA (the European Space Agency). Other partners include the National Oceanic and Atmospheric Administration (NOAA), the intergovernmental European Organisation for the Exploitation of Meteorological Satellites (EUMETSAT), and France's National Centre for Space Studies (CNES). ESA is developing the new Sentinel family of missions to support the operational needs of the European Union's Copernicus program, the EU's Earth observation program managed by the European Commission. The spacecraft's twin, Sentinel-6B, will launch in 2025. https://photojournal.jpl.nasa.gov/catalog/PIA24107
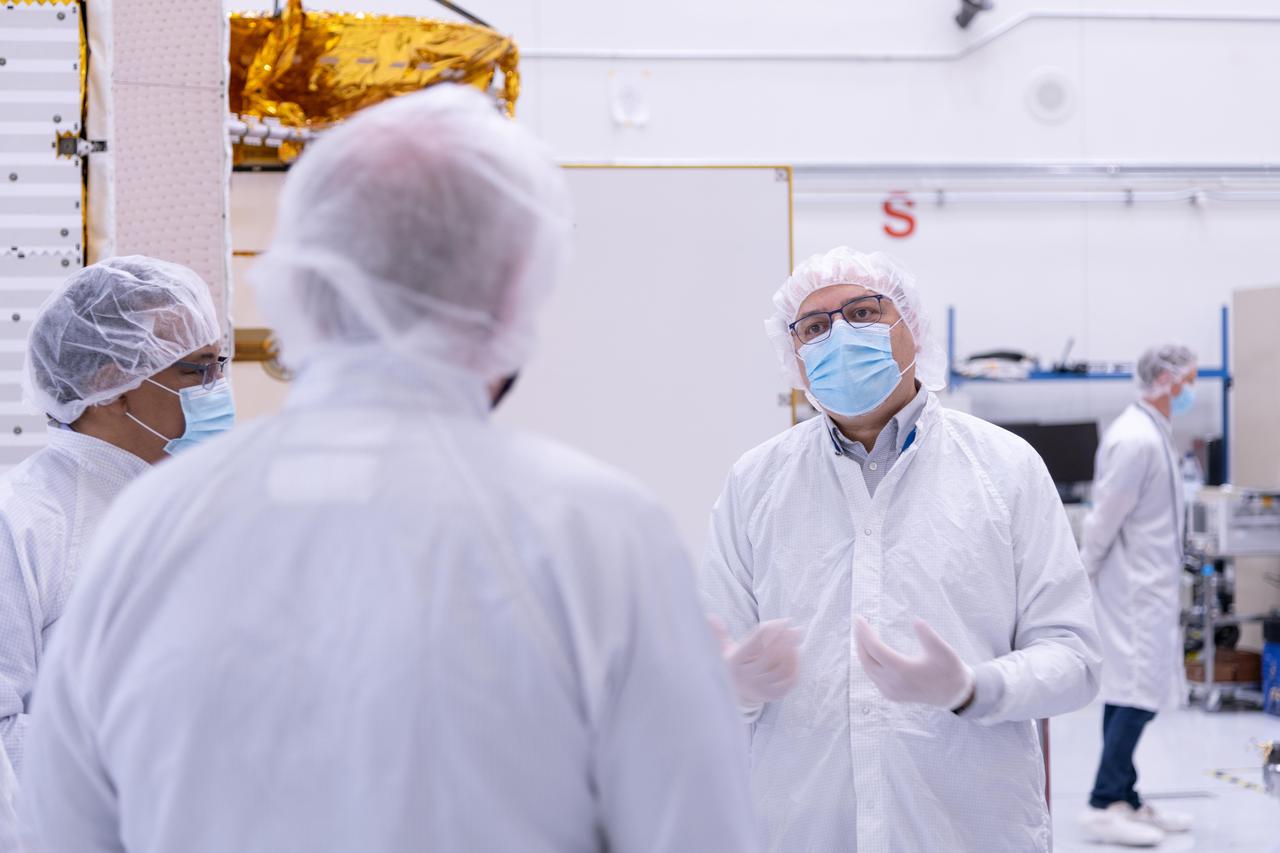
The new international satellite mission called Surface Water and Ocean Topography (SWOT) — slated for launch in late 2022 — will measure the height of Earth's surface water. The data the spacecraft will collect will help researchers understand and track the volume and location of water around the world. The satellite will assist with monitoring changes in floodplains and wetlands, measuring how much fresh water flows into and out of lakes and rivers and back to the ocean, and tracking regional shifts in sea level at scales never seen before. The satellite will also provide information on small-scale ocean currents that will support real-time marine operations affected by tides, currents, storm surge, sediment transport, and water quality issues. The payload is taking shape in a clean room at NASA's Jet Propulsion Laboratory in Southern California before being shipped to France. There, technicians and engineers from the French space agency Centre National d'Etudes Spatial (CNES), their prime contractor Thales Alenia Space, and JPL will complete the build and prepare the satellite for shipment to its California launch site at Vandenberg Air Force Base. JPL project manager Parag Vaze (pronounced vah-zay) is central to ensuring the handoff to his CNES counterpart Thierry Lafon goes smoothly. SWOT is being jointly developed by NASA and CNES, with contributions from the Canadian Space Agency (CSA) and United Kingdom Space Agency (UKSA). JPL, which is managed for NASA by Caltech in Pasadena, California, leads the U.S. component of the project. For the flight system, NASA is providing the Ka-band Radar Interferometer (KaRIn) instrument, a GPS science receiver, a laser retroreflector, and a two-beam microwave radiometer. CNES is providing the Doppler Orbitography and Radioposition Integrated by Satellite (DORIS) system, nadir altimeter, and the KaRIn RF subsystem (with support from the UKSA). CSA is providing the KaRIn high-power transmitter assembly. NASA is providing associated launch services. https://photojournal.jpl.nasa.gov/catalog/PIA24531
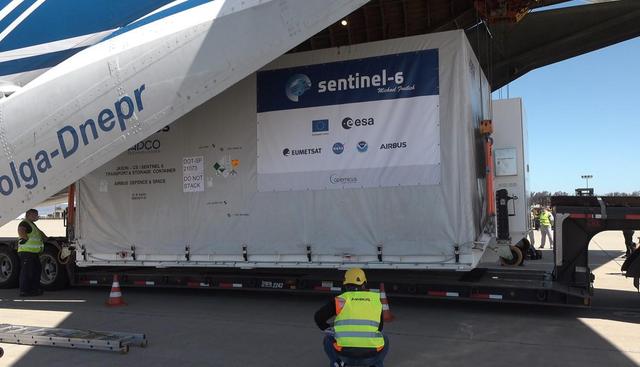
A shipping container containing the Sentinel-6 Michael Freilich satellite is removed from an Antonov 124 aircraft at Vandenberg Air Force Base in California on Sept. 24, 2020. The flight arrived at around 10:40 a.m. PDT (1:40 p.m. EDT) after a two-day journey from an IABG engineering facility near Munich, Germany. The ocean-monitoring satellite will undergo prelaunch tests before its scheduled launch on Nov. 10, 2020. Sentinel-6 Michael Freilich will begin a five-and-a-half-year mission to collect sea surface height measurements down to the centimeter for 90% of the world's oceans. The satellite is named after Dr. Michael Freilich, the former director of NASA's Earth Science Division and an instrumental figure in advancing ocean observations from space. Sentinel-6 Michael Freilich is one of two identical spacecraft that compose the Sentinel-6/Jason-CS (Continuity of Service) mission developed in partnership with ESA (the European Space Agency). ESA is developing the new Sentinel family of missions specifically to support the operational needs of the European Union's Copernicus program, the EU's Earth observation program managed by the European Commission. The spacecraft's twin, Sentinel-6B, will launch in 2025. Sentinel-6/Jason-CS is being jointly developed by ESA, the European Organisation for the Exploitation of Meteorological Satellites (EUMETSAT), NASA, and the National Oceanic and Atmospheric Administration, with funding support from the European Commission and technical support from France's National Centre for Space Studies (CNES). NASA JPL is contributing three science instruments for each Sentinel-6 satellite: the Advanced Microwave Radiometer, the Global Navigation Satellite System - Radio Occultation, and the Laser Retroreflector Array. NASA is also contributing launch services, ground systems supporting operation of the NASA science instruments, the science data processors for two of these instruments, and support for the international Ocean Surface Topography Science Team. https://photojournal.jpl.nasa.gov/catalog/PIA24103
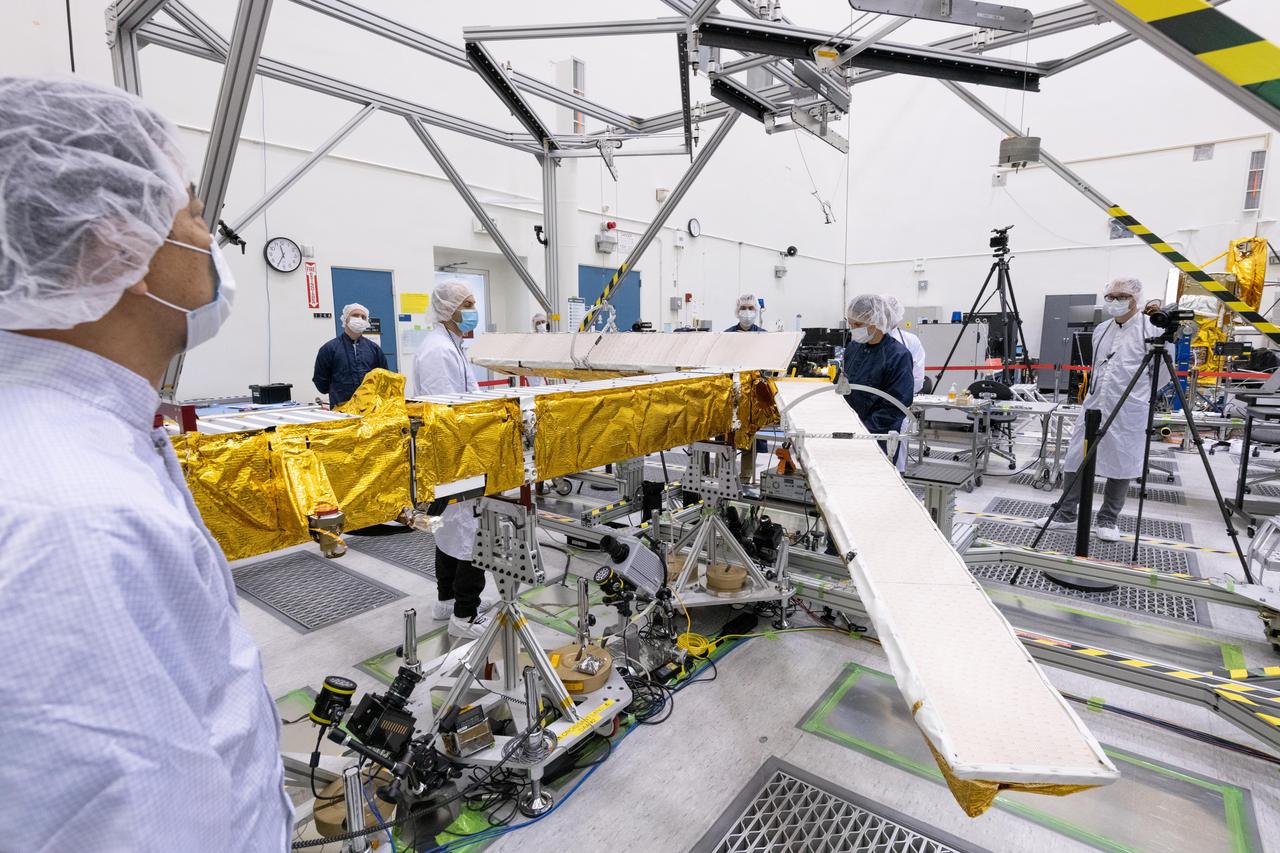
Members of the international Surface Water and Ocean Topography (SWOT) mission test one of the antennas for the Ka-band Radar Interferometer (KaRIn) instrument in a clean room at NASA's Jet Propulsion Laboratory in Southern California. The mission is a collaborative effort between NASA and the French space agency Centre National d'Études Spatiales (CNES) – with contributions from the Canadian Space Agency (CSA) and the UK Space Agency. KaRIn is the scientific heart of the SWOT satellite, which will survey the water on more than 90% of Earth's surface, measuring the height of water in lakes, rivers, reservoirs, and the ocean. To do that, KaRIn will transmit radar pulses to Earth's surface and use its two antennas to triangulate the return signals that bounce back. Mounted at the ends of a boom 33 feet (10 meters) long, the antennas will collect data along a swath 30 miles (50 kilometers) wide on either side of the satellite. KaRIn will operate in two modes: A lower-resolution mode over the ocean will involve significant onboard processing of the data to reduce the volume of information sent during downlinks to Earth; a higher-resolution mode will be used mainly over land. Scheduled to launch from Vandenberg Space Force Base in Central California on Dec. 15, 2022, SWOT is being jointly developed by NASA and CNES, with contributions from the CSA and the UK Space Agency. NASA's Jet Propulsion Laboratory, which is managed for the agency by Caltech in Pasadena, California, leads the U.S. component of the project. For the flight system payload, NASA is providing the Ka-band Radar Interferometer (KaRIn) instrument, a GPS science receiver, a laser retroreflector, a two-beam microwave radiometer, and NASA instrument operations. CNES is providing the Doppler Orbitography and Radioposition Integrated by Satellite (DORIS) system, the dual frequency Poseidon altimeter (developed by Thales Alenia Space), the KaRIn radio-frequency subsystem (together with Thales Alenia Space and with support from the UK Space Agency), the satellite platform, and ground control segment. CSA is providing the KaRIn high-power transmitter assembly. NASA is providing the launch vehicle and associated launch services. https://photojournal.jpl.nasa.gov/catalog/PIA25594
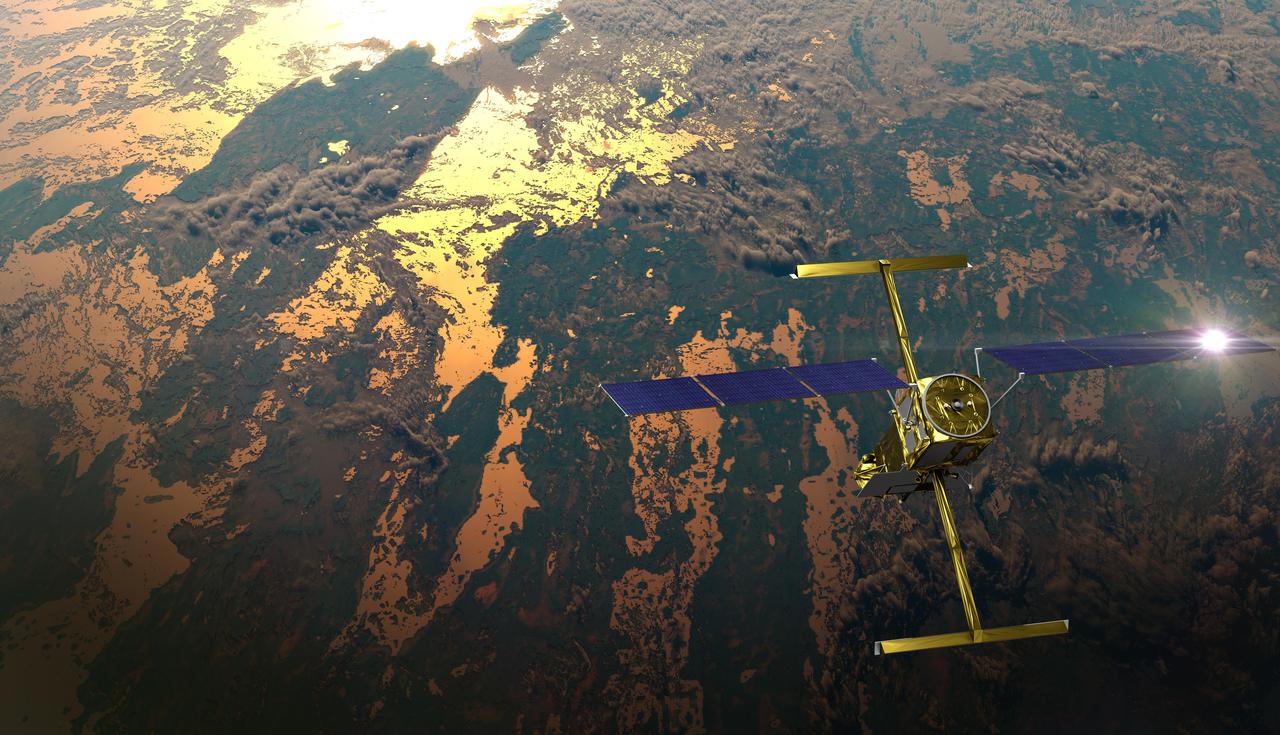
The international Surface Water and Ocean Topography (SWOT) satellite is shown in orbit over Earth in this illustration, with sunlight glinting off one of its solar arrays and both antennas of its Ka-band Radar Interferometer (KaRIn) instrument extended. The mission is a collaborative effort between NASA and the French space agency Centre National d'Études Spatiales (CNES) – with contributions from the Canadian Space Agency (CSA) and the UK Space Agency. KaRIn is the scientific heart of the SWOT satellite, which will survey the water on more than 90% of Earth's surface, measuring the height of water in lakes, rivers, reservoirs, and the ocean. To do that, KaRIn will transmit radar pulses to Earth's surface and use its two antennas to triangulate the return signals that bounce back. Mounted at the ends of a boom 33 feet (10 meters) long, the antennas will collect data along a swath 30 miles (50 kilometers) wide on either side of the satellite. KaRIn will operate in two modes: A lower-resolution mode over the ocean will involve significant onboard processing of the data to reduce the volume of information sent during downlinks to Earth; a higher-resolution mode will be used mainly over land. Scheduled to launch from Vandenberg Space Force Base in Central California on Dec. 15, 2022, SWOT is being jointly developed by NASA and CNES, with contributions from the CSA and the UK Space Agency. NASA's Jet Propulsion Laboratory, which is managed for the agency by Caltech in Pasadena, California, leads the U.S. component of the project. For the flight system payload, NASA is providing the Ka-band Radar Interferometer (KaRIn) instrument, a GPS science receiver, a laser retroreflector, a two-beam microwave radiometer, and NASA instrument operations. CNES is providing the Doppler Orbitography and Radioposition Integrated by Satellite (DORIS) system, the dual frequency Poseidon altimeter (developed by Thales Alenia Space), the KaRIn radio-frequency subsystem (together with Thales Alenia Space and with support from the UK Space Agency), the satellite platform, and ground control segment. CSA is providing the KaRIn high-power transmitter assembly. NASA is providing the launch vehicle and associated launch services. https://photojournal.jpl.nasa.gov/catalog/PIA25595
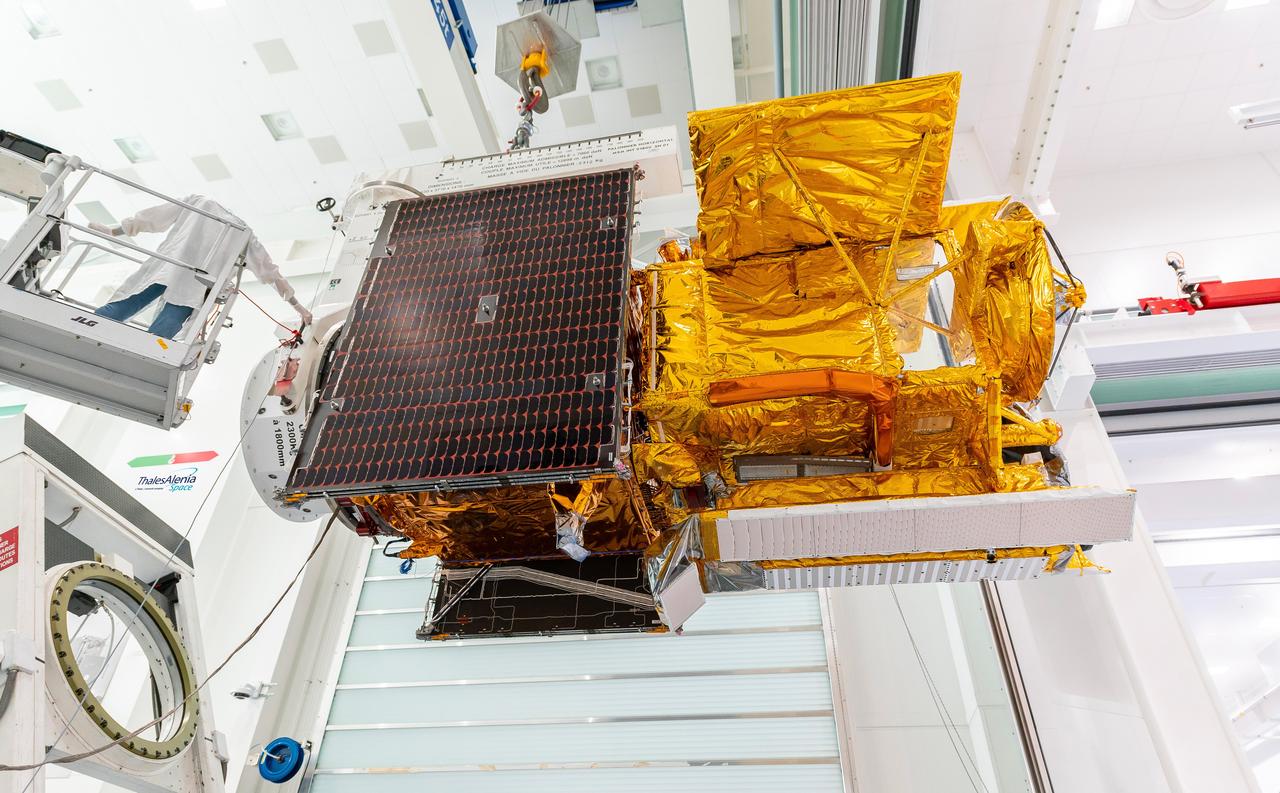
Workers in a clean room in Cannes, France, load the Surface Water and Ocean Topography (SWOT) satellite into a container in preparation for shipping the spacecraft to the U.S. SWOT is an international mission led by NASA and the French space agency Centre National d'Études Spatiales (CNES) that will survey water on more than 90% of Earth's surface. The spacecraft will view water in Earth's lakes, rivers, reservoirs, and the ocean in higher definition than ever before. The information that SWOT gathers will help inform water management decisions and prepare communities for rising seas and changing coastlines. It will also help researchers better understand the exchange of heat and carbon between the ocean and atmosphere, an important component of the role that Earth's ocean plays in the planet's climate. SWOT will launch out of the Vandenberg Space Force Base in central California no earlier than Dec. 5, 2022. SWOT is being jointly developed by NASA and CNES, with contributions from the Canadian Space Agency and the United Kingdom Space Agency. JPL, which is managed for NASA by Caltech in Pasadena, California, leads the U.S. component of the project. For the flight system payload, NASA is providing the KaRIn instrument, a GPS science receiver, a laser retroreflector, a two-beam microwave radiometer, and NASA instrument operations. CNES is providing the Doppler Orbitography and Radioposition Integrated by Satellite (DORIS) system, the dual frequency Poseidon altimeter (developed by Thales Alenia Space), the KaRIn radio-frequency subsystem (together with Thales Alenia Space and with support from the UK Space Agency), the platform, and ground control segment. CSA is providing the KaRIn high-power transmitter assembly. NASA is providing the launch vehicle and associated launch services. https://photojournal.jpl.nasa.gov/catalog/PIA24910
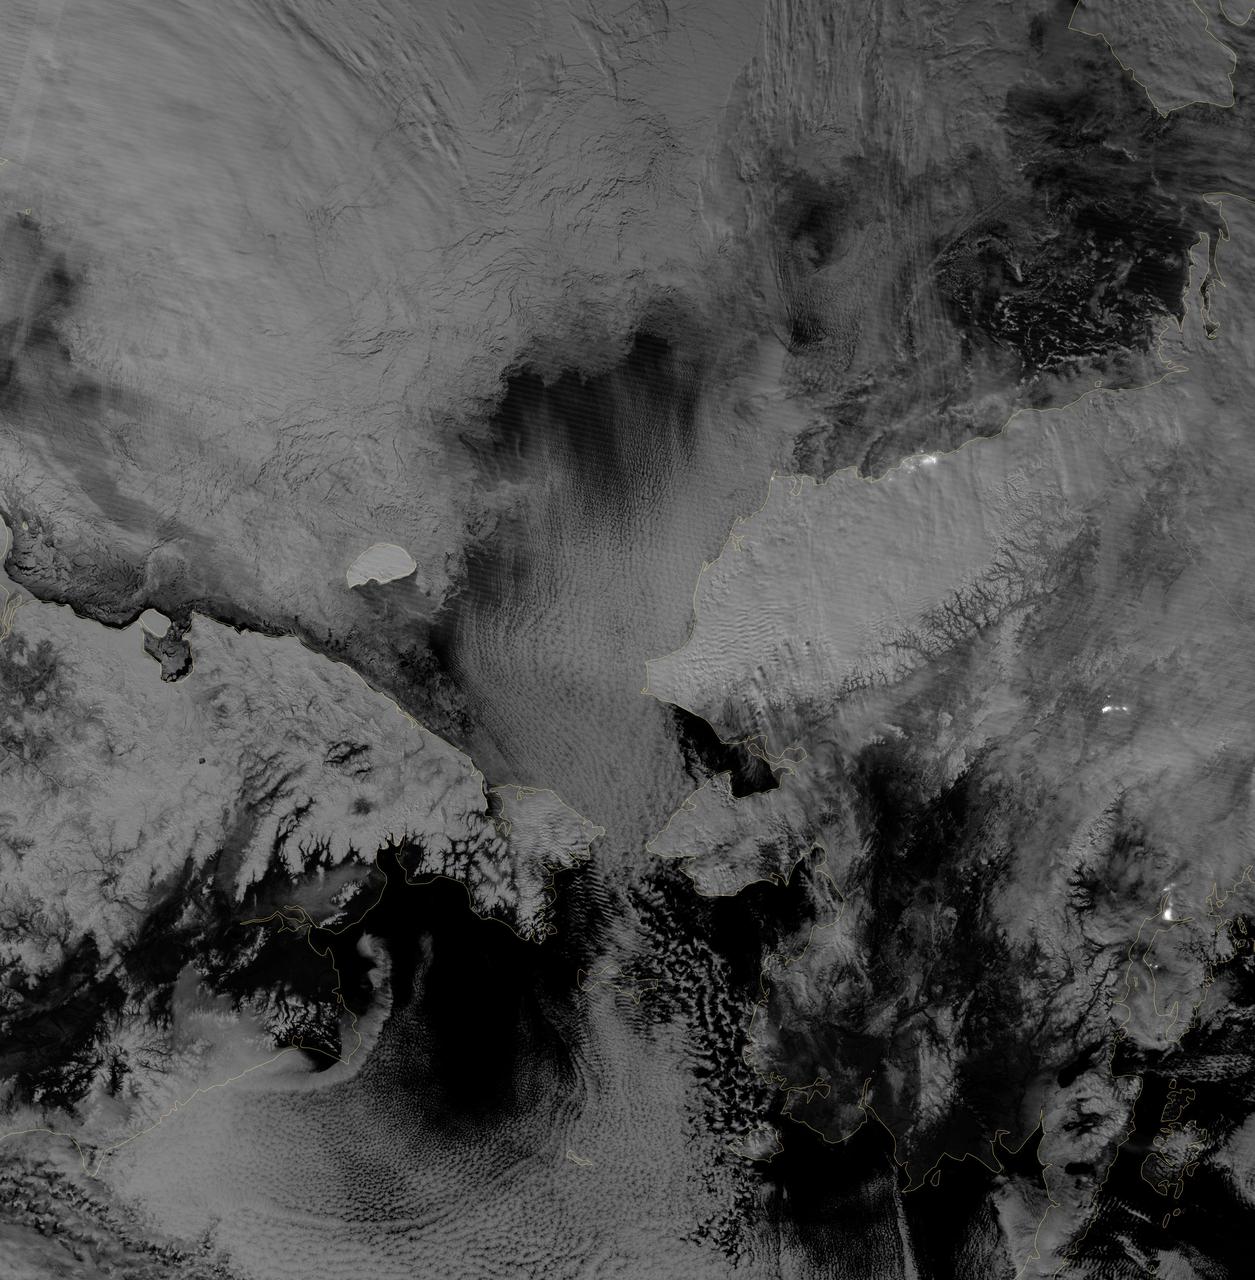
Image acquired October 30, 2012 Scientists watched the Arctic with particular interest in the summer of 2012, when Arctic sea ice set a new record low. The behavior of sea ice following such a low extent also interests scientists, but as Arctic sea ice was advancing in the autumn of 2012, so was polar darkness. Fortunately, the Visible Infrared Imaging Radiometer Suite (VIIRS) on the Suomi NPP satellite can see in the dark. The VIIRS “day-night band” detects light in a range of wavelengths from green to near-infrared and uses filtering techniques to observe signals such as gas flares, auroras, wildfires, city lights, and reflected moonlight. VIIRS acquired this nighttime view of sea ice north of Russia and Alaska on October 30, 2012. The day-night band takes advantage of moonlight, airglow (the atmosphere’s self-illumination through chemical reactions), zodiacal light (sunlight scattered by interplanetary dust), and starlight from the Milky Way. By using these dim light sources, the day-night band can detect changes in clouds, snow cover, and sea ice. The VIIRS day-night band offers a unique perspective because once polar night has descended, satellite sensors relying on visible light can no longer produce photo-like images. And although passive microwave sensors can monitor sea ice through the winter, they offer much lower resolution. Steve Miller of the Cooperative Institute for Research in the Atmosphere at Colorado State University has used the day-night band to study nighttime behavior of weather systems and sees advantages in studying the polar regions. “There’s a lot of use with these measurements as we look back at a season of record ice melt in the Arctic,” Miller says. “We can observe areas where there is ice melt and reformation, where there’s clear water and ships can pass through—especially as the ‘great darkness’ approaches with winter.” Ted Scambos of the National Snow and Ice Data Center at the University of Colorado concurs. “Things start changing rapidly in the late fall: sea ice formation and snow cover extent at the highest latitudes. This lets us see rapid-growth areas in detail.” The day-night band is also useful for following weather systems, including severe storms, which can develop and strike populous areas at night as well as day. Geostationary Operational Environmental Satellites orbit the Earth’s equator. The satellites offer uninterrupted observations of North America, but high-latitude areas such as Alaska may benefit more from polar-orbiting satellites. Miller explains, “In the high latitudes, the orbits begin to overlap considerably, which gives you a lot more passes in Alaska. If you start to look at multiple passes and stitch them together, you can get a version of a poor man’s geostationary time loop of the weather.” Day-night band imagery at high latitudes has already proven useful for tracking rapid ice movement and diagnosing Gulf of Alaska circulations. The day-night band is even useful at tracking ship movement at high latitudes. NASA Earth Observatory image by Jesse Allen and Robert Simmon, using VIIRS Day-Night Band data from the Suomi National Polar-orbiting Partnership. Suomi NPP is the result of a partnership between NASA, the National Oceanic and Atmospheric Administration, and the Department of Defense. Caption by Michon Scott. Instrument: Suomi NPP - VIIRS Credit: <b><a href="http://www.earthobservatory.nasa.gov/" rel="nofollow"> NASA Earth Observatory</a></b> <b>Click here to view all of the <a href="http://earthobservatory.nasa.gov/Features/NightLights/" rel="nofollow"> Earth at Night 2012 images </a></b> <b>Click here to <a href="http://earthobservatory.nasa.gov/NaturalHazards/view.php?id=79825" rel="nofollow"> read more </a> about this image </b> <b><a href="http://www.nasa.gov/audience/formedia/features/MP_Photo_Guidelines.html" rel="nofollow">NASA image use policy.</a></b> <b><a href="http://www.nasa.gov/centers/goddard/home/index.html" rel="nofollow">NASA Goddard Space Flight Center</a></b> enables NASA