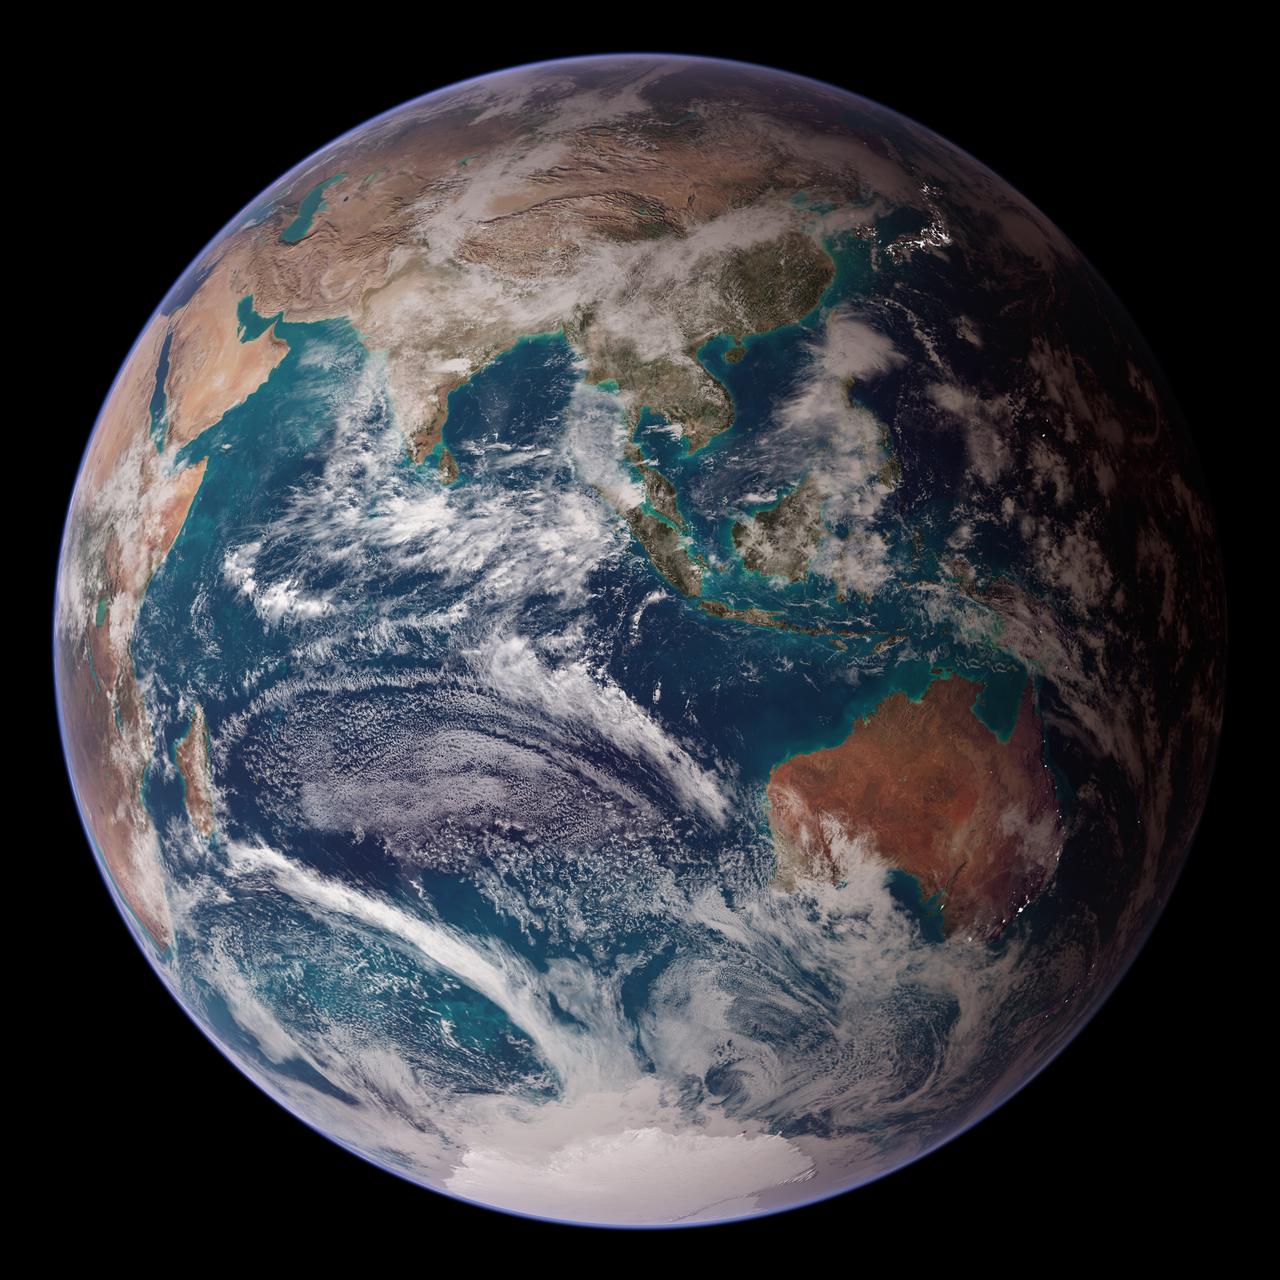
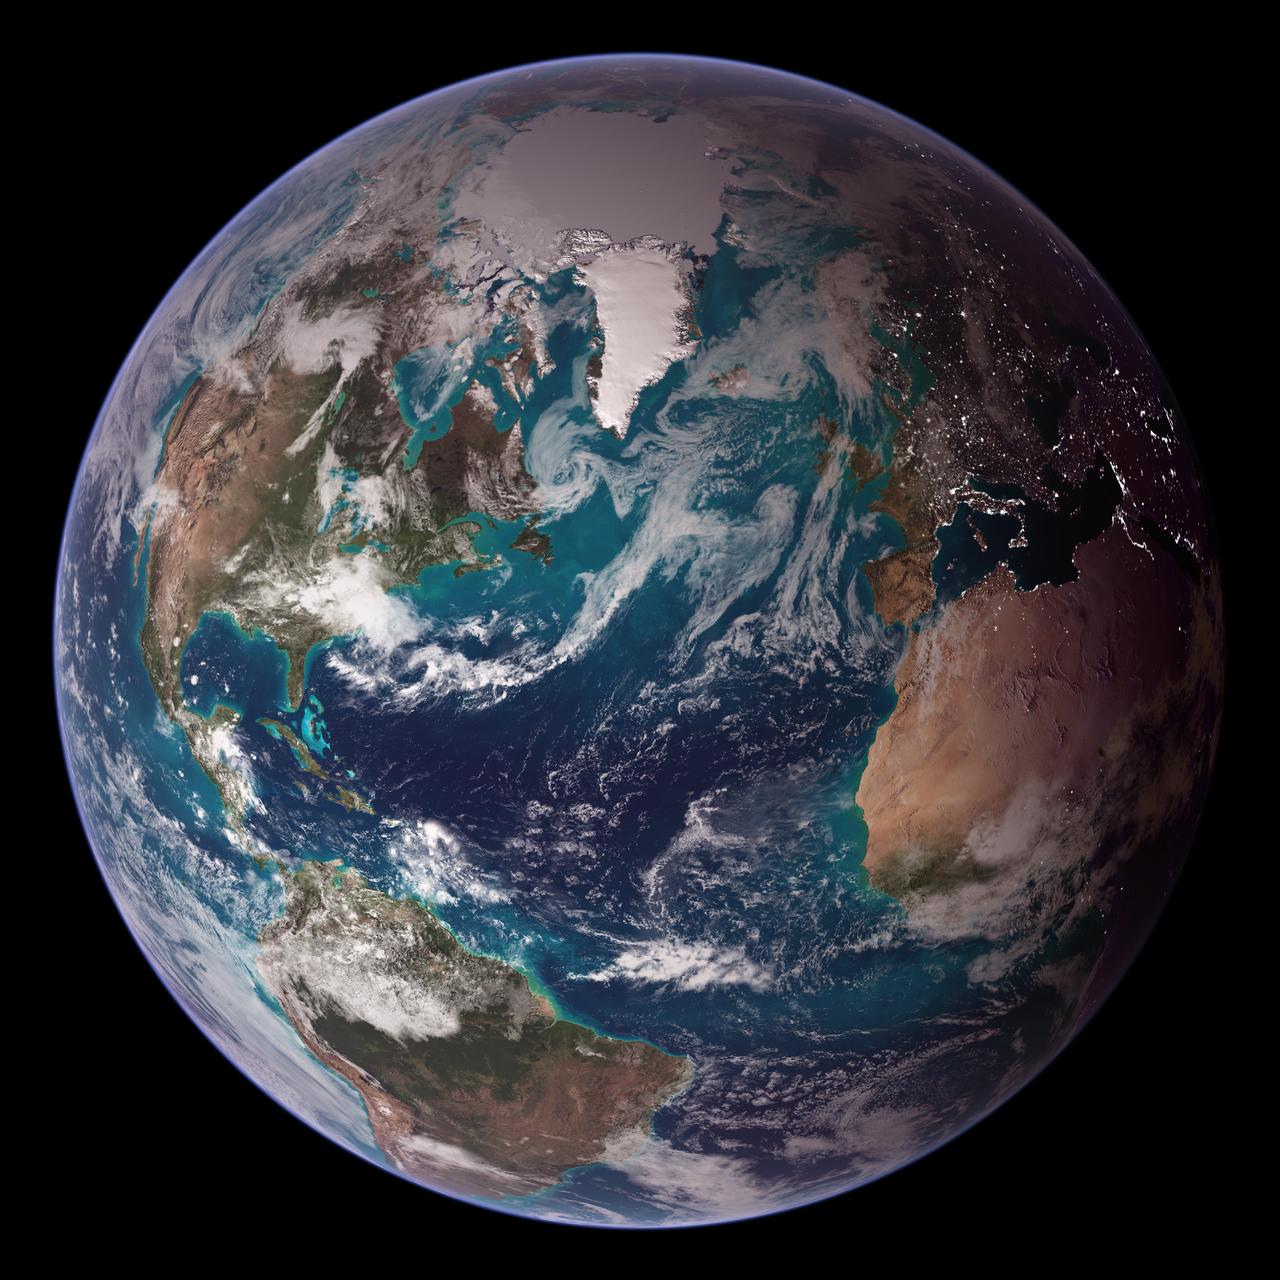
<b>RELEASE DATE: OCTOBER 9, 2007</b> <b>Credit: NASA/Goddard Space Flight Center/Reto Stöckli</b> A day’s clouds. The shape and texture of the land. The living ocean. City lights as a beacon of human presence across the globe. This amazingly beautiful view of Earth from space is a fusion of science and art, a showcase for the remote-sensing technology that makes such views possible, and a testament to the passion and creativity of the scientists who devote their careers to understanding how land, ocean, and atmosphere—even life itself—interact to generate Earth’s unique (as far as we know!) life-sustaining environment. Drawing on data from multiple satellite missions (not all collected at the same time), a team of NASA scientists and graphic artists created layers of global data for everything from the land surface, to polar sea ice, to the light reflected by the chlorophyll in the billions of microscopic plants that grow in the ocean. They wrapped these layers around a globe, set it against a black background, and simulated the hazy edge of the Earth’s atmosphere (the limb) that appears in astronaut photography of the Earth. The land surface layer is based on photo-like surface reflectance observations (reflected sunlight) measured by the Moderate Resolution Imaging Spectroradiometer (MODIS) on NASA’s Terra satellite in July 2004. The sea ice layer near the poles comes from Terra MODIS observations of daytime sea ice observed between August 28 and September 6, 2001. The ocean layer is a composite. In shallow water areas, the layer shows surface reflectances observed by Terra MODIS in July 2004. In the open ocean, the photo-like layer is overlaid with observations of the average ocean chlorophyll content for 2004. NASA’s Aqua MODIS collected the chlorophyll data. The cloud layer shows a single-day snapshot of clouds observed by Terra MODIS across the planet on July 29, 2001. City lights on Earth’s night side are visualized from data collected by the Defense Meteorological Satellite Program mission between 1994–1995. The topography layer is based on radar data collected by the Space Shuttle Endeavour during an 11-day mission in February of 2000. Topography over Antarctica comes from the Radarsat Antarctic Mapping Project, version 2. Most of the data layers in this visualization are available as monthly composites as part of NASA’s Blue Marble Next Generation image collection. The images in the collection appear in cylindrical projection (rectangular maps), and they are available at 500-meter resolution. The large images provided above are the full-size versions of these globes. In their hope that these images will inspire people to appreciate the beauty of our home planet and to learn about the Earth system, the developers of these images encourage readers to re-use and re-publish the images freely. NASA images by Reto Stöckli, based on data from NASA and NOAA. To learn the history of the Blue Marble go here: <a href="http://earthobservatory.nasa.gov/Features/BlueMarble/BlueMarble_history.php" rel="nofollow">earthobservatory.nasa.gov/Features/BlueMarble/BlueMarble_...</a> To learn more about the Blue Marble go here: <a href="http://earthobservatory.nasa.gov/IOTD/view.php?id=8108" rel="nofollow">earthobservatory.nasa.gov/IOTD/view.php?id=8108</a> To learn more about NASA's Goddard Space Flight Center go here: <a href="http://www.nasa.gov/centers/goddard/home/index.html" rel="nofollow">www.nasa.gov/centers/goddard/home/index.html</a> <b><a href="http://www.nasa.gov/centers/goddard/home/index.html" rel="nofollow">NASA Goddard Space Flight Center</a></b> is home to the nation's largest organization of combined scientists, engineers and technologists that build spacecraft, instruments and new technology to study the Earth, the sun, our solar system, and the universe. <b><a href="http://www.nasa.gov/centers/goddard/home/index.html" rel="nofollow">NASA Goddard Space Flight Center</a></b> is home to the nation's largest organization of combined scientists, engineers and technologists that build spacecraft, instruments and new technology to study the Earth, the sun, our solar system, and the universe. <b>Follow us on <a href="http://twitter.com/NASA_GoddardPix" rel="nofollow">Twitter</a></b> <b>Join us on <a href="http://www.facebook.com/pages/Greenbelt-MD/NASA-Goddard/395013845897?ref=tsd" rel="nofollow">Facebook</a><b> </b></b>
<b>RELEASE DATE: OCTOBER 9, 2007</b> <b>Credit: NASA/Goddard Space Flight Center/Reto Stöckli</b> A day’s clouds. The shape and texture of the land. The living ocean. City lights as a beacon of human presence across the globe. This amazingly beautiful view of Earth from space is a fusion of science and art, a showcase for the remote-sensing technology that makes such views possible, and a testament to the passion and creativity of the scientists who devote their careers to understanding how land, ocean, and atmosphere—even life itself—interact to generate Earth’s unique (as far as we know!) life-sustaining environment. Drawing on data from multiple satellite missions (not all collected at the same time), a team of NASA scientists and graphic artists created layers of global data for everything from the land surface, to polar sea ice, to the light reflected by the chlorophyll in the billions of microscopic plants that grow in the ocean. They wrapped these layers around a globe, set it against a black background, and simulated the hazy edge of the Earth’s atmosphere (the limb) that appears in astronaut photography of the Earth. The land surface layer is based on photo-like surface reflectance observations (reflected sunlight) measured by the Moderate Resolution Imaging Spectroradiometer (MODIS) on NASA’s Terra satellite in July 2004. The sea ice layer near the poles comes from Terra MODIS observations of daytime sea ice observed between August 28 and September 6, 2001. The ocean layer is a composite. In shallow water areas, the layer shows surface reflectances observed by Terra MODIS in July 2004. In the open ocean, the photo-like layer is overlaid with observations of the average ocean chlorophyll content for 2004. NASA’s Aqua MODIS collected the chlorophyll data. The cloud layer shows a single-day snapshot of clouds observed by Terra MODIS across the planet on July 29, 2001. City lights on Earth’s night side are visualized from data collected by the Defense Meteorological Satellite Program mission between 1994–1995. The topography layer is based on radar data collected by the Space Shuttle Endeavour during an 11-day mission in February of 2000. Topography over Antarctica comes from the Radarsat Antarctic Mapping Project, version 2. Most of the data layers in this visualization are available as monthly composites as part of NASA’s Blue Marble Next Generation image collection. The images in the collection appear in cylindrical projection (rectangular maps), and they are available at 500-meter resolution. The large images provided above are the full-size versions of these globes. In their hope that these images will inspire people to appreciate the beauty of our home planet and to learn about the Earth system, the developers of these images encourage readers to re-use and re-publish the images freely. NASA images by Reto Stöckli, based on data from NASA and NOAA. To learn the history of the Blue Marble go here: <a href="http://earthobservatory.nasa.gov/Features/BlueMarble/BlueMarble_history.php" rel="nofollow">earthobservatory.nasa.gov/Features/BlueMarble/BlueMarble_...</a> To learn more about the Blue Marble go here: <a href="http://earthobservatory.nasa.gov/IOTD/view.php?id=8108" rel="nofollow">earthobservatory.nasa.gov/IOTD/view.php?id=8108</a> <b><a href="http://www.nasa.gov/centers/goddard/home/index.html" rel="nofollow">NASA Goddard Space Flight Center</a></b> is home to the nation's largest organization of combined scientists, engineers and technologists that build spacecraft, instruments and new technology to study the Earth, the sun, our solar system, and the universe. <b>Follow us on <a href="http://twitter.com/NASA_GoddardPix" rel="nofollow">Twitter</a></b> <b>Join us on <a href="http://www.facebook.com/pages/Greenbelt-MD/NASA-Goddard/395013845897?ref=tsd" rel="nofollow">Facebook</a><b> </b></b>
![On June 26, 2016, the Moderate Resolution Imaging Spectroradiometer (MODIS) on NASA’s Terra satellite acquired this natural-color image of cloud gravity waves off the coast of Angola and Namibia. “I [regularly] look at this area on Worldview because you quite often have these gravity waves,” said Bastiaan Van Diedenhoven, a researcher for Columbia University and NASA's Goddard Institute for Space Studies interested in cloud formations. “On this day, there was so much going on—so many different waves from different directions—that they really started interfering.” A distinctive criss-cross pattern formed in unbroken stretches hundreds of kilometers long. Similar to a boat’s wake, which forms as the water is pushed upward by the boat and pulled downward again by gravity, these clouds are formed by the rise and fall of colliding air columns. Off of west Africa, dry air coming off the Namib desert—after being cooled by the night—moves out under the balmy, moist air over the ocean and bumps it upwards. As the humid air rises to a higher altitude, the moisture condenses into droplets, forming clouds. Gravity rolls these newly formed clouds into a wave-like shape. When moist air goes up, it cools, and then gravity pushes it down again. As it plummets toward the earth, the moist air is pushed up again by the dry air. Repeated again and again, this process creates gravity waves. Clouds occur at the upward wave motions, while they evaporate at the downward motions. Such waves will often propagate in the morning and early afternoon, said Van Diedenhoven. During the course of the day, the clouds move out to sea and stretch out, as the dry air flowing off the land pushes the moist ocean air westward. NASA Earth Observatory image by Jesse Allen, using data from the Land Atmosphere Near real-time Capability for EOS (LANCE). via @NASAEarth <a href="http://go.nasa.gov/29Btxcy" rel="nofollow">go.nasa.gov/29Btxcy</a> <b><a href="http://go.nasa.gov/29BtHR6" rel="nofollow">NASA image use policy.</a></b> <b><a href="http://go.nasa.gov/29BtDku" rel="nofollow">NASA Goddard Space Flight Center</a></b> enables NASA’s mission through four scientific endeavors: Earth Science, Heliophysics, Solar System Exploration, and Astrophysics. Goddard plays a leading role in NASA’s accomplishments by contributing compelling scientific knowledge to advance the Agency’s mission. <b>Follow us on <a href="http://go.nasa.gov/29BtVrn" rel="nofollow">Twitter</a></b> <b>Like us on <a href="http://go.nasa.gov/29BtygK" rel="nofollow">Facebook</a></b> <b>Find us on <a href="http://go.nasa.gov/29Bu0vu" rel="nofollow">Instagram</a></b>](https://images-assets.nasa.gov/image/GSFC_20171208_Archive_e000269/GSFC_20171208_Archive_e000269~medium.jpg)
On June 26, 2016, the Moderate Resolution Imaging Spectroradiometer (MODIS) on NASA’s Terra satellite acquired this natural-color image of cloud gravity waves off the coast of Angola and Namibia. “I [regularly] look at this area on Worldview because you quite often have these gravity waves,” said Bastiaan Van Diedenhoven, a researcher for Columbia University and NASA's Goddard Institute for Space Studies interested in cloud formations. “On this day, there was so much going on—so many different waves from different directions—that they really started interfering.” A distinctive criss-cross pattern formed in unbroken stretches hundreds of kilometers long. Similar to a boat’s wake, which forms as the water is pushed upward by the boat and pulled downward again by gravity, these clouds are formed by the rise and fall of colliding air columns. Off of west Africa, dry air coming off the Namib desert—after being cooled by the night—moves out under the balmy, moist air over the ocean and bumps it upwards. As the humid air rises to a higher altitude, the moisture condenses into droplets, forming clouds. Gravity rolls these newly formed clouds into a wave-like shape. When moist air goes up, it cools, and then gravity pushes it down again. As it plummets toward the earth, the moist air is pushed up again by the dry air. Repeated again and again, this process creates gravity waves. Clouds occur at the upward wave motions, while they evaporate at the downward motions. Such waves will often propagate in the morning and early afternoon, said Van Diedenhoven. During the course of the day, the clouds move out to sea and stretch out, as the dry air flowing off the land pushes the moist ocean air westward. NASA Earth Observatory image by Jesse Allen, using data from the Land Atmosphere Near real-time Capability for EOS (LANCE). via @NASAEarth <a href="http://go.nasa.gov/29Btxcy" rel="nofollow">go.nasa.gov/29Btxcy</a> <b><a href="http://go.nasa.gov/29BtHR6" rel="nofollow">NASA image use policy.</a></b> <b><a href="http://go.nasa.gov/29BtDku" rel="nofollow">NASA Goddard Space Flight Center</a></b> enables NASA’s mission through four scientific endeavors: Earth Science, Heliophysics, Solar System Exploration, and Astrophysics. Goddard plays a leading role in NASA’s accomplishments by contributing compelling scientific knowledge to advance the Agency’s mission. <b>Follow us on <a href="http://go.nasa.gov/29BtVrn" rel="nofollow">Twitter</a></b> <b>Like us on <a href="http://go.nasa.gov/29BtygK" rel="nofollow">Facebook</a></b> <b>Find us on <a href="http://go.nasa.gov/29Bu0vu" rel="nofollow">Instagram</a></b>