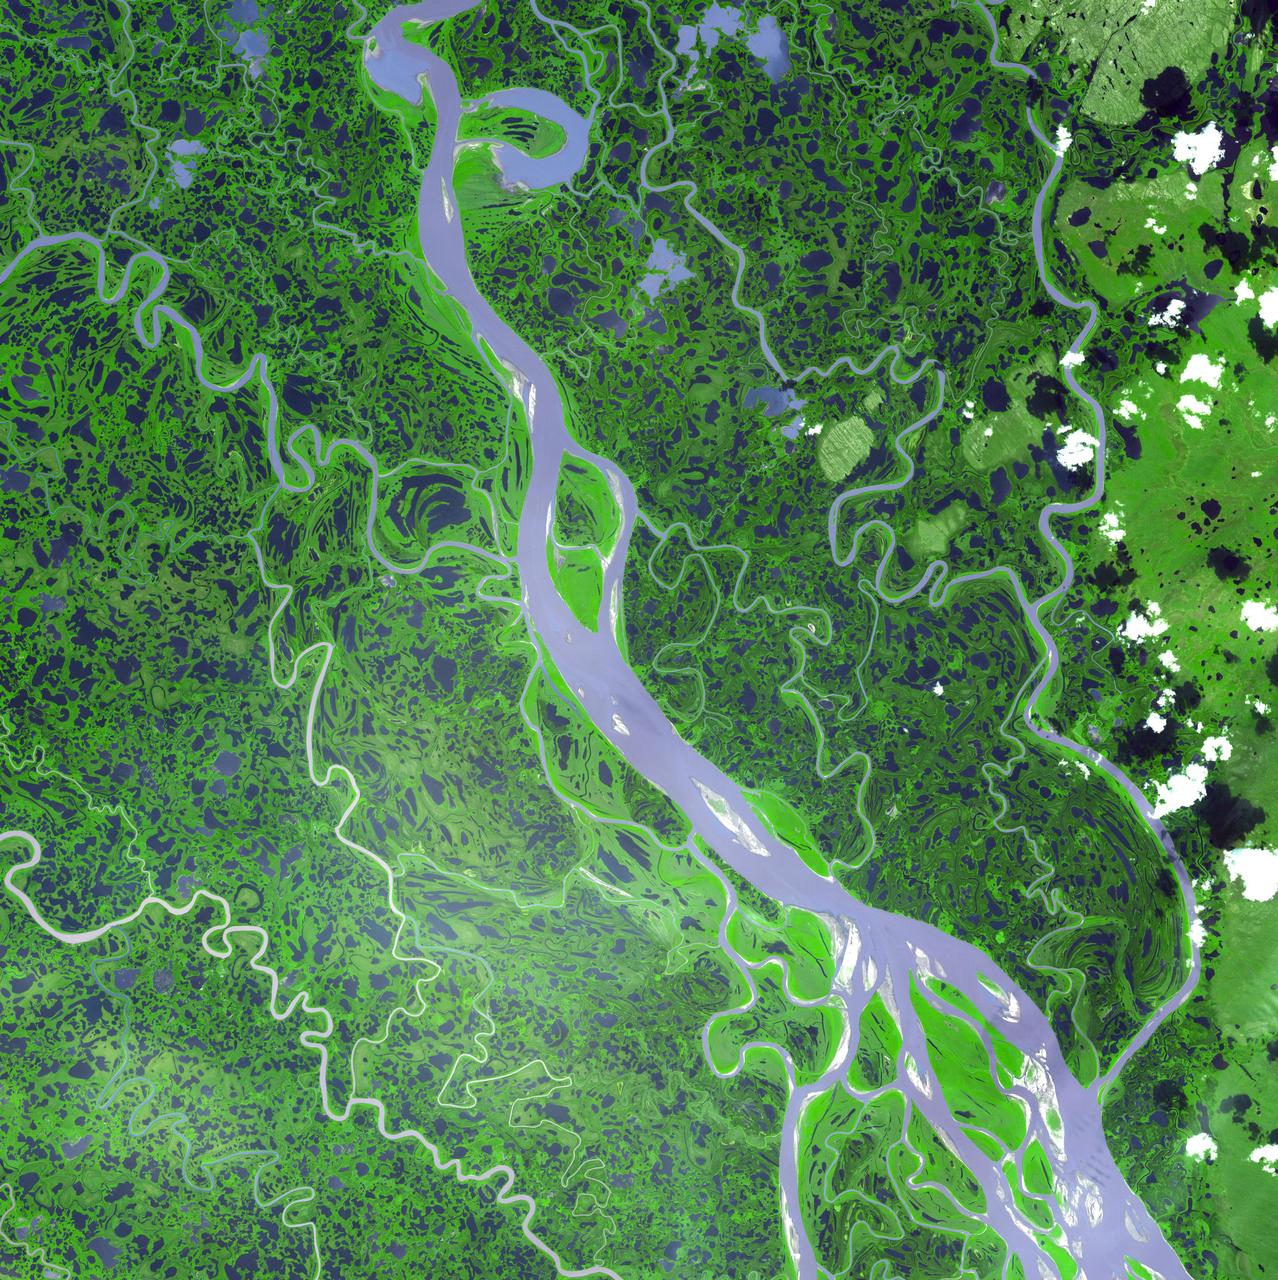
The Mackenzie River in the Northwest Territories, Canada, with its headstreams the Peace and Finley, is the longest river in North America. This image was acquired by NASA Terra satellite on August 4, 2005.
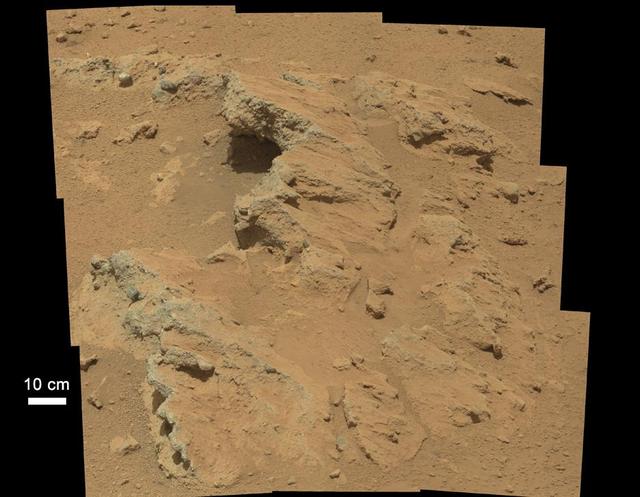
NASA Curiosity rover found evidence for an ancient, flowing stream on Mars at a few sites, including the rock outcrop pictured here, which the science team has named Hottah after Hottah Lake in Canada Northwest Territories.
JPL-led study shows bromine explosion on March 13, 2008 across the western Northwest Territories in Canada looking toward the Mackenzie Mountains at the horizon, which prevented the bromine from crossing over into Alaska.
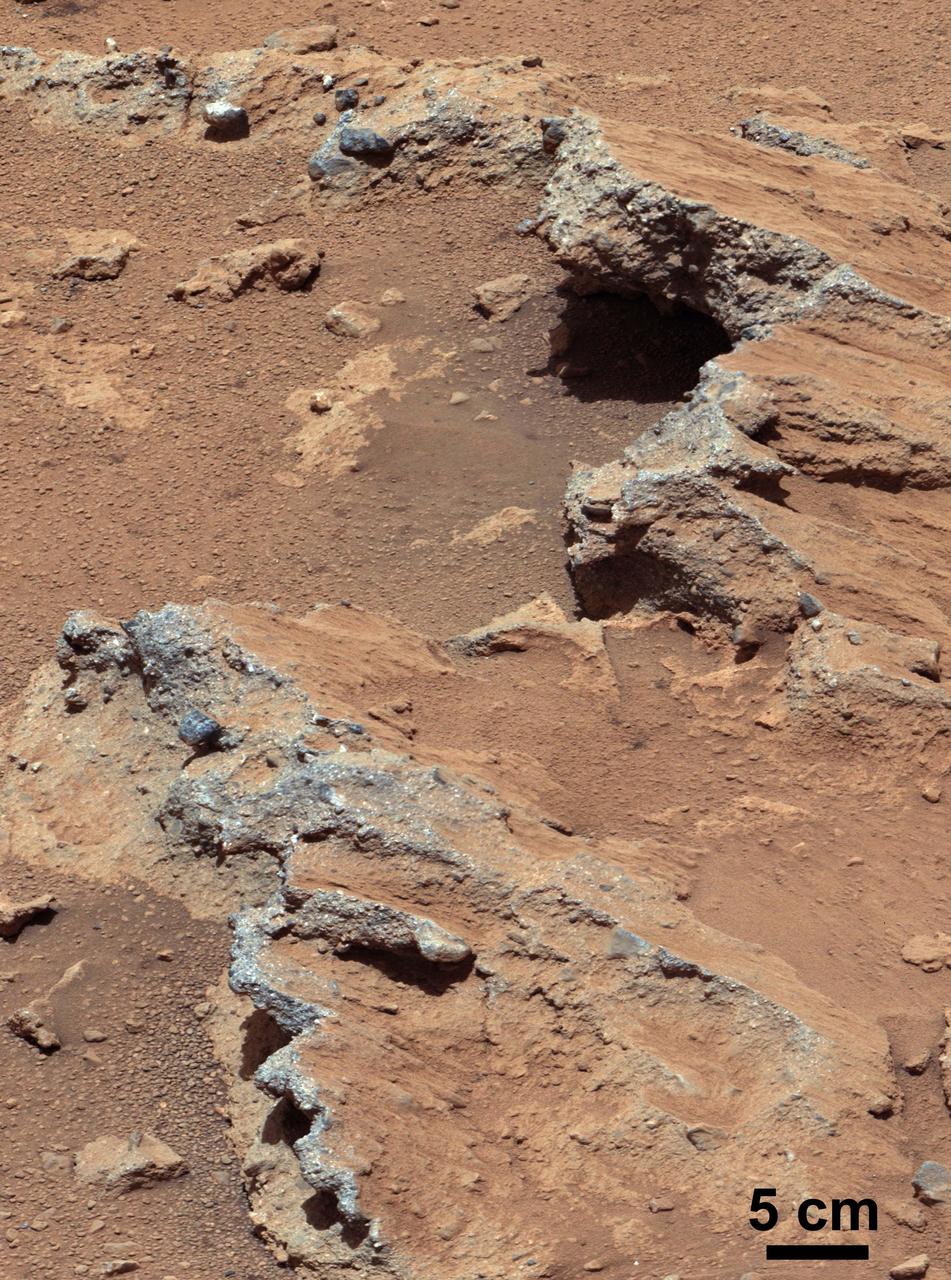
NASA Curiosity rover found evidence for an ancient, flowing stream on Mars at a few sites, including a rock which the science team has named Hottah after Hottah Lake in Canada Northwest Territories.
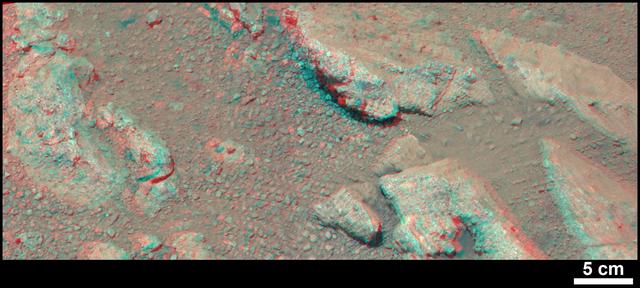
NASA Curiosity rover found evidence for an ancient, flowing stream on Mars at a few sites, including a rock which the science team has named Hottah after Hottah Lake in Canada Northwest Territories. 3-D glasses are needed.

This image from NASA Terra spacecraft shows Prince Patrick Island, which is located in the Canadian Arctic Archipelago, and is the westernmost Elizabeth Island in the Northwest Territories of Canada. The island is underlain by sedimentary rocks, cut by still-active faults. The streams follow a dendritic drainage system: there are many contributing streams (analogous to the twigs of a tree), which are then joined together into the tributaries of the main river (the branches and the trunk of the tree, respectively). They develop where the river channel follows the slope of the terrain. The image covers an area of 22 by 27 km, was acquired July 2, 2011, and is located at 76.9 degrees north, 118.9 degrees west. http://photojournal.jpl.nasa.gov/catalog/PIA19222

iss065e376897 (Sept. 13, 2021) --- The International Space Station orbits 266 miles above the north Pacific Ocean off the coast of British Columbia, Canada, looking across the city lights of northwest America into a sunrise highlighted by an aurora.
SL2-05-458 (22 June 1973) --- Portions of northwest Washington State (48.0N, 122.5) can be seen in this view as well as portions of British Columbia, Canada. The snow covered Cascade Mountains are on the eastern side of the scene. Vancouver Island is visible in the northeast corner of the photo. The strait of Juan de Fuca separates Vancouver Island from the northwest corner of Washington. Seattle is near the center and the snow covered Olympic Mountains are to the east. Photo credit: NASA
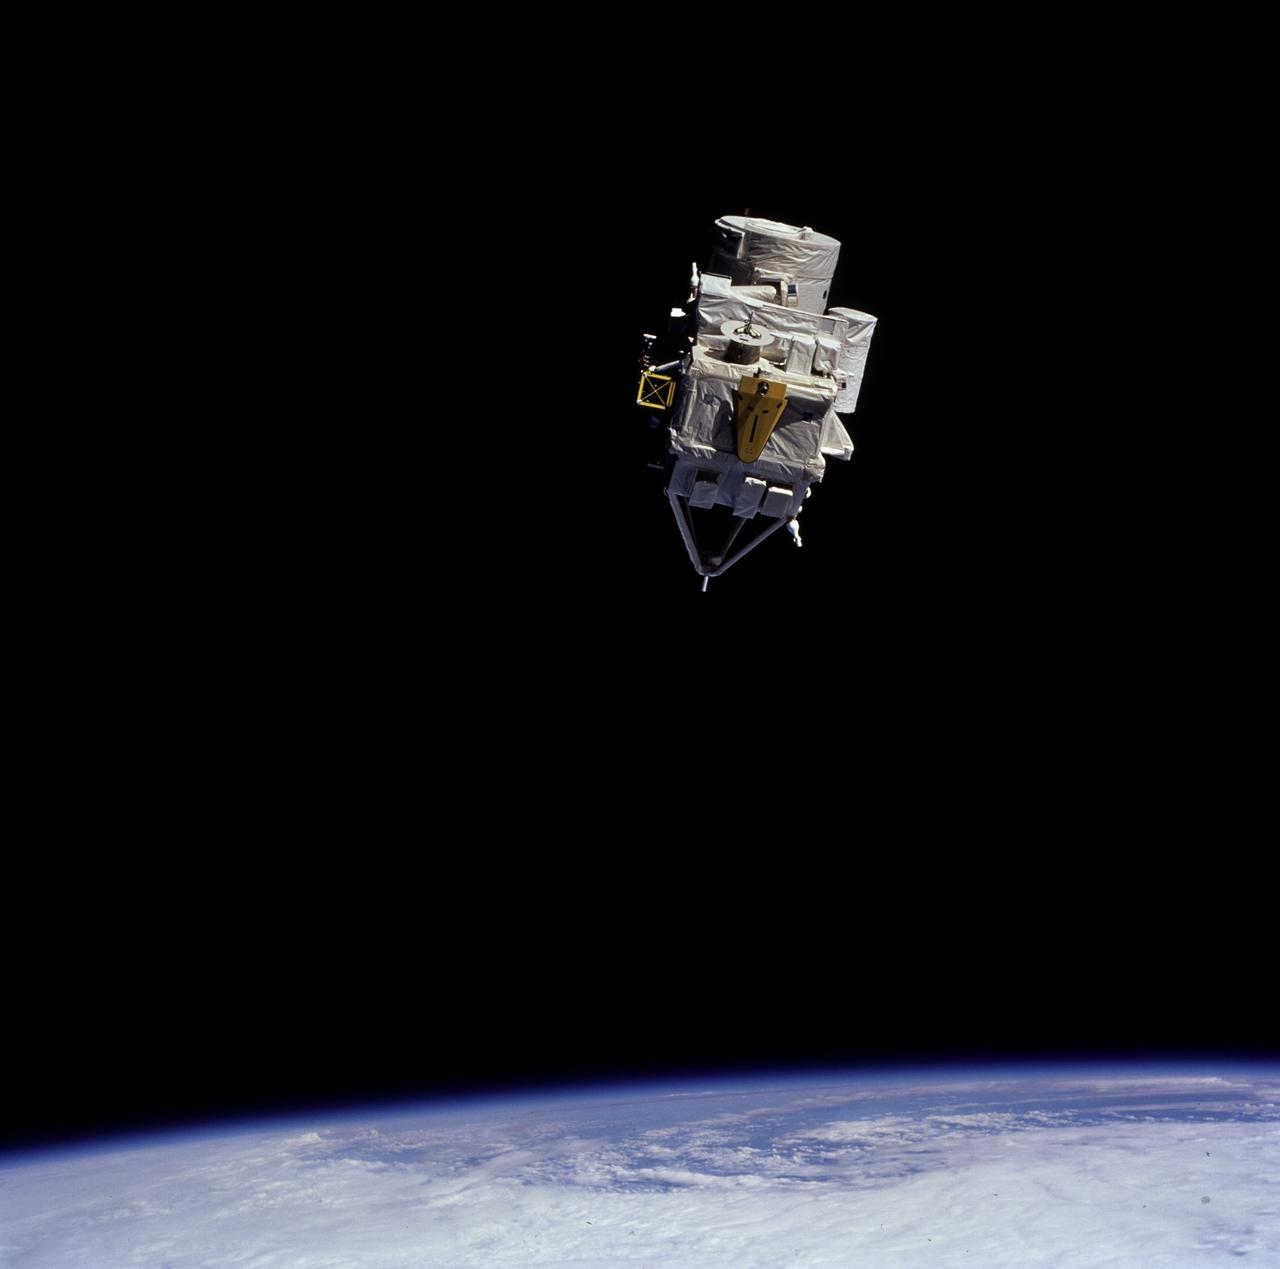
STS085-706-051 (7 August 1997) --- This view documenting the release from the Space Shuttle Discovery of Cryogenic Infrared Spectrometers and Telescopes for the Atmosphere-Shuttle Pallet Satellite-2 (CRISTA-SPAS-2) was taken early in the flight (August 7, 1997) over northwest Canada. The viewing direction is east. The swirl of cloud indicates a storm which tracked over Canada during the flight, limiting the topographic photo opportunities for the subsequent several days.
SL2-05-389 (22 June 1973) --- This scene displays the southeastern part of Michigan's Lower Peninsula and adjacent Ontario, Canada (43.0N, 84.0W). Detroit can be recognized by its radial pattern of development and sediment plumes in the rivers from the massive industrial activity. The area pockmarked by lakes northwest of Detroit essentially outlines the limits of the Defiance Moraine caused by the stagnation and melting of Ice Age glaciers. Photo credit: NASA
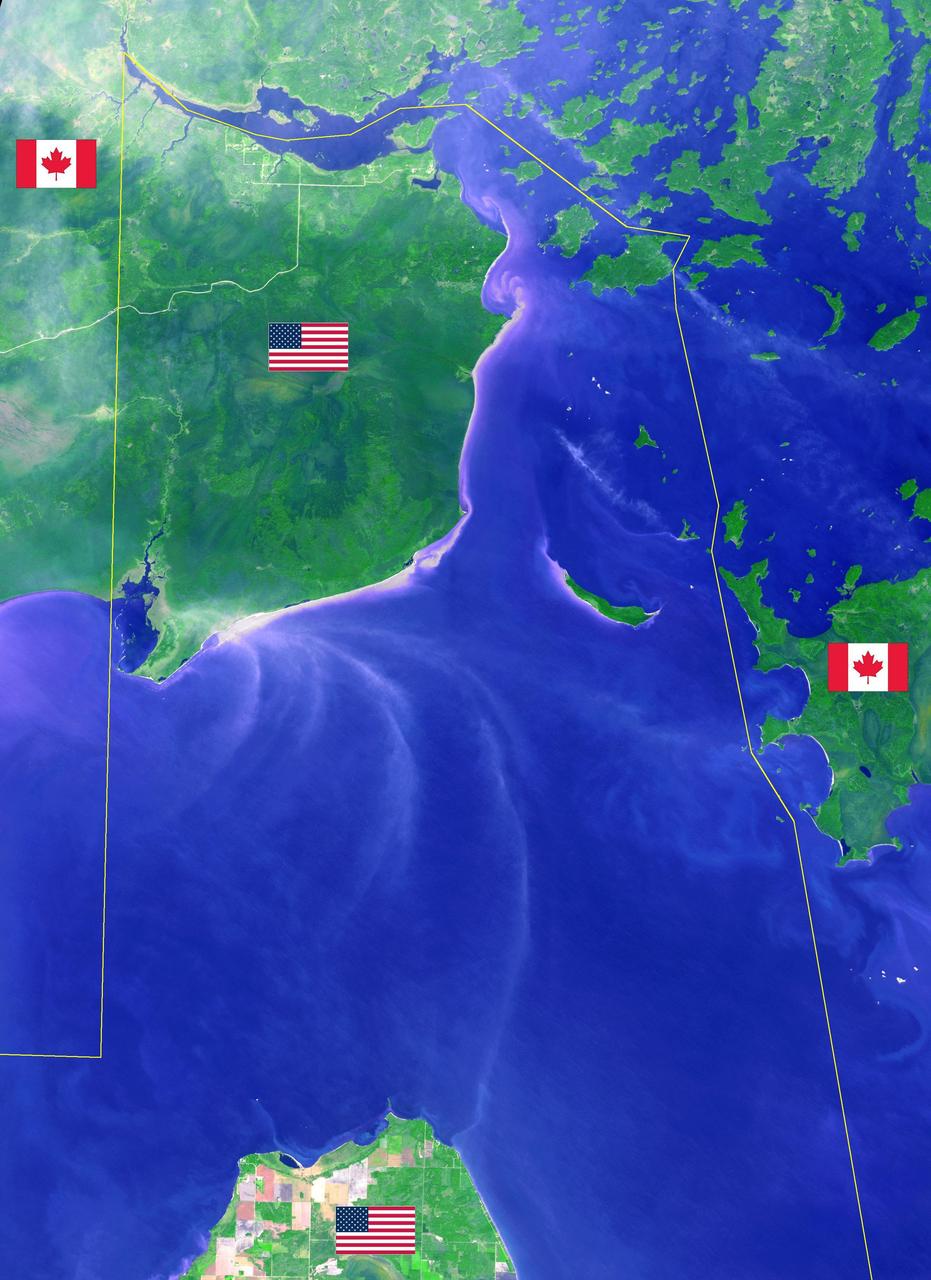
Minnesota's Northwest Angle is the northernmost point of the continental United States. The Angle became part of the US due to a map error during the 1783 Treaty of Paris. Located in the Lake of the Woods, driving there requires crossing the US-Canada border twice. The image was acquired September 22, 2013, covers an area of 40 by 55 km, and is located at 49.2 degrees north, 95.1 degrees west. https://photojournal.jpl.nasa.gov/catalog/PIA21997
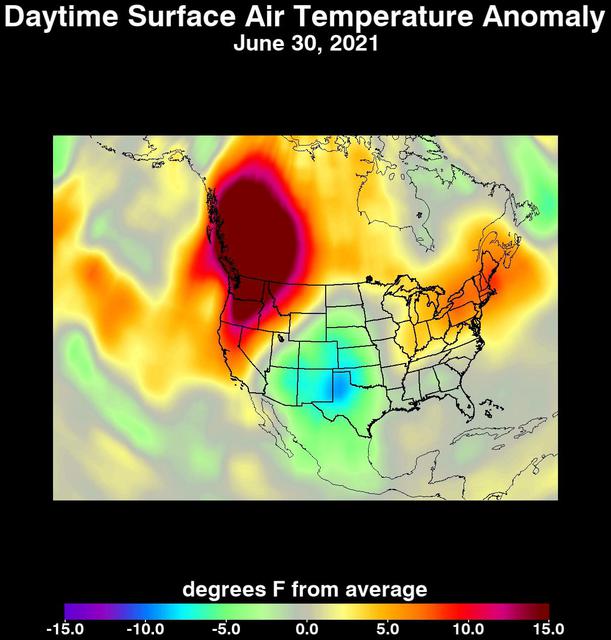
An unprecedented heat wave that started around June 26, 2021, smashed numerous all-time temperature records in the Pacific Northwest and western Canada. NASA's Atmospheric Infrared Sounder (AIRS), aboard the Aqua satellite, captured the progression of this slow-moving heat dome across the region from June 21 to 30. This animation of AIRS data shows surface air temperature anomalies, or values above or below long-term averages. Surface air temperature is something that people directly feel when they are outside. Some of the temperature anomalies were greater than 20 degrees Fahrenheit above the long-term average. On June 28, Quillayute, Washington, set an all-time high temperature record of 110 degrees Fahrenheit (43 degrees Celsius), shattering the old record of 99 degrees Fahrenheit (37 degrees Celsius). In British Columbia, the village of Lytton set a new all-time record for Canada at 119 degrees Fahrenheit (48 degrees Celsius) on June 29, only to break it the next day with a reading of 121 degrees Fahrenheit (49 degrees Celsius). The AIRS instrument recorded similar temperature anomalies at an altitude of about 10,000 feet (3,000 meters), showing that the extreme heat also affected mountainous regions. And temperature anomalies at roughly 18,000 feet (5,500 meters) demonstrated that the heat dome extended high into Earth's troposphere, creating the conditions for intense heat at the planet's surface that are normally found further south. Animation available at https://photojournal.jpl.nasa.gov/catalog/PIA24537
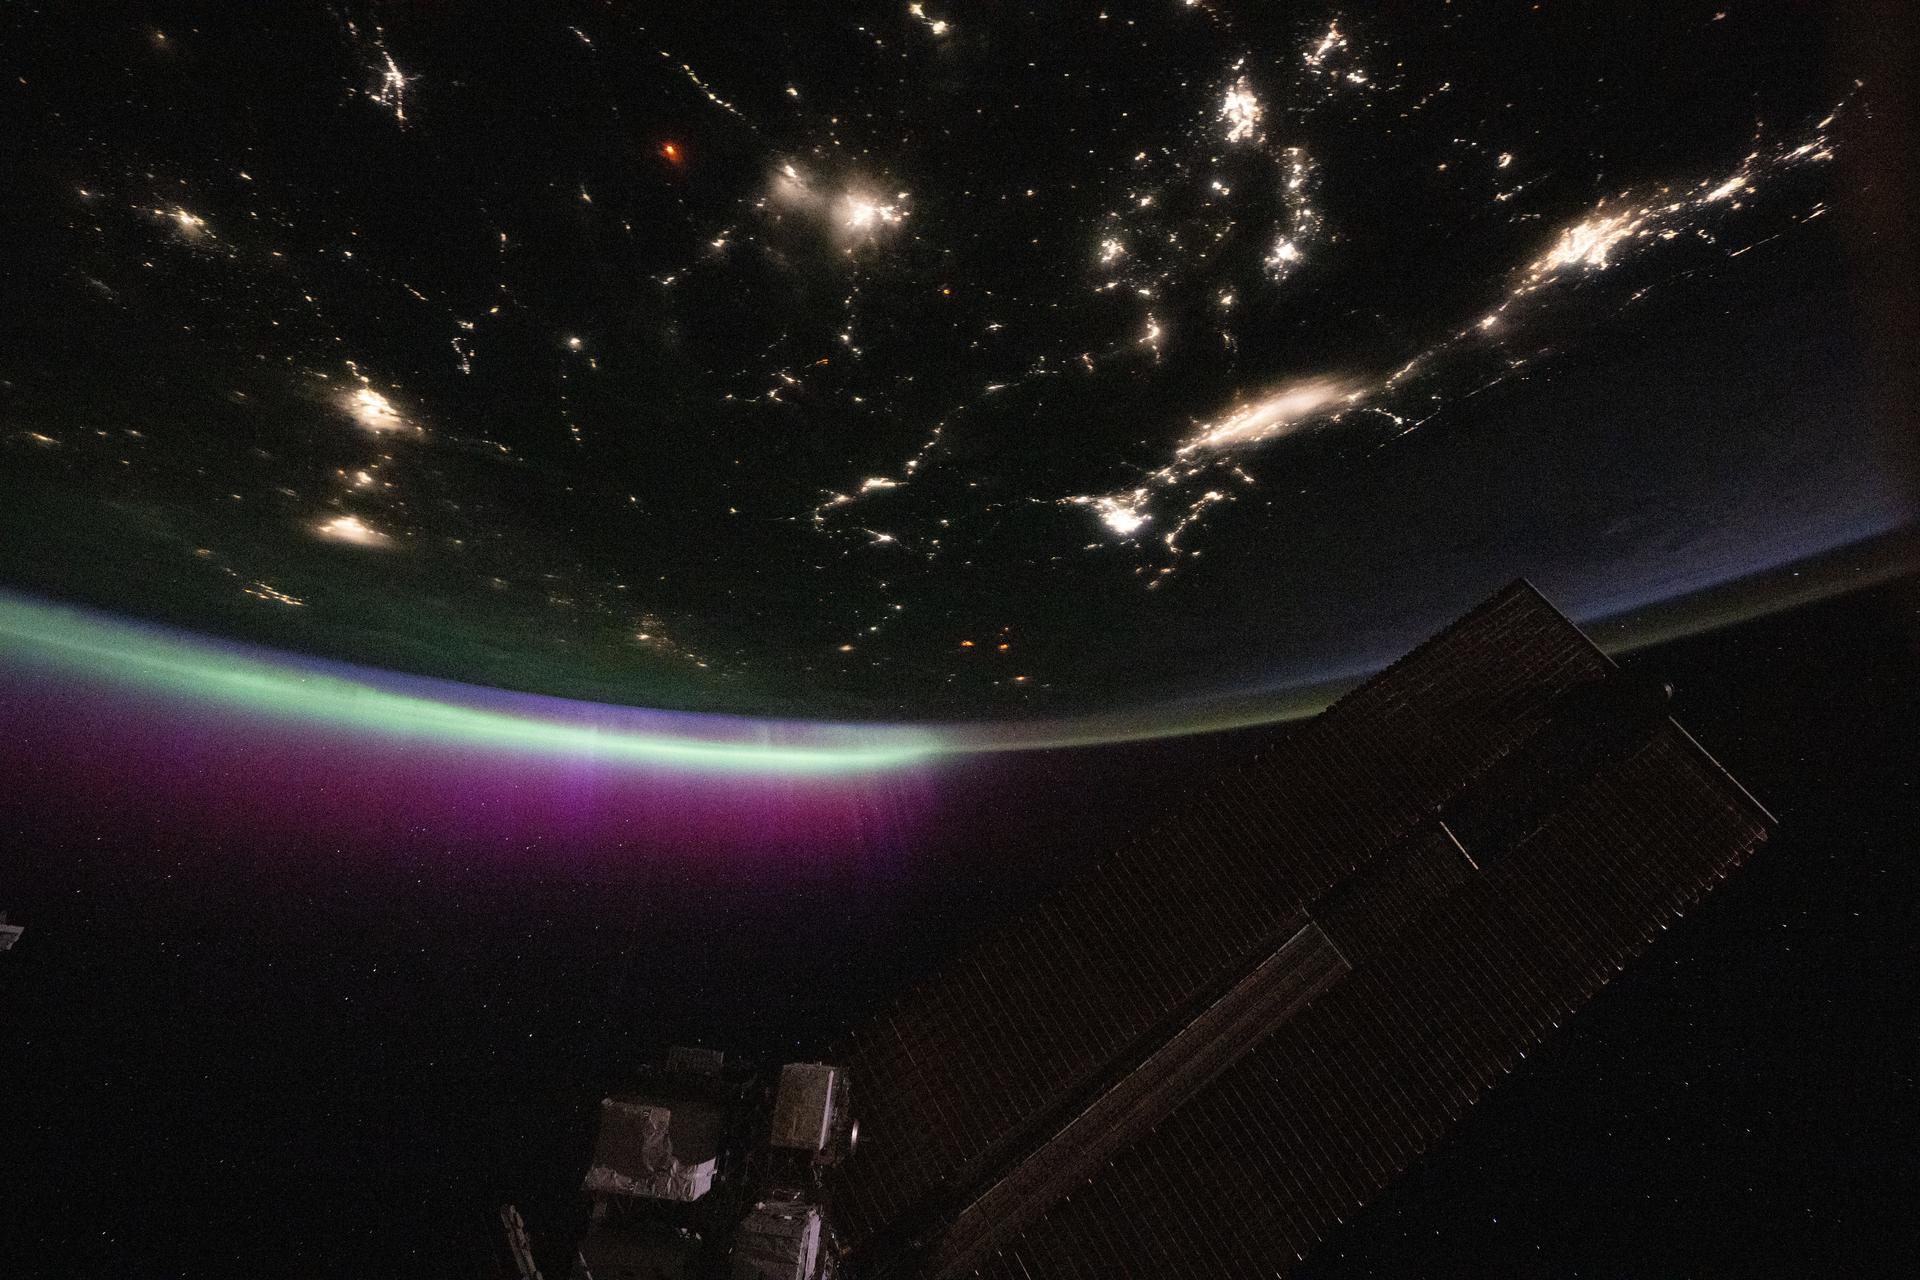
iss073e0780439 (Sept. 2, 2025) --- A diffuse aurora glows above Earth's horizon over Canada as its red and green hues shimmer like neon lights—an effect created by excited oxygen atoms high in the atmosphere. The city lights of the U.S.-Canadian Pacific Northwest (toward upper right) trace the continent eastward. The red aurora is produced by high-altitude oxygen atoms (~300 km), while the green glow comes from lower-altitude oxygen (~100 km), both excited by energetic electrons guided into the atmosphere by Earth's magnetic field during solar activity.
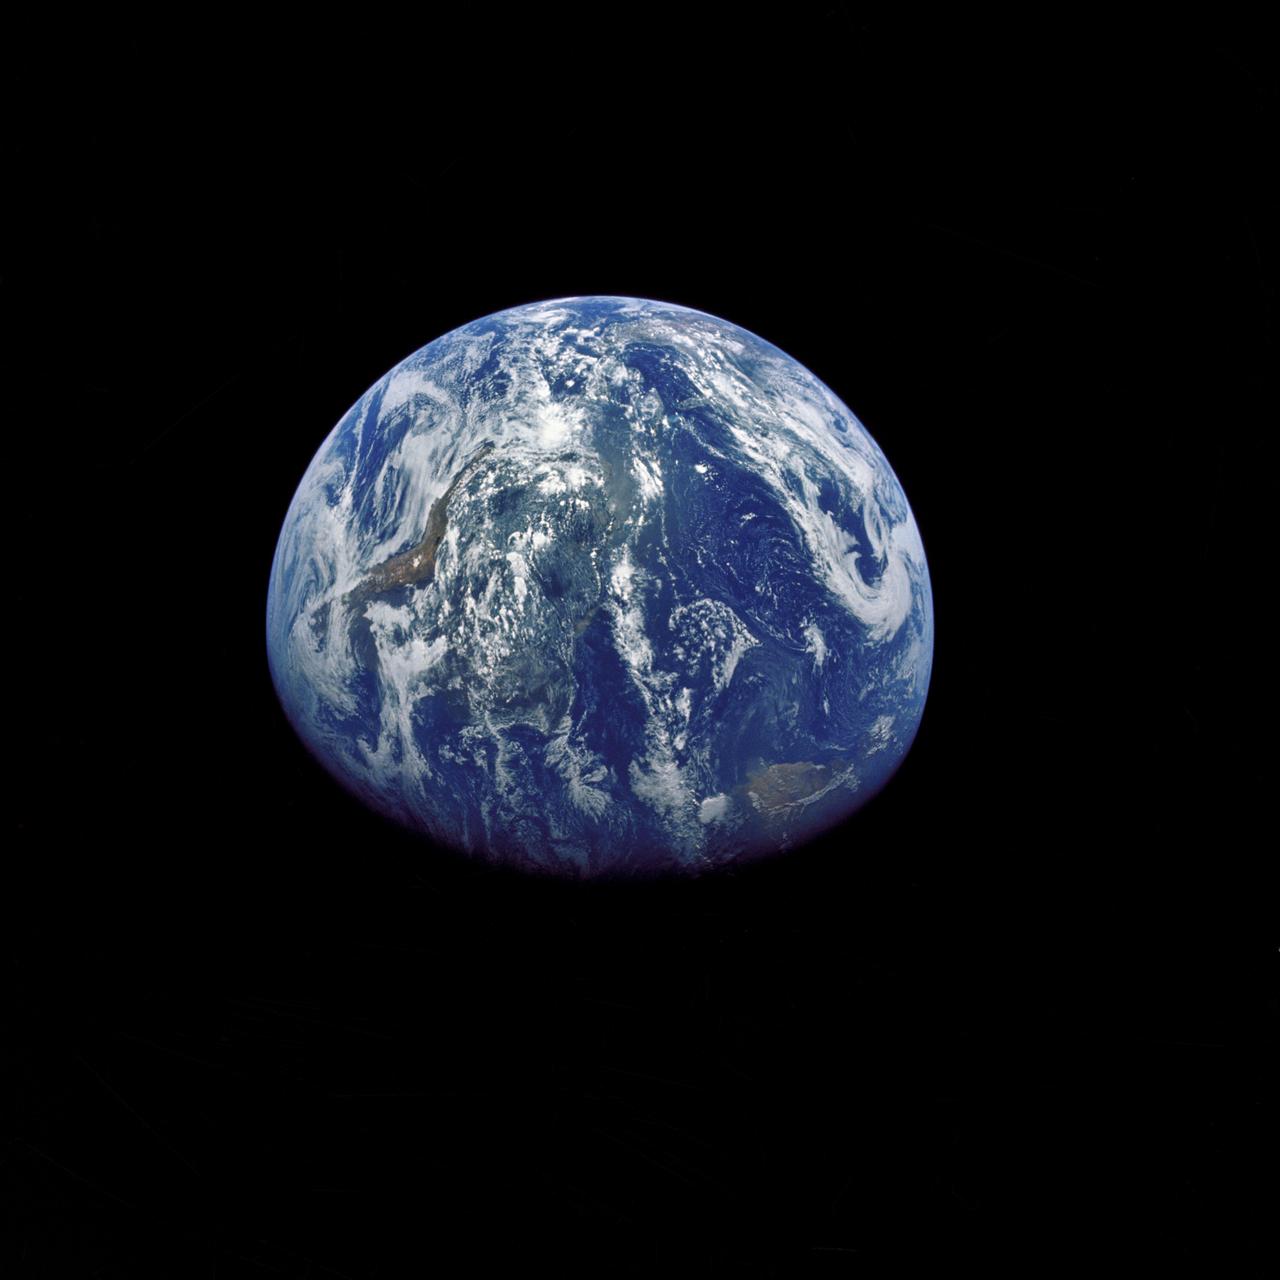
AS15-91-12343 (26 July 1971) --- This view of Earth was photographed by the Apollo 15 crewmen as they sped toward the fourth lunar landing. The spacecraft was between 25,000 and 30,000 nautical miles from Earth when this photo was made. The United States (note Florida), Central America and part of Canada can be seen at the left side of the picture, with South America at lower center. Spain and the northwest part of Africa can be seen at right. The Bahamas Banks, unique geological feature, can be seen (different shade of blue) east of Florida. Also note large North Atlantic storm front moving over Greenland in upper center.
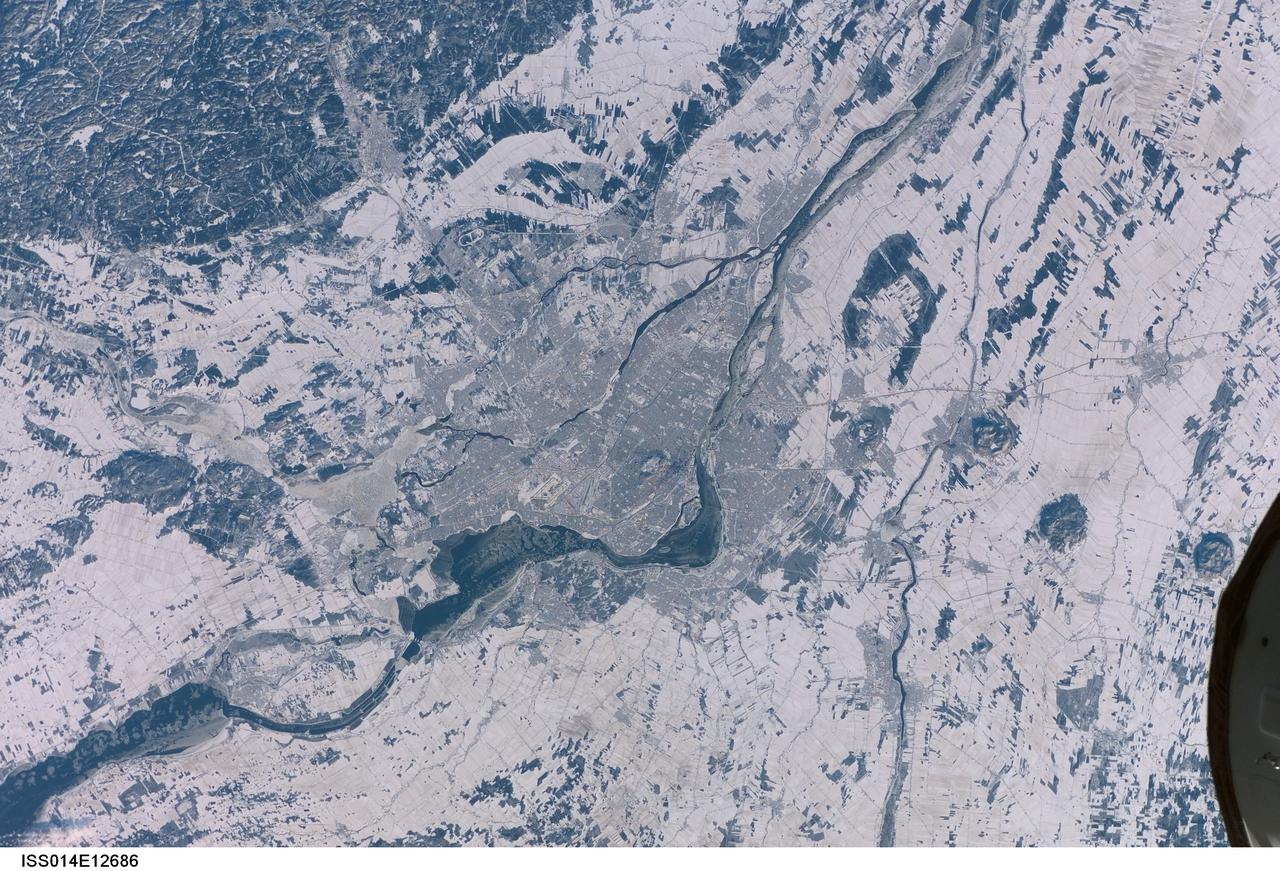
ISS014-E-12686 (21 Jan. 2007) --- This wintry scene of Quebec Province in Canada was photographed by one of the Expedition 14 crew members aboard the Earth-orbiting International Space Station. In 1535 Jacques Cartier landed on an island in the St. Lawrence River and named a 233 meter-high mountain Mount Royal. Montreal is a city on that island that grew up around the mountain. The city of Montreal (near center frame) is located on the Ile de Montreal to the northwest of the St. Lawrence river (the wider body of water). It was not until 1642 that Ville Marie, founded by missionaries, would officially become the city of Montreal. The cityscape contrasts well with the farmland and natural forests in this summer view. Today Montreal is the largest city in the province of Quebec, and is the second most populous metropolitan area in Canada -- in 1991 the population was just more than one million in the city and 3,127,242 in the metropolitan area. While owing its early growth to the fur trade, the city is a leading producer of aircraft, chemical and pharmaceutical products, and is a major petroleum production center. Nearly half of Canada's .8 billion aerospace industry is located in the Montreal area.
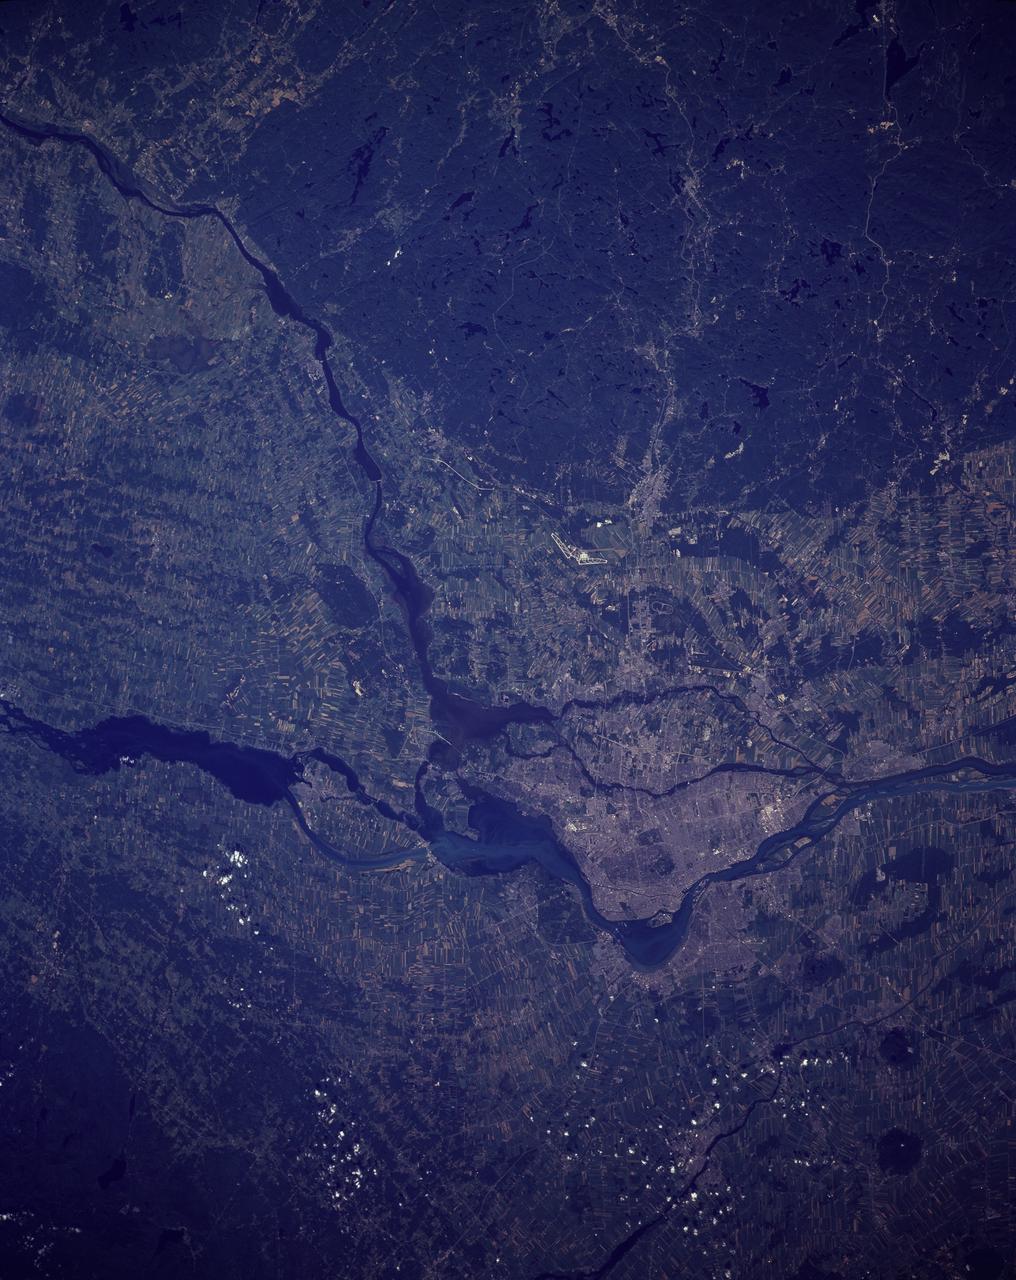
STS085-506-081 (7-19 August 1997) --- Montreal is a city on an island that grew up around the mountain -- in 1535 Jacques Cartier landed on an island in the St. Lawrence River and named a 233 meter-high mountain Mount Royal. It was not until 1642 that Ville Marie, founded by missionaries, would officially become the city of Montreal. The cityscape contrasts well with the farmland and natural forests in this summer view. Today Montreal is the largest city in the province of Quebec, and is the second most populous metropolitan area in Canada -- in 1991 the population was just more than one million in the city and 3,127,242 in the metropolitan area. While owing its early growth to the fur trade, the city is a leading producer of aircraft, chemical and pharmaceutical products, and is a major petroleum production center. Nearly half of Canada's .8 billion aerospace industry is located in the Montreal area. In the image captured by the astronauts, the lighter blue, wide river is the St. Lawrence. The city of Montreal is located on the Ile de Montreal to the northwest of the St. Lawrence river. The Ottawa River enters the St. Lawrence near the center of the view. Mirabel International Airport stands out well, on the north side of the city. The long, narrow strips of land in the image are indicative of French agricultural land use. The narrow ends of farmlands are oriented perpendicular to rivers so that more farmers will have access to water resources.
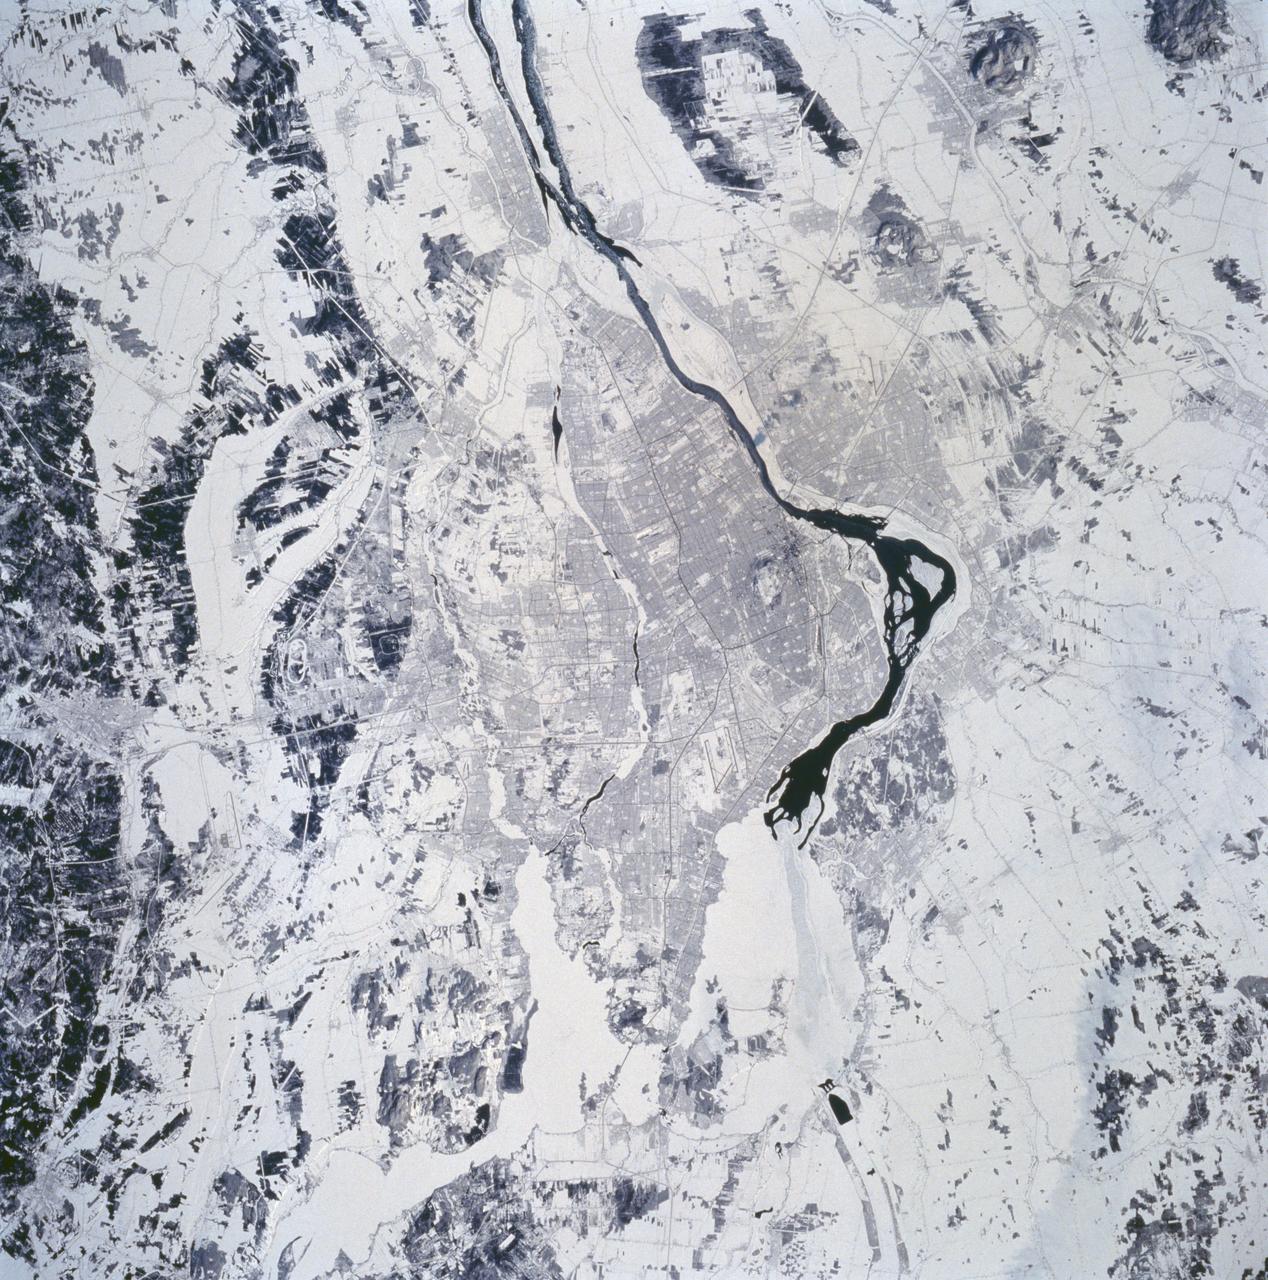
STS060-94-072 (3-11 Feb 1994) --- The city of Montreal is located on the island of Montreal at the confluence of the St. Lawrence and Ottawa Rivers. Despite its distance from the sea (1,000 miles) Montreal is a large inland port. It is also Canada's largest city and the second largest French speaking city in the world. This particular snow covered scene highlights the major highways and street patterns throughout the metropolitan Montreal area. The runways of the two large international airports of Mirabel (located 25 miles northwest of downtown Montreal) and Dorval (located approximately 8 miles west of the downtown area) are clearly visible on this photograph. Even the outline of Mount Royal Park, an imposing hilly feature near the downtown central business district, can be seen. Patches of open, ice-free (very dark areas) are detectable as the St. Lawrence River (Seaway) makes its way along the south and southeastern side of Montreal.
ISS012-E-15918 (24 Jan. 2006) --- Belle Isle and a portion of Newfoundland, Canada are featured in this image photographed by an Expedition 12 crew member on the International Space Station. Belle Isle (center) is surrounded by sea ice in this recent winter view. Belle Isle lies in the strait between the Island of Newfoundland and Labrador (the mainland portion of Canada’s province of Newfoundland). Small islands along the coast of Labrador appear in the top left corner. In this key location Belle Isle lies on the shortest shipping lanes between the Great Lakes and Europe, and also on the main north-south shipping route to Hudson Bay and the Northwest Territories. Snow and ice in this recent winter view obliterate the dozens of glacier-scoured lakes that dot the surface of the island. The single community of Belle Isle Landing on the southeast tip is equally hard to see. Ice patterns also show that the island lies at the meeting point of two sea currents. The Labrador Current flows from the northwest (top left), and a smaller current, driven by dominant westerly winds, flows from the southwest (lower left) out of the narrow Belle Isle Strait (out of frame lower left). Flow lines in sea ice indicate the sense of movement of the ice. Ice floes embedded in the Labrador Current appear in the upper part of the image as a relatively open pattern. Sea ice with a denser pattern enters from the lower left corner, banking against the west side of Belle Isle. Tendrils flow around capes at either end of the island, with an ice-free “shadow” on the opposite, downstream side. Eddies (center) in the ice patterns show where the currents interact, north and west of the island.
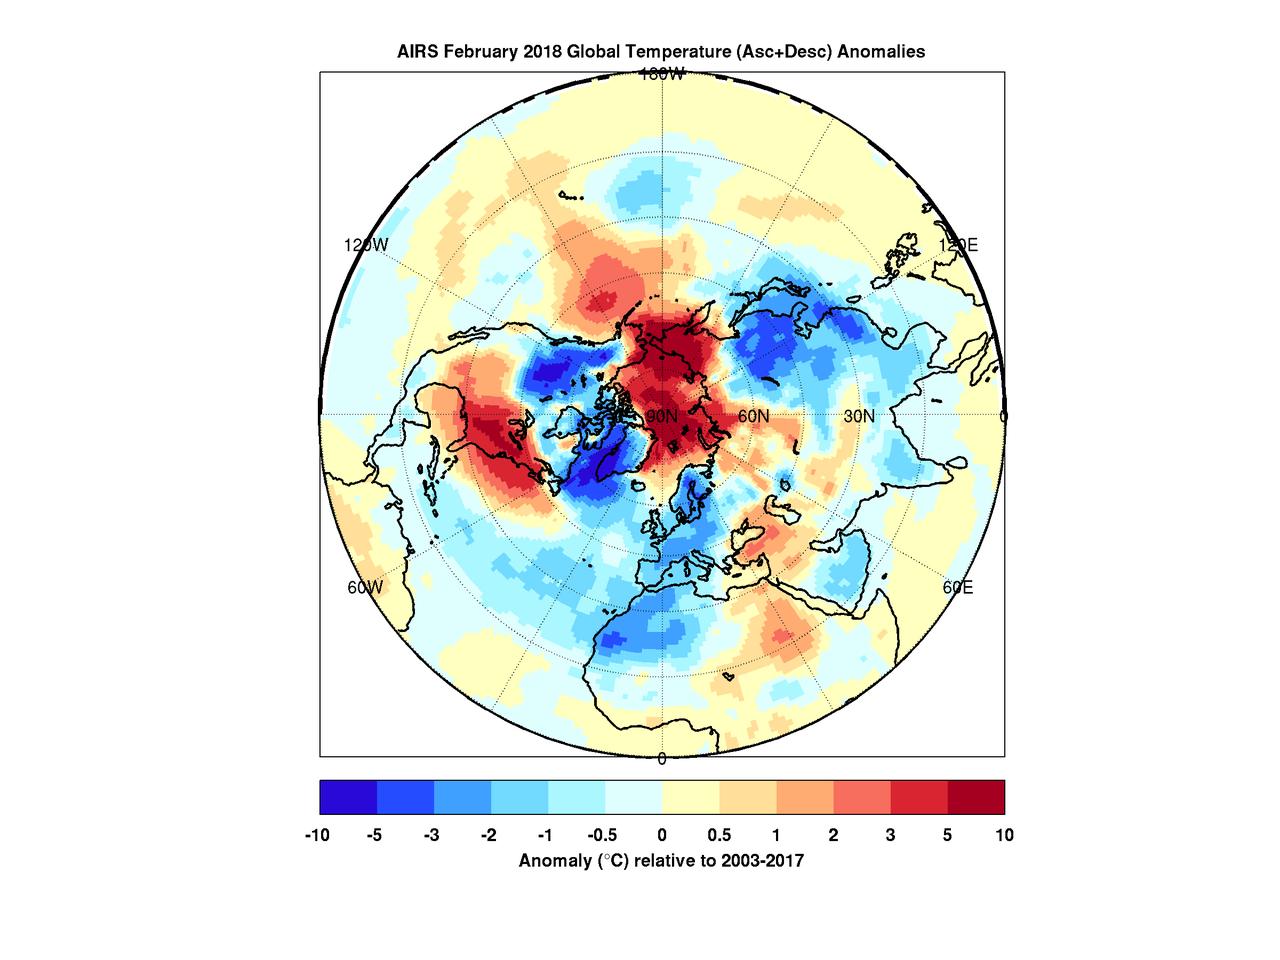
When the polar vortex dips south it often makes headlines. Frigid air, usually confined to the arctic, spills into lower parts of the continent making it a chilly challenge for people going about their day. But there's a warm part to the story as well. While the eastern and southern United States were shivering in January the arctic was experiencing above average temperatures. In maps created with data by the Atmospheric Infrared Sounder (AIRS) on NASA's Aqua satellite, warmer-than-normal temperatures are colored in red and below average temperatures are colored in blue. Provided in geographic and polar projections, the maps show regions of unusually cold air hovering over the eastern and southern U.S., eastern Canada and Greenland in January. February shows colder-than-normal air blanketing the northwest U.S., Canada, Western Europe, northwest Africa and East Asia. In both cases, the arctic remains exceptionally warm. During most winters the polar vortex is like a giant counterclockwise whirlpool spinning around the north pole with cold air at its center. Occasionally the vortex splits and its parts move south, usually over the continents. At the same time, warm air from the south moves in to fill the gap, and that northward movement usually occurs over the oceans. The cold air movement gets the most attention because it typically affects many millions of people. However, that cooling is very often accompanied by warming somewhere over the Arctic -- an equally important part of the polar vortex story that usually goes unnoticed but is very apparent in the images shown here. More images are available at https://photojournal.jpl.nasa.gov/catalog/PIA22344
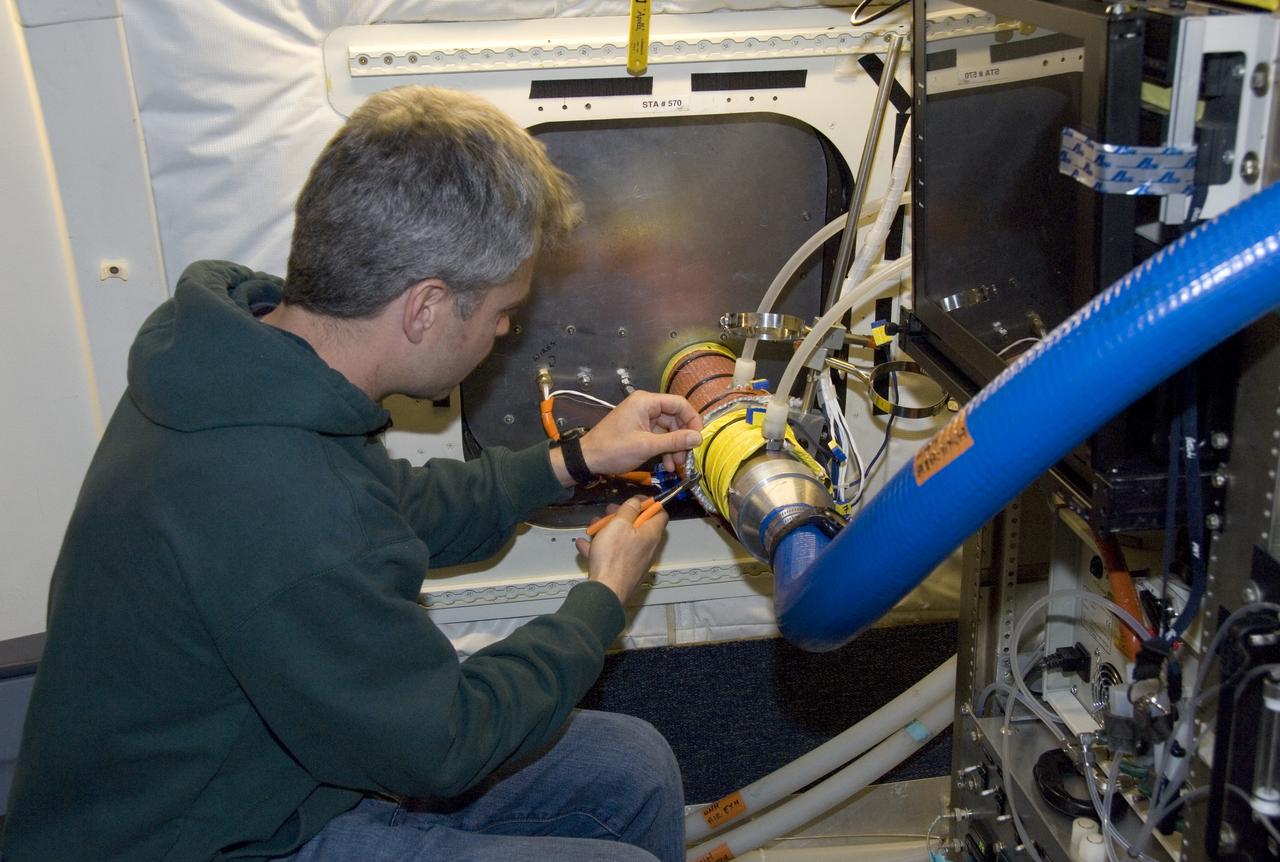
Climate researchers from the National Center for Atmospheric Research (NCAR) and several universities install and perform functional checkouts of a variety of sensitive atmospheric instruments on NASA's DC-8 airborne laboratory prior to beginning the ARCTAS mission.

Climate researchers from the National Center for Atmospheric Research (NCAR) and several universities install and perform functional checkouts of a variety of sensitive atmospheric instruments on NASA's DC-8 airborne laboratory prior to beginning the ARCTAS mission.
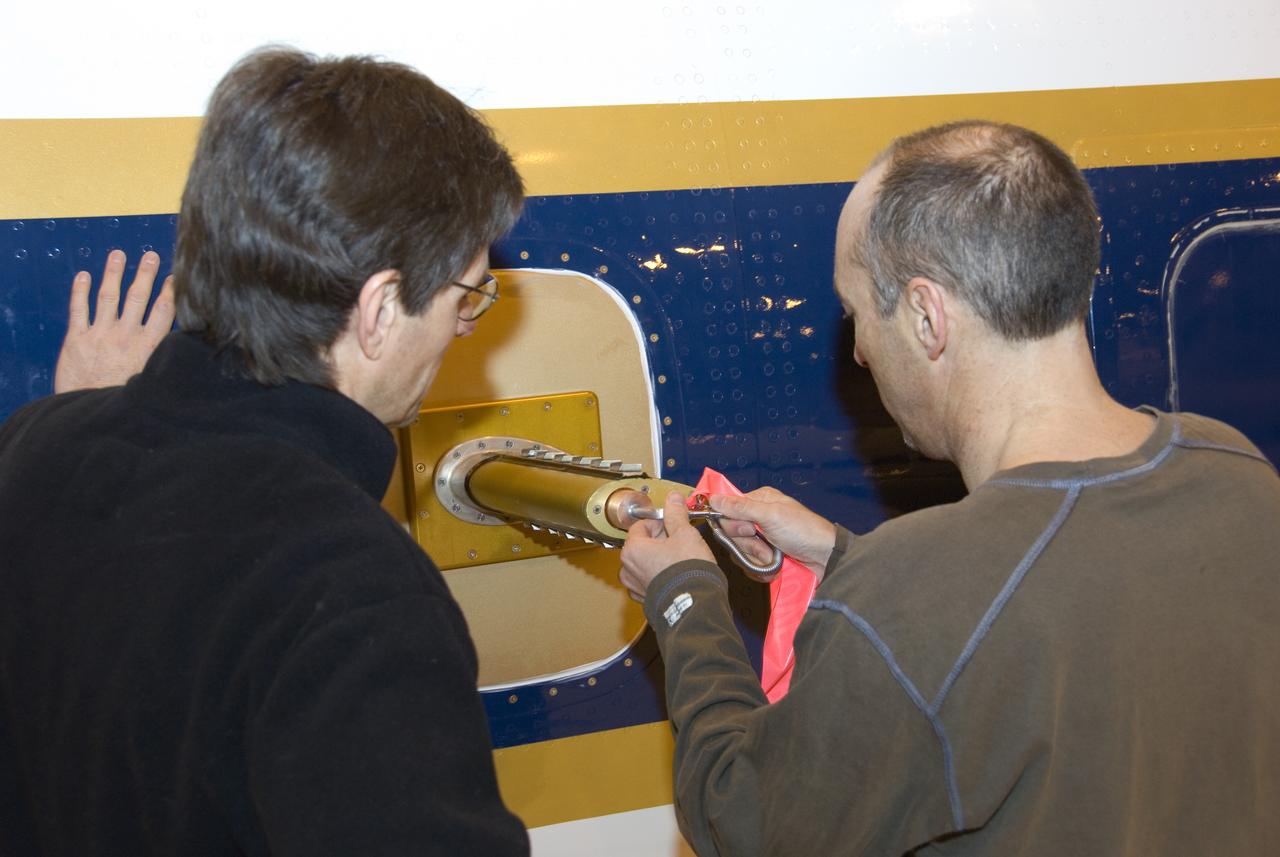
Climate researchers from the National Center for Atmospheric Research (NCAR) and several universities install and perform functional checkouts of a variety of sensitive atmospheric instruments on NASA's DC-8 airborne laboratory prior to beginning the ARCTAS mission.
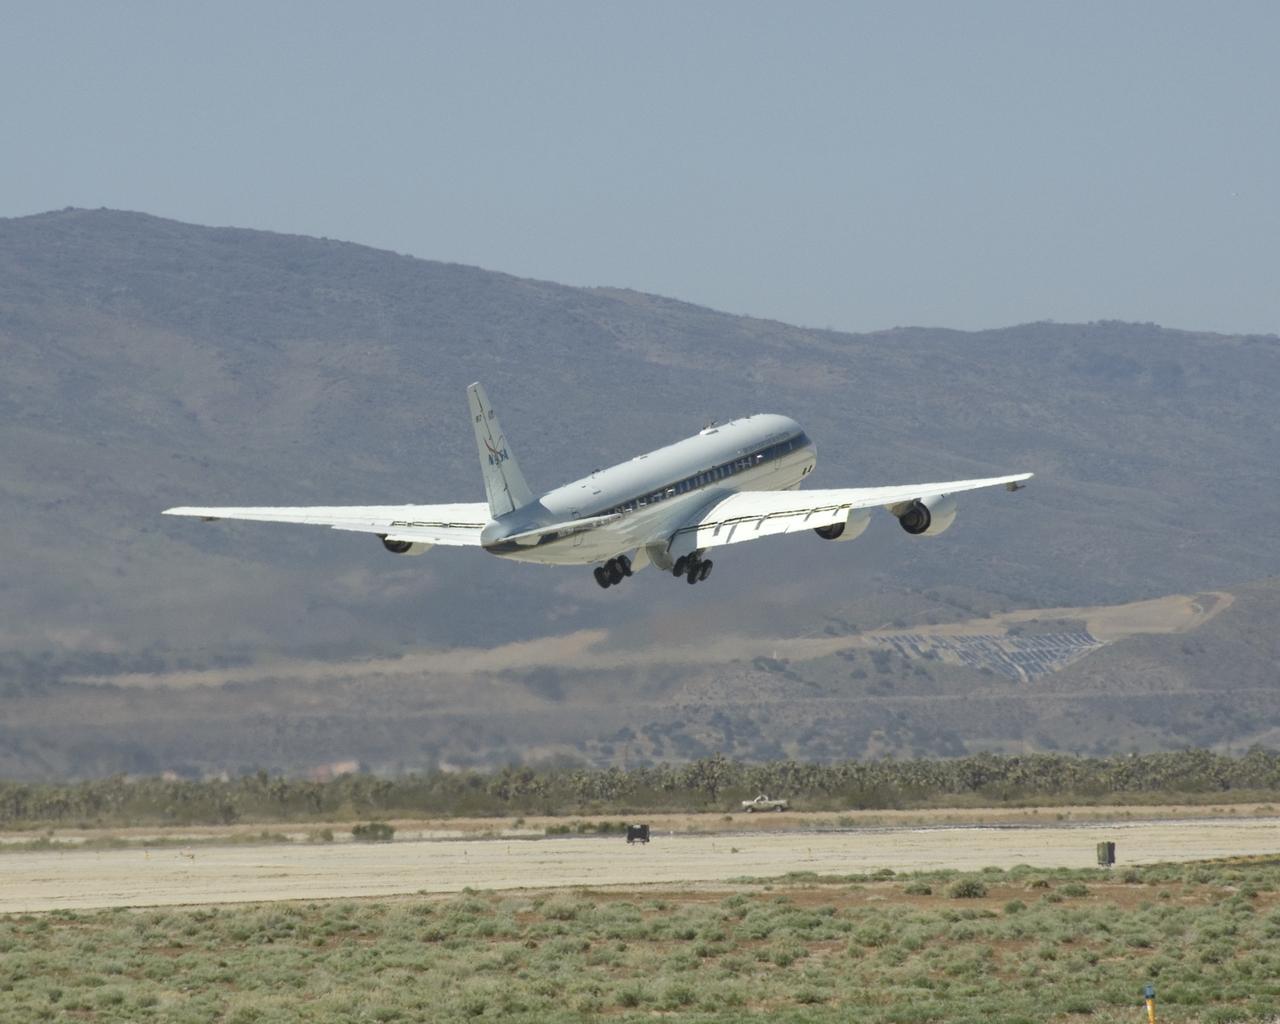
NASA's DC-8 flying laboratory lifts off the runway at Air Force Plant 42 in Palmdale, Calif., on its first flight in the ARCTAS atmospheric science mission.

Climate researchers from the National Center for Atmospheric Research (NCAR) and several universities install and perform functional checkouts of a variety of sensitive atmospheric instruments on NASA's DC-8 airborne laboratory prior to beginning the ARCTAS mission.

Climate researchers from the National Center for Atmospheric Research (NCAR) and several universities install and perform functional checkouts of a variety of sensitive atmospheric instruments on NASA's DC-8 airborne laboratory prior to beginning the ARCTAS mission.
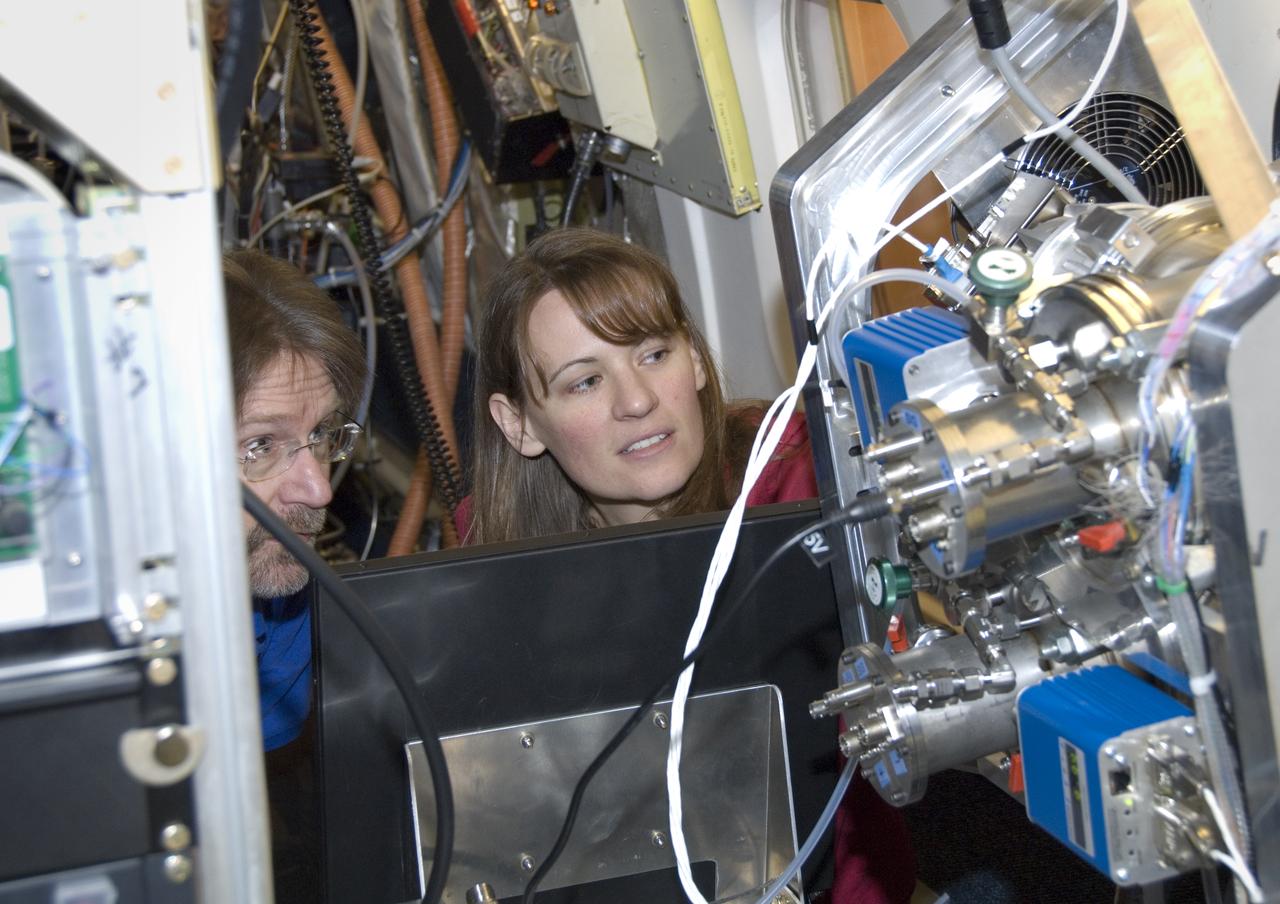
Climate researchers from the National Center for Atmospheric Research (NCAR) and several universities install and perform functional checkouts of a variety of sensitive atmospheric instruments on NASA's DC-8 airborne laboratory prior to beginning the ARCTAS mission.
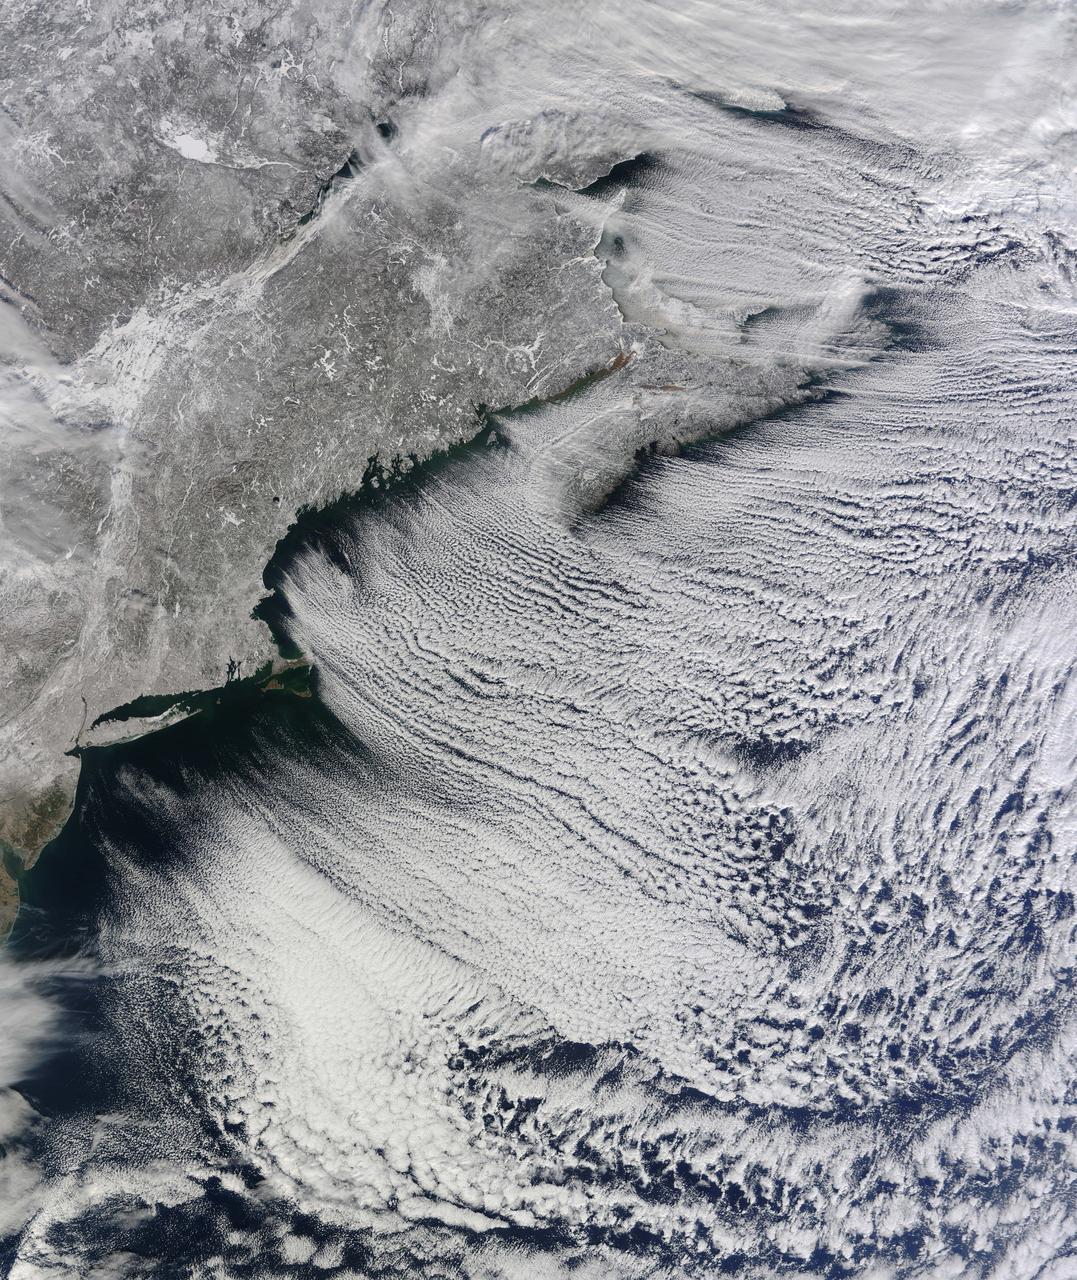
NASA image acquired January 24, 2011 What do you get when you mix below-freezing air temperatures, frigid northwest winds from Canada, and ocean temperatures hovering around 39 to 40 degrees Fahrenheit (4 to 5 degrees Celsius)? Paved highways of clouds across the skies of the North Atlantic. The Moderate Resolution Imaging Spectroradiometer (MODIS) on NASA’s Terra satellite collected this natural-color view of New England, the Canadian Maritimes, and coastal waters at 10:25 a.m. U.S. Eastern Standard Time on January 24, 2011. Lines of clouds stretch from northwest to southeast over the North Atlantic, while the relatively cloudless skies over land afford a peek at the snow that blanketed the Northeast just a few days earlier. Cloud streets form when cold air blows over warmer waters, while a warmer air layer—or temperature inversion—rests over top of both. The comparatively warm water of the ocean gives up heat and moisture to the cold air mass above, and columns of heated air—thermals—naturally rise through the atmosphere. As they hit the temperature inversion like a lid, the air rolls over like the circulation in a pot of boiling water. The water in the warm air cools and condenses into flat-bottomed, fluffy-topped cumulus clouds that line up parallel to the wind. Though they are easy to explain in a broad sense, cloud streets have a lot of mysteries on the micro scale. A NASA-funded researcher from the University of Wisconsin recently observed an unusual pattern in cloud streets over the Great Lakes. Cloud droplets that should have picked up moisture from the atmosphere and grown in size were instead shrinking as they moved over Lake Superior. Read more in an interview at What on Earth? NASA image by Jeff Schmaltz, MODIS Rapid Response Team, Goddard Space Flight Center. Caption by Michael Carlowicz. Instrument: Terra - MODIS Credit: <b><a href="http://www.earthobservatory.nasa.gov/" rel="nofollow"> NASA Earth Observatory</a></b> <b><a href="http://www.nasa.gov/centers/goddard/home/index.html" rel="nofollow">NASA Goddard Space Flight Center</a></b> enables NASA’s mission through four scientific endeavors: Earth Science, Heliophysics, Solar System Exploration, and Astrophysics. Goddard plays a leading role in NASA’s accomplishments by contributing compelling scientific knowledge to advance the Agency’s mission. <b>Follow us on <a href="http://twitter.com/NASA_GoddardPix" rel="nofollow">Twitter</a></b> <b>Join us on <a href="http://www.facebook.com/pages/Greenbelt-MD/NASA-Goddard/395013845897?ref=tsd" rel="nofollow">Facebook</a></b>
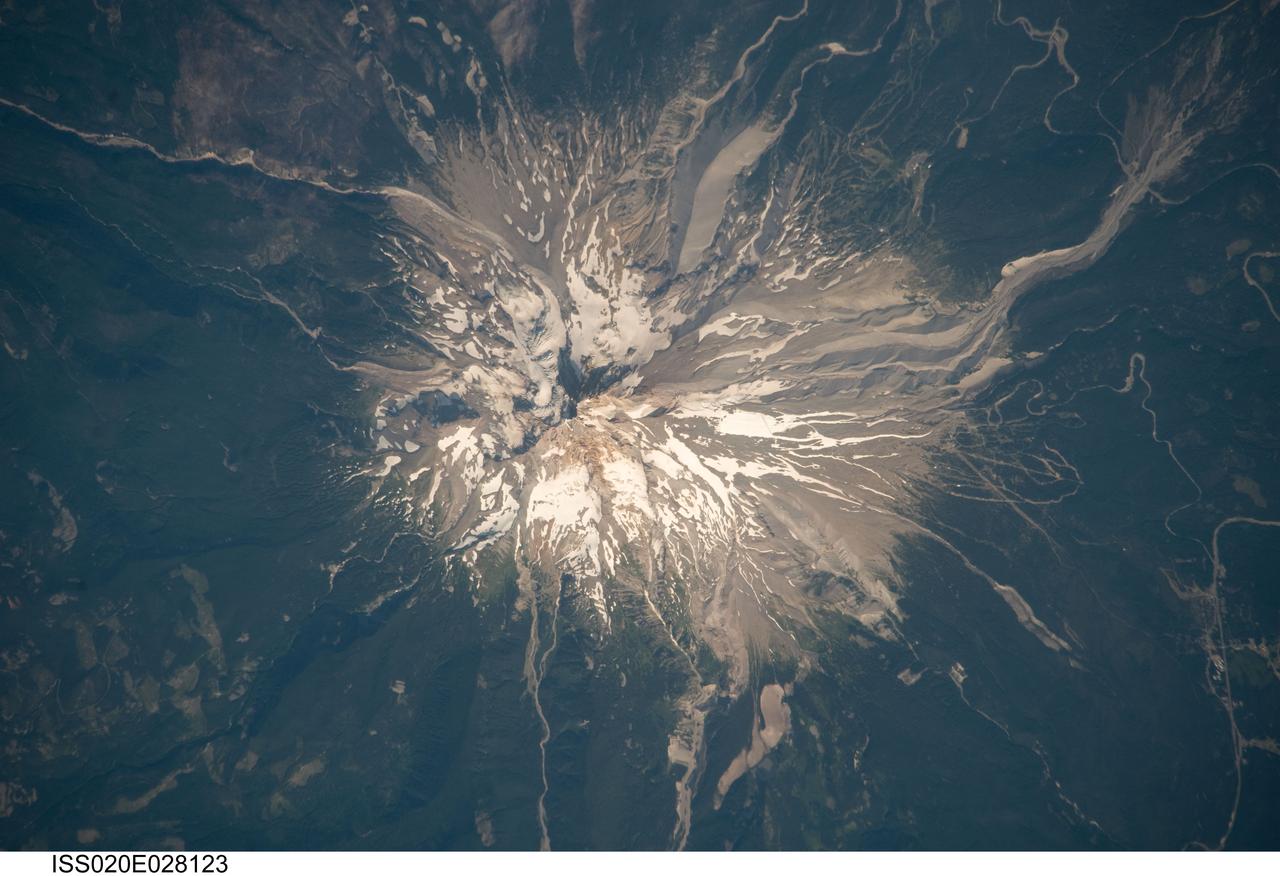
ISS020-E-028123 (5 Aug. 2009) --- Mount Hood, Oregon is featured in this image photographed by an Expedition 20 crew member on the International Space Station. Mount Hood is located within the Cascade Range of the western United States, and is the highest peak (3,426 m) in Oregon. The Cascade Range is characterized by a line of volcanoes associated with a slab of oceanic crust that is subducting, or descending underneath, the westward moving continental crust of North America. Magma generated by the subduction process rises upward through the crust and feeds a line of active volcanoes that extends from northern California in the United States to southern British Columbia in Canada. While hot springs and steam vents are still active on Mount Hood, the last eruption from the volcano occurred in 1866. The volcano is considered dormant, but still actively monitored. Separate phases of eruptive activity produced pyroclastic flows and lahars ? mudflows ? that carried erupted materials down all of the major rivers draining the volcano. Gray volcanic deposits extend southwards along the banks of the White River (upper right), and form several prominent ridges along the southeast to southwest flanks of the volcano. The deposits contrast sharply with the green vegetated lower flanks of the volcano. The Mount Hood stratovolcano ? a typically cone-shaped volcanic structure formed by interlayered lava flows and explosive eruption deposits ? hosts twelve mapped glaciers along its upper flanks (center). Like other glaciers in the Pacific Northwest, the Hood glaciers have been receding due to global warming, and have lost an estimated 61 percent of their volume over the past century. The predicted loss of glacial meltwater under future warming scenarios will have significant effects on regional hydrology and water supplies.
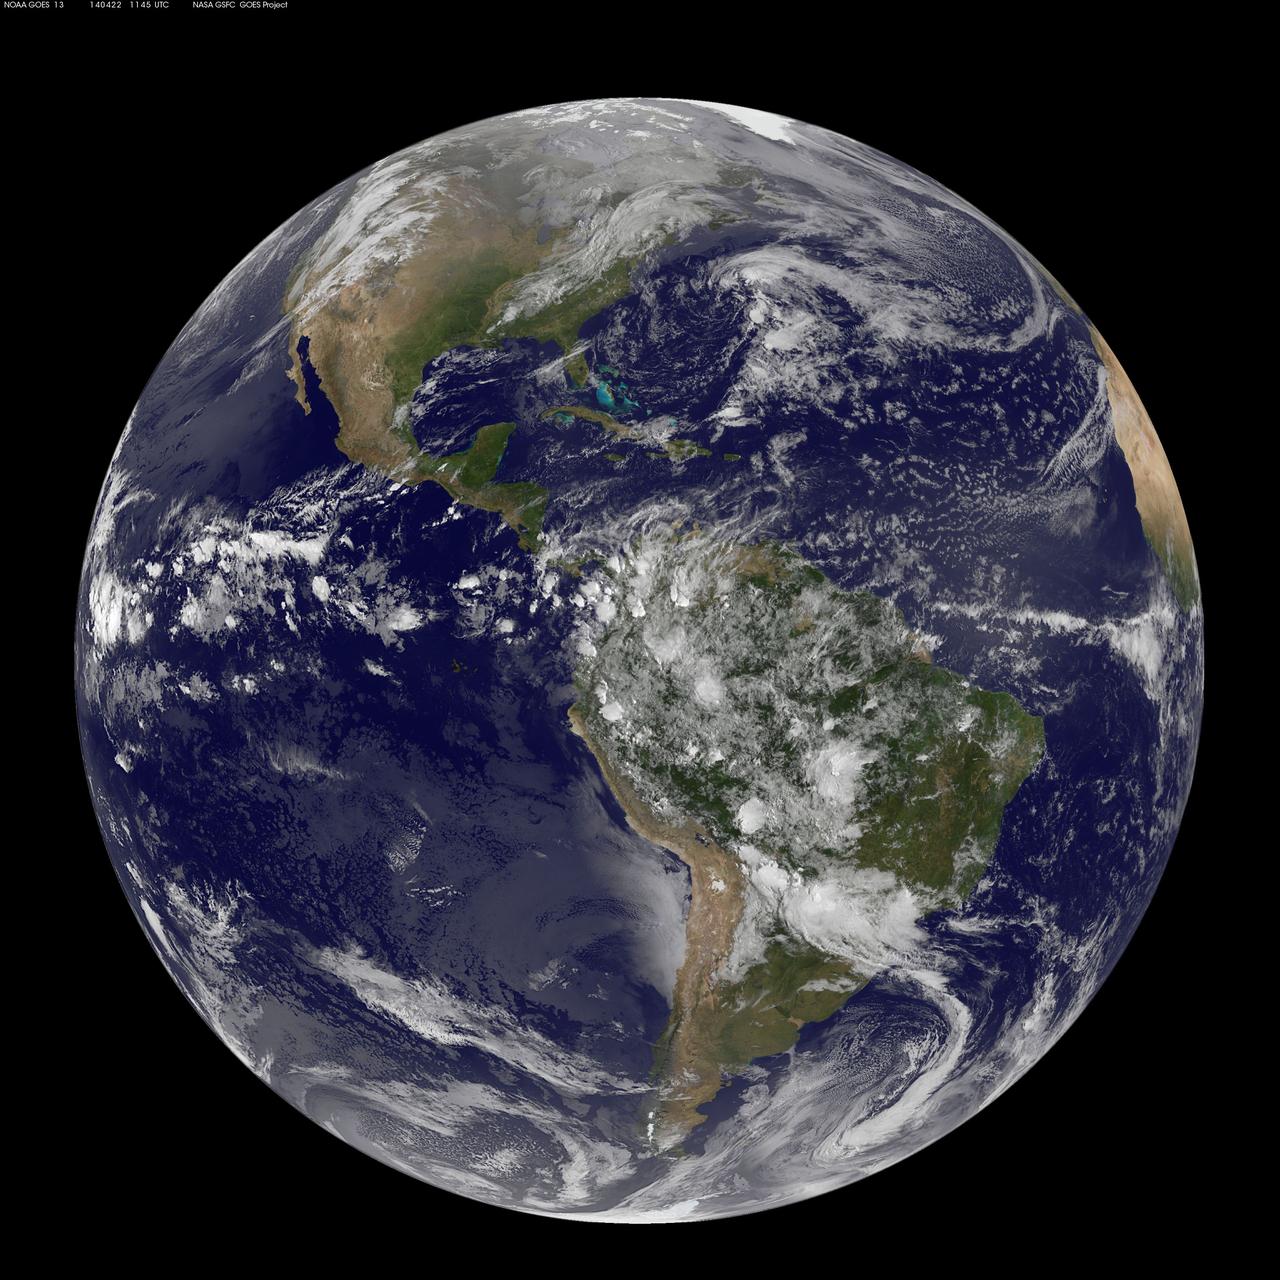
Today, April 22, 2014 is Earth Day, and what better way to celebrate than taking a look at our home planet from space. NOAA's GOES-East satellite captured this stunning view of the Americas on Earth Day, April 22, 2014 at 11:45 UTC/7:45 a.m. EDT. The data from GOES-East was made into an image by the NASA/NOAA GOES Project at NASA's Goddard Space Flight Center in Greenbelt, Md. In North America, clouds associated with a cold front stretch from Montreal, Canada, south through the Tennessee Valley, and southwest to southern Texas bringing rain east of the front today. A low pressure area in the Pacific Northwest is expected to bring rainfall in Oregon, Washington, Idaho, stretching into the upper Midwest, according to NOAA's National Weather Service. That low is also expected to bring precipitation north into the provinces of British Columbia and Alberta, Canada. Another Pacific low is moving over southern Nevada and the National Weather Service expects rain from that system to fall in central California, Nevada, and northern Utah. Near the equator, GOES imagery shows a line of pop up thunderstorms. Those thunderstorms are associated with the Intertropical Convergence Zone (ITCZ). The ITCZ encircles the Earth near the equator. In South America, convective (rapidly rising air that condenses and forms clouds) thunderstorms pepper Colombia, Venezuela, Ecuador, Peru, Bolivia, Paraguay and northwestern and southeastern Brazil. GOES satellites provide the kind of continuous monitoring necessary for intensive data analysis. Geostationary describes an orbit in which a satellite is always in the same position with respect to the rotating Earth. This allows GOES to hover continuously over one position on Earth's surface, appearing stationary. As a result, GOES provide a constant vigil for the atmospheric "triggers" for severe weather conditions such as tornadoes, flash floods, hail storms and hurricanes. For more information about GOES satellites, visit: <a href="http://www.goes.noaa.gov/" rel="nofollow">www.goes.noaa.gov/</a> or <a href="http://goes.gsfc.nasa.gov/" rel="nofollow">goes.gsfc.nasa.gov/</a> Rob Gutro NASA's Goddard Space Flight Center <b><a href="http://www.nasa.gov/audience/formedia/features/MP_Photo_Guidelines.html" rel="nofollow">NASA image use policy.</a></b> <b><a href="http://www.nasa.gov/centers/goddard/home/index.html" rel="nofollow">NASA Goddard Space Flight Center</a></b> enables NASA’s mission through four scientific endeavors: Earth Science, Heliophysics, Solar System Exploration, and Astrophysics. Goddard plays a leading role in NASA’s accomplishments by contributing compelling scientific knowledge to advance the Agency’s mission. <b>Follow us on <a href="http://twitter.com/NASAGoddardPix" rel="nofollow">Twitter</a></b> <b>Like us on <a href="http://www.facebook.com/pages/Greenbelt-MD/NASA-Goddard/395013845897?ref=tsd" rel="nofollow">Facebook</a></b> <b>Find us on <a href="http://instagram.com/nasagoddard?vm=grid" rel="nofollow">Instagram</a></b>
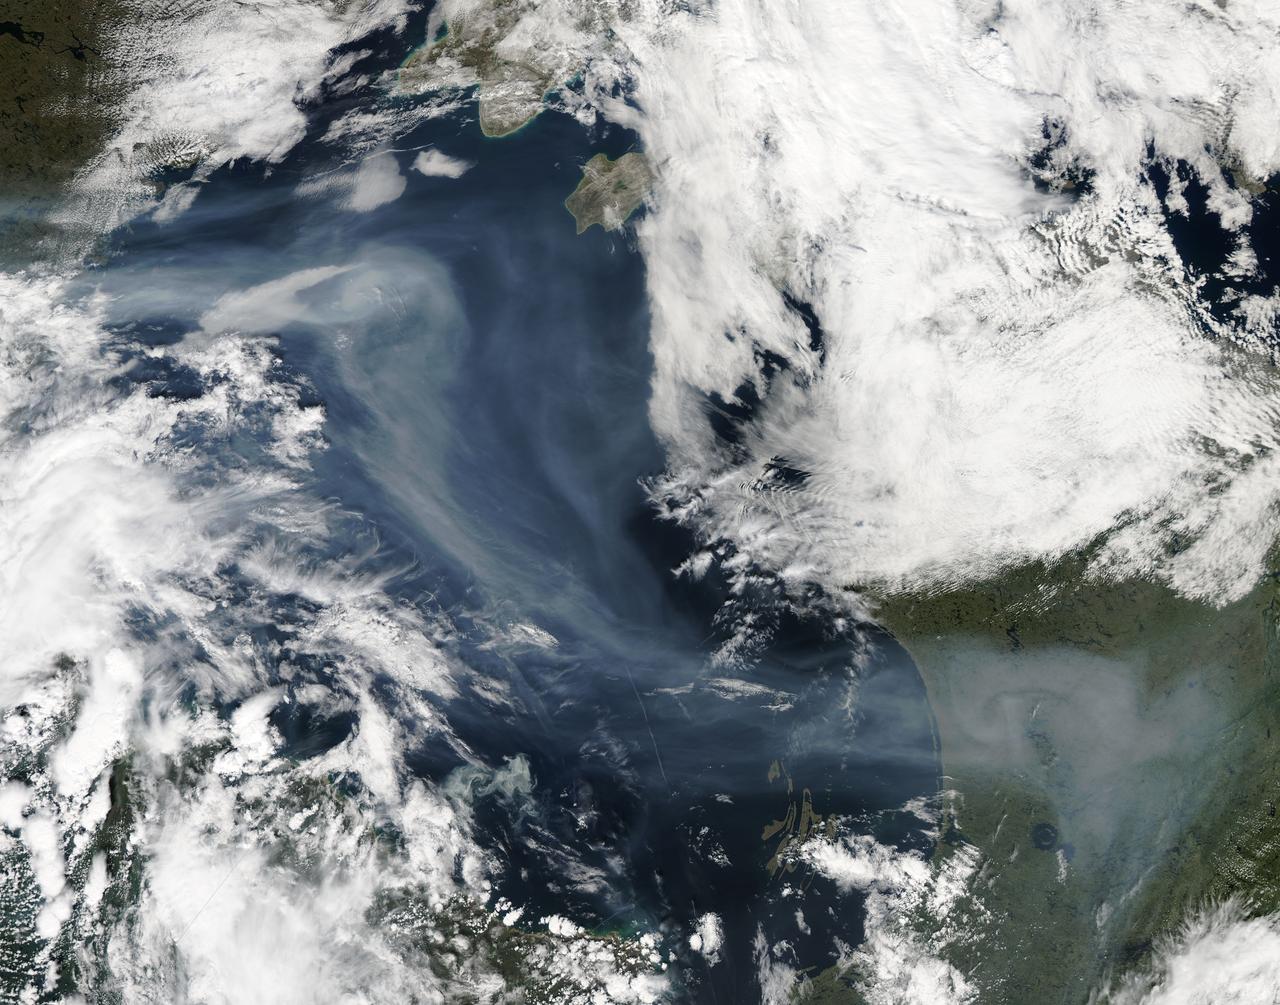
A vigorous summer fire season continued through July, 2013 as many large wildfires continued to burn in the forests of northern Canada. The high fire activity not only laid waste to thousands of hectares of boreal forest, but sent thick smoke billowing high into the atmosphere, where it was carried far across the Atlantic Ocean. On July 30, the Moderate Resolution Imaging Spectroradiometer (MODIS) aboard NASA’s Aqua satellite captured this true-color image of a river of smoke spreading south across the Hudson Bay. The blue background is formed by the waters of Hudson Bay. In the southeast the green, forest-covered land of Quebec province peeks from under a large cloud bank. Another large bank of white cloud covers the water in the southwest, and a smaller cloud bank covers the territory of Nunavut in the northwest. A bit of Baffin Island can be seen near the top center of the image. Looking closely at the image, it appears that the gray smoke mixes with whiter cloud in the south, suggesting they may be at the same level in the atmosphere. In the northeast corner of the image, a ribbon of smoke appears to blow over a bank of popcorn clouds as well as over a few lower-lying clouds, causing some of the clouds to appear gray beneath the smoky veil. Where cloud meets smoke in the northeast, however, the line of the cloud bank remains sharp, while the smoke appears to continue traveling under the edge. Although these interpretations are somewhat subjective in this true-color image, the false-color image of the same scene (not shown here) lends strength to the interpretation. Data from other NASA instruments, designed to measure cloud height and characteristics, agree that clouds vary in height, and that smoke mingles with cloud in the south. Credit: NASA/GSFC/Jeff Schmaltz/MODIS Land Rapid Response Team <b><a href="http://www.nasa.gov/audience/formedia/features/MP_Photo_Guidelines.html" rel="nofollow">NASA image use policy.</a></b> <b><a href="http://www.nasa.gov/centers/goddard/home/index.html" rel="nofollow">NASA Goddard Space Flight Center</a></b> enables NASA’s mission through four scientific endeavors: Earth Science, Heliophysics, Solar System Exploration, and Astrophysics. Goddard plays a leading role in NASA’s accomplishments by contributing compelling scientific knowledge to advance the Agency’s mission. <b>Follow us on <a href="http://twitter.com/NASA_GoddardPix" rel="nofollow">Twitter</a></b> <b>Like us on <a href="http://www.facebook.com/pages/Greenbelt-MD/NASA-Goddard/395013845897?ref=tsd" rel="nofollow">Facebook</a></b> <b>Find us on <a href="http://instagram.com/nasagoddard?vm=grid" rel="nofollow">Instagram</a></b>
This NOAA's GOES satellite infrared image taken on Nov. 25 at 11:45 UTC (6:45 a.m. EST) shows two main weather systems over the U.S. Credit: NASA/NOAA GOES Project As the U.S. Thanksgiving holiday approaches this Thursday, November 27, NOAA's GOES-East and GOES-West satellites are keeping a weather eye out for storms that may affect early travelers. In an image from Nov. 25, the satellites show an active weather pattern is in place for travelers across the central and eastern U.S. NOAA's GOES-East satellite provides visible and infrared images over the eastern U.S. and the Atlantic Ocean, while NOAA's GOES-West satellite covers the western U.S. and Pacific Ocean from its fixed orbit in space. Data from both satellites were combined at NASA's GOES Project to create a full view of the U.S. on Nov. 25 at 11:45 UTC (6:45 a.m. EST). The image shows clouds associated with cold front stretching from the Gulf of Mexico over northern Florida and along the U.S. East coast to eastern Canada. Clouds associated with another area of low pressure are in the northern Rockies and northwestern U.S. To create the image, NASA/NOAA's GOES Project takes the cloud data from NOAA's GOES-East satellite and overlays it on a true-color image of land and ocean created by data from the Moderate Resolution Imaging Spectroradiometer, or MODIS, instrument that flies aboard NASA's Aqua and Terra satellites. Together, those data created the entire picture of the storm and show its movement. After the storm system passes, the snow on the ground becomes visible. NOAA's National Weather Service Weather Prediction Center said "a storm system will develop off the coast of the Carolinas early Wednesday (Nov. 25) and strengthen as it moves rapidly up the East Coast Wednesday into early Thursday (Nov. 26). Heavy snow is likely to begin in the central Appalachians early Wednesday morning, spreading northeast through the interior Mid-Atlantic into New England by Wednesday night. Winter Storm Watches are in effect for these areas." For travelers in the western U.S., the Northern Rocky Mountains are expected to receive more snow from the north side of a stationary frontal boundary. South of the boundary rain showers will affect the lower valley. The National Weather Service calls for cold weather to continue in the northern Plains and Upper Midwest as a Canadian surface high pressure rules the weather. The U.S. Southwest will experience nice weather for mid-week. In the Pacific Northwest, the National Weather Service noted that a warm front will bring rain, heavy at times, to the Cascades today and tonight. There will be a break in the heavier rains on Wednesday, then another period of heavy rain for the Cascades Wednesday night through Friday morning as a cold front slowly drags through the area. NOAA's GOES satellites provide the kind of continuous monitoring necessary for intensive data analysis. Geostationary describes an orbit in which a satellite is always in the same position with respect to the rotating Earth. This allows GOES to hover continuously over one position on Earth's surface, appearing stationary. As a result, GOES provide a constant vigil for the atmospheric triggers for severe weather conditions such as tornadoes, flash floods, hail storms and hurricanes.