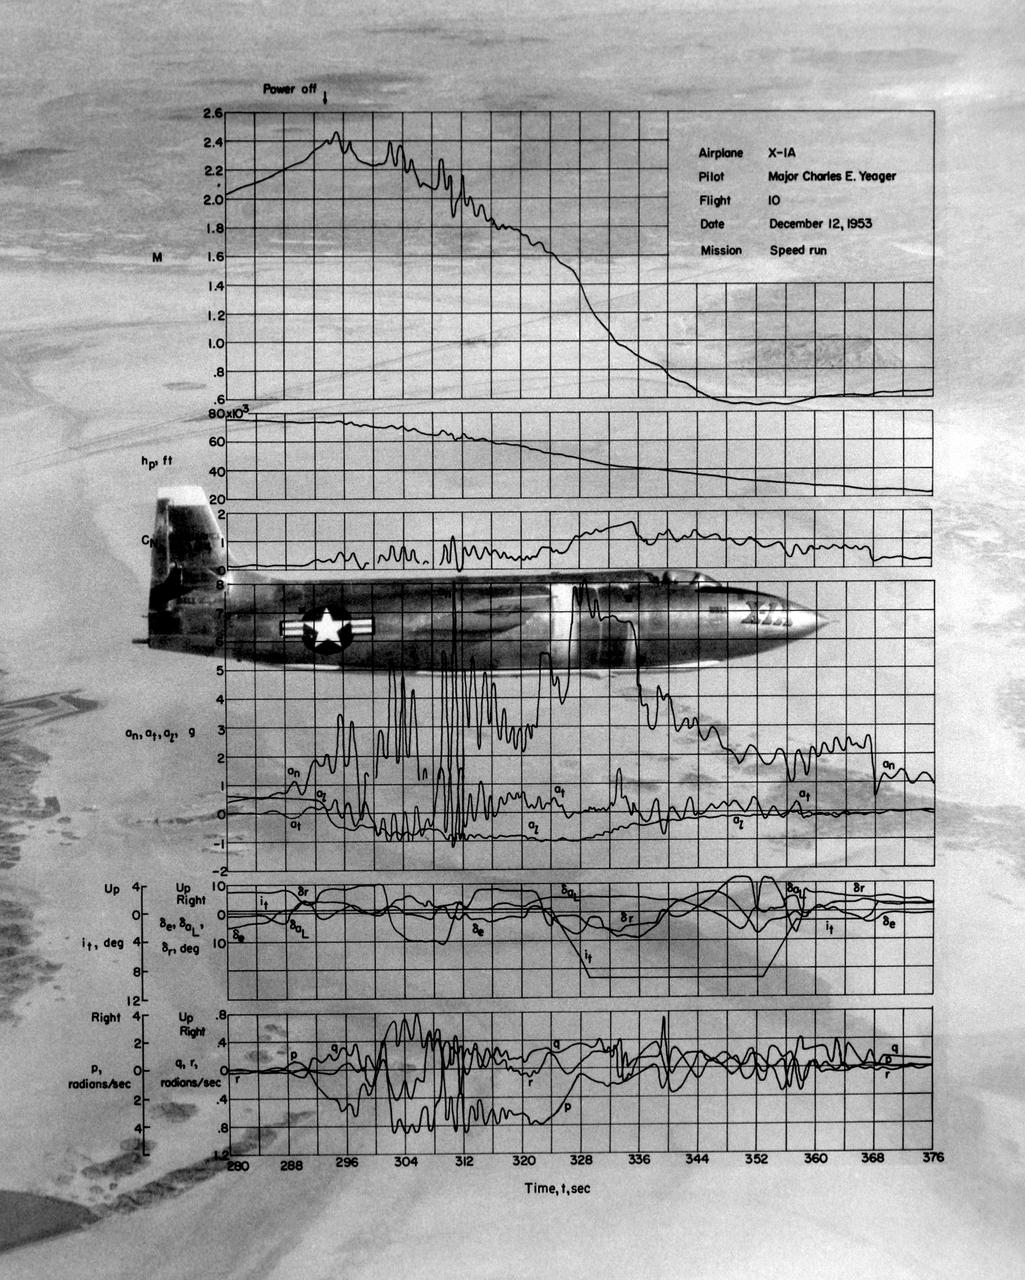
This photo of the X-1A includes graphs of the flight data from Maj. Charles E. Yeager's Mach 2.44 flight on December 12, 1953. (This was only a few days short of the 50th anniversary of the Wright brothers' first powered flight.) After reaching Mach 2.44, then the highest speed ever reached by a piloted aircraft, the X-1A tumbled completely out of control. The motions were so violent that Yeager cracked the plastic canopy with his helmet. He finally recovered from a inverted spin and landed on Rogers Dry Lakebed. Among the data shown are Mach number and altitude (the two top graphs). The speed and altitude changes due to the tumble are visible as jagged lines. The third graph from the bottom shows the G-forces on the airplane. During the tumble, these twice reached 8 Gs or 8 times the normal pull of gravity at sea level. (At these G forces, a 200-pound human would, in effect, weigh 1,600 pounds if a scale were placed under him in the direction of the force vector.) Producing these graphs was a slow, difficult process. The raw data from on-board instrumentation recorded on oscillograph film. Human computers then reduced the data and recorded it on data sheets, correcting for such factors as temperature and instrument errors. They used adding machines or slide rules for their calculations, pocket calculators being 20 years in the future.
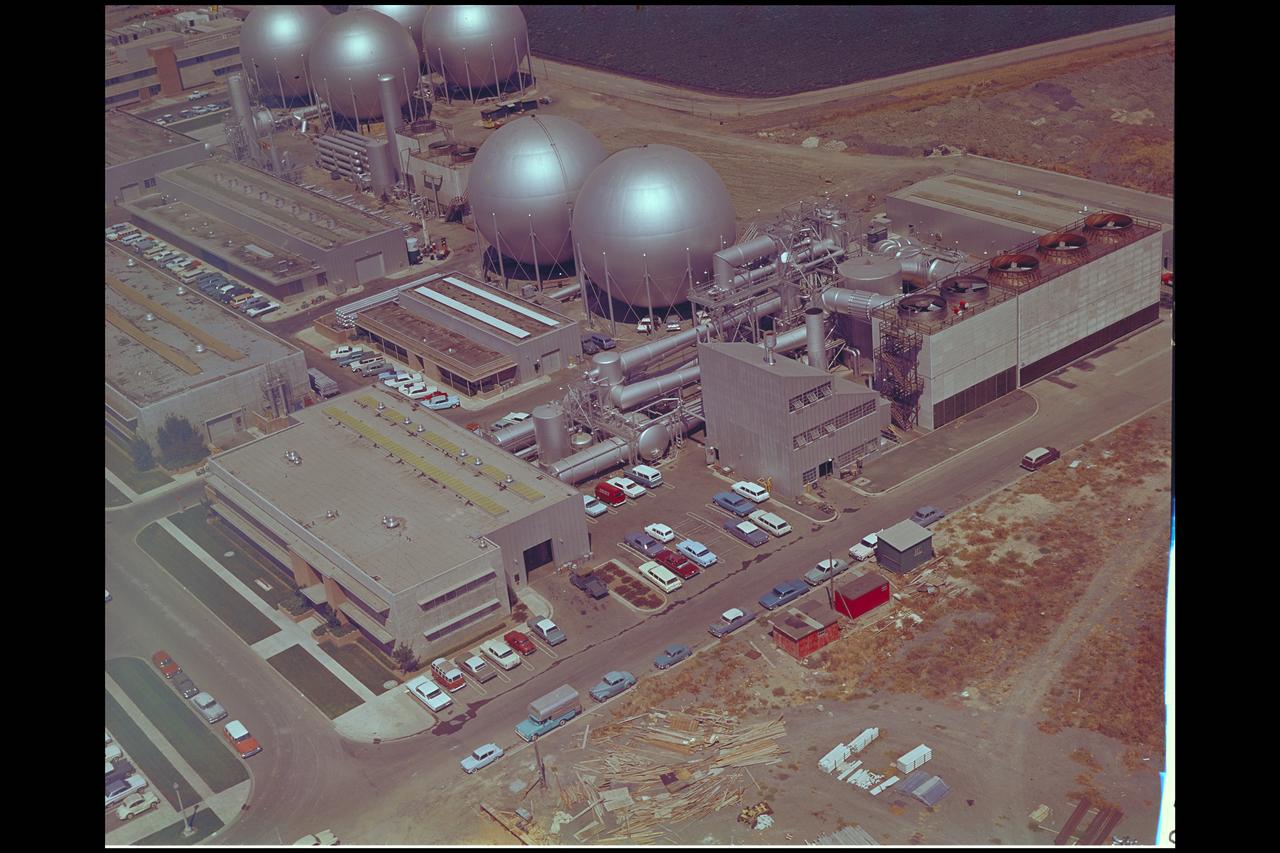
Aerial view of Gasdynamics facility in 1964 and the 20 inch helium tunnel Part of the Thermal Protection Laboratory used to research materials for heat shield applications and for aerodynamic heating and materials studies of vehicles in planetary atmospheres. This laboratory is comprised of five separate facilities: an Aerodynamic Heating Tunnel, a Heat Transfer Tunnel, two Supersonic Turbulent Ducts, and a High-Power CO2 Gasdynamic Laser. All these facilities are driven by arc-heaters, with the exception of the large, combustion-type laser. The arc-heated facilities are powered by a 20 Megawatt DC power supply. Their effluent gas stream (test gases; Air, N2, He, CO2 and mixtures; flow rates from 0.05 to 5.0 lbs/sec) discharges into a five-stage stream-ejector-driven vacuum system. The vacuum system and power supply are common to the test faciities in building N-238. All of the facilities have high pressure water available at flow rates up to 4, 000 gals/min. The data obtained from these facilities are recorded on magnetic tape or oscillographs. All forms of data can be handled whether from thermo-couples, pressure cells, pyrometers, or radiometers, etc. in addition, closed circuit T. V. monitors and various film cameras are available. (operational since 1962)
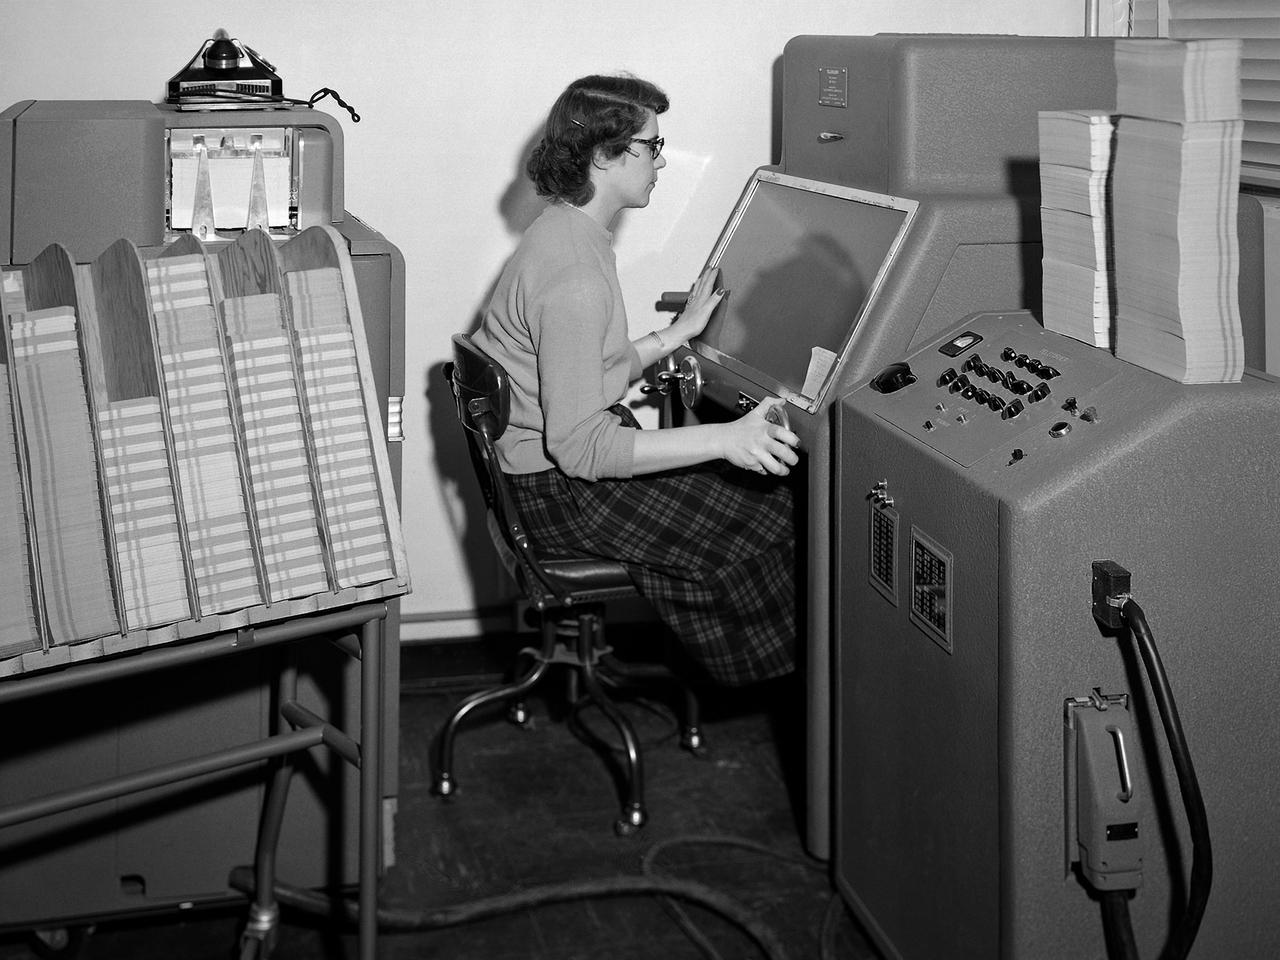
A staff member from the Computing Section at the National Advisory Committee for Aeronautics (NACA) Lewis Flight Propulsion Laboratory operates an International Business Machines (IBM) telereader at the 8- by 6-Foot Supersonic Wind Tunnel. The telereader was used to measure recorded data from motion picture film or oscillographs. The machine could perform 50 measurements per minute. The component to her right is a telerecordex that was used convert the telereader measurements into decimal form and record the data on computer punch cards. During test runs in the 8- by 6-foot tunnel, or the other large test facilities, pressure sensors on the test article were connected to mercury-filled manometer tubes located below the test section. The mercury would rise or fall in relation to the pressure fluctuations in the test section. Initially, female staff members, known as “computers,” transcribed all the measurements by hand. The process became automated with the introduction of the telereader and other data reduction equipment in the early 1950s. The Computer Section staff members were still needed to operate the machines. The Computing Section was introduced during World War II to relieve short-handed research engineers of some of the tedious work. The computers made the initial computations and plotted the data graphically. The researcher then analyzed the data and either summarized the findings in a report or made modifications or ran the test again. The computers and analysts were located in the Altitude Wind Tunnel Shop and Office Building office wing during the 1940s. They were transferred to the new facility when the 8- by 6-Foot tunnel began operations in 1948.
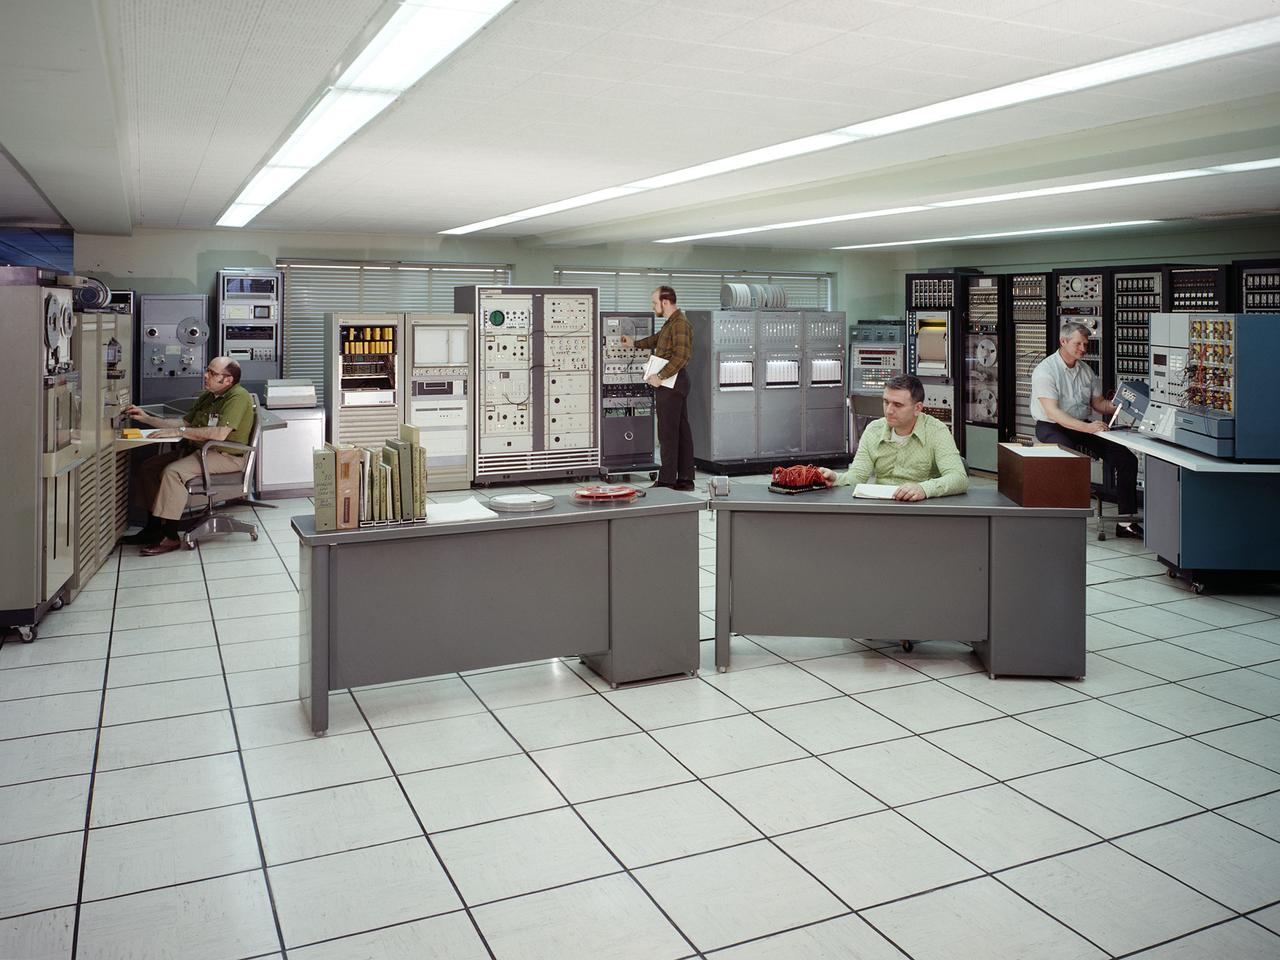
The test data recording equipment located in the office building of the 10-by 10-Foot Supersonic Wind Tunnel at the NASA Lewis Research Center. The data system was the state of the art when the facility began operating in 1955 and was upgraded over time. NASA engineers used solenoid valves to measure pressures from different locations within the test section. Up 48 measurements could be fed into a single transducer. The 10-by 10 data recorders could handle up to 200 data channels at once. The Central Automatic Digital Data Encoder (CADDE) converted this direct current raw data from the test section into digital format on magnetic tape. The digital information was sent to the Lewis Central Computer Facility for additional processing. It could also be displayed in the control room via strip charts or oscillographs. The 16-by 56-foot long ERA 1103 UNIVAC mainframe computer processed most of the digital data. The paper tape with the raw data was fed into the ERA 1103 which performed the needed calculations. The information was then sent back to the control room. There was a lag of several minutes before the computed information was available, but it was exponentially faster than the hand calculations performed by the female computers. The 10- by 10-foot tunnel, which had its official opening in May 1956, was built under the Congressional Unitary Plan Act which coordinated wind tunnel construction at the NACA, Air Force, industry, and universities. The 10- by 10 was the largest of the three NACA tunnels built under the act.