
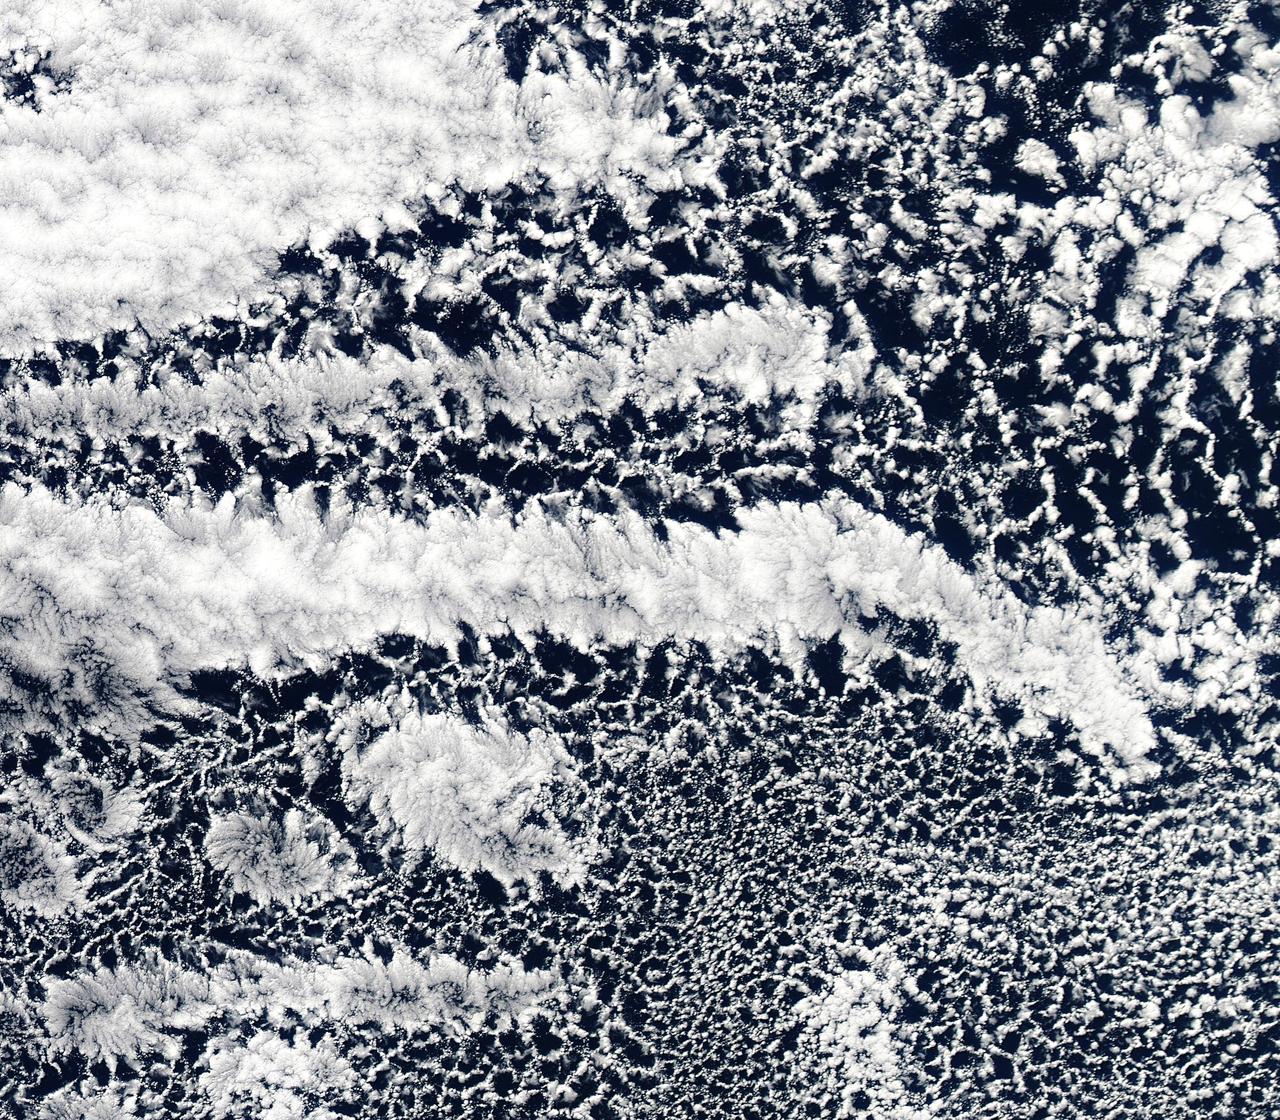
Ship tracks above the northern Pacific Ocean. NASA image captured July 3, 2010. Satellite: Aqua NASA/GSFC/Jeff Schmaltz/MODIS Land Rapid Response Team To learn more about MODIS go to: <a href="http://rapidfire.sci.gsfc.nasa.gov/gallery/?latest" rel="nofollow">rapidfire.sci.gsfc.nasa.gov/gallery/?latest</a> To learn more about ship tracks go to: <a href="http://visibleearth.nasa.gov/view_rec.php?id=2370" rel="nofollow">visibleearth.nasa.gov/view_rec.php?id=2370</a> To watch a video on ship tracks go to: <a href="http://www.youtube.com/watch?v=Vsri2sOAjWo&feature=player_embedded#" rel="nofollow">www.youtube.com/watch?v=Vsri2sOAjWo&feature=player_em...</a>! <b><a href="http://www.nasa.gov/centers/goddard/home/index.html" rel="nofollow">NASA Goddard Space Flight Center</a></b> is home to the nation's largest organization of combined scientists, engineers and technologists that build spacecraft, instruments and new technology to study the Earth, the sun, our solar system, and the universe.

NASA's Terra satellite captured this image of Typhoon Phanfone and its large eye in the western Pacific Ocean on Friday, Oct. 3 at 1:55 UTC. On Oct. 3 at 0900 UTC (5 a.m. EDT), Typhoon Phanfone's maximum sustained winds were near 110 knots (126.6 mph/203.7 kph). It was centered near 23.6 north longitude and 134.4 east latitude, about 374 nautical miles west-southwest of the island of Iwo To. Phanfone has tracked northwestward at 12 knots (13.8 mph/22.2 kph). Read more: <a href="http://1.usa.gov/1vjS1vs" rel="nofollow">1.usa.gov/1vjS1vs</a> Credit: NASA Goddard MODIS Rapid Response Team <b><a href="http://www.nasa.gov/audience/formedia/features/MP_Photo_Guidelines.html" rel="nofollow">NASA image use policy.</a></b> <b><a href="http://www.nasa.gov/centers/goddard/home/index.html" rel="nofollow">NASA Goddard Space Flight Center</a></b> enables NASA’s mission through four scientific endeavors: Earth Science, Heliophysics, Solar System Exploration, and Astrophysics. Goddard plays a leading role in NASA’s accomplishments by contributing compelling scientific knowledge to advance the Agency’s mission. <b>Follow us on <a href="http://twitter.com/NASAGoddardPix" rel="nofollow">Twitter</a></b> <b>Like us on <a href="http://www.facebook.com/pages/Greenbelt-MD/NASA-Goddard/395013845897?ref=tsd" rel="nofollow">Facebook</a></b> <b>Find us on <a href="http://instagram.com/nasagoddard?vm=grid" rel="nofollow">Instagram</a></b>

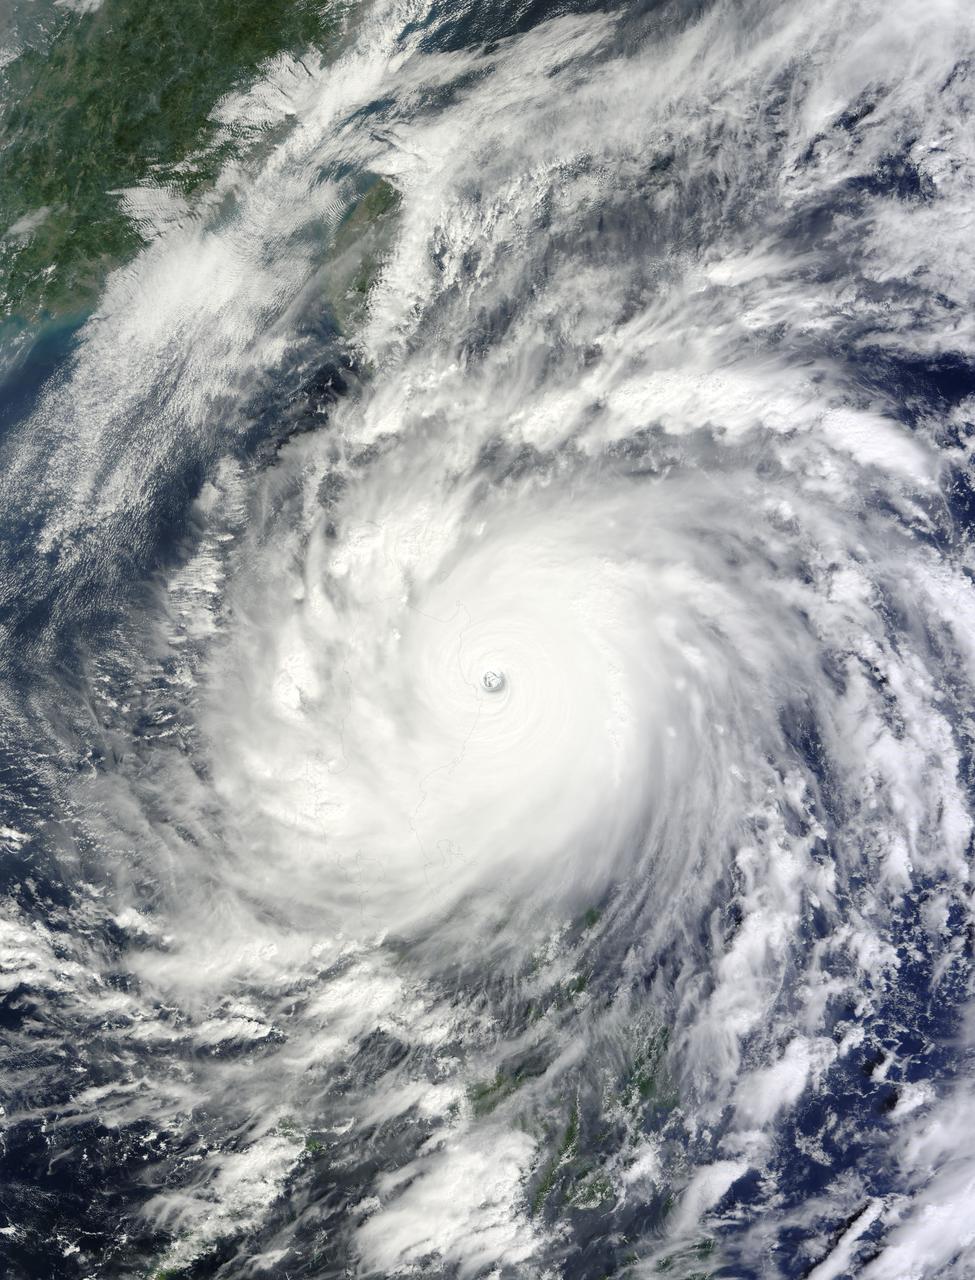
NASA satellite imagery from July 10 revealed a very clear and cloudless eye in the Northwestern Pacific’s Typhoon Soulik as it moves toward a landfall in China by the end of the week. The Moderate Resolution Imaging Spectroradiometer (MODIS) instrument aboard NASA’s Terra satellite captured a visible image of Typhoon Soulik and its clear eye on July 10, 2013 at 2:10 UTC as it continues to move through the northwestern Pacific Ocean. Soulik’s round eye is about 25 nautical miles (28.7 miles/46.3 km) wide. Typhoon Soulik’s maximum sustained winds have increased dramatically over the last 24 hours and at 1500 UTC (11 a.m. EDT) on July 10, were blowing at 120 knots (138 mph/222 kph). According to the Joint Typhoon Warning Center, Soulik’s powerful winds are creating seas over 40 feet (12.2 meters) high in the northwestern Pacific Ocean. Soulik’s center was near 21.9 north latitude and 132.9 east longitude, about 420 nautical miles (483.3 miles/777.7 km) southeast of Kadena Air Base, Japan. Soulik is moving to the west-northwest at 13 knots (15 mph/24 kph). Soulik is tracking west-northwest along the southern edge of a subtropical ridge (elongated area) of high pressure. The ridge of high pressure stretches from east to west and westward over the Ryukyu Islands and into the East China Sea along about 30 north latitude. Soulik is still expected to make a landfall in southeastern China on July 12 or 13 after passing north of Taiwan. Text credit: Rob Gutro More info about the storm: <a href="http://1.usa.gov/12mvQcC" rel="nofollow">1.usa.gov/12mvQcC</a> <b><a href="http://www.nasa.gov/audience/formedia/features/MP_Photo_Guidelines.html" rel="nofollow">NASA image use policy.</a></b> <b><a href="http://www.nasa.gov/centers/goddard/home/index.html" rel="nofollow">NASA Goddard Space Flight Center</a></b> enables NASA’s mission through four scientific endeavors: Earth Science, Heliophysics, Solar System Exploration, and Astrophysics. Goddard plays a leading role in NASA’s accomplishments by contributing compelling scientific knowledge to advance the Agency’s mission. <b>Follow us on <a href="http://twitter.com/NASA_GoddardPix" rel="nofollow">Twitter</a></b> <b>Like us on <a href="http://www.facebook.com/pages/Greenbelt-MD/NASA-Goddard/395013845897?ref=tsd" rel="nofollow">Facebook</a></b> <b>Find us on <a href="http://instagram.com/nasagoddard?vm=grid" rel="nofollow">Instagram</a></b>
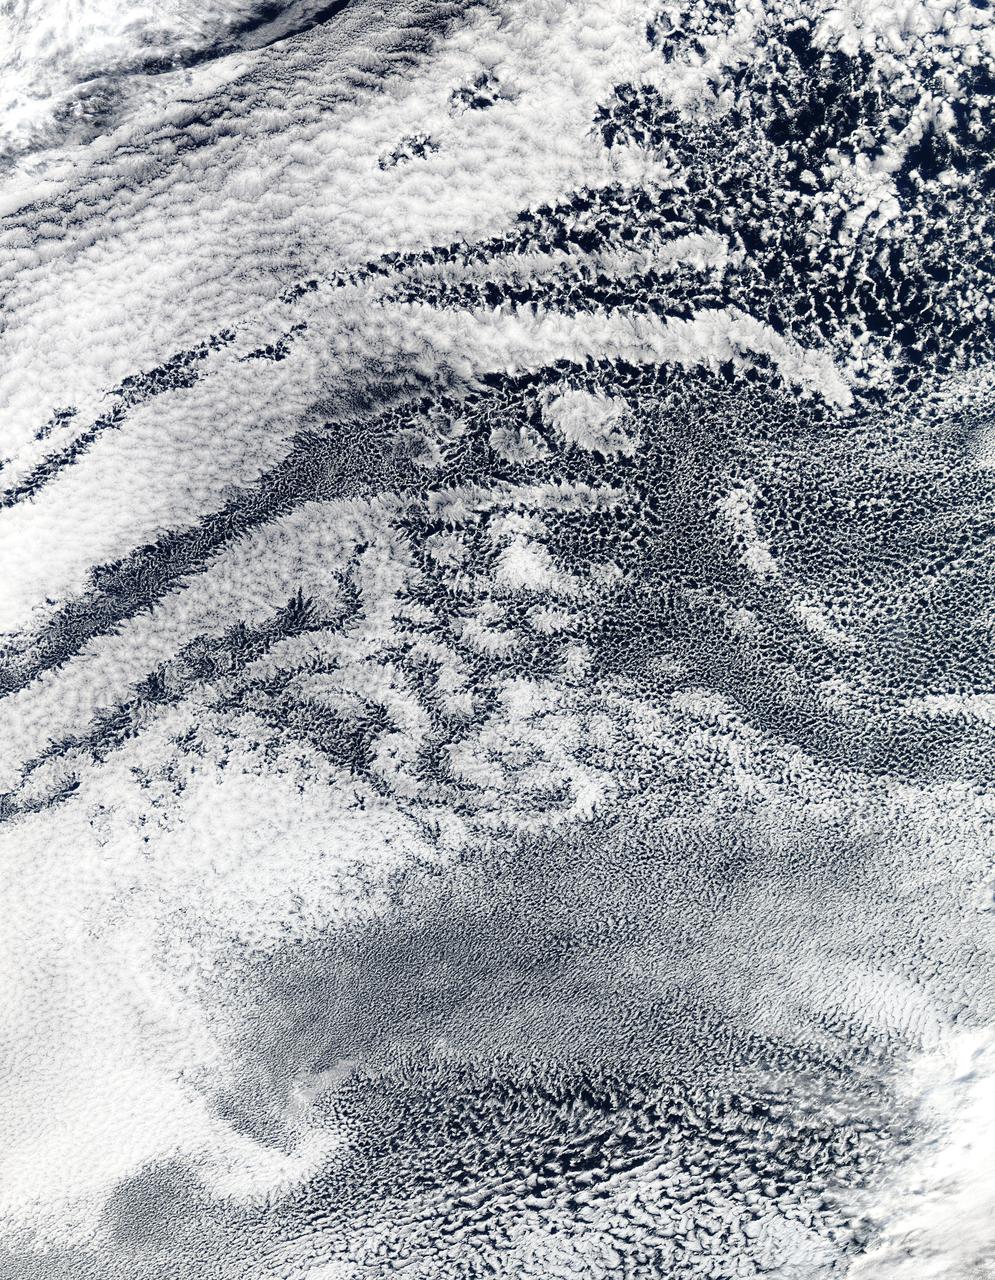
2010/107 - 04/17 at 21 :05 UTC. Open-cell and closed-cell clouds off Peru, Pacific Ocean Resembling a frosted window on a cold winter's day, this lacy pattern of marine clouds was captured off the coast of Peru in the Pacific Ocean by the MODIS on the Aqua satellite on April 19, 2010. The image reveals both open- and closed-cell cumulus cloud patterns. These cells, or parcels of air, often occur in roughly hexagonal arrays in a layer of fluid (the atmosphere often behaves like a fluid) that begins to "boil," or convect, due to heating at the base or cooling at the top of the layer. In "closed" cells warm air is rising in the center, and sinking around the edges, so clouds appear in cell centers, but evaporate around cell edges. This produces cloud formations like those that dominate the lower left. The reverse flow can also occur: air can sink in the center of the cell and rise at the edge. This process is called "open cell" convection, and clouds form at cell edges around open centers, which creates a lacy, hollow-looking pattern like the clouds in the upper right. Closed and open cell convection represent two stable atmospheric configurations — two sides of the convection coin. But what determines which path the "boiling" atmosphere will take? Apparently the process is highly chaotic, and there appears to be no way to predict whether convection will result in open or closed cells. Indeed, the atmosphere may sometimes flip between one mode and another in no predictable pattern. Satellite: Aqua NASA/GSFC/Jeff Schmaltz/MODIS Land Rapid Response Team To learn more about MODIS go to: <a href="http://rapidfire.sci.gsfc.nasa.gov/gallery/?latest" rel="nofollow">rapidfire.sci.gsfc.nasa.gov/gallery/?latest</a> <b><a href="http://www.nasa.gov/centers/goddard/home/index.html" rel="nofollow">NASA Goddard Space Flight Center</a></b> is home to the nation's largest organization of combined scientists, engineers and technologists that build spacecraft, instruments and new technology to study the Earth, the sun, our solar system, and the universe.
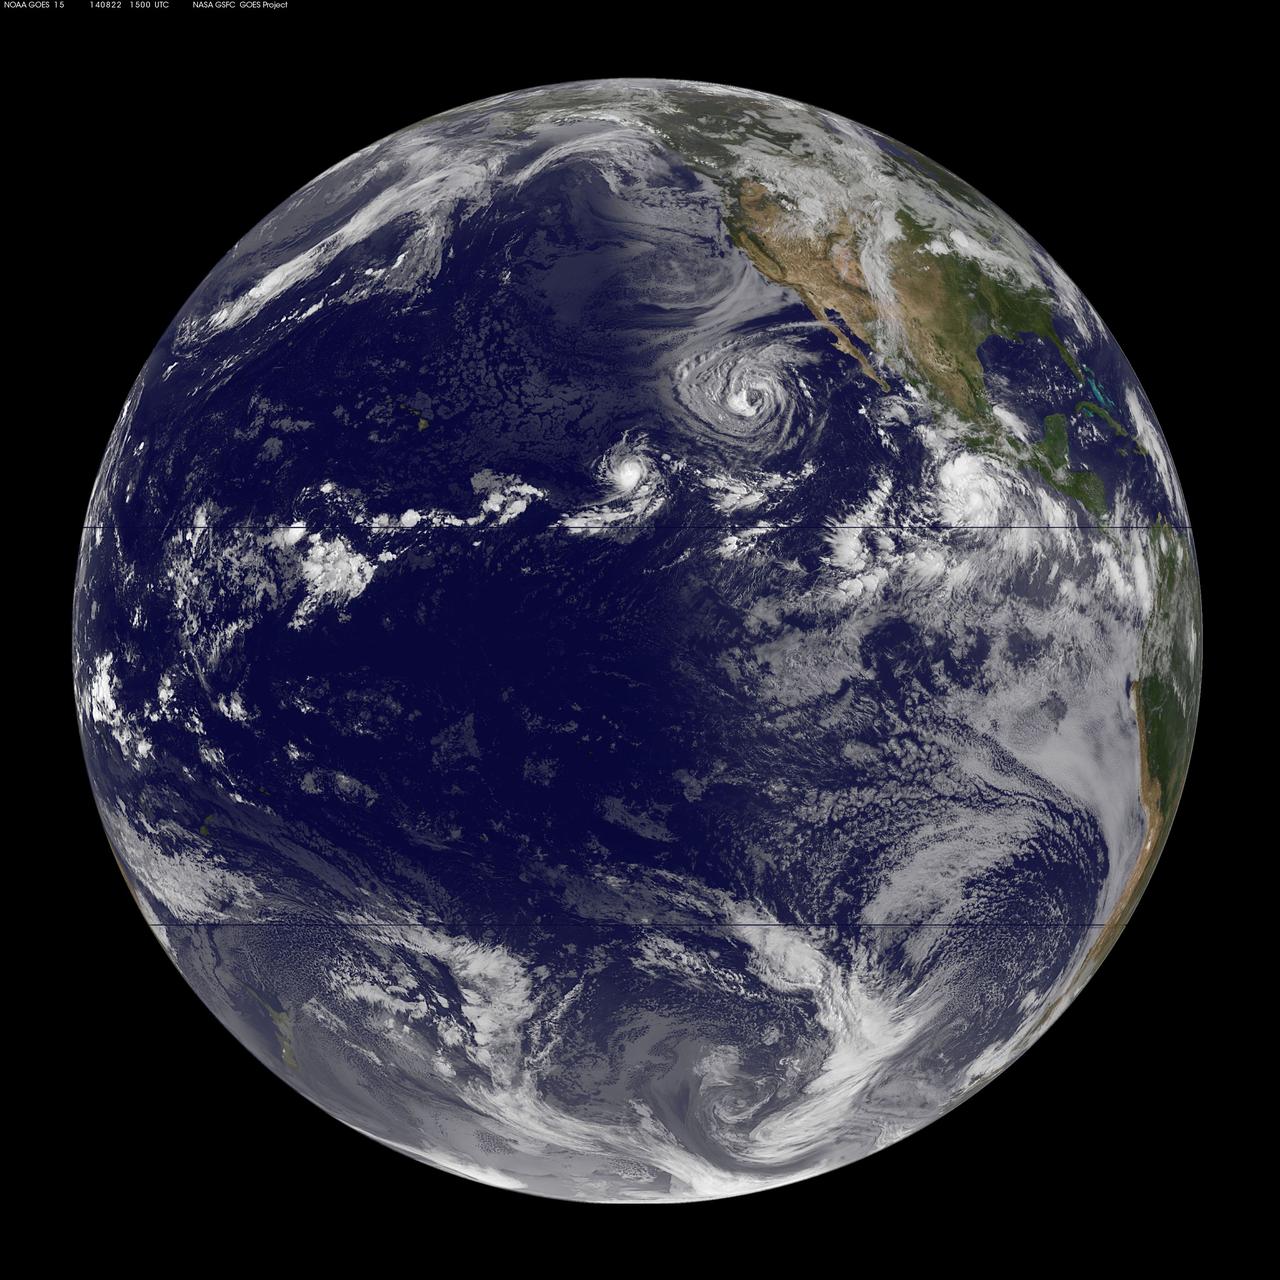
NASA and NOAA satellites are studying the triple tropical tempests that are now romping through the Eastern Pacific Ocean. NOAA's GOES-West satellite captured Tropical Storm Karina, Tropical Storm Lowell and newly formed Tropical Storm Marie on August 22. NOAA's GOES-West satellite captured all three storms in an infrared image at 0900 UTC (5 a.m. EDT), and Tropical Lowell clearly dwarfs Karina to its west, and Marie to the east. The infrared image was created at NASA/NOAA's GOES Project at the NASA Goddard Space Flight Center in Greenbelt, Maryland. For more information about Lowell, visit: <a href="http://www.nasa.gov/content/goddard/12e-eastern-pacific-ocean/" rel="nofollow">www.nasa.gov/content/goddard/12e-eastern-pacific-ocean/</a> For more information about Karina, visit: <a href="http://www.nasa.gov/content/goddard/karina-eastern-pacific/" rel="nofollow">www.nasa.gov/content/goddard/karina-eastern-pacific/</a> Rob Gutro NASA's Goddard Space Flight Center <b><a href="http://www.nasa.gov/audience/formedia/features/MP_Photo_Guidelines.html" rel="nofollow">NASA image use policy.</a></b> <b><a href="http://www.nasa.gov/centers/goddard/home/index.html" rel="nofollow">NASA Goddard Space Flight Center</a></b> enables NASA’s mission through four scientific endeavors: Earth Science, Heliophysics, Solar System Exploration, and Astrophysics. Goddard plays a leading role in NASA’s accomplishments by contributing compelling scientific knowledge to advance the Agency’s mission. <b>Follow us on <a href="http://twitter.com/NASAGoddardPix" rel="nofollow">Twitter</a></b> <b>Like us on <a href="http://www.facebook.com/pages/Greenbelt-MD/NASA-Goddard/395013845897?ref=tsd" rel="nofollow">Facebook</a></b> <b>Find us on <a href="http://instagram.com/nasagoddard?vm=grid" rel="nofollow">Instagram</a></b>
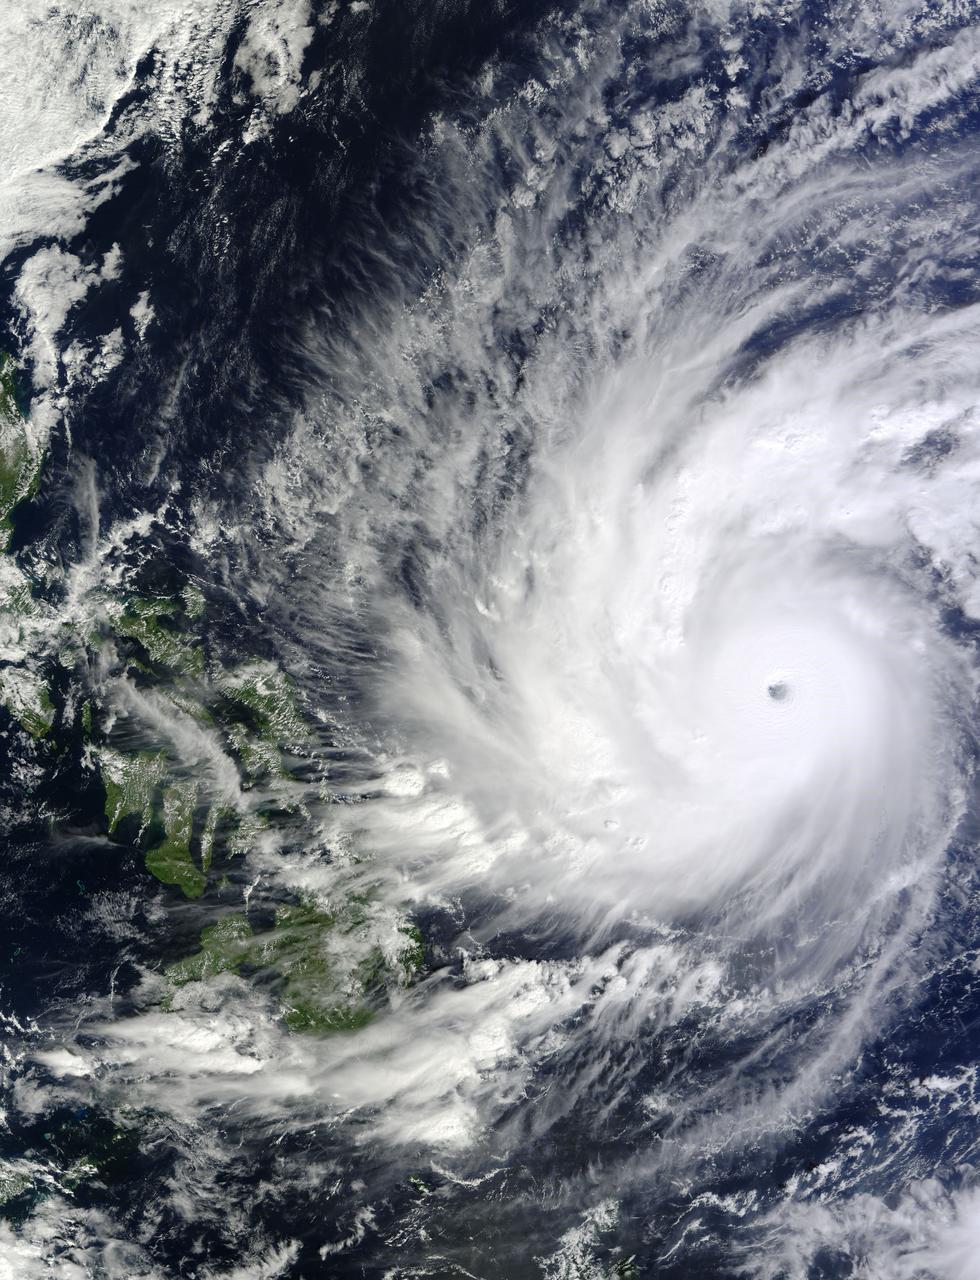
On Dec. 4 at 02:10 UTC, the MODIS instrument aboard NASA's Terra satellite took this visible image of Super Typhoon Hagupit approaching the Philippines. Image Credit: NASA Goddard's MODIS Rapid Response Team Read more: <a href="http://1.usa.gov/12q3ssK" rel="nofollow">1.usa.gov/12q3ssK</a> <b><a href="http://www.nasa.gov/audience/formedia/features/MP_Photo_Guidelines.html" rel="nofollow">NASA image use policy.</a></b> <b><a href="http://www.nasa.gov/centers/goddard/home/index.html" rel="nofollow">NASA Goddard Space Flight Center</a></b> enables NASA’s mission through four scientific endeavors: Earth Science, Heliophysics, Solar System Exploration, and Astrophysics. Goddard plays a leading role in NASA’s accomplishments by contributing compelling scientific knowledge to advance the Agency’s mission. <b>Follow us on <a href="http://twitter.com/NASAGoddardPix" rel="nofollow">Twitter</a></b> <b>Like us on <a href="http://www.facebook.com/pages/Greenbelt-MD/NASA-Goddard/395013845897?ref=tsd" rel="nofollow">Facebook</a></b> <b>Find us on <a href="http://instagram.com/nasagoddard?vm=grid" rel="nofollow">Instagram</a></b>
2010/107 - 04/17 at 21 :05 UTC. Open-cell and closed-cell clouds off Peru, Pacific Ocean. To view the full fame of this image to go: <a href="http://www.flickr.com/photos/gsfc/4557497219/">www.flickr.com/photos/gsfc/4557497219/</a> Resembling a frosted window on a cold winter's day, this lacy pattern of marine clouds was captured off the coast of Peru in the Pacific Ocean by the MODIS on the Aqua satellite on April 19, 2010. The image reveals both open- and closed-cell cumulus cloud patterns. These cells, or parcels of air, often occur in roughly hexagonal arrays in a layer of fluid (the atmosphere often behaves like a fluid) that begins to "boil," or convect, due to heating at the base or cooling at the top of the layer. In "closed" cells warm air is rising in the center, and sinking around the edges, so clouds appear in cell centers, but evaporate around cell edges. This produces cloud formations like those that dominate the lower left. The reverse flow can also occur: air can sink in the center of the cell and rise at the edge. This process is called "open cell" convection, and clouds form at cell edges around open centers, which creates a lacy, hollow-looking pattern like the clouds in the upper right. Closed and open cell convection represent two stable atmospheric configurations — two sides of the convection coin. But what determines which path the "boiling" atmosphere will take? Apparently the process is highly chaotic, and there appears to be no way to predict whether convection will result in open or closed cells. Indeed, the atmosphere may sometimes flip between one mode and another in no predictable pattern. Satellite: Aqua NASA/GSFC/Jeff Schmaltz/MODIS Land Rapid Response Team To learn more about MODIS go to: <a href="http://rapidfire.sci.gsfc.nasa.gov/gallery/?latest" rel="nofollow">rapidfire.sci.gsfc.nasa.gov/gallery/?latest</a> <b><a href="http://www.nasa.gov/centers/goddard/home/index.html" rel="nofollow">NASA Goddard Space Flight Center</a></b> is home to the nation's largest organization of combined scientists, engineers and technologists that build spacecraft, instruments and new technology to study the Earth, the sun, our solar system, and the universe.
NASA image captured Oct. 18, 2010 at 02:35 UTC Typhoon Megi (15W) over the Philippines. The Moderate Resolution Imaging Spectroradiometer (MODIS) on NASA’s Terra satellite at 10:35 a.m. Philippine Time (02:35 UTC) on October 18, 2010. Megi was bearing down on Palanan Bay as a “super typhoon” with category 5 strength on the Saffir Simpson scale. Image Credit: NASA Goddard MODIS Rapid Response Team To learn more go to: <a href="http://www.nasa.gov/mission_pages/hurricanes/archives/2010/h2010_Megi.html" rel="nofollow">www.nasa.gov/mission_pages/hurricanes/archives/2010/h2010...</a> <b><a href="http://www.nasa.gov/centers/goddard/home/index.html" rel="nofollow">NASA Goddard Space Flight Center</a></b> enables NASA’s mission through four scientific endeavors: Earth Science, Heliophysics, Solar System Exploration, and Astrophysics. Goddard plays a leading role in NASA’s accomplishments by contributing compelling scientific knowledge to advance the Agency’s mission. <b>Follow us on <a href="http://twitter.com/NASA_GoddardPix" rel="nofollow">Twitter</a></b> <b>Join us on <a href="http://www.facebook.com/pages/Greenbelt-MD/NASA-Goddard/395013845897?ref=tsd" rel="nofollow">Facebook</a></b>
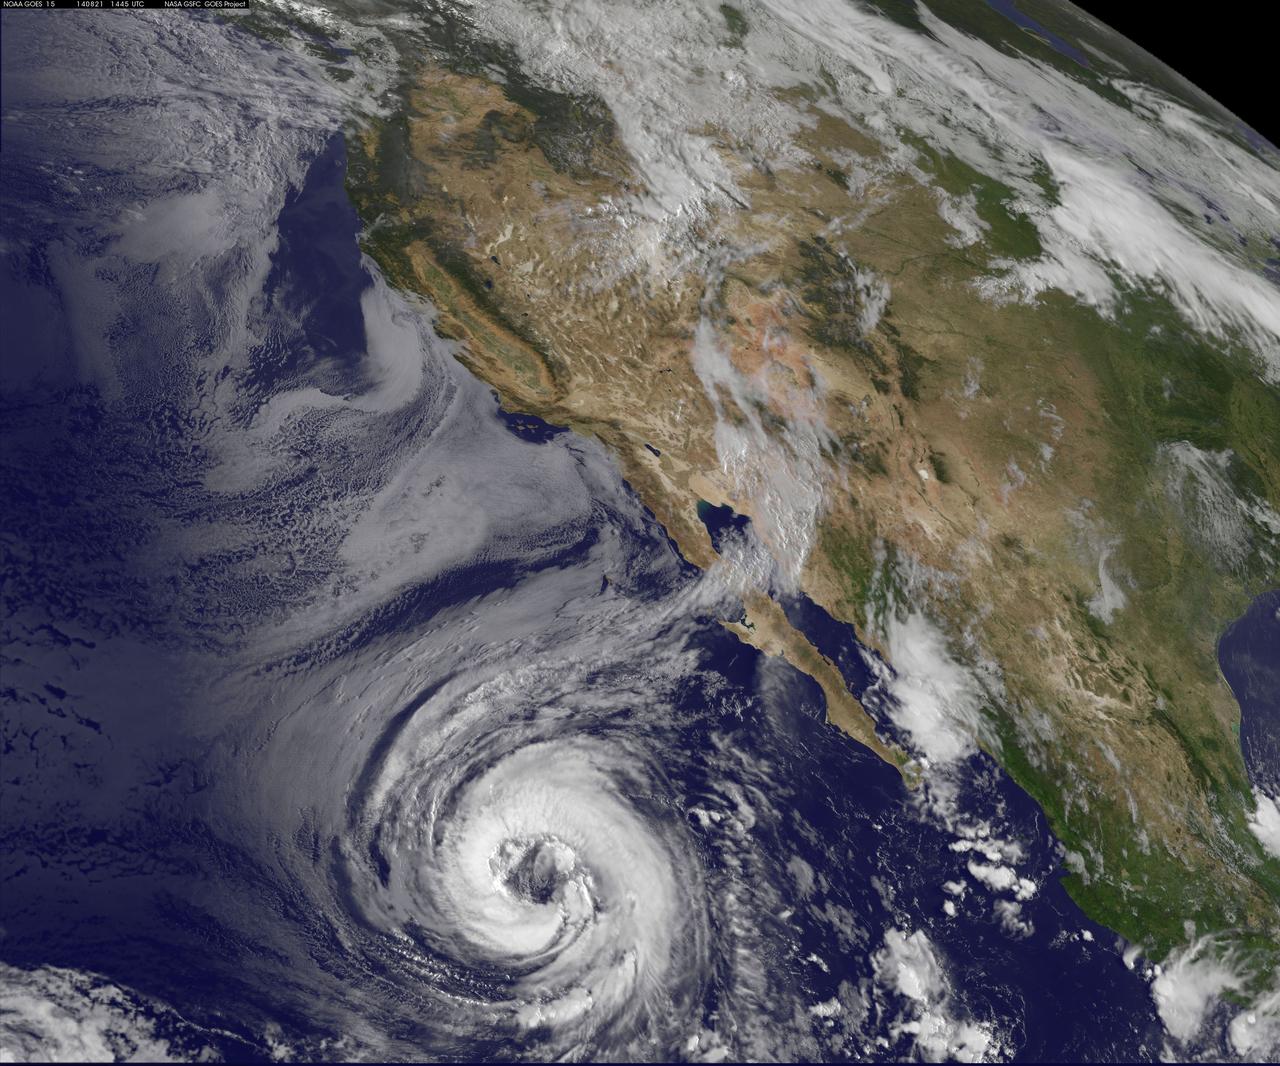
NOAA's GOES-West satellite watched as Tropical Storm Lowell strengthened into a large hurricane during the morning of August 21 and opened its eye. Hurricane force winds extend outward up to 60 miles (95 km) from the center, while tropical storm force winds extend outward up to 185 miles (295 km). The storm stretches over a greater distance. Lowell became the seventh hurricane of the Eastern Pacific Ocean season today, August 21 at 11 a.m. EDT (1500 UTC). Maximum sustained winds had increased to 75 mph (120 kph) making Lowell a Category One hurricane on the Saffir-Simpson Wind Scale. Little change in intensity is forecast by the National Hurricane Center (NHC) today, and NHC forecasters expect a slow weakening trend later today through August 22. It was centered near latitude 20.0 north and longitude 122.1 west, about 810 miles (1,300 km) west-southwest of the southern tip of Baja California, Mexico. It is moving to the northwest near 3 mph (4 kph) and is expected to move faster in that direction over the next two days. The NHC said that Lowell should begin to slowly weaken by August 22 as it moves over progressively cooler waters and into a drier and more stable air mass. Since Lowell is such a large cyclone, it will likely take longer than average to spin down. The GOES-West image of Lowell was created at the NASA/NOAA GOES Project, located at NASA's Goddard Space Flight Center in Greenbelt, Maryland. Rob Gutro NASA's Goddard Space Flight Center <b><a href="http://goes.gsfc.nasa.gov/" rel="nofollow">Credit: NOAA/NASA GOES Project</a></b> <b><a href="http://www.nasa.gov/audience/formedia/features/MP_Photo_Guidelines.html" rel="nofollow">NASA image use policy.</a></b> <b><a href="http://www.nasa.gov/centers/goddard/home/index.html" rel="nofollow">NASA Goddard Space Flight Center</a></b> enables NASA’s mission through four scientific endeavors: Earth Science, Heliophysics, Solar System Exploration, and Astrophysics. Goddard plays a leading role in NASA’s accomplishments by contributing compelling scientific knowledge to advance the Agency’s mission. <b>Follow us on <a href="http://twitter.com/NASAGoddardPix" rel="nofollow">Twitter</a></b> <b>Like us on <a href="http://www.facebook.com/pages/Greenbelt-MD/NASA-Goddard/395013845897?ref=tsd" rel="nofollow">Facebook</a></b> <b>Find us on <a href="http://instagram.com/nasagoddard?vm=grid" rel="nofollow">Instagram</a></b>