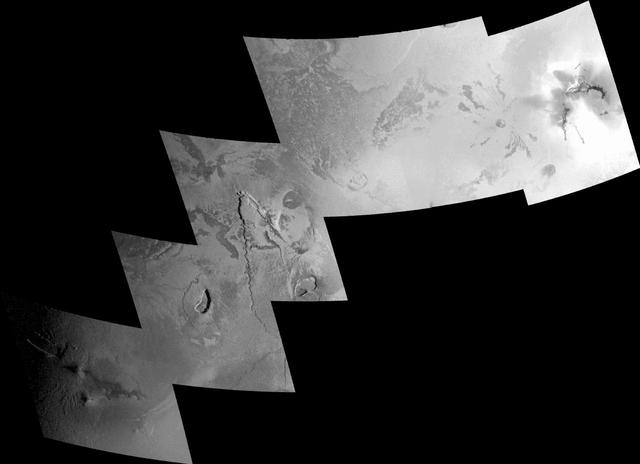
Northern Plume and Plume Deposits on Io
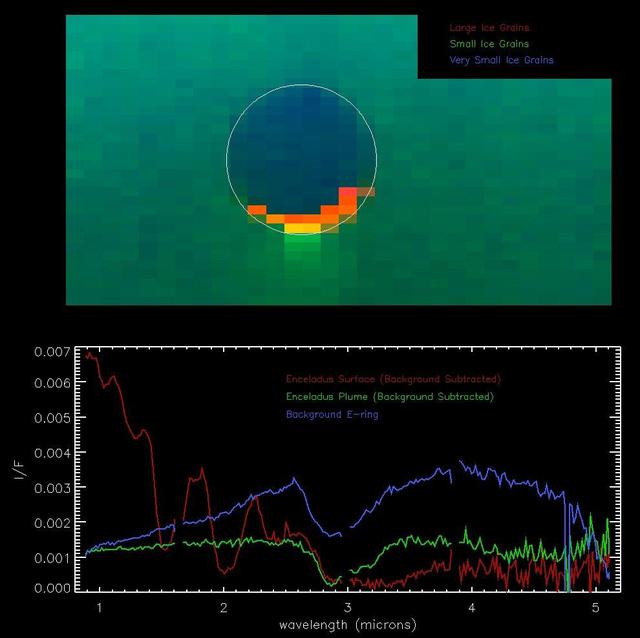
Enceladus Plume
A Brilliant Plume
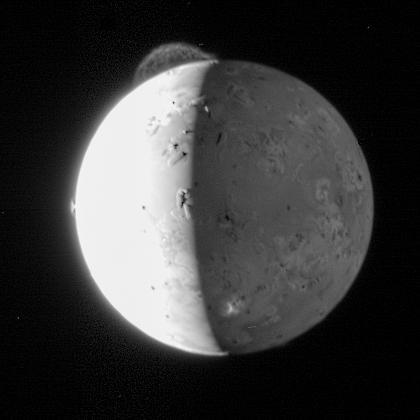
Tvashtar Plume

Jupiter Plume
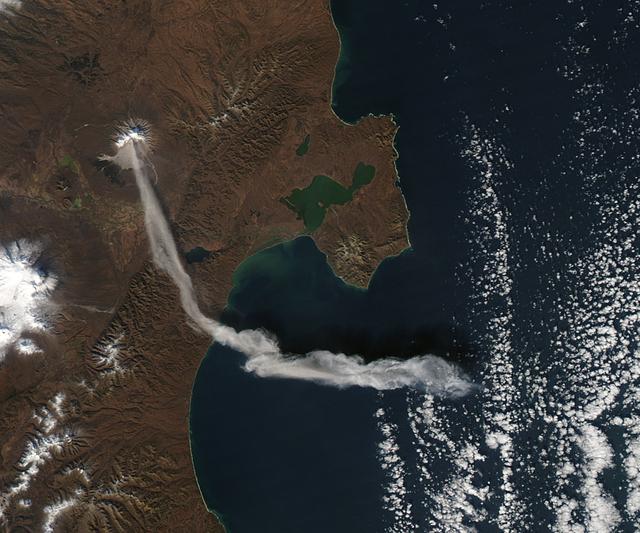
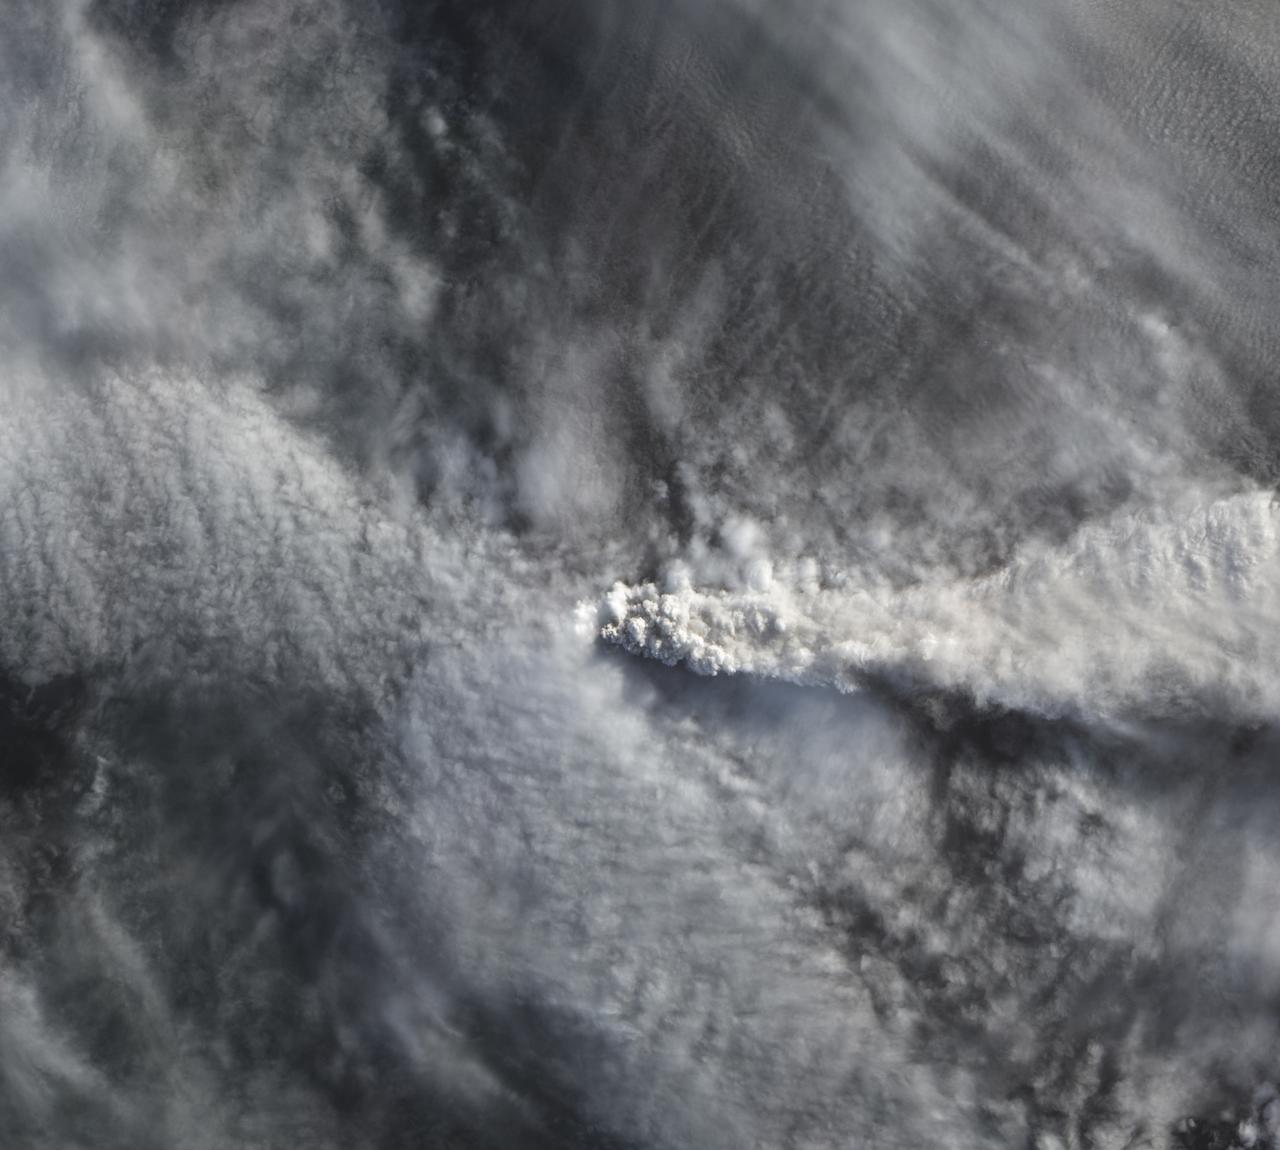
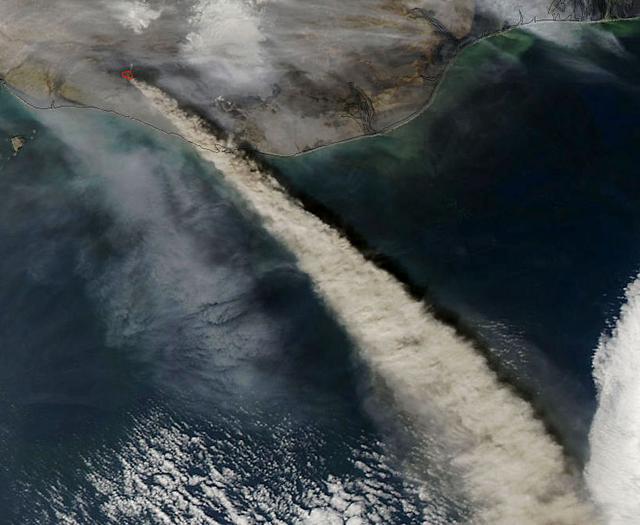
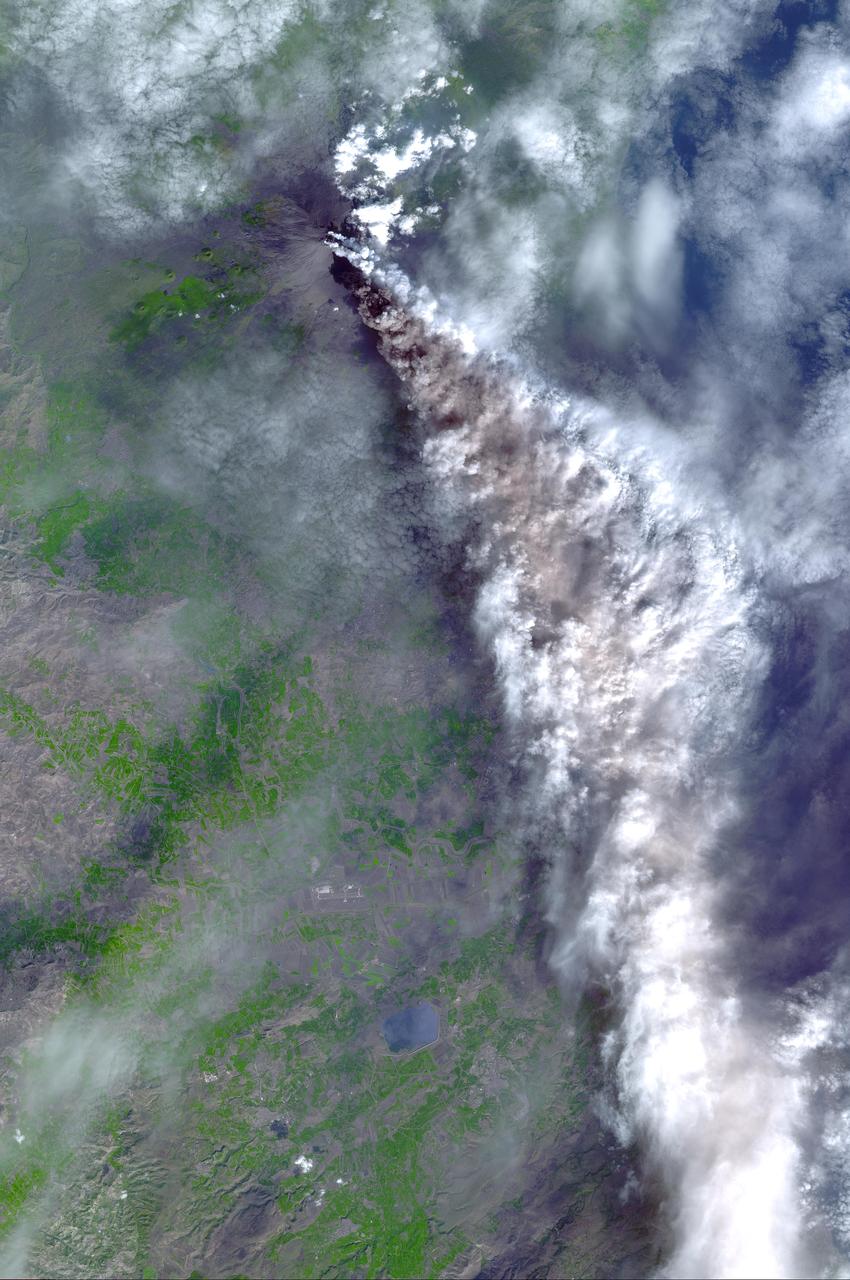
When NASA’s Terra satellite passed over Russia’s Kamchatka Peninsula at noon local time (00:00 Universal Time) on October 6, 2012, Shilveluch Volcano was quiet. By the time NASA’s Aqua satellite passed over the area two hours later (bottom image), the volcano had erupted and sent a plume of ash over the Kamchatskiy Zaliv. The plume traveled about 90 kilometers (55 miles) toward the south-southeast, where a change in wind direction began pushing the plume toward the east. On October 6, 2012, the Kamchatka Volcanic Emergency Response Team (KVERT) reported that the ash plume from Shiveluch reached an altitude of 3 kilometers (9,800 feet) above sea level, and had traveled some 220 kilometers (140 miles) from the volcano summit. Shiveluch (also spelled Sheveluch) ranks among the biggest and most active volcanoes on the Kamchatka Peninsula. Rising to 3,283 meters (10,771 feet) above sea level, Shiveluch is a stratovolcano composed of alternating layers of hardened lava, compacted ash, and rocks ejected by previous eruptions. The beige-colored expanse of rock on the volcano’s southern slopes (visible in both images) is due to an explosive eruption that occurred in 1964. Part of Shiveluch’s southern flank collapsed, and the light-colored rock is avalanche debris left by that event. High-resolution imagery of Shiveluch shows very little vegetation within that avalanche zone. On October 6, 2012, KVERT cited observations from the Moderate Resolution Imaging Spectroradiometer (MODIS) instruments on Terra and Aqua in detecting the Shiveluch eruption. This was not the first time that MODIS observed a Shiveluch eruption shortly after it started. In 2007, MODIS captured an image within minutes of the eruption’s start, before winds could blow the ash away from the summit. When NASA’s Terra satellite passed over Russia’s Kamchatka Peninsula at noon local time (00:00 Universal Time) on October 6, 2012, Shilveluch Volcano was quiet (top image). By the time NASA’s Aqua satellite passed over the area two hours later (bottom image), the volcano had erupted and sent a plume of ash over the Kamchatskiy Zaliv. The plume traveled about 90 kilometers (55 miles) toward the south-southeast, where a change in wind direction began pushing the plume toward the east. On October 6, 2012, the Kamchatka Volcanic Emergency Response Team (KVERT) reported that the ash plume from Shiveluch reached an altitude of 3 kilometers (9,800 feet) above sea level, and had traveled some 220 kilometers (140 miles) from the volcano summit. Shiveluch (also spelled Sheveluch) ranks among the biggest and most active volcanoes on the Kamchatka Peninsula. Rising to 3,283 meters (10,771 feet) above sea level, Shiveluch is a stratovolcano composed of alternating layers of hardened lava, compacted ash, and rocks ejected by previous eruptions. The beige-colored expanse of rock on the volcano’s southern slopes (visible in both images) is due to an explosive eruption that occurred in 1964. Part of Shiveluch’s southern flank collapsed, and the light-colored rock is avalanche debris left by that event. High-resolution imagery of Shiveluch shows very little vegetation within that avalanche zone. On October 6, 2012, KVERT cited observations from the Moderate Resolution Imaging Spectroradiometer (MODIS) instruments on Terra and Aqua in detecting the Shiveluch eruption. This was not the first time that MODIS observed a Shiveluch eruption shortly after it started. In 2007, MODIS captured an image within minutes of the eruption’s start, before winds could blow the ash away from the summit. Credit: <b><a href="http://www.earthobservatory.nasa.gov/" rel="nofollow"> NASA Earth Observatory</a></b> <b><a href="http://www.nasa.gov/audience/formedia/features/MP_Photo_Guidelines.html" rel="nofollow">NASA image use policy.</a></b> <b><a href="http://www.nasa.gov/centers/goddard/home/index.html" rel="nofollow">NASA Goddard Space Flight Center</a></b> enables NASA’s mission through four scientific endeavors: Earth Science, Heliophysics, Solar System Exploration, and Astrophysics. Goddard plays a leading role in NASA’s accomplishments by contributing compelling scientific knowledge to advance the Agency’s mission. <b>Follow us on <a href="http://twitter.com/NASA_GoddardPix" rel="nofollow">Twitter</a></b> <b>Like us on <a href="http://www.facebook.com/pages/Greenbelt-MD/NASA-Goddard/395013845897?ref=tsd" rel="nofollow">Facebook</a></b> <b>Find us on <a href="http://instagrid.me/nasagoddard/?vm=grid" rel="nofollow">Instagram</a></b>
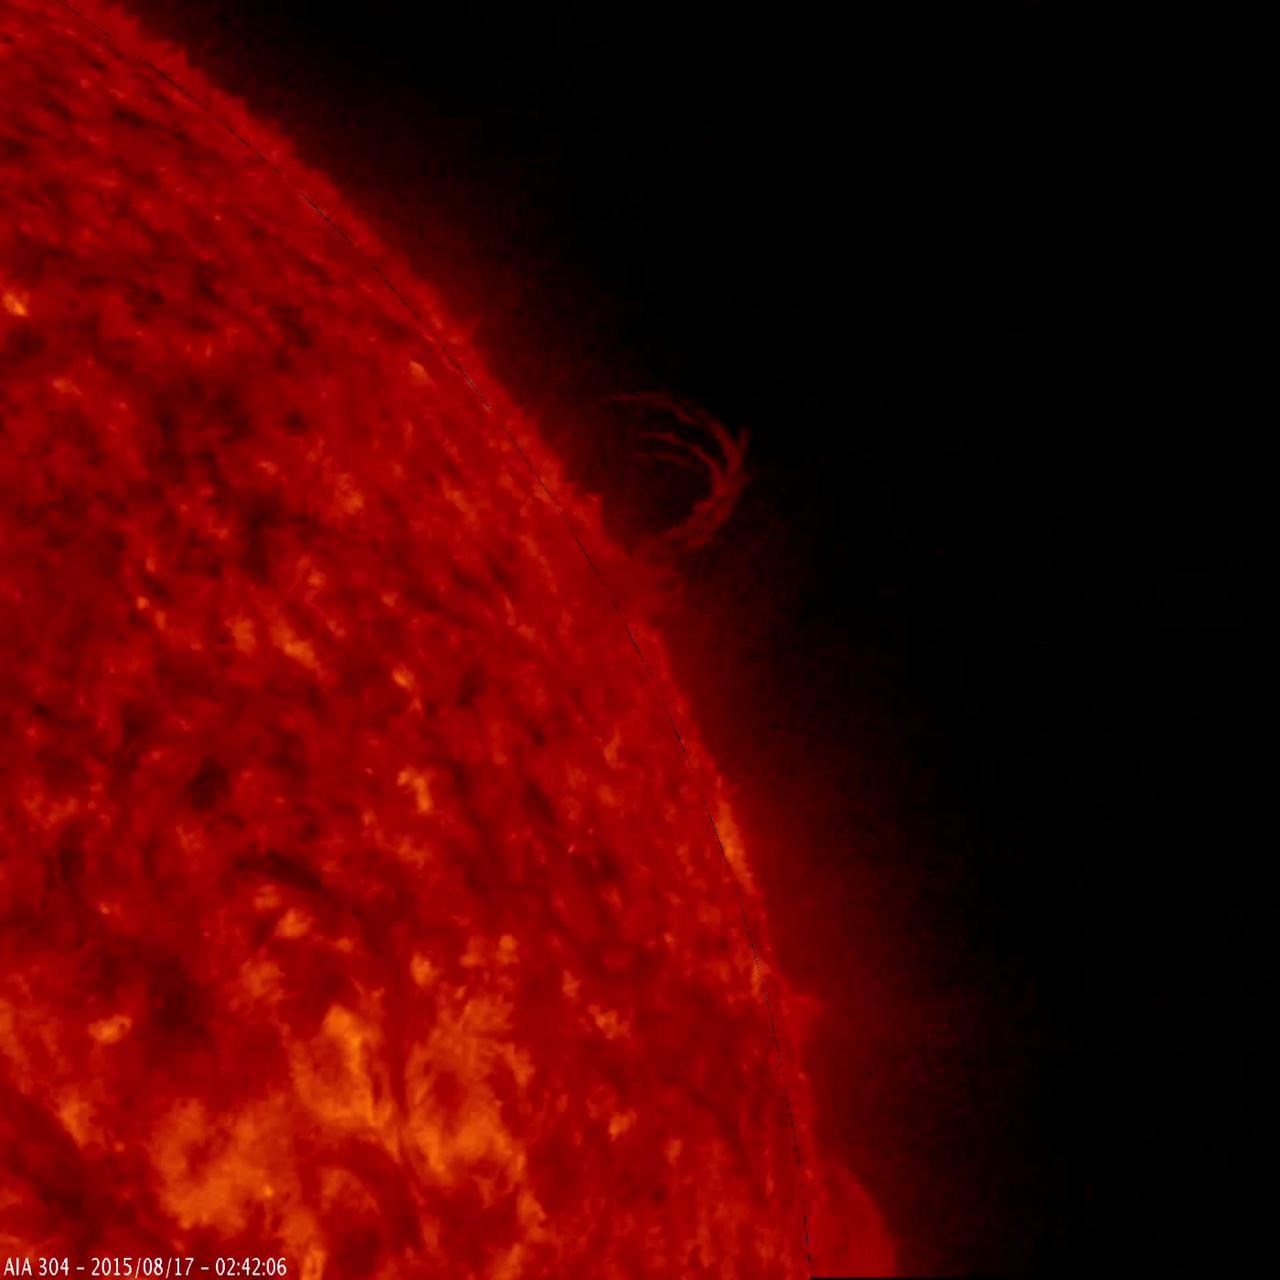
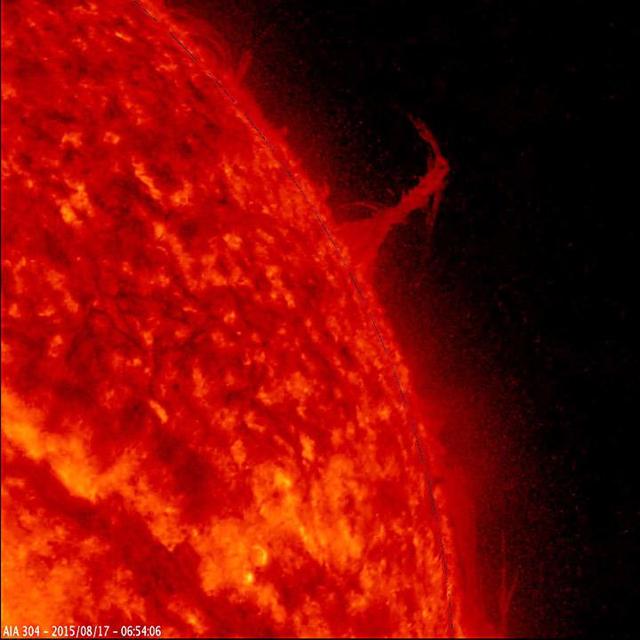
A single plume of plasma, many times taller than the diameter of Earth, rose up from the Sun, twisted and spun around, all the while spewing streams of particles for over two days (Aug. 17-19, 2015) before breaking apart. At times, its shape resembled the Eiffel Tower. Other lesser plumes and streams of particles can be seen dancing above the solar surface as well. The action was observed in a wavelength of extreme ultraviolet light. Credit: NASA/Goddard/SDO <b><a href="http://www.nasa.gov/audience/formedia/features/MP_Photo_Guidelines.html" rel="nofollow">NASA image use policy.</a></b> <b><a href="http://www.nasa.gov/centers/goddard/home/index.html" rel="nofollow">NASA Goddard Space Flight Center</a></b> enables NASA’s mission through four scientific endeavors: Earth Science, Heliophysics, Solar System Exploration, and Astrophysics. Goddard plays a leading role in NASA’s accomplishments by contributing compelling scientific knowledge to advance the Agency’s mission. <b>Follow us on <a href="http://twitter.com/NASAGoddardPix" rel="nofollow">Twitter</a></b> <b>Like us on <a href="http://www.facebook.com/pages/Greenbelt-MD/NASA-Goddard/395013845897?ref=tsd" rel="nofollow">Facebook</a></b> <b>Find us on <a href="http://instagrid.me/nasagoddard/?vm=grid" rel="nofollow">Instagram</a></b>
A single plume of plasma, many times taller than the diameter of Earth, rose up from the Sun, twisted and spun around, all the while spewing streams of particles for over two days (Aug. 17-19, 2015) before breaking apart. At times, its shape resembled the Eiffel Tower. Other lesser plumes and streams of particles can be seen dancing above the solar surface as well. The action was observed in a wavelength of extreme ultraviolet light. Credit: NASA/Goddard/SDO <b><a href="http://www.nasa.gov/audience/formedia/features/MP_Photo_Guidelines.html" rel="nofollow">NASA image use policy.</a></b> <b><a href="http://www.nasa.gov/centers/goddard/home/index.html" rel="nofollow">NASA Goddard Space Flight Center</a></b> enables NASA’s mission through four scientific endeavors: Earth Science, Heliophysics, Solar System Exploration, and Astrophysics. Goddard plays a leading role in NASA’s accomplishments by contributing compelling scientific knowledge to advance the Agency’s mission. <b>Follow us on <a href="http://twitter.com/NASAGoddardPix" rel="nofollow">Twitter</a></b> <b>Like us on <a href="http://www.facebook.com/pages/Greenbelt-MD/NASA-Goddard/395013845897?ref=tsd" rel="nofollow">Facebook</a></b> <b>Find us on <a href="http://instagrid.me/nasagoddard/?vm=grid" rel="nofollow">Instagram</a></b>
A single plume of plasma, many times taller than the diameter of Earth, rose up from the Sun, twisted and spun around, all the while spewing streams of particles for over two days (Aug. 17-19, 2015) before breaking apart. At times, its shape resembled the Eiffel Tower. Other lesser plumes and streams of particles can be seen dancing above the solar surface as well. The action was observed in a wavelength of extreme ultraviolet light. Credit: NASA/Goddard/SDO <b><a href="http://www.nasa.gov/audience/formedia/features/MP_Photo_Guidelines.html" rel="nofollow">NASA image use policy.</a></b> <b><a href="http://www.nasa.gov/centers/goddard/home/index.html" rel="nofollow">NASA Goddard Space Flight Center</a></b> enables NASA’s mission through four scientific endeavors: Earth Science, Heliophysics, Solar System Exploration, and Astrophysics. Goddard plays a leading role in NASA’s accomplishments by contributing compelling scientific knowledge to advance the Agency’s mission. <b>Follow us on <a href="http://twitter.com/NASAGoddardPix" rel="nofollow">Twitter</a></b> <b>Like us on <a href="http://www.facebook.com/pages/Greenbelt-MD/NASA-Goddard/395013845897?ref=tsd" rel="nofollow">Facebook</a></b> <b>Find us on <a href="http://instagrid.me/nasagoddard/?vm=grid" rel="nofollow">Instagram</a></b>
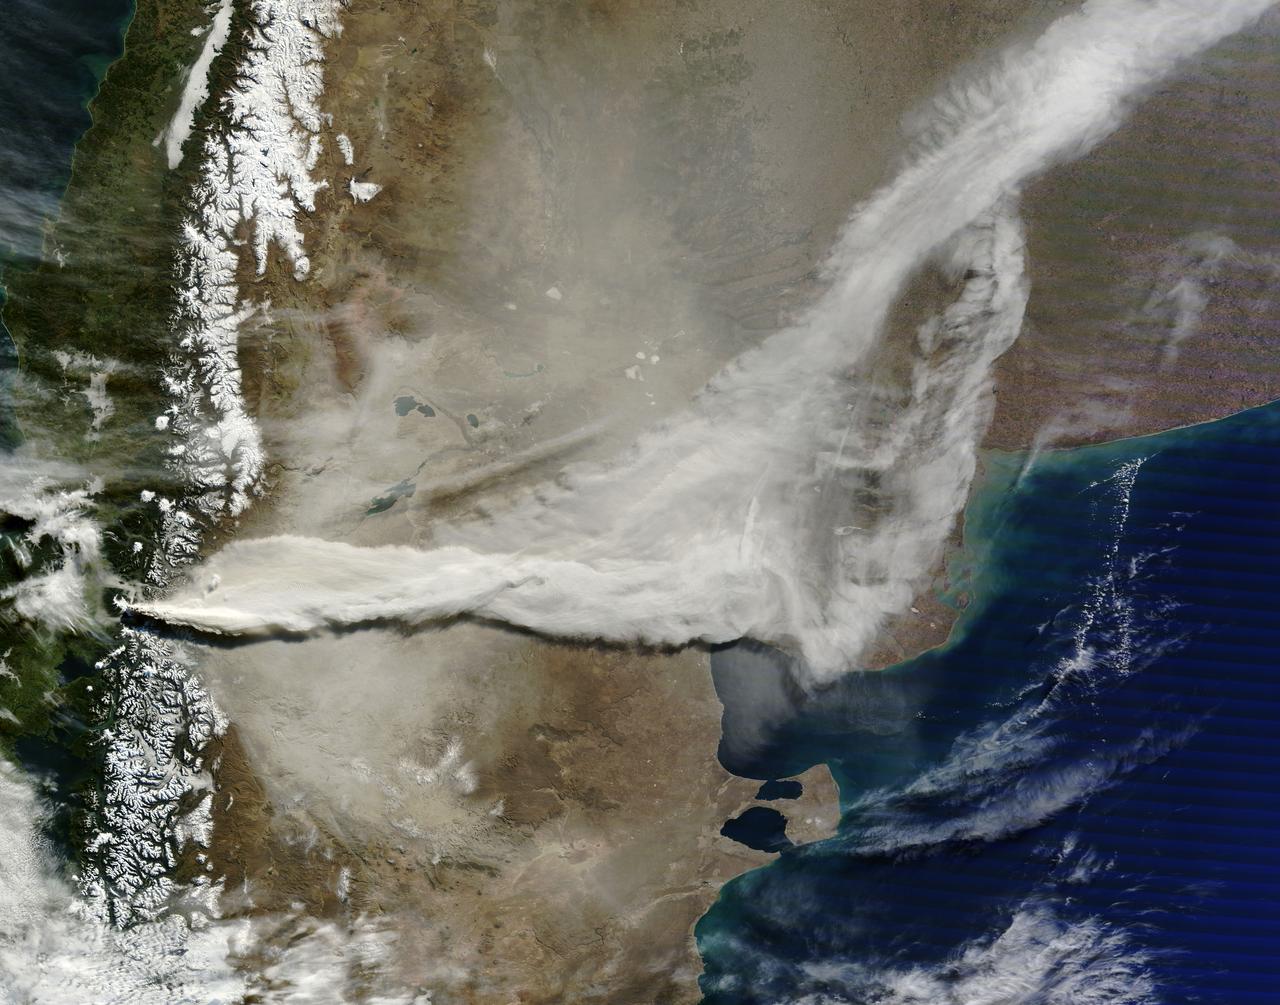
The natural color image below, acquired on April 25 by the Advanced Land Imager on NASA’s Earth Observing-1 satellite, shows Calbuco’s plume rising above the cloud deck over Chile.
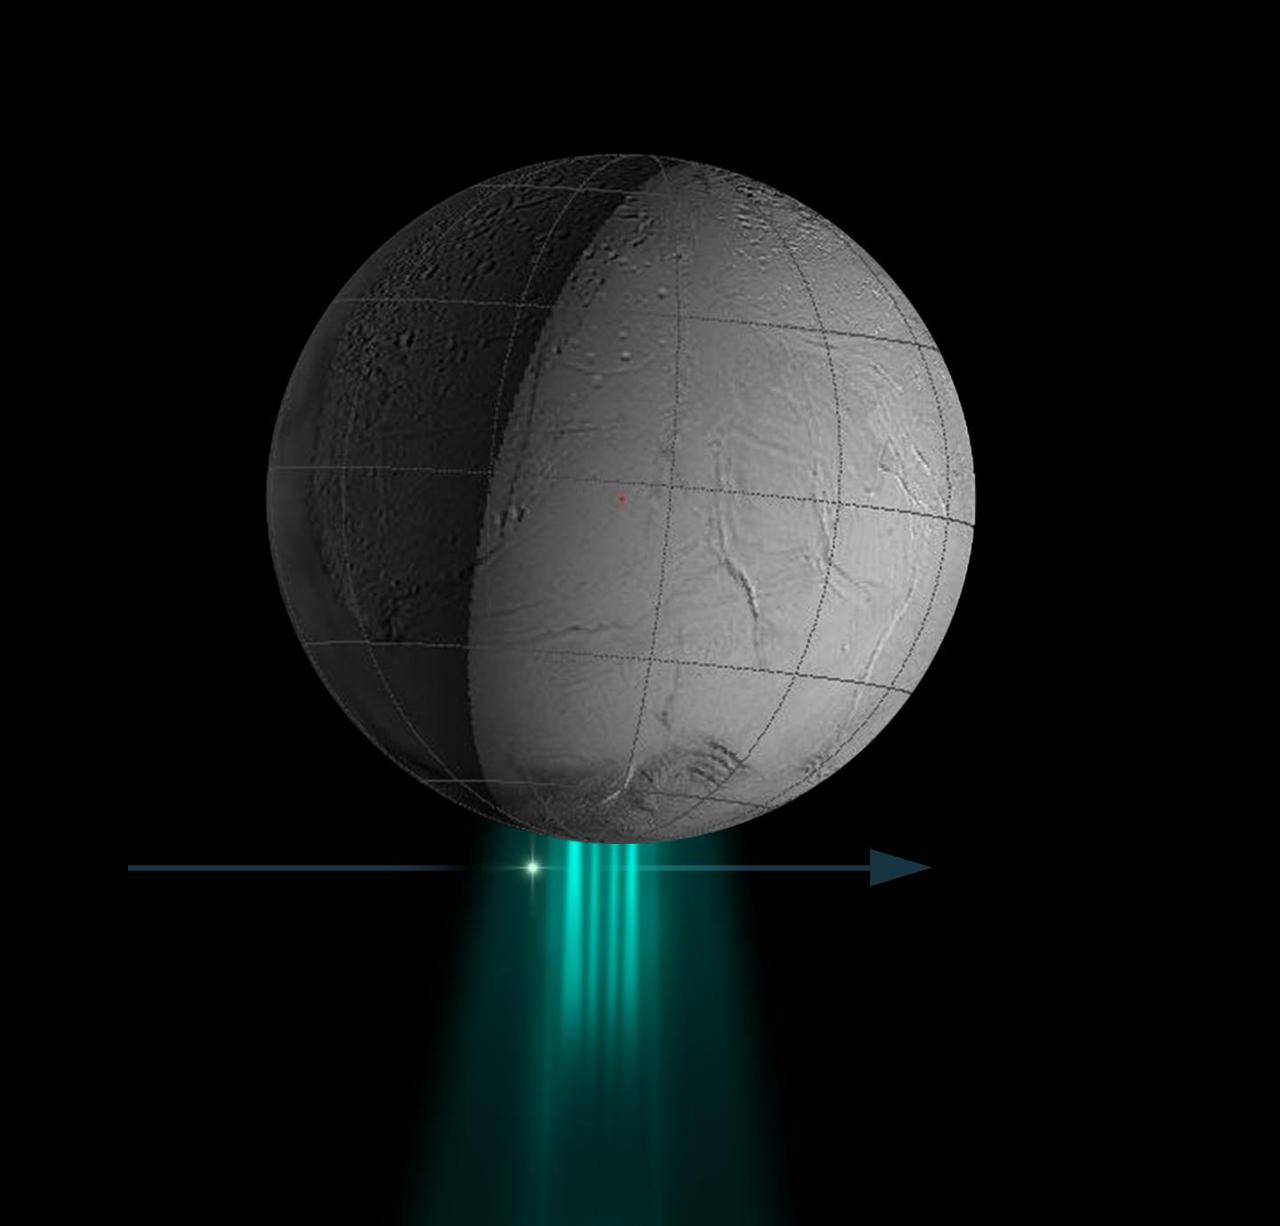
Stellar Data on Plume
Masubi Plume on Io

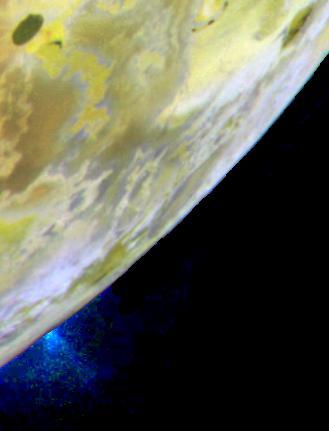
Io Pele Plume
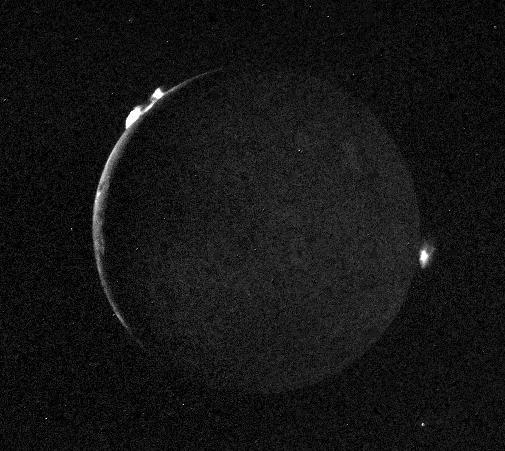
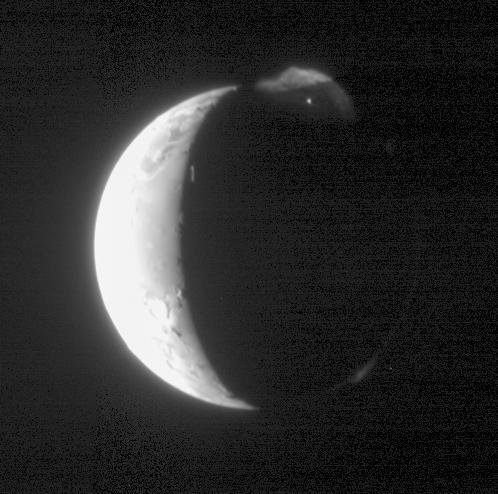
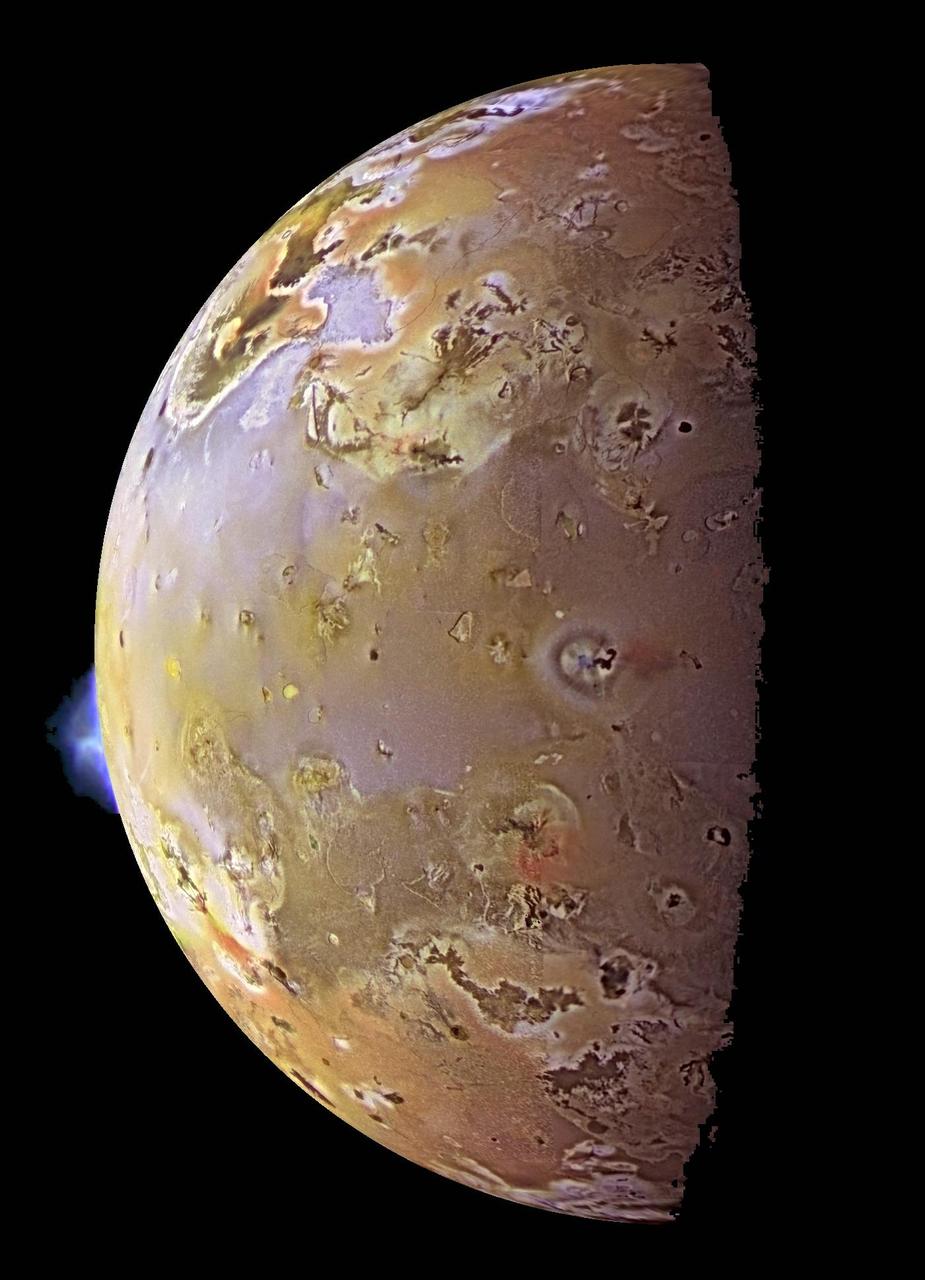
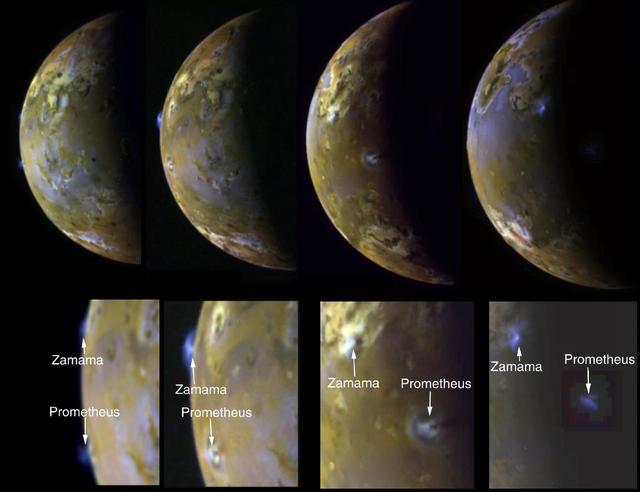
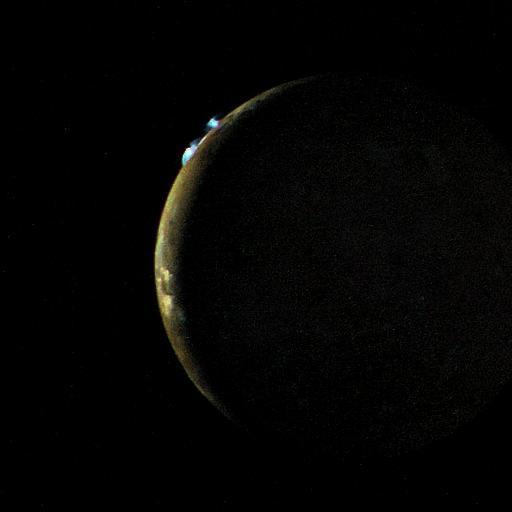
Io - Crescent with Plumes
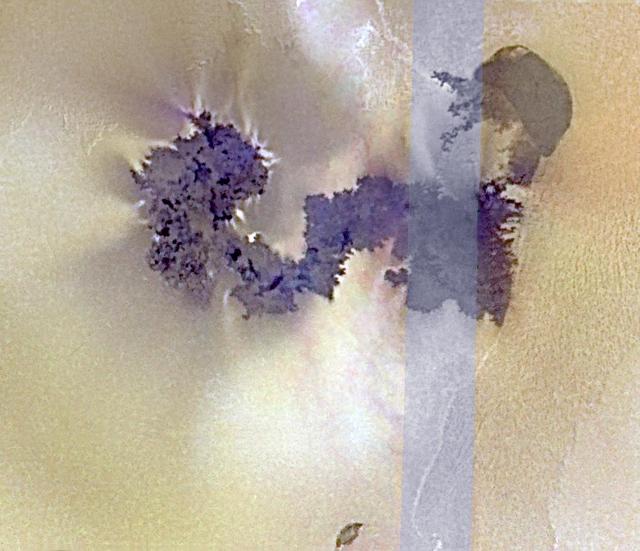
Pele Plume Deposit on Io
Triton Dark Plume
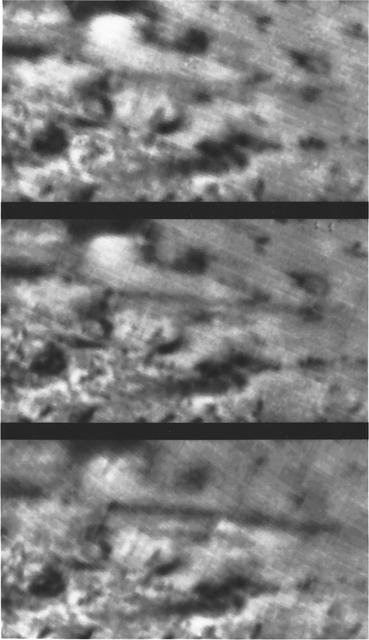
Migrating Volcanic Plumes on Io
Triton Volcanic Plumes
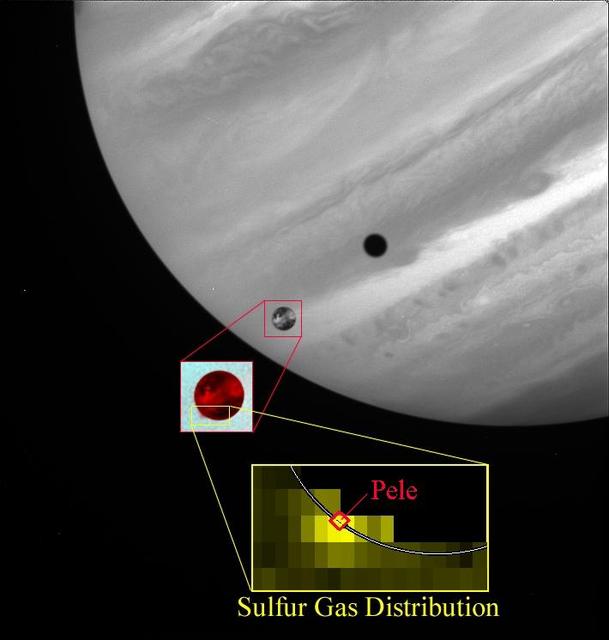
Sulfur Gas in Pele Plume

The natural color image below, acquired on April 25 by the Advanced Land Imager on NASA’s Earth Observing-1 satellite, shows Calbuco’s plume rising above the cloud deck over Chile. Read more here: <a href="http://earthobservatory.nasa.gov/IOTD/view.php?id=85791&eocn=home&eoci=iotd_title" rel="nofollow">earthobservatory.nasa.gov/IOTD/view.php?id=85791&eocn...</a> Credit: <b><a href="http://www.earthobservatory.nasa.gov/" rel="nofollow"> NASA Earth Observatory</a></b> <b><a href="http://www.nasa.gov/audience/formedia/features/MP_Photo_Guidelines.html" rel="nofollow">NASA image use policy.</a></b> <b><a href="http://www.nasa.gov/centers/goddard/home/index.html" rel="nofollow">NASA Goddard Space Flight Center</a></b> enables NASA’s mission through four scientific endeavors: Earth Science, Heliophysics, Solar System Exploration, and Astrophysics. Goddard plays a leading role in NASA’s accomplishments by contributing compelling scientific knowledge to advance the Agency’s mission. <b>Follow us on <a href="http://twitter.com/NASAGoddardPix" rel="nofollow">Twitter</a></b> <b>Like us on <a href="http://www.facebook.com/pages/Greenbelt-MD/NASA-Goddard/395013845897?ref=tsd" rel="nofollow">Facebook</a></b> <b>Find us on <a href="http://instagrid.me/nasagoddard/?vm=grid" rel="nofollow">Instagram</a></b>
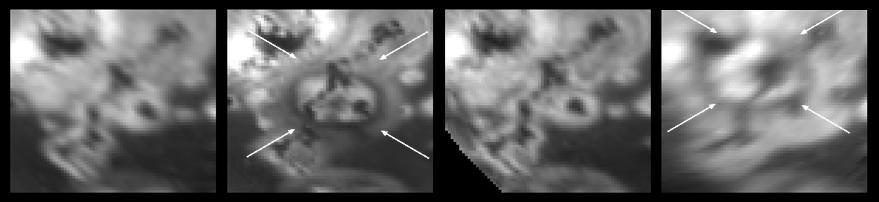
Sources of Volcanic Plumes Near Prometheus
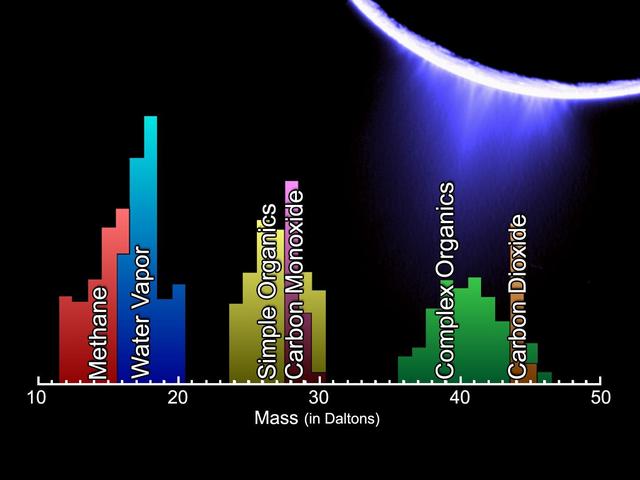
Enceladus Plume Neutral Mass Spectrum
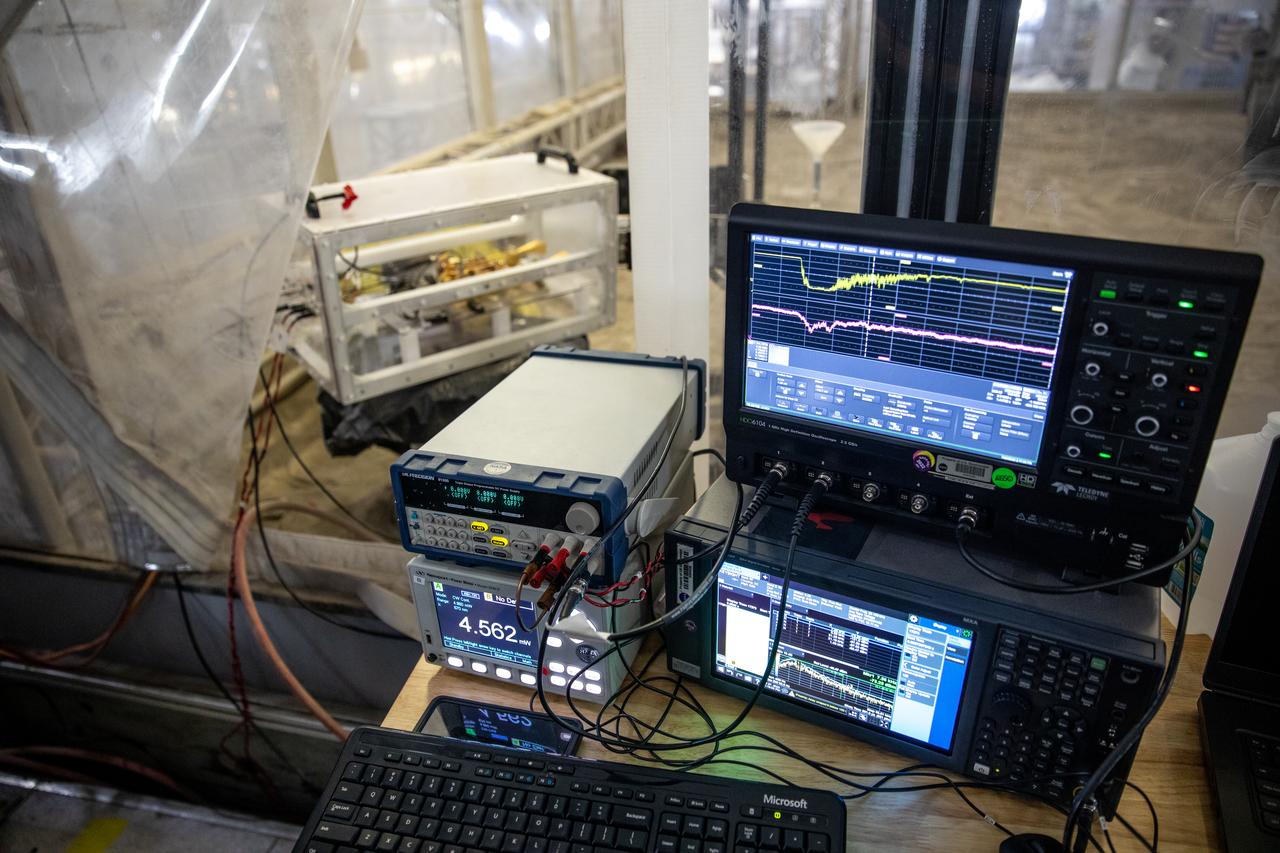
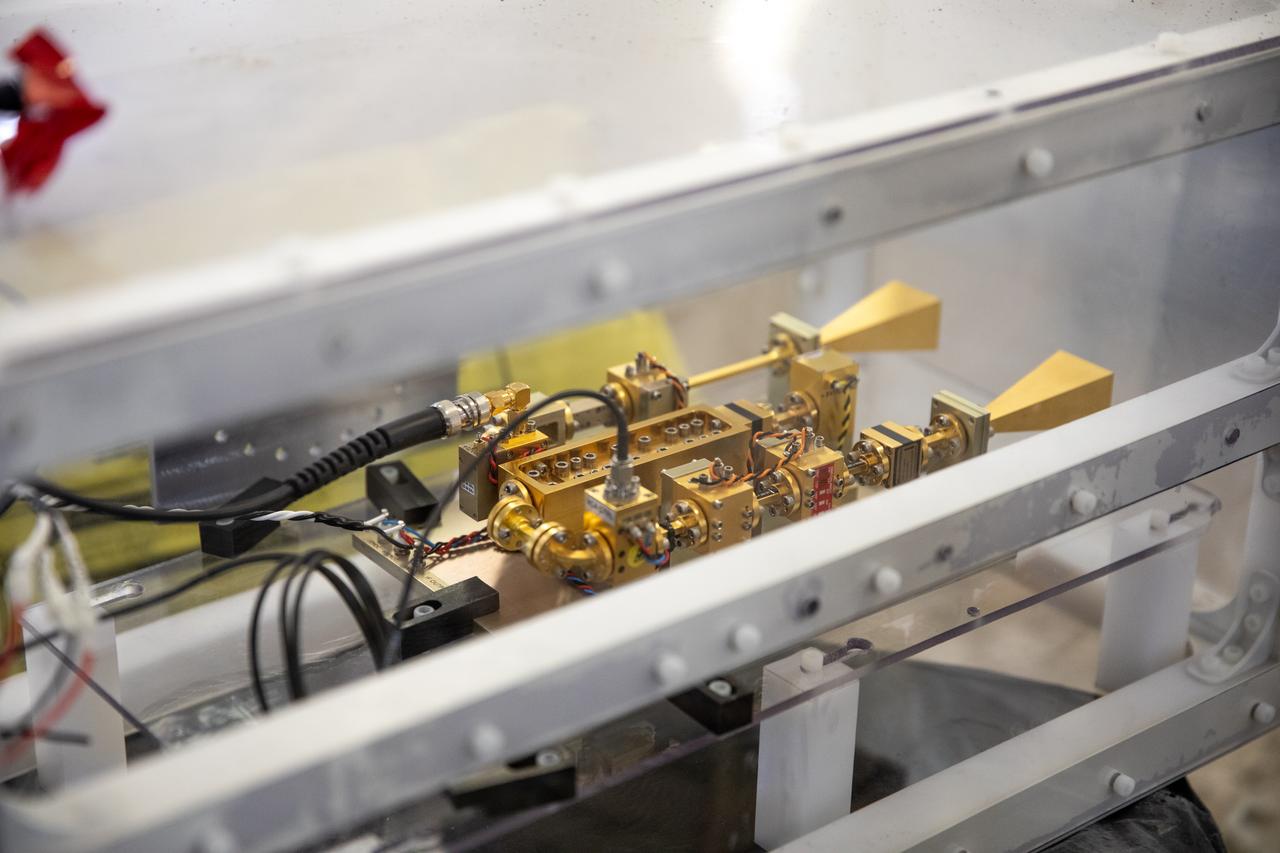
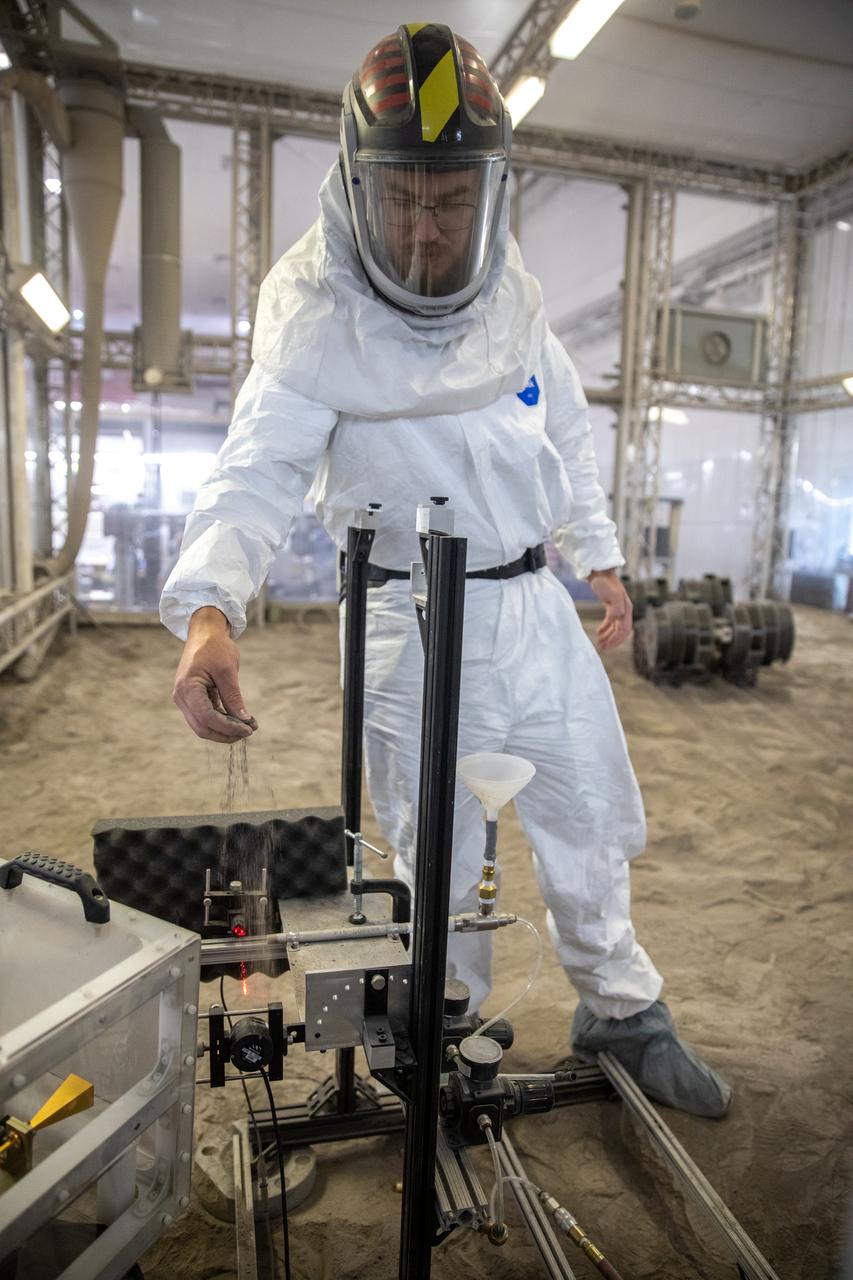
The Dust Concentration Monitor and the Millimeter Wave Doppler Radar undergo testing inside a regolith bin at the Granular Mechanics and Regolith Operations (GMRO) lab at the Kennedy Space Center’s Swamp Works on July 28, 2022, as part of Plume Surface Interaction (PSI) Instrumentation testing. The PSI Project is advancing both modeling and testing capabilities to understand exactly how rocket exhaust plumes affect a planetary landing site. This advanced modeling will help engineers evaluate the risks of various plumes on planetary surfaces, which will help them more accurately design landers for particular locations.
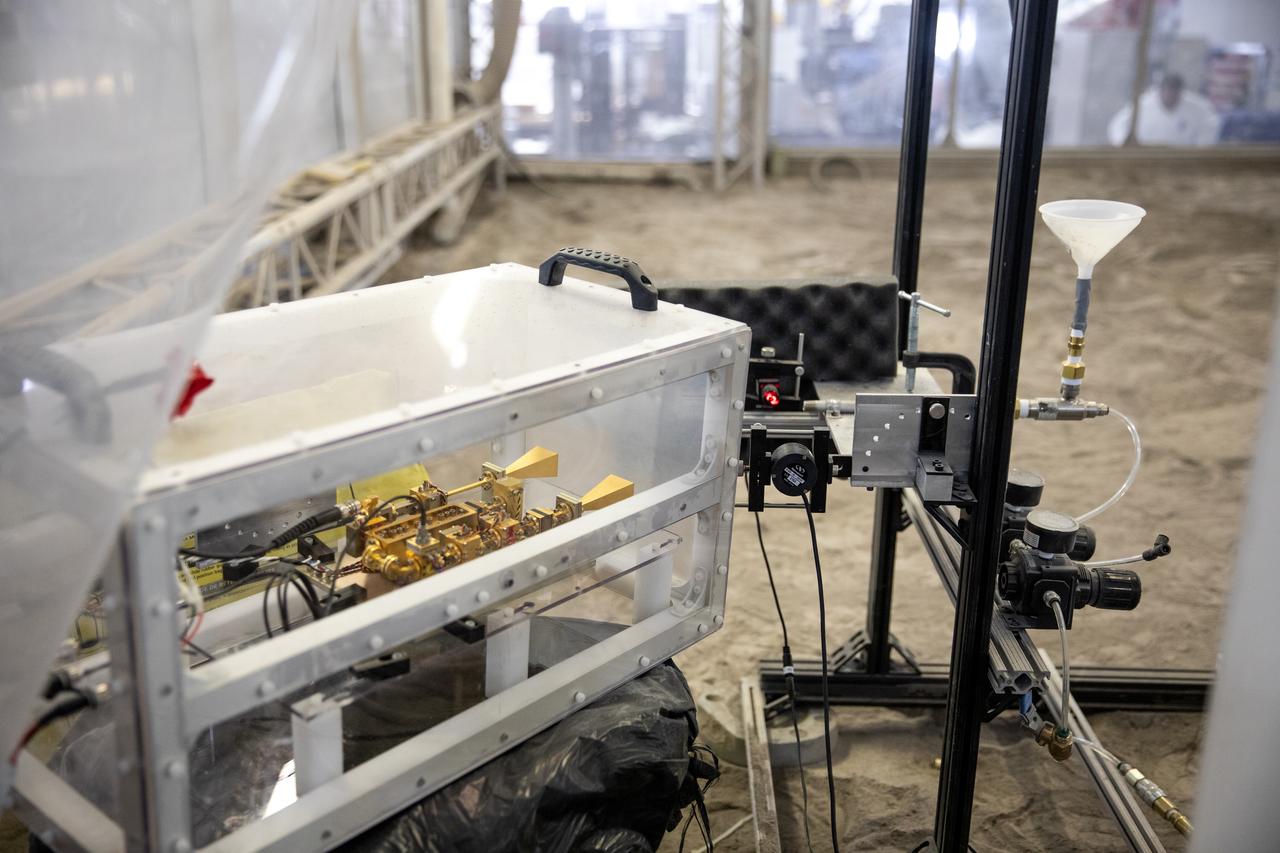
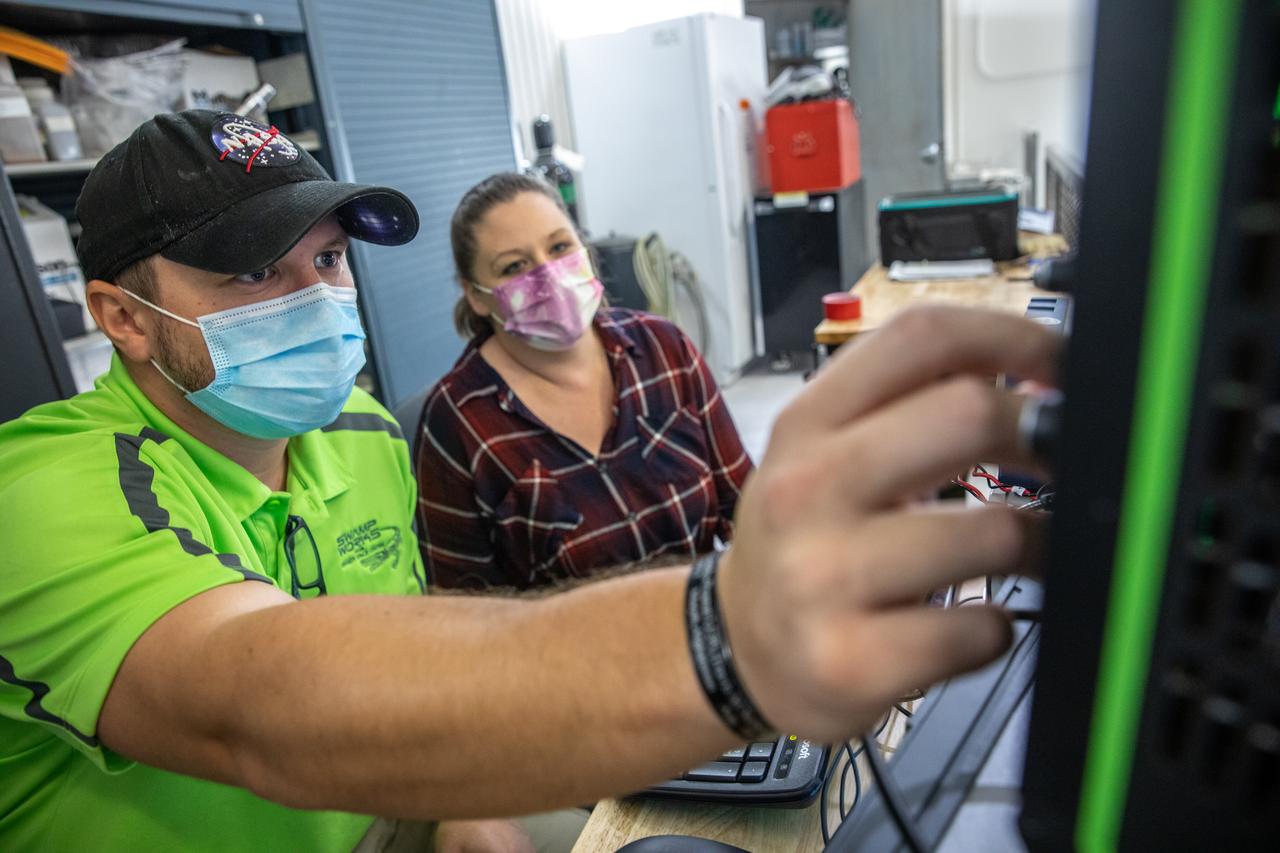
A team at NASA’s Kennedy Space Center in Florida assesses the Dust Concentration Monitor and the Millimeter Wave Doppler Radar inside a regolith bin at the Granular Mechanics and Regolith Operations (GMRO) lab at the spaceport’s Swamp Works on July 28, 2022, as part of Plume Surface Interaction (PSI) Instrumentation testing. The PSI Project is advancing both modeling and testing capabilities to understand exactly how rocket exhaust plumes affect a planetary landing site. This advanced modeling will help engineers evaluate the risks of various plumes on planetary surfaces, which will help them more accurately design landers for particular locations.
A team at NASA’s Kennedy Space Center in Florida assesses the Dust Concentration Monitor and the Millimeter Wave Doppler Radar inside a regolith bin at the Granular Mechanics and Regolith Operations (GMRO) lab at the spaceport’s Swamp Works on July 28, 2022, as part of Plume Surface Interaction (PSI) Instrumentation testing. The PSI Project is advancing both modeling and testing capabilities to understand exactly how rocket exhaust plumes affect a planetary landing site. This advanced modeling will help engineers evaluate the risks of various plumes on planetary surfaces, which will help them more accurately design landers for particular locations.
A team at NASA’s Kennedy Space Center in Florida assesses the Dust Concentration Monitor and the Millimeter Wave Doppler Radar inside a regolith bin at the Granular Mechanics and Regolith Operations (GMRO) lab at the spaceport’s Swamp Works on July 28, 2022, as part of Plume Surface Interaction (PSI) Instrumentation testing. The PSI Project is advancing both modeling and testing capabilities to understand exactly how rocket exhaust plumes affect a planetary landing site. This advanced modeling will help engineers evaluate the risks of various plumes on planetary surfaces, which will help them more accurately design landers for particular locations.
A team at NASA’s Kennedy Space Center in Florida assesses the Dust Concentration Monitor and the Millimeter Wave Doppler Radar inside a regolith bin at the Granular Mechanics and Regolith Operations (GMRO) lab at the spaceport’s Swamp Works on July 28, 2022, as part of Plume Surface Interaction (PSI) Instrumentation testing. The PSI Project is advancing both modeling and testing capabilities to understand exactly how rocket exhaust plumes affect a planetary landing site. This advanced modeling will help engineers evaluate the risks of various plumes on planetary surfaces, which will help them more accurately design landers for particular locations.

The Dust Concentration Monitor and the Millimeter Wave Doppler Radar undergo testing inside a regolith bin at the Granular Mechanics and Regolith Operations (GMRO) lab at the Kennedy Space Center’s Swamp Works on July 28, 2022, as part of Plume Surface Interaction (PSI) Instrumentation testing. The PSI Project is advancing both modeling and testing capabilities to understand exactly how rocket exhaust plumes affect a planetary landing site. This advanced modeling will help engineers evaluate the risks of various plumes on planetary surfaces, which will help them more accurately design landers for particular locations.
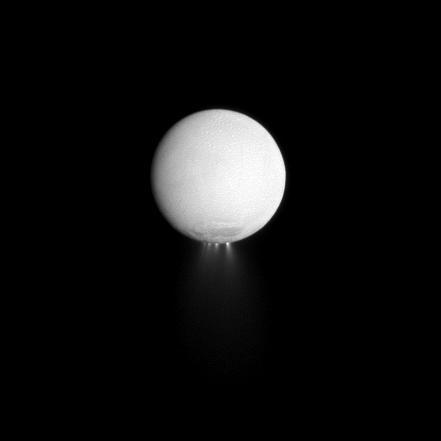
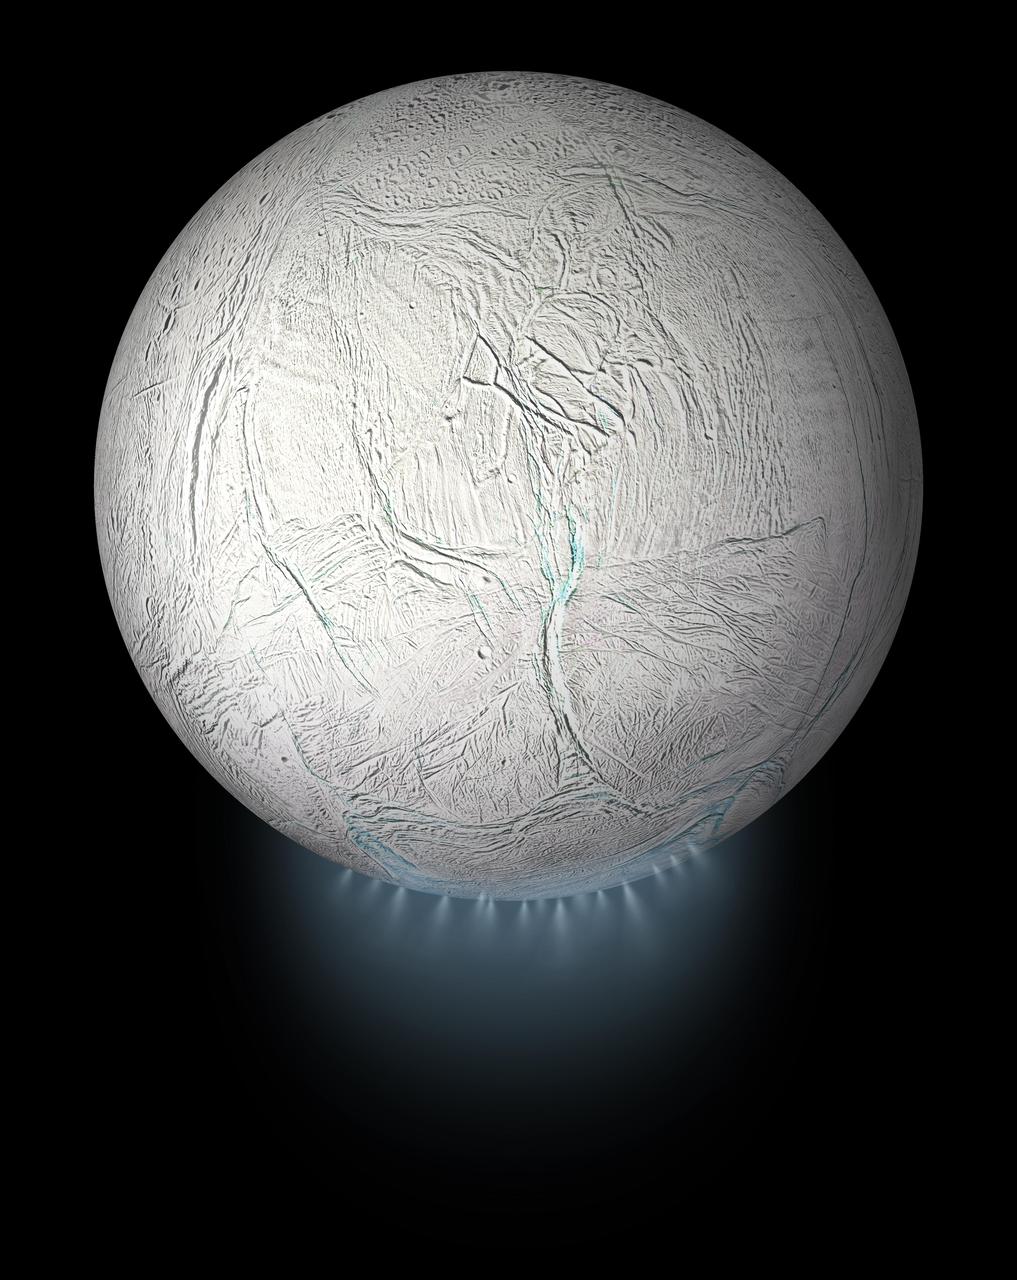
At least four distinct plumes of water ice spew out from the south polar region of Saturn moon Enceladus in this dramatically illuminated image. Light reflected off Saturn is illuminating the surface of the moon while the sun backlights the plumes.
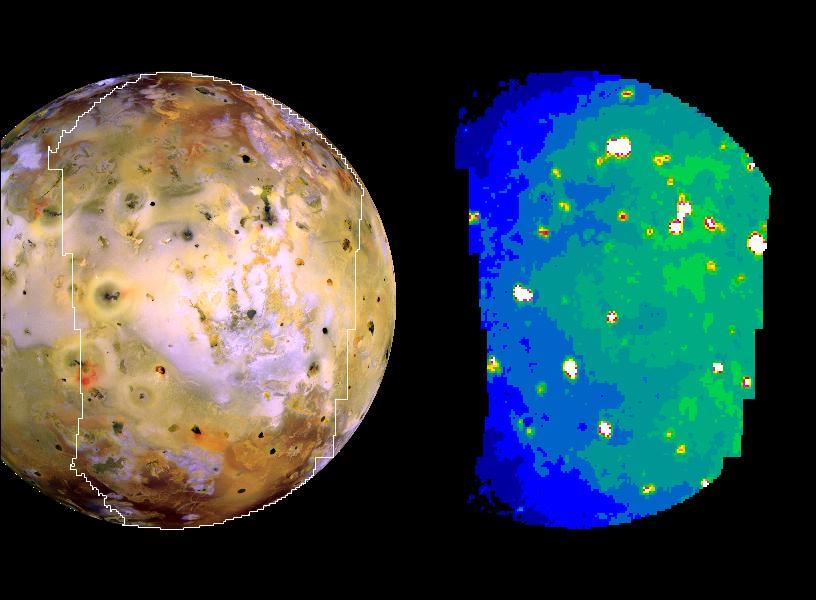
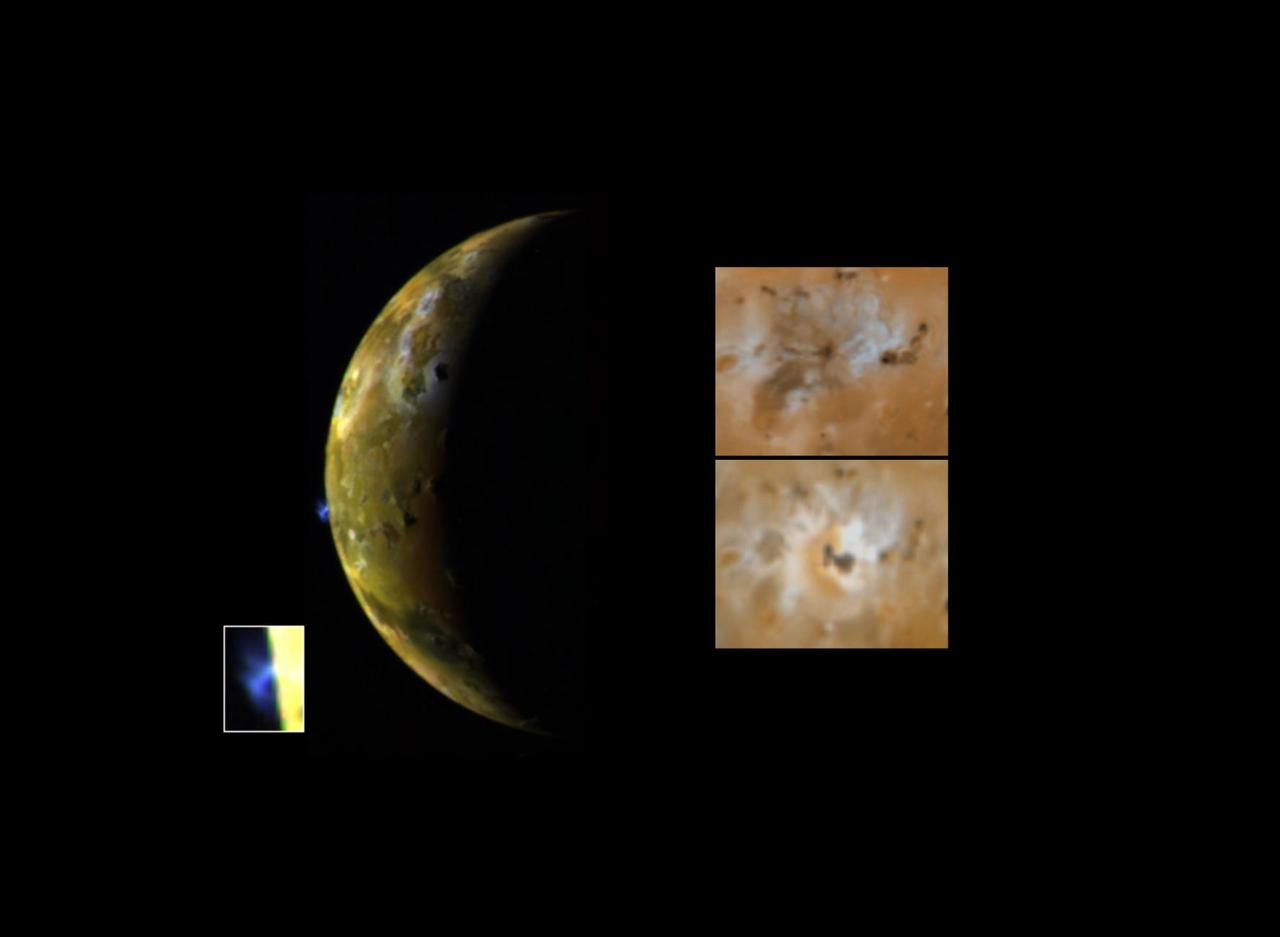
Color Mosaic and Active Volcanic Plumes on Io
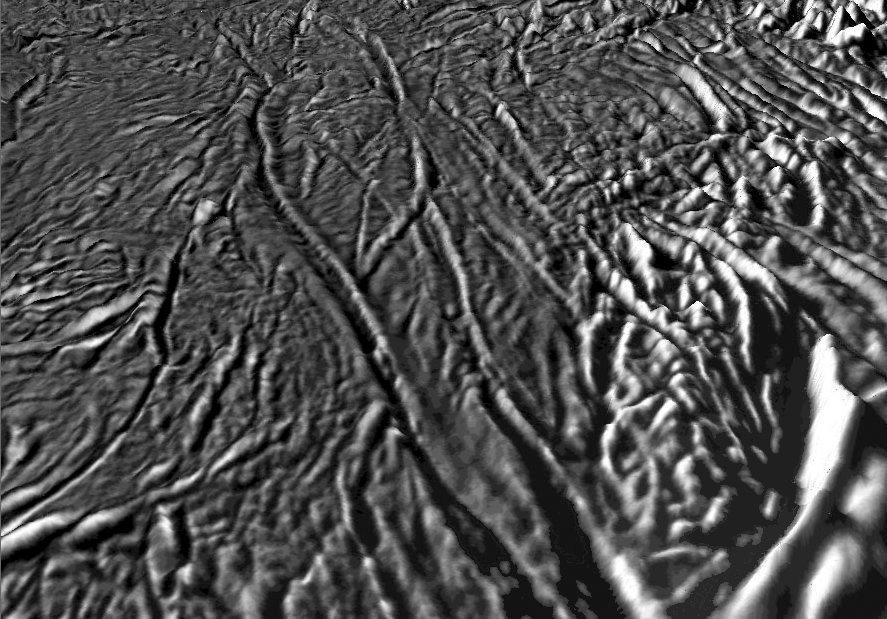
Tiger Stripes on Enceladus - Fracture Zones and Plumes Sources
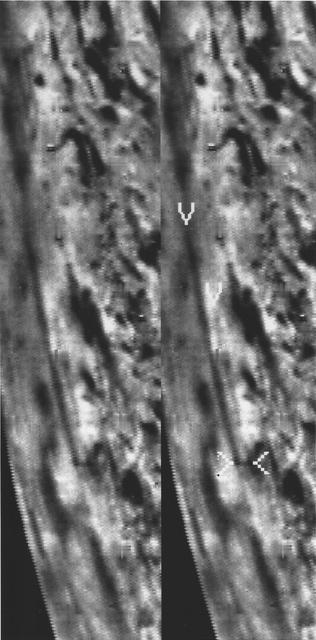
New plume vent near Zamama, Io
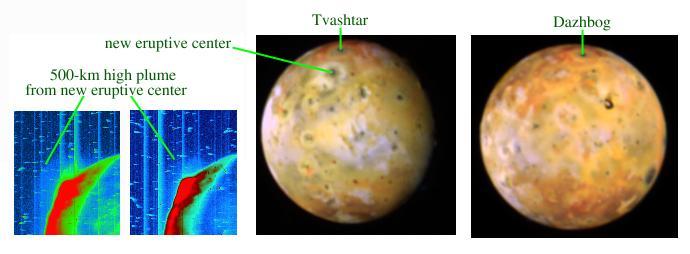
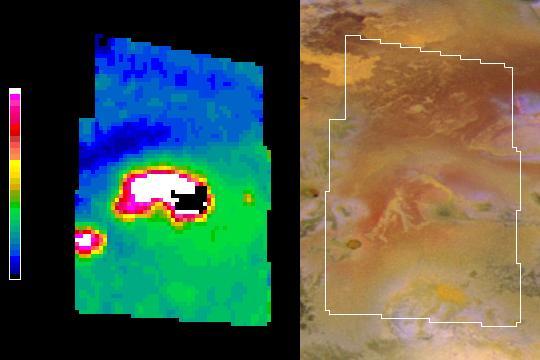
Io in Infrared with Giant Plume New Hot Spot
Sequence Showing Active Volcanic Plumes on Io

Hubble Captures Volcanic Eruption Plume From Io

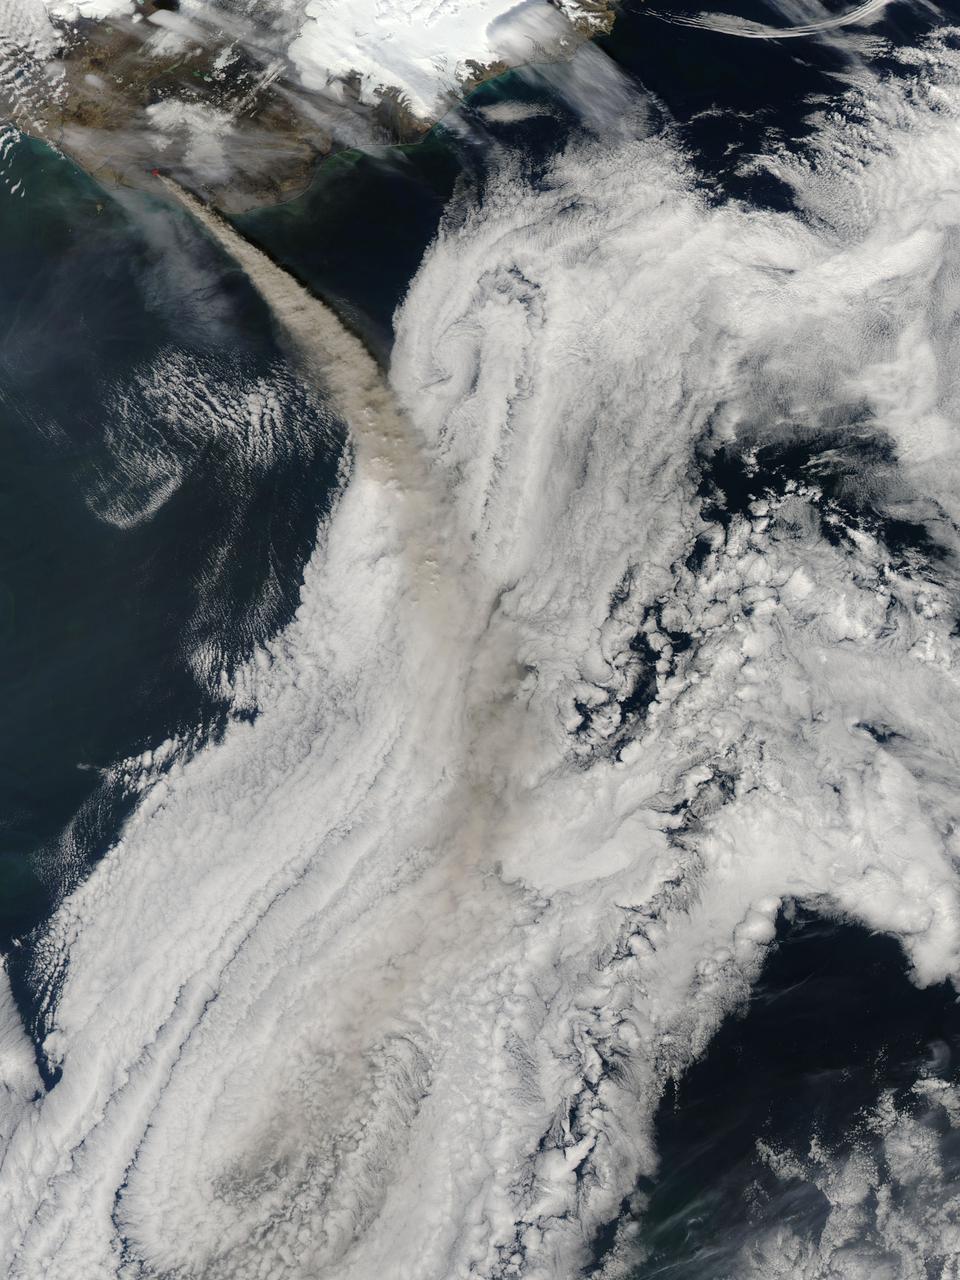
NASA satellite image acquired May 6, 2010 at 11 :55 UTC To view a detail of this image go to: <a href="http://www.flickr.com/photos/gsfc/4583711511/">www.flickr.com/photos/gsfc/4583711511/</a> NASA Satellite Sees a Darker Ash Plume From Iceland Volcano NASA's Terra satellite flew over the Eyjafjallajokull Volcano, Iceland, on May 6 at 11:55 UTC (7:55 a.m. EDT). The Moderate Resolution Imaging Spectroradiometer instrument known as MODIS that flies onboard Terra, captured a visible image of the ash plume. The plume was blowing east then southeast over the Northern Atlantic. The satellite image shows that the plume is at a lower level in the atmosphere than the clouds that lie to its east, as the brown plume appears to slide underneath the white clouds. Satellite: Terra NASA/GSFC/Jeff Schmaltz/MODIS Land Rapid Response Team To learn more about MODIS go to: <a href="http://www.nasa.gov/topics/earth/features/iceland-volcano-plume.html" rel="nofollow">www.nasa.gov/topics/earth/features/iceland-volcano-plume....</a> <b><a href="http://www.nasa.gov/centers/goddard/home/index.html" rel="nofollow">NASA Goddard Space Flight Center</a></b> is home to the nation's largest organization of combined scientists, engineers and technologists that build spacecraft, instruments and new technology to study the Earth, the sun, our solar system, and the universe.
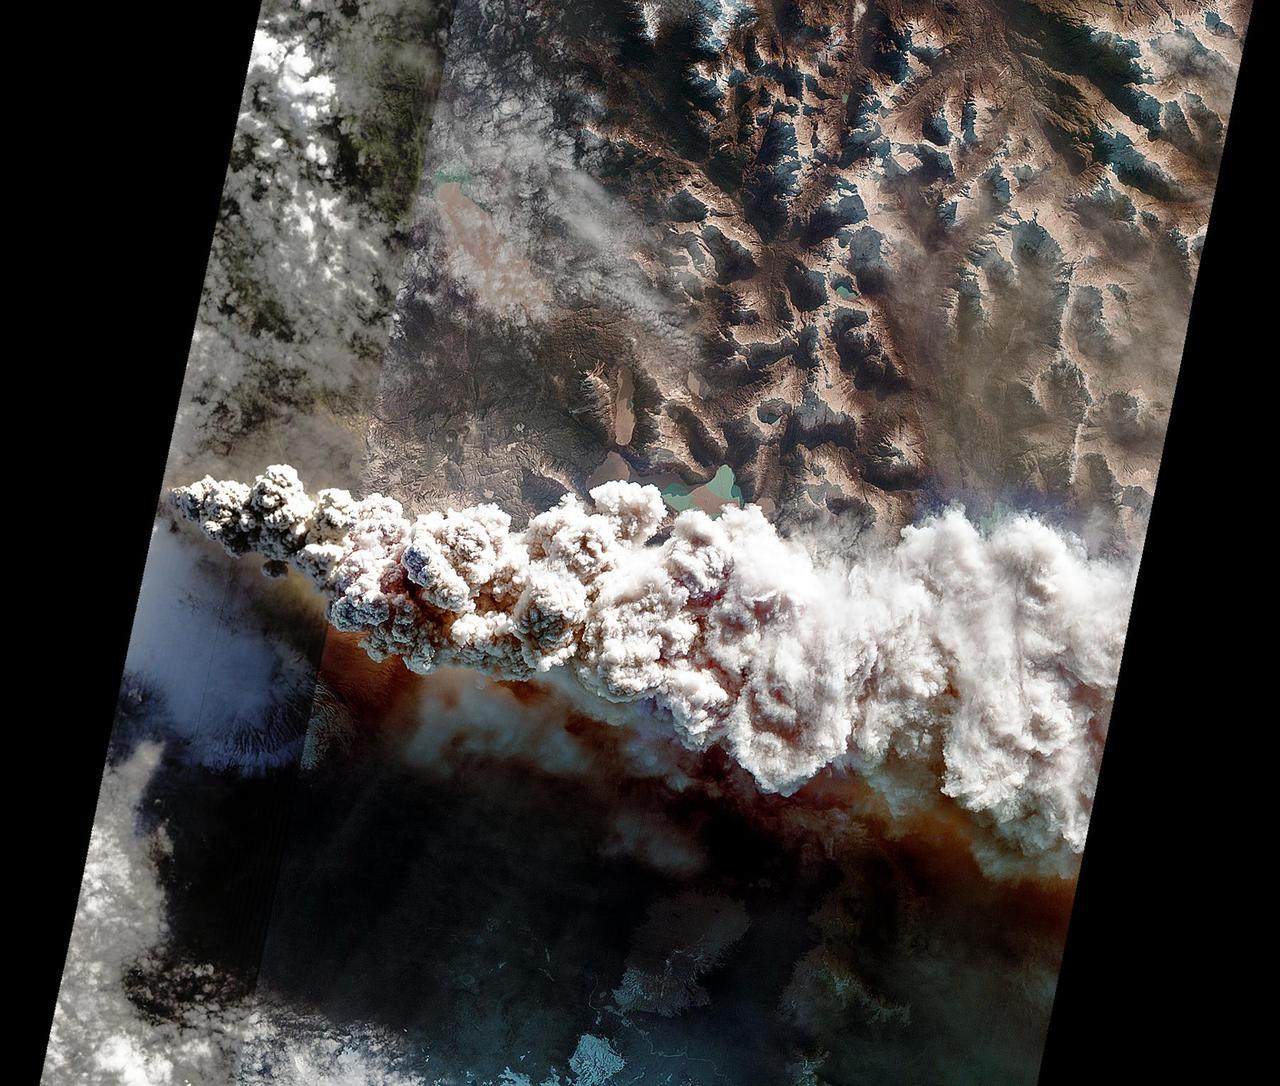
June 13, 2011 The MODIS instrument on NASA's Terra satellite captured this visible image of the ash plume from the eruption of the Puyehue-Cordón Caulle volcano, Chile on June 13 at 14:35 UTC (10:35 a.m. EDT). The wind shifted from the day before and was now blowing from the west and southwest, pushing the plume east and northeast. Note the snow on the Andes Mountain rage. Image Credit: NASA Goddard/MODIS Rapid Response, Jeff Schmaltz/Text: NASA/Rob Gutro <b><a href="http://www.nasa.gov/centers/goddard/home/index.html" rel="nofollow">NASA Goddard Space Flight Center</a></b> enables NASA’s mission through four scientific endeavors: Earth Science, Heliophysics, Solar System Exploration, and Astrophysics. Goddard plays a leading role in NASA’s accomplishments by contributing compelling scientific knowledge to advance the Agency’s mission. <b>Follow us on <a href="http://twitter.com/NASA_GoddardPix" rel="nofollow">Twitter</a></b> <b>Join us on <a href="http://www.facebook.com/pages/Greenbelt-MD/NASA-Goddard/395013845897?ref=tsd" rel="nofollow">Facebook</a></b> <b>Find us on <a href="http://web.stagram.com/n/nasagoddard/?vm=grid" rel="nofollow">Instagram</a></b>
This color image, acquired during NASA Galileo ninth orbit around Jupiter, shows two volcanic plumes on Io. One plume was captured on the bright limb or edge of the moon, erupting over a caldera volcanic depression named Pillan Patera.

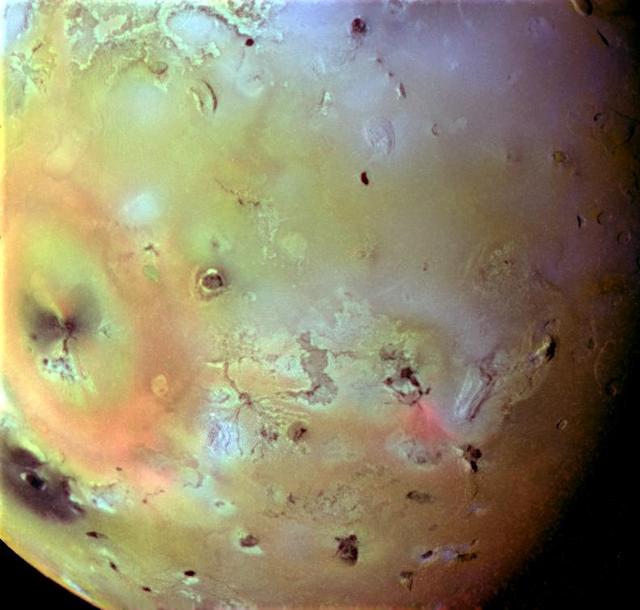
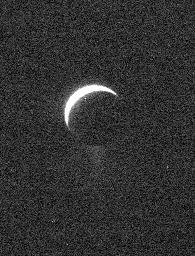
NASA's Voyager 1 image of Io showing active plume of Loki on limb. Heart-shaped feature southeast of Loki consists of fallout deposits from active plume Pele. The images that make up this mosaic were taken from an average distance of approximately 490,000 kilometers (340,000 miles). http://photojournal.jpl.nasa.gov/catalog/PIA00010
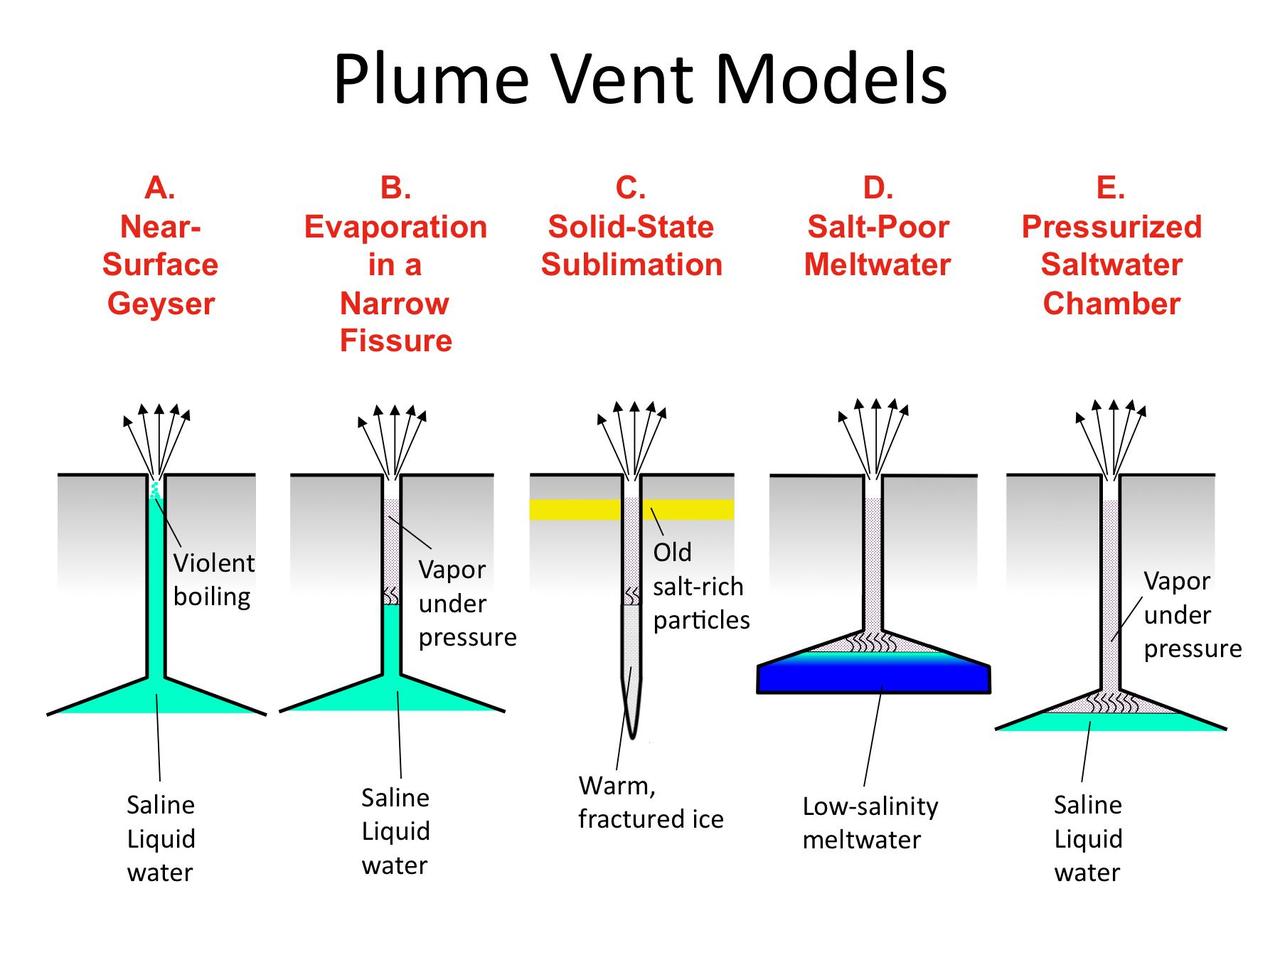
These illustrations indicate possible ways in which the water vapor and ice particles in the plume of Enceladus may be formed.

NASA satellite image acquired May 6, 2010 at 11 :55 UTC To view the full view go to: <a href="http://www.nasa.gov/topics/earth/features/iceland-volcano-plume.html" rel="nofollow">www.nasa.gov/topics/earth/features/iceland-volcano-plume....</a> NASA Satellite Sees a Darker Ash Plume From Iceland Volcano NASA's Terra satellite flew over the Eyjafjallajokull Volcano, Iceland, on May 6 at 11:55 UTC (7:55 a.m. EDT). The Moderate Resolution Imaging Spectroradiometer instrument known as MODIS that flies onboard Terra, captured a visible image of the ash plume. The plume was blowing east then southeast over the Northern Atlantic. The satellite image shows that the plume is at a lower level in the atmosphere than the clouds that lie to its east, as the brown plume appears to slide underneath the white clouds. Satellite: Terra NASA/GSFC/Jeff Schmaltz/MODIS Land Rapid Response Team To learn more about MODIS go to: <a href="http://rapidfire.sci.gsfc.nasa.gov/gallery/?latest" rel="nofollow">rapidfire.sci.gsfc.nasa.gov/gallery/?latest</a> <b><a href="http://www.nasa.gov/centers/goddard/home/index.html" rel="nofollow">NASA Goddard Space Flight Center</a></b> is home to the nation's largest organization of combined scientists, engineers and technologists that build spacecraft, instruments and new technology to study the Earth, the sun, our solar system, and the universe.
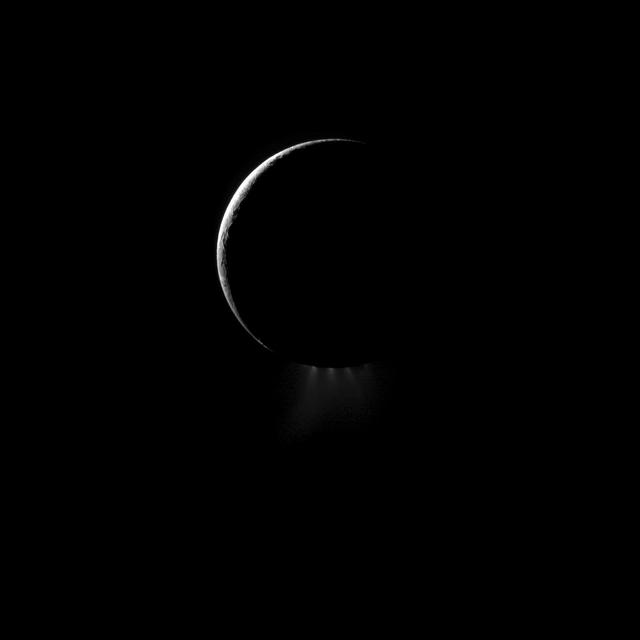
A crescent Enceladus, imaged by NASA Cassini spacecraft from the night side, shows off its spectacular water ice plumes emanating from the south polar region of this moon of Saturn.
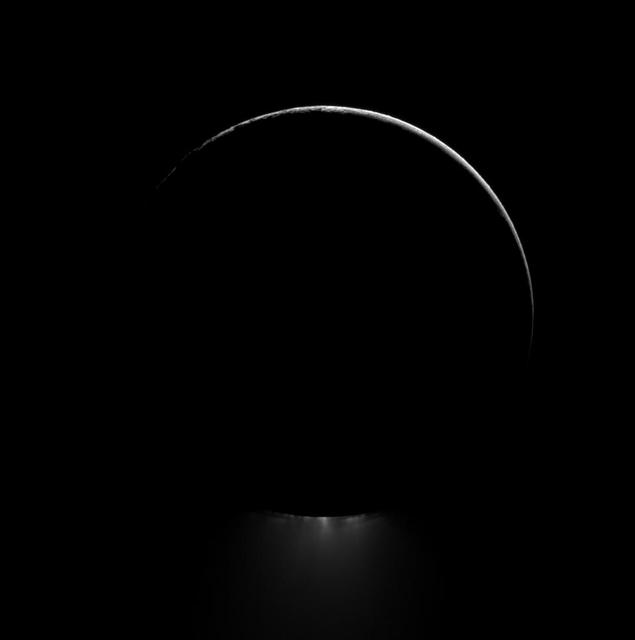
Below a darkened Enceladus, a plume of water ice is backlit in this view of one of Saturn most dramatic moons. This image was captured by NASA Cassini spacecraft.
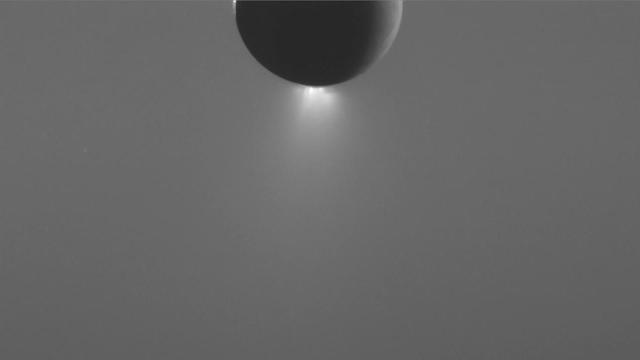
This frame from a sequence of images, captured by NASA Cassini spacecraft, shows changes in the brightness of the Enceladus plume during a 6.5-hour observation.
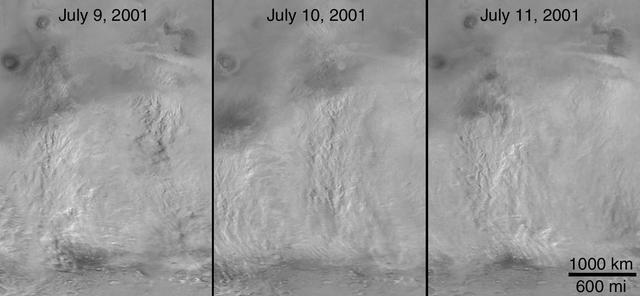
The 2001 Great Dust Storms - Daedalia/Claritas/Syria Dust Plumes
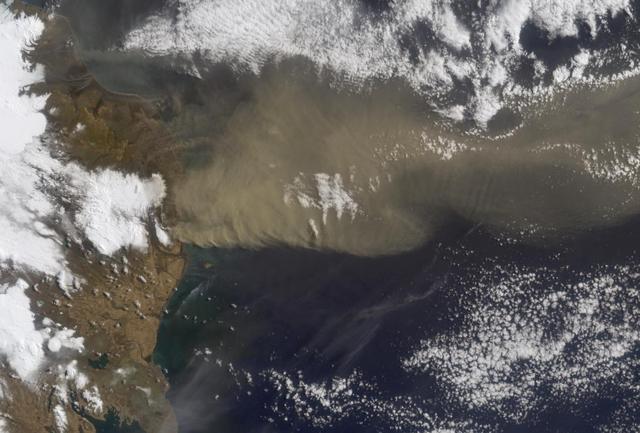
This image from NASA Terra spacecraft shows the ash plume of Iceland Eyjafyallajökull Volcano on April 19, 2010. The eruption plume and drifting veil of ash appear to be homogeneous.
The height and motion of the ash and gas plume from the April 22, 2003, eruption of the Chikurachki volcano is portrayed in these views NASA Terra spacecraft.
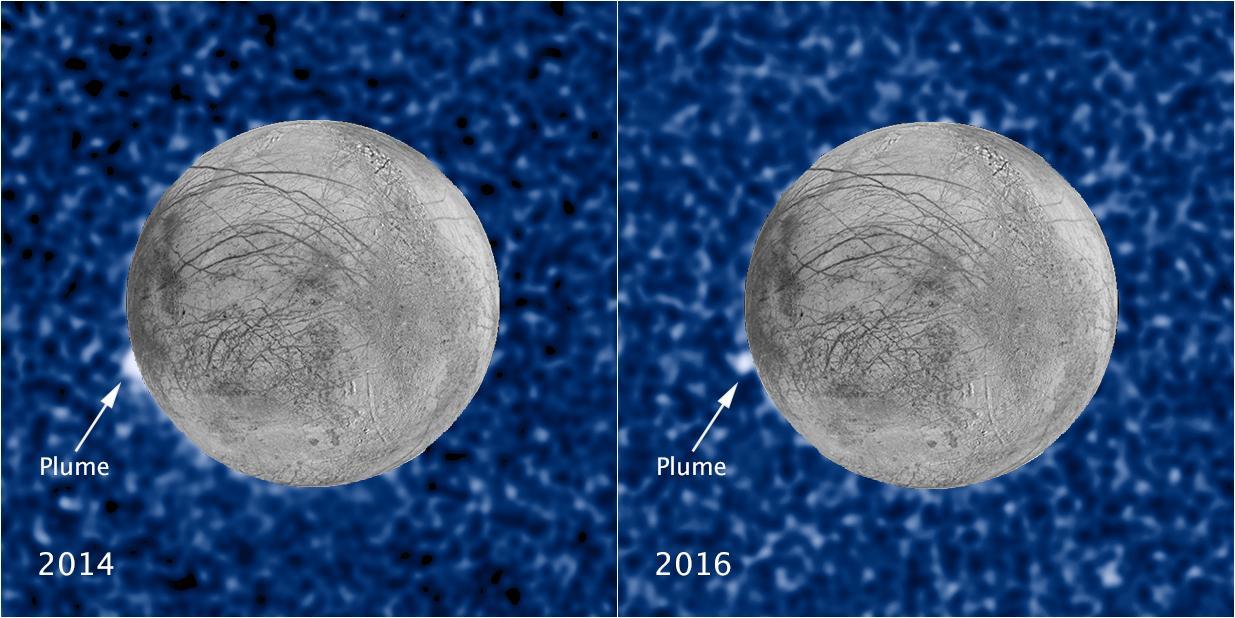
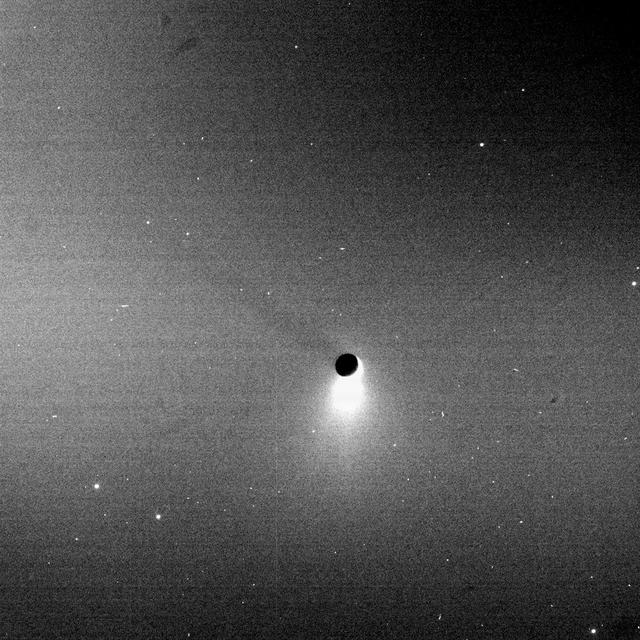
These composite images show a suspected plume of material erupting two years apart from the same location on Jupiter's icy moon Europa. The images bolster evidence that the plumes are a real phenomenon, flaring up intermittently in the same region on the satellite. Both plumes, photographed in ultraviolet light by NASA's Hubble's Space Telescope Imaging Spectrograph, were seen in silhouette as the moon passed in front of Jupiter. The newly imaged plume, shown at right, rises about 62 miles (100 kilometers) above Europa's frozen surface. The image was taken Feb. 22, 2016. The plume in the image at left, observed by Hubble on March 17, 2014, originates from the same location. It is estimated to be about 30 miles (50 kilometers) high. The snapshot of Europa, superimposed on the Hubble image, was assembled from data from NASA's Galileo mission to Jupiter. The plumes correspond to the location of an unusually warm spot on the moon's icy crust, seen in the late 1990s by the Galileo spacecraft (see PIA21444). Researchers speculate that this might be circumstantial evidence for water venting from the moon's subsurface. The material could be associated with the global ocean that is believed to be present beneath the frozen crust. https://photojournal.jpl.nasa.gov/catalog/PIA21443
This still image from an animation from NASA GSFC Solar Dynamics Observatory shows a single plume of plasma, many times taller than the diameter of Earth, spewing streams of particles for over two days Aug. 17-19, 2015 before breaking apart. At times, its shape resembled the Eiffel Tower. Other lesser plumes and streams of particles can be seen dancing above the solar surface as well. The action was observed in a wavelength of extreme ultraviolet light. http://photojournal.jpl.nasa.gov/catalog/PIA19875
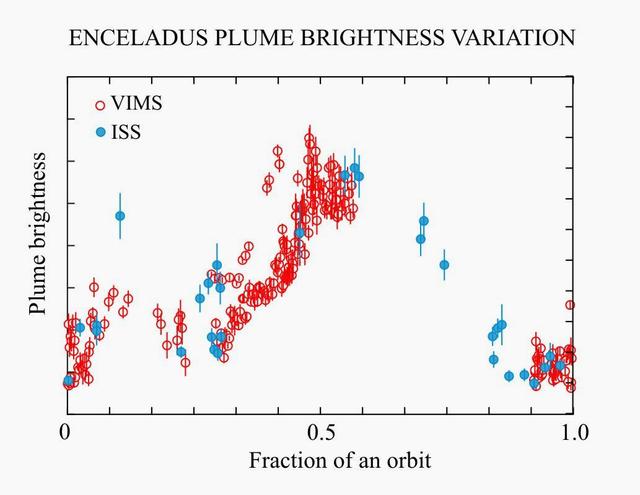
This plot shows the variation in brightness of the plume of material, composed of all the geysers erupting from the south polar terrain of Saturn moon Enceladus, as a function of the moon orbital position around Saturn.
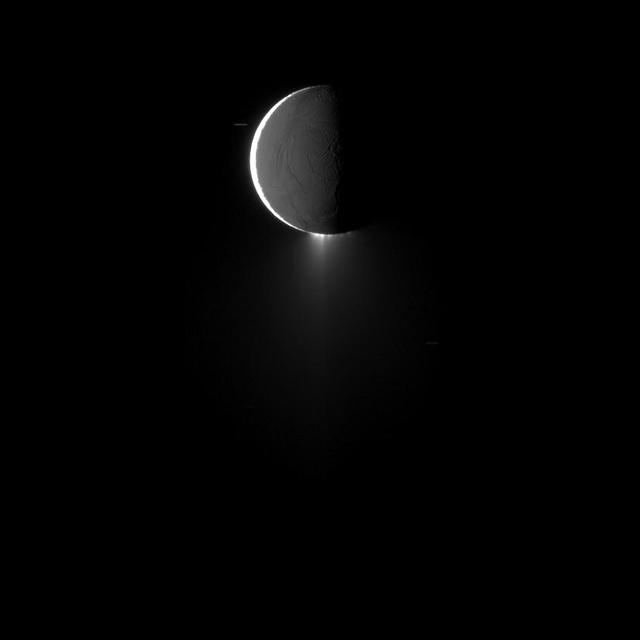
Saturn moon Enceladus, imaged at high phase, shows off its spectacular water ice plumes emanating from its south polar region in this image captured by NASA Cassini spacecraft.
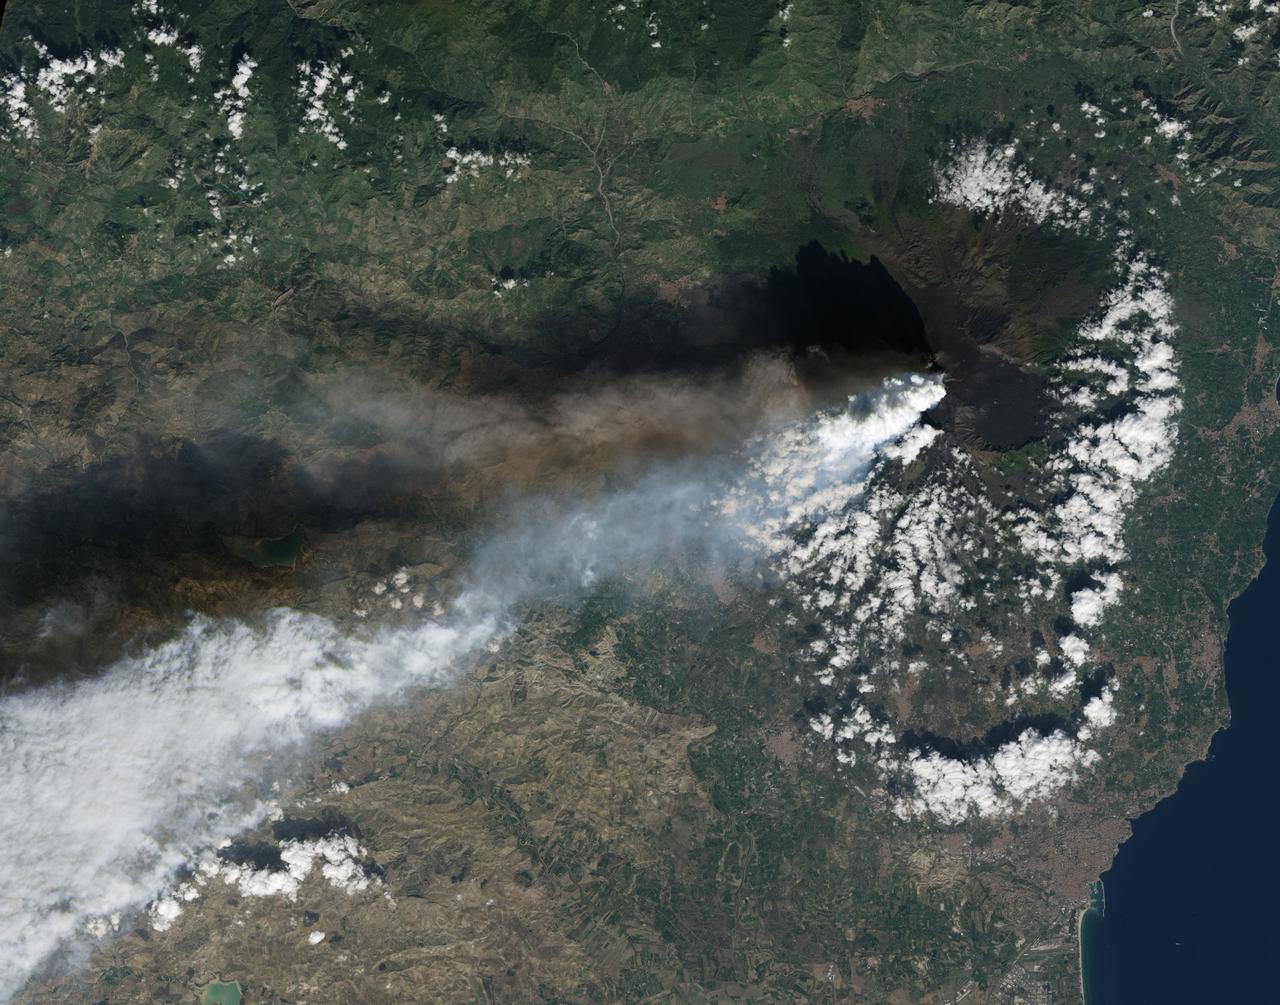
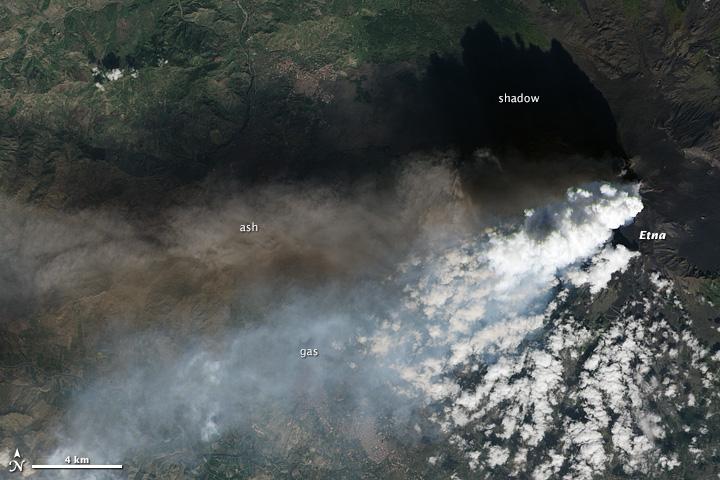
Twin volcanic plumes—one of ash, one of gas—rose from Sicily’ Mount Etna on the morning of October 26, 2013. L’Istituto Nazionale di Geofisica e Vulcanologia (INGV) Osservatorio Etneo (National Institute of Geophysics and Volcanology Etna Observatory) reported that Etna was experiencing its first paroxysm in six months. Multiple eruption columns are common at Etna, a result of complex plumbing within the volcano. The Northeast Crater, one of several on Etna’s summit, was emitting the ash column, while the New Southeast Crater was simultaneously venting mostly gas. This natural-color image collected by Landsat 8 shows the view from space at 11:38 a.m. local time. The towering, gas-rich plume cast a dark shadow over the lower, ash-rich plume and Etna’s northwestern flank. Relatively fresh lava flows (less than a century or so old) are dark gray; vegetation is green; and the tile-roofed buildings of Bronte and Biancavilla lend the towns an ochre hue. NASA Earth Observatory image by Jesse Allen and Robert Simmon, using Landsat data from the USGS Earth Explorer. Photograph ©2013, Boris Behncke. Caption by Robert Simmon with contributions from Boris Behncke. Instrument: Landsat 8 - OLI More info: <a href="http://1.usa.gov/1cEcOFi" rel="nofollow">1.usa.gov/1cEcOFi</a> Credit: <b><a href="http://www.earthobservatory.nasa.gov/" rel="nofollow"> NASA Earth Observatory</a></b> <b><a href="http://www.nasa.gov/audience/formedia/features/MP_Photo_Guidelines.html" rel="nofollow">NASA image use policy.</a></b> <b><a href="http://www.nasa.gov/centers/goddard/home/index.html" rel="nofollow">NASA Goddard Space Flight Center</a></b> enables NASA’s mission through four scientific endeavors: Earth Science, Heliophysics, Solar System Exploration, and Astrophysics. Goddard plays a leading role in NASA’s accomplishments by contributing compelling scientific knowledge to advance the Agency’s mission. <b>Follow us on <a href="http://twitter.com/NASA_GoddardPix" rel="nofollow">Twitter</a></b> <b>Like us on <a href="http://www.facebook.com/pages/Greenbelt-MD/NASA-Goddard/395013845897?ref=tsd" rel="nofollow">Facebook</a></b> <b>Find us on <a href="http://instagram.com/nasagoddard?vm=grid" rel="nofollow">Instagram</a></b>
Twin volcanic plumes—one of ash, one of gas—rose from Sicily’ Mount Etna on the morning of October 26, 2013. L’Istituto Nazionale di Geofisica e Vulcanologia (INGV) Osservatorio Etneo (National Institute of Geophysics and Volcanology Etna Observatory) reported that Etna was experiencing its first paroxysm in six months. Multiple eruption columns are common at Etna, a result of complex plumbing within the volcano. The Northeast Crater, one of several on Etna’s summit, was emitting the ash column, while the New Southeast Crater was simultaneously venting mostly gas. This natural-color image collected by Landsat 8 shows the view from space at 11:38 a.m. local time. The towering, gas-rich plume cast a dark shadow over the lower, ash-rich plume and Etna’s northwestern flank. Relatively fresh lava flows (less than a century or so old) are dark gray; vegetation is green; and the tile-roofed buildings of Bronte and Biancavilla lend the towns an ochre hue. NASA Earth Observatory image by Jesse Allen and Robert Simmon, using Landsat data from the USGS Earth Explorer. Photograph ©2013, Boris Behncke. Caption by Robert Simmon with contributions from Boris Behncke. Instrument: Landsat 8 - OLI More info: <a href="http://1.usa.gov/1cEcOFi" rel="nofollow">1.usa.gov/1cEcOFi</a> Credit: <b><a href="http://www.earthobservatory.nasa.gov/" rel="nofollow"> NASA Earth Observatory</a></b> <b><a href="http://www.nasa.gov/audience/formedia/features/MP_Photo_Guidelines.html" rel="nofollow">NASA image use policy.</a></b> <b><a href="http://www.nasa.gov/centers/goddard/home/index.html" rel="nofollow">NASA Goddard Space Flight Center</a></b> enables NASA’s mission through four scientific endeavors: Earth Science, Heliophysics, Solar System Exploration, and Astrophysics. Goddard plays a leading role in NASA’s accomplishments by contributing compelling scientific knowledge to advance the Agency’s mission. <b>Follow us on <a href="http://twitter.com/NASA_GoddardPix" rel="nofollow">Twitter</a></b> <b>Like us on <a href="http://www.facebook.com/pages/Greenbelt-MD/NASA-Goddard/395013845897?ref=tsd" rel="nofollow">Facebook</a></b> <b>Find us on <a href="http://instagram.com/nasagoddard?vm=grid" rel="nofollow">Instagram</a></b>
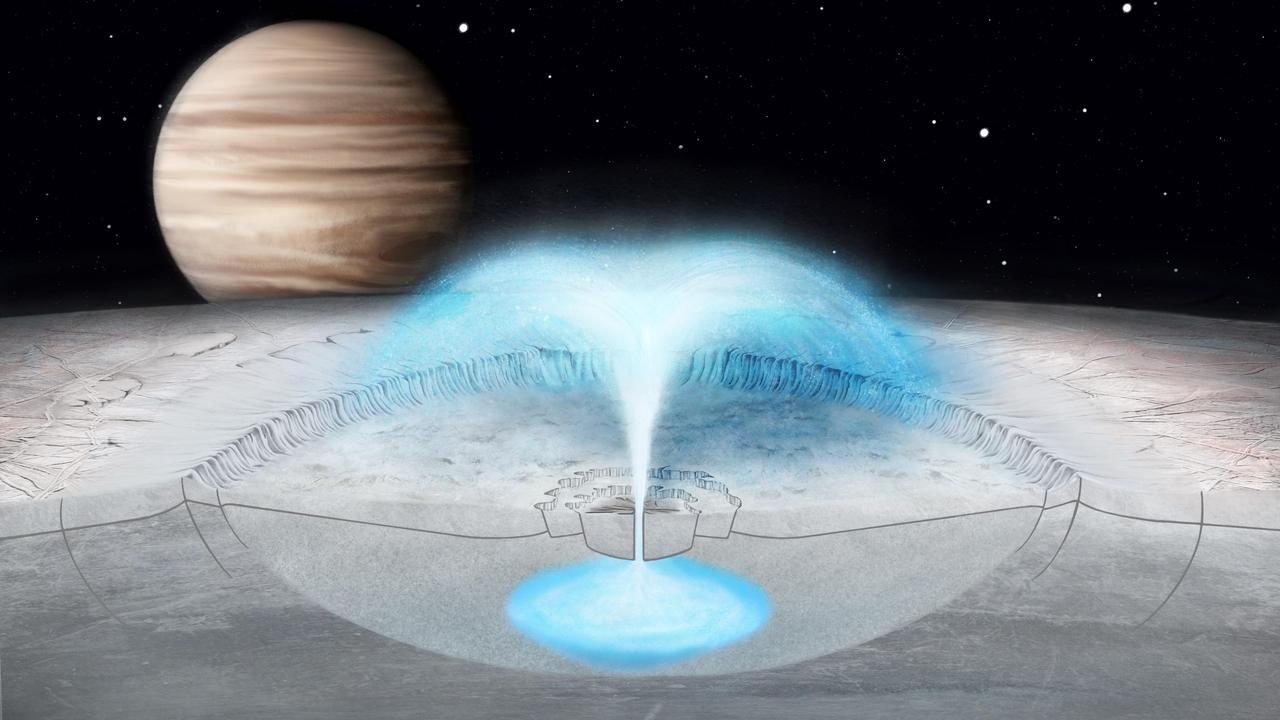
Scientists have theorized on the origin of water plumes that are possibly erupting from Jupiter's moon Europa. This illustration depicts a scenario modeled in new research that proposes some plumes could come from an eruption of brine, or salt-enriched water, from a pocket of water within the moon's crust. If Europa is venting plumes of liquid, they could possibly be observed by NASA's upcoming Europa Clipper mission, set to launch in the mid-2020's. The research on eruptions of briny water from Europa's crust used images collected by NASA's Galileo spacecraft. The model shows how a combination of freezing and pressurization could lead to a cryovolcanic eruption, or a burst of frigid water, like the one illustrated here. The model could also shed light on cryovolcanic eruptions on other icy bodies in the solar system. https://photojournal.jpl.nasa.gov/catalog/PIA24029
NASA image acquired May 8, 2010 at 13 :35 UTC Ash plume from Eyjafjallajokull Volcano, Iceland Satellite: Aqua NASA/GSFC/Jeff Schmaltz/MODIS Land Rapid Response Team <b><a href="http://www.nasa.gov/centers/goddard/home/index.html" rel="nofollow">NASA Goddard Space Flight Center</a></b> is home to the nation's largest organization of combined scientists, engineers and technologists that build spacecraft, instruments and new technology to study the Earth, the sun, our solar system, and the universe.
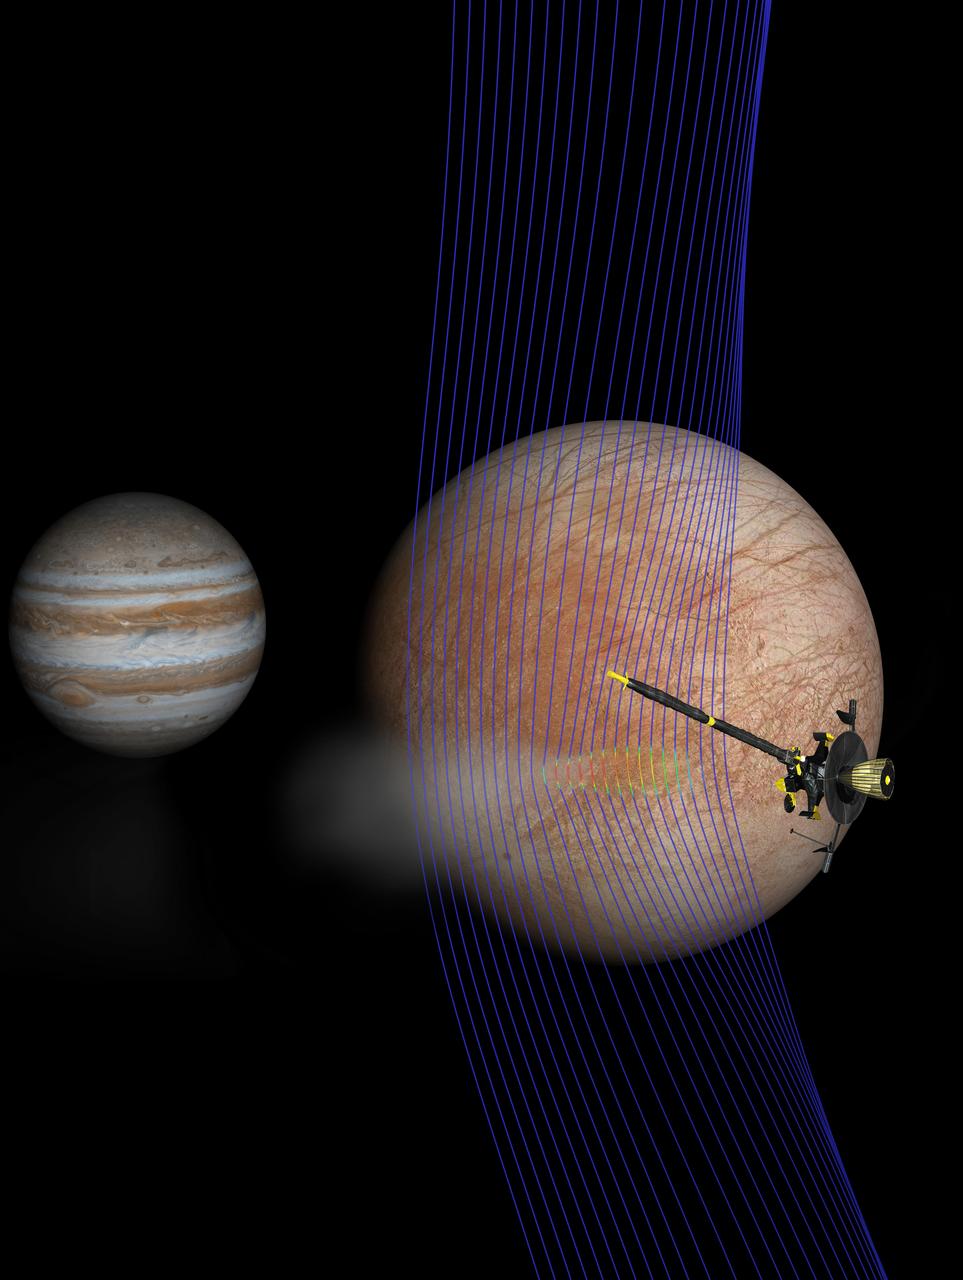
Artist's illustration of Jupiter and Europa (in the foreground) with the Galileo spacecraft after its pass through a plume erupting from Europa's surface. A new computer simulation gives us an idea of how the magnetic field interacted with a plume. The magnetic field lines (depicted in blue) show how the plume interacts with the ambient flow of Jovian plasma. The red colors on the lines show more dense areas of plasma. https://photojournal.jpl.nasa.gov/catalog/PIA21922
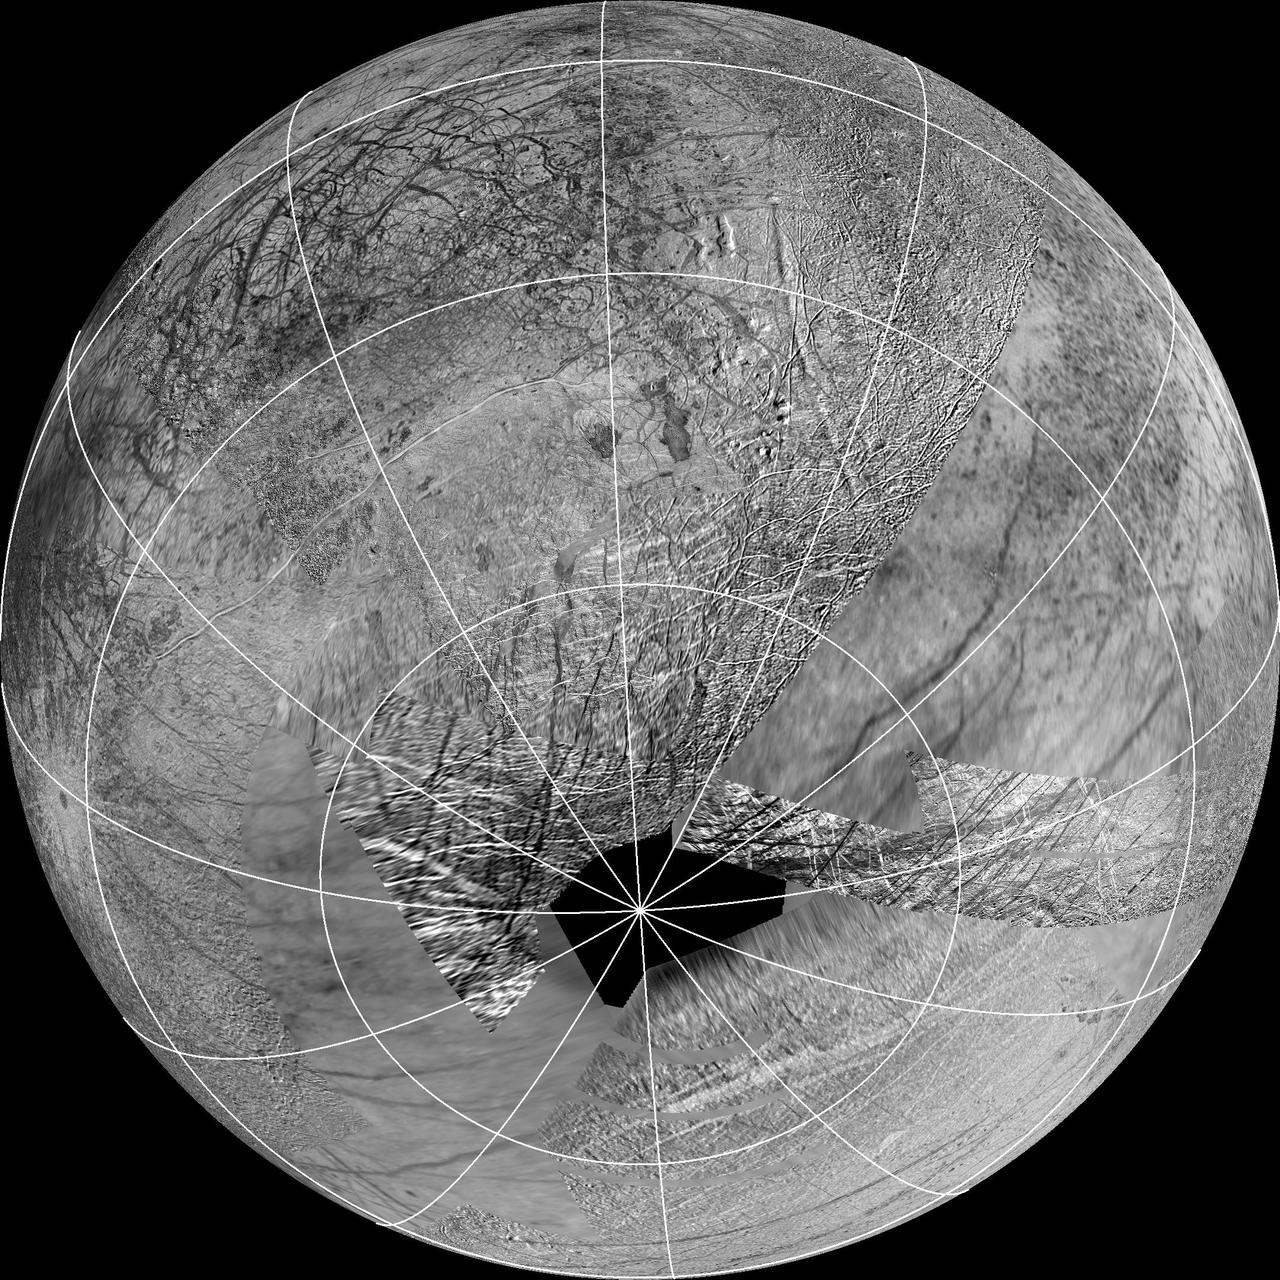
This map composed of images NASA Galileo and Voyager missions shows the hemisphere of Europa that might be affected by plume deposits. The view is centered at -65 degrees latitude, 183 degrees longitude.
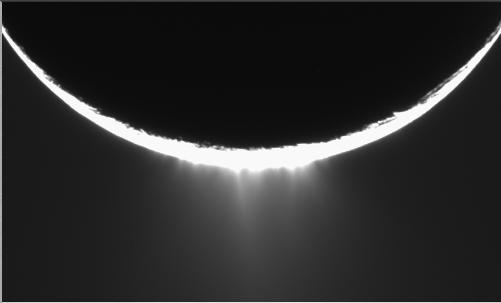
Jets of icy particles burst from Saturn’s moon Enceladus in this brief movie sequence of four images taken on Nov. 27, 2005. The sensational discovery of active eruptions on a third outer solar system body (Io and Triton are the others) is surely one of the great highlights of the Cassini mission. Imaging scientists, as reported in the journal Science on March 10, 2006, believe that the jets are geysers erupting from pressurized subsurface reservoirs of liquid water above 273 degrees Kelvin (0 degrees Celsius). Images taken in January 2005 appeared to show the plume emanating from the fractured south polar region of Enceladus, but the visible plume was only slightly brighter than the background noise in the image, because the lighting geometry was not suitable to reveal the true details of the feature. This potential sighting, in addition to the detection of the icy particles in the plume by other Cassini instruments, prompted imaging scientists to target Enceladus again with exposures designed to confirm the validity of the earlier plume sighting. The new views show individual jets, or plume sources, that contribute to the plume with much greater visibility than the earlier images. The full plume towers over the 505-kilometer-wide (314-mile) moon and is at least as tall as the moon's diameter. The four 10-second exposures were taken over the course of about 36 minutes at approximately 12 minute intervals. Enceladus rotates about 7.5 degrees in longitude over the course of the frames, and most of the observed changes in the appearances of the jets is likely attributable to changes in the viewing geometry. However, some of the changes may be due to actual variation in the flow from the jets on a time scale of tens of minutes. Additionally, the shift of the sources seen here should provide information about their location in front of and behind the visible limb (edge) of Enceladus. These images were obtained using the Cassini spacecraft narrow-angle camera at distances between 144,350 and 149,520 kilometers (89,695 and 92,907 miles) from Enceladus and at a phase angle of about 161 degrees. Image scale is about 900 meters (2,950 feet) per pixel on Enceladus. A movie is available at http://photojournal.jpl.nasa.gov/catalog/PIA07762
NASA image acquired May 8, 2010 at 13 :35 UTC Ash plume from Eyjafjallajokull Volcano, Iceland Satellite: Aqua NASA/GSFC/Jeff Schmaltz/MODIS Land Rapid Response Team <b><a href="http://www.nasa.gov/centers/goddard/home/index.html" rel="nofollow">NASA Goddard Space Flight Center</a></b> is home to the nation's largest organization of combined scientists, engineers and technologists that build spacecraft, instruments and new technology to study the Earth, the sun, our solar system, and the universe.
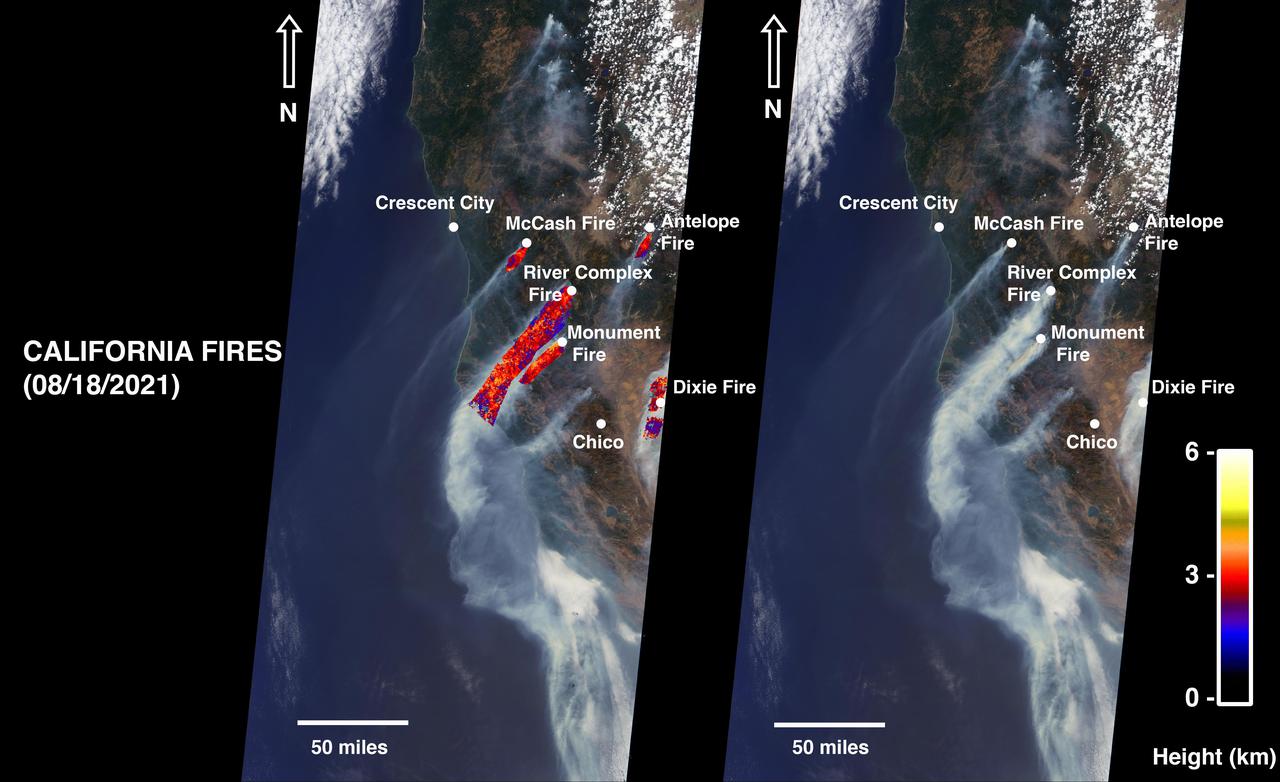
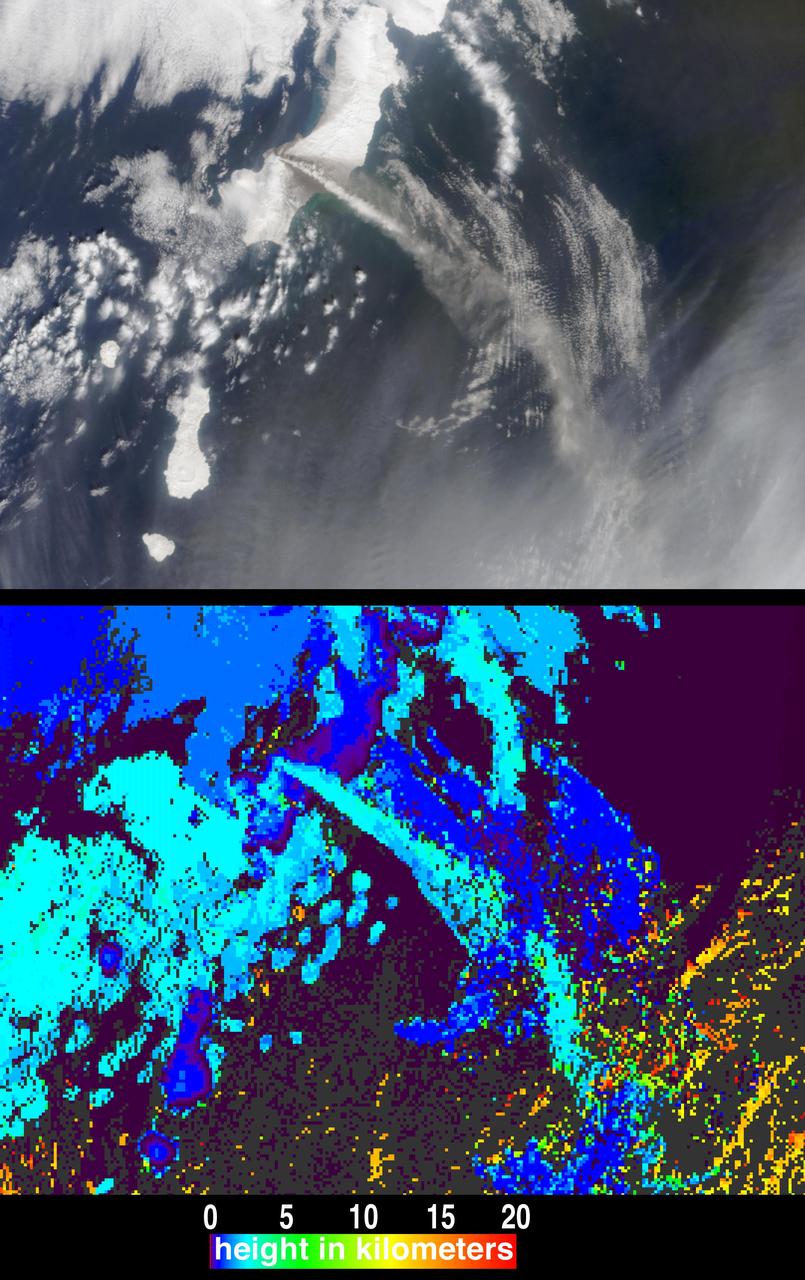
On August 18, 2021, at 12:10 p.m. local time, the Multi-angle Imaging Spectroradiometer (MISR) instrument captured imagery of the McCash, Antelope, River Complex, Monument, and Dixie fires as it passed overhead aboard NASA's Terra satellite. Combined, the fires had burned over 1 million acres as of August 24, 2021. MISR has nine cameras that view Earth at different angles. The right side of the image shows smoke from the five fires as observed by MISR's nadir (downward-pointing) camera. The multi-angular information from MISR's images is used to calculate the height of the smoke plumes. The results of those calculations are shown on the left side of the image. Smoke from areas in red reached an altitude of at least 9,842 feet (3,000 meters). The highest plume top near the active fires reached approximately 19,685 feet (6,000 meters). In general, higher-altitude plumes like this one transport smoke greater distances from the source, impacting communities downwind. In recent weeks, smoke from fires in the Western U.S. and Canada has impacted much of the East Coast. This data was acquired during Terra orbit 115254. The smoke plume height calculation was performed using the publicly available MISR INteractive eXplorer (MINX)software tool. The MISR Plume Height Project maintains a database of global smoke plume heights. https://photojournal.jpl.nasa.gov/catalog/PIA23698
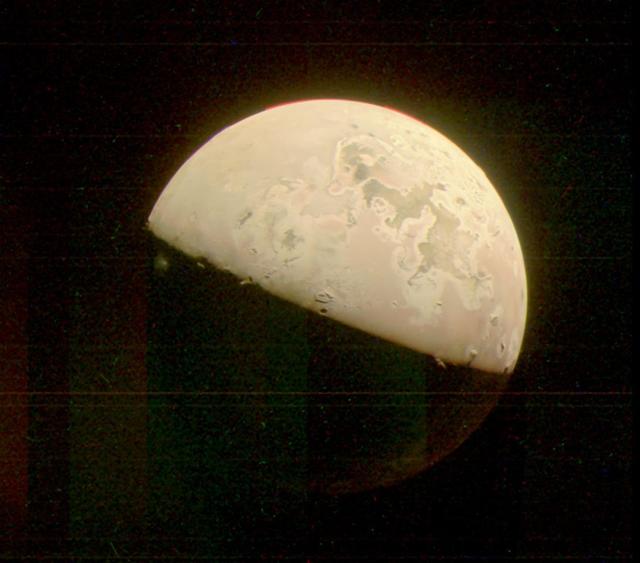
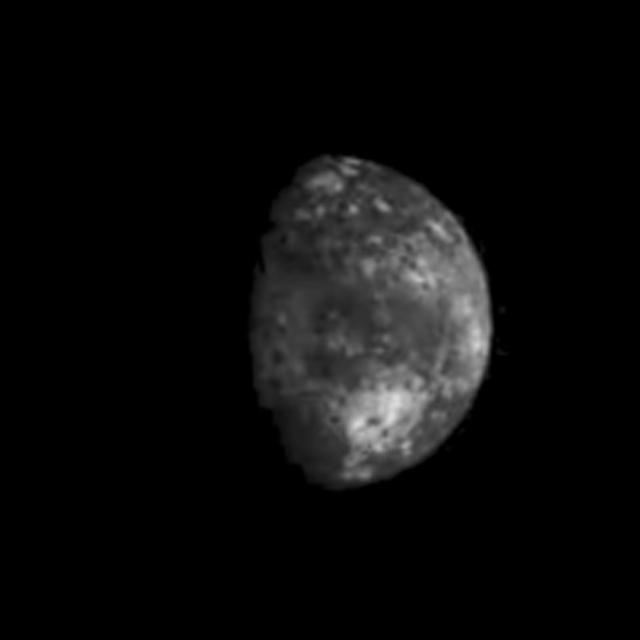
This image of Jupiter's moon Io was taken by the JunoCam visible-light imager as NASA's Juno spacecraft flew past the Jovian moon on October 15, 2023. A plume over the location of the volcano Prometheus can be seen just standing out from the darkness on the left side of the image, just below the terminator (the line dividing day and night). https://photojournal.jpl.nasa.gov/catalog/PIA26235
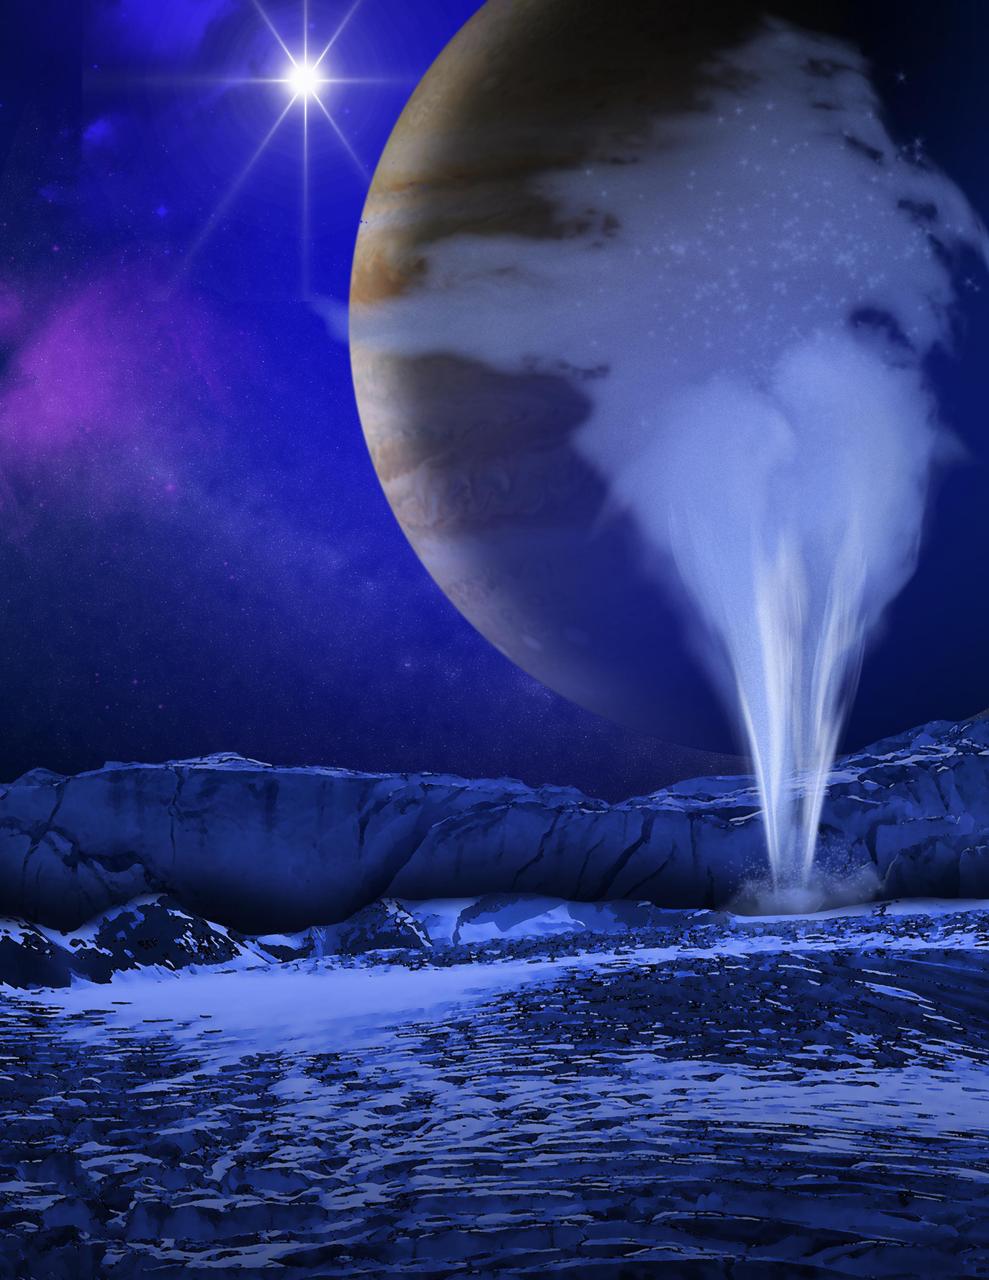
This is an artist concept of a plume of water vapor thought to be ejected off the frigid, icy surface of the Jovian moon Europa, located about 500 million miles 800 million kilometers from the sun.
NASA Terra satellite flew directly over Iceland on April 19, 2010 and captured this image of the Eyjafjallajökull volcano and its erupting ash plume. 3D glasses are necessary to view this image.
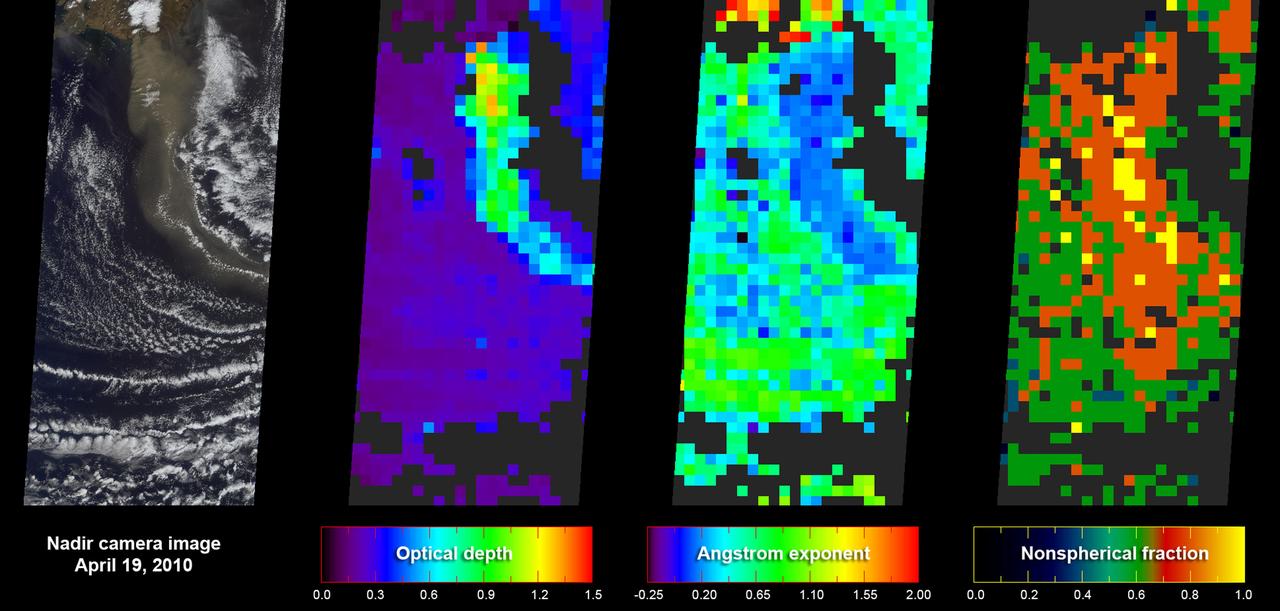
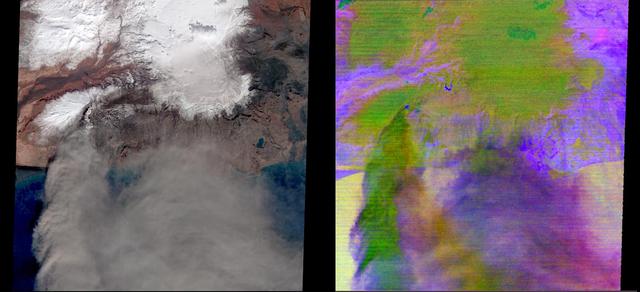
As NASA Terra satellite flew over Iceland erupting Eyjafjallajökull volcano, its Multi-angle Imaging SpectroRadiometer instrument acquired 36 near-simultaneous images of the ash plume, covering nine view angles in each of four wavelengths.
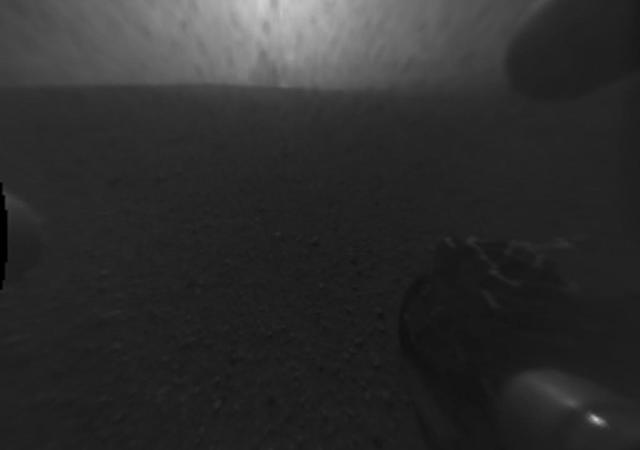
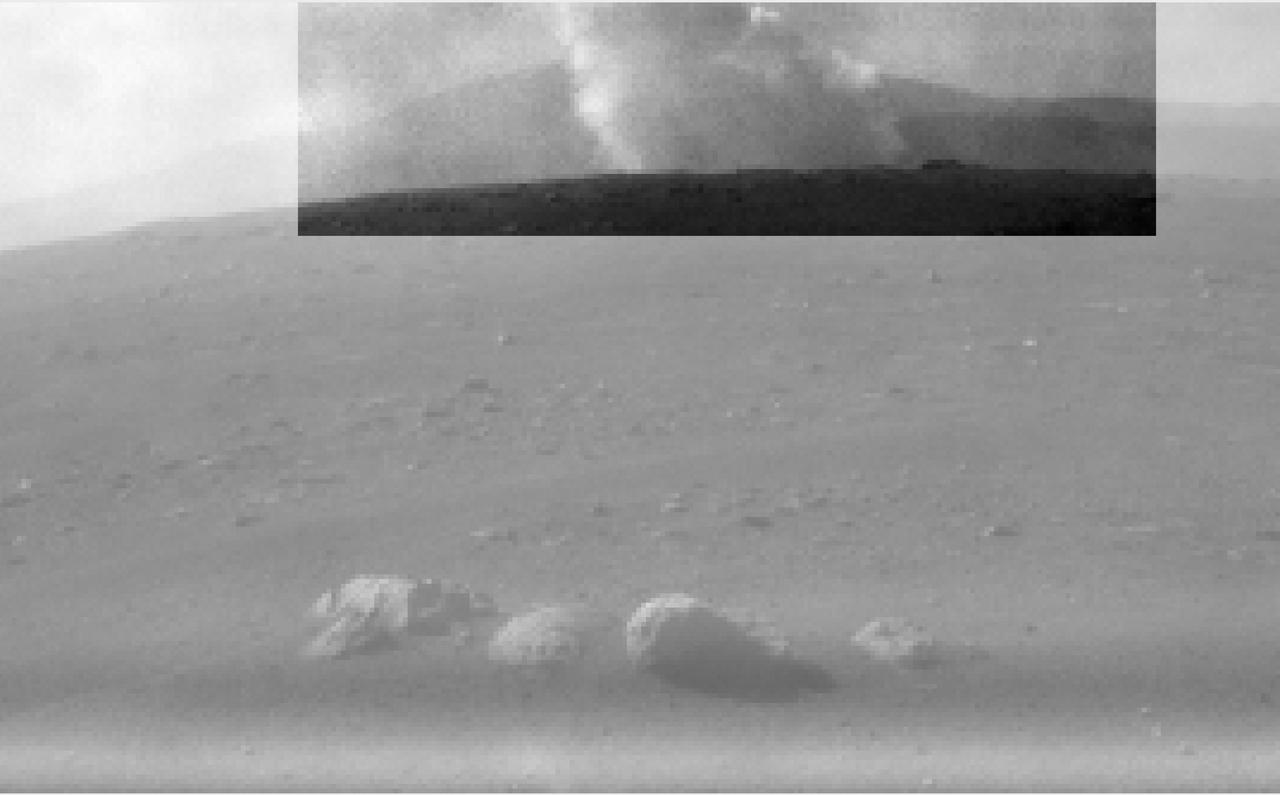
This image was taken by the Hazard-Avoidance cameras on NASA Curiosity rover to show evidence for an impact plume created when the rover sky crane fell to the Martian surface.
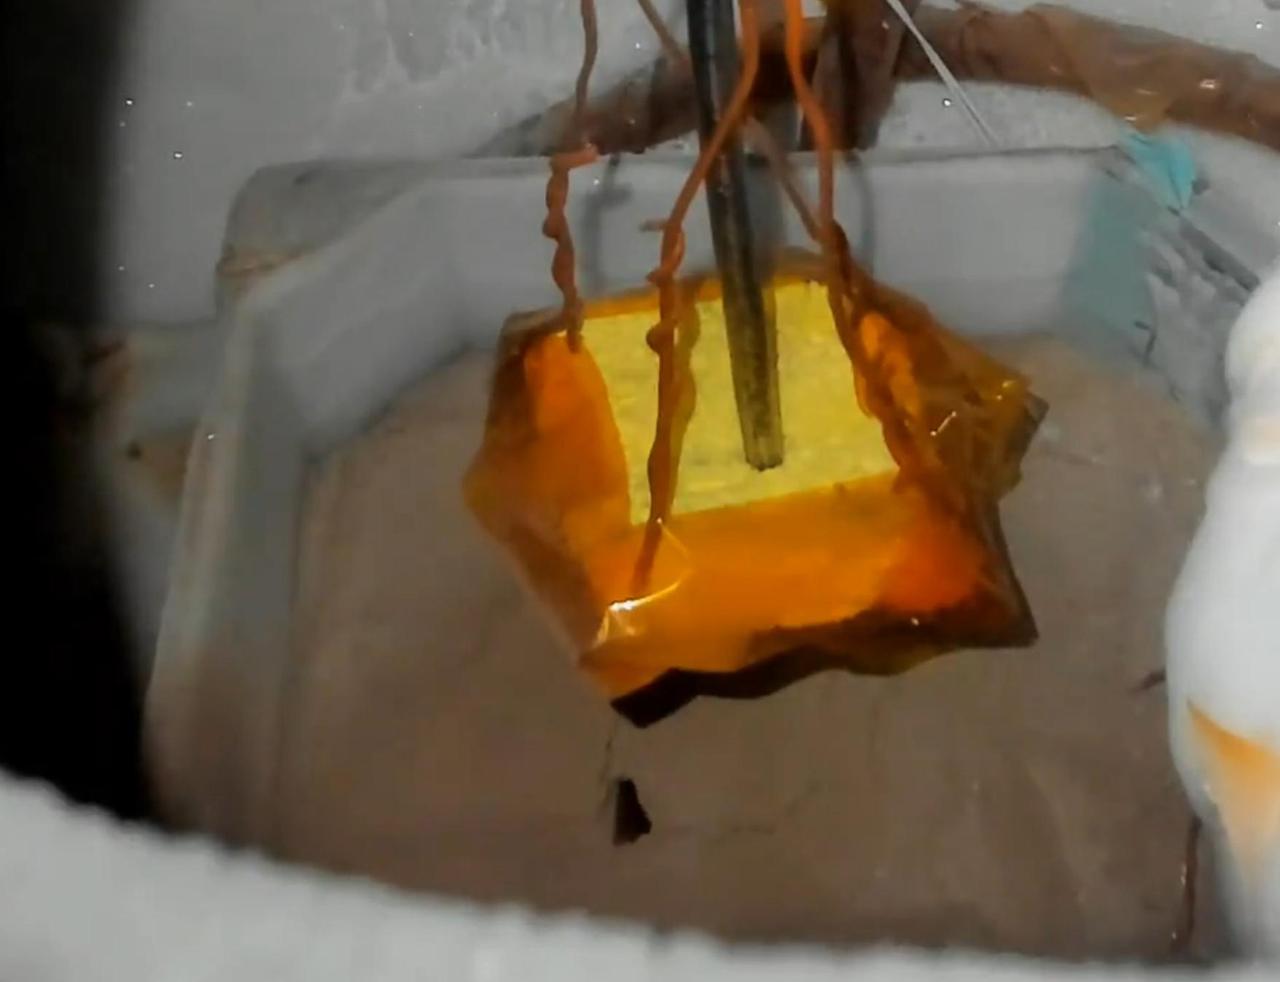
This image shows Martian soil simulant erupting in a plume during a lab experiment at NASA's Jet Propulsion Laboratory in Southern California that was designed to replicate the process believed to form Martian features called "spiders." In the experiment, researchers chilled Martian soil simulant in a container submerged within a liquid nitrogen bath. They placed it in JPL's Dirty Under-vacuum Simulation Testbed for Icy Environments (DUSTIE), where the air pressure was reduced to be similar to that of Mars' southern hemisphere. Carbon dioxide gas flowed into the chamber – diffused through the bright yellow sponge seen suspended over the simulant here – and condensed from gas to ice over the course of three to five hours. A heater inside the chamber then warmed the simulant from below, cracking the ice. After many tries, researchers saw a plume of carbon dioxide gas erupting from within the powdery simulant, as seen here. Video available at https://photojournal.jpl.nasa.gov/catalog/PIA26404
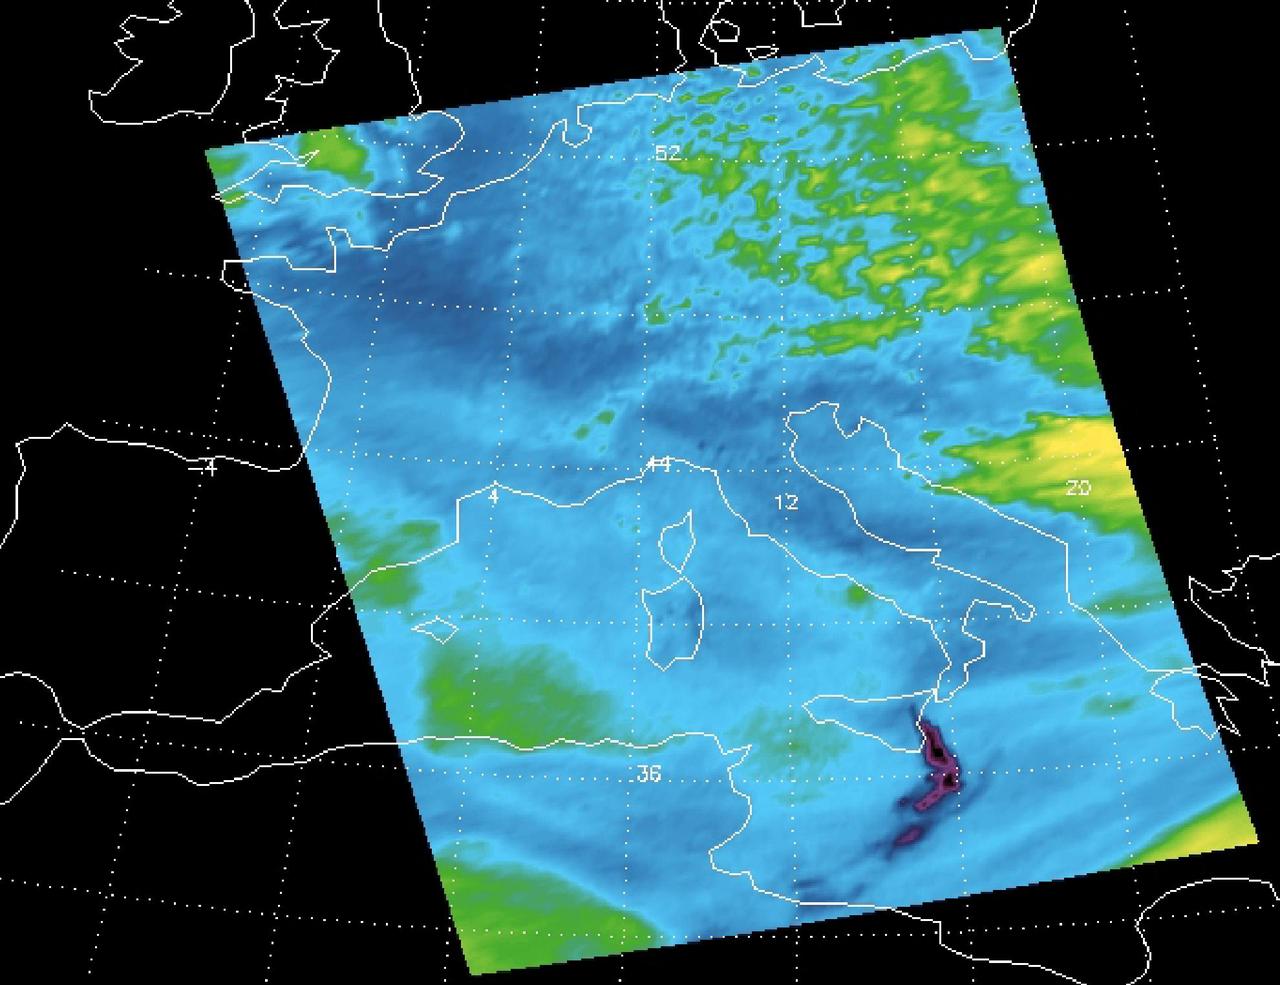
Sulfur dioxide plume from the Mt. Etna Eruption 2002 as seen by the Atmospheric Infrared Sounder AIRS on NASA Aqua satellite.
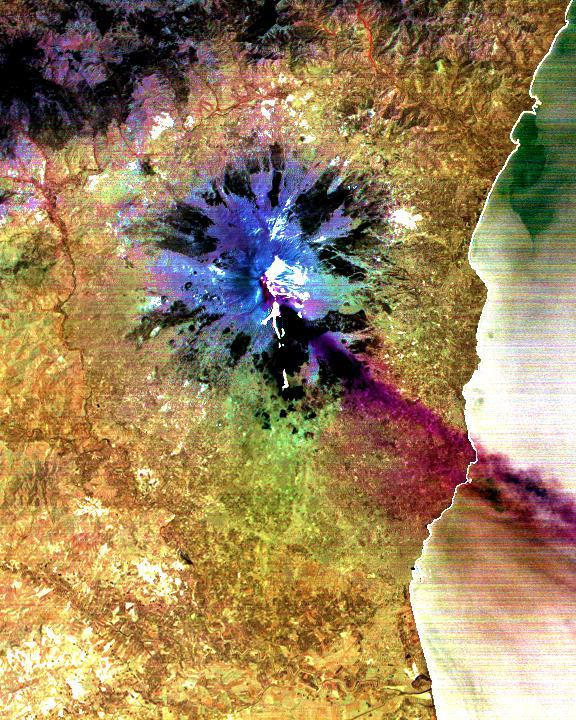
The current eruption of Mt. Etna started on July 17, and has continued to the present. This ASTER image was acquired on Sunday, July 29 and shows the sulfur dioxide plume (in purple) originating form the summit, drifting over the city of Catania, and continuing over the Ionian Sea. ASTER's unique combination of multiple thermal infrared channels and high spatial resolution allows the determination of the thickness and position of the SO2 plume. The image covers an area of 24 x 30 km. The image is centered at 37.7 degrees north latitude, 15 degrees east longitude. http://photojournal.jpl.nasa.gov/catalog/PIA02678
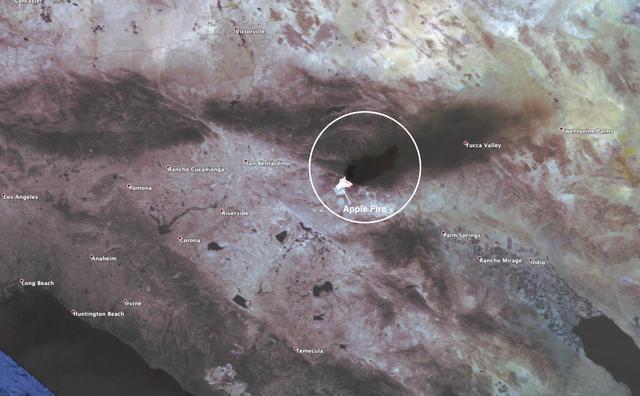
This observation shows the burn area and smoke plume created by the Apple fire in Southern California on Aug. 1, 2020. The observation was made possible by NASA's Ecosystem Spaceborne Thermal Radiometer Experiment on Space Station (ECOSTRESS). Data gathered by the mission can be further refined to measure the temperature of the wildfire, smoke plume and surrounding landscape. ECOSTRESS collected this data when the space station passed over the region at about 1:15 p.m. PST on Saturday, Aug. 1, 2020, when the burn area was approximately 4,000 acres in size. As of Aug. 3, it was more than 26,000 acres. Black smoke can be seen drifting east and over Joshua Tree National Park in the Mojave Desert. With a resolution of about 77 by 77 yards (70 by 70 meters), the image enables surface-temperature conditions down to the size of a football field to be studied. Tasked with detecting plant water use and stress, ECOSTRESS measures the temperature of plants as they heat up when they run out of water. But it can also measure and track heat-related phenomena like fires, heat waves, and volcanoes. https://photojournal.jpl.nasa.gov/catalog/PIA23799

Two tall volcanic plumes and the rings of red material they have deposited onto surrounding surface areas appear in images taken of Jupiter moon Io by NASA Galileo and Cassini spacecraft in late December 2000 and early January 2001.
Iceland Eyjafjallajökull volcano produced its second major ash plume beginning on May 7, 2010. NASA Terra satellite passed just east of the volcano mid-morning and captured this image the same day.
This images, acquired on March 12, 2011 by NASA Terra spacecraft, shows a large smoke plume that appears to be associated either with the Shiogama incident or Sendai port fires. 3D glasses are necessary to view this image.
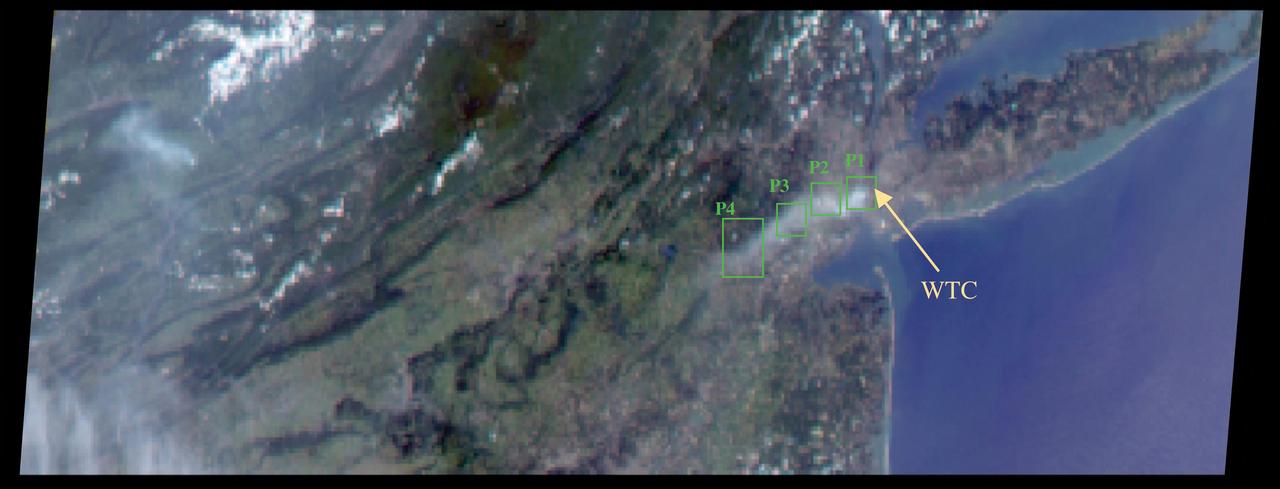
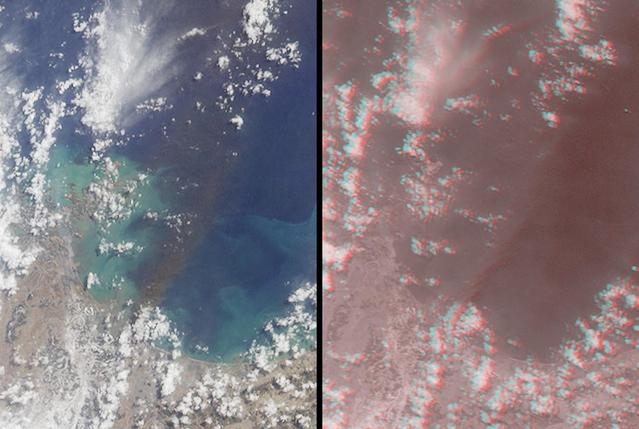
The collapse of the World Trade Center on September 11, 2001, and the fires that followed produced a noxious smoke plume, a complex mixture of tiny airborne particles and gases as seen by NASA Terra spacecraft.
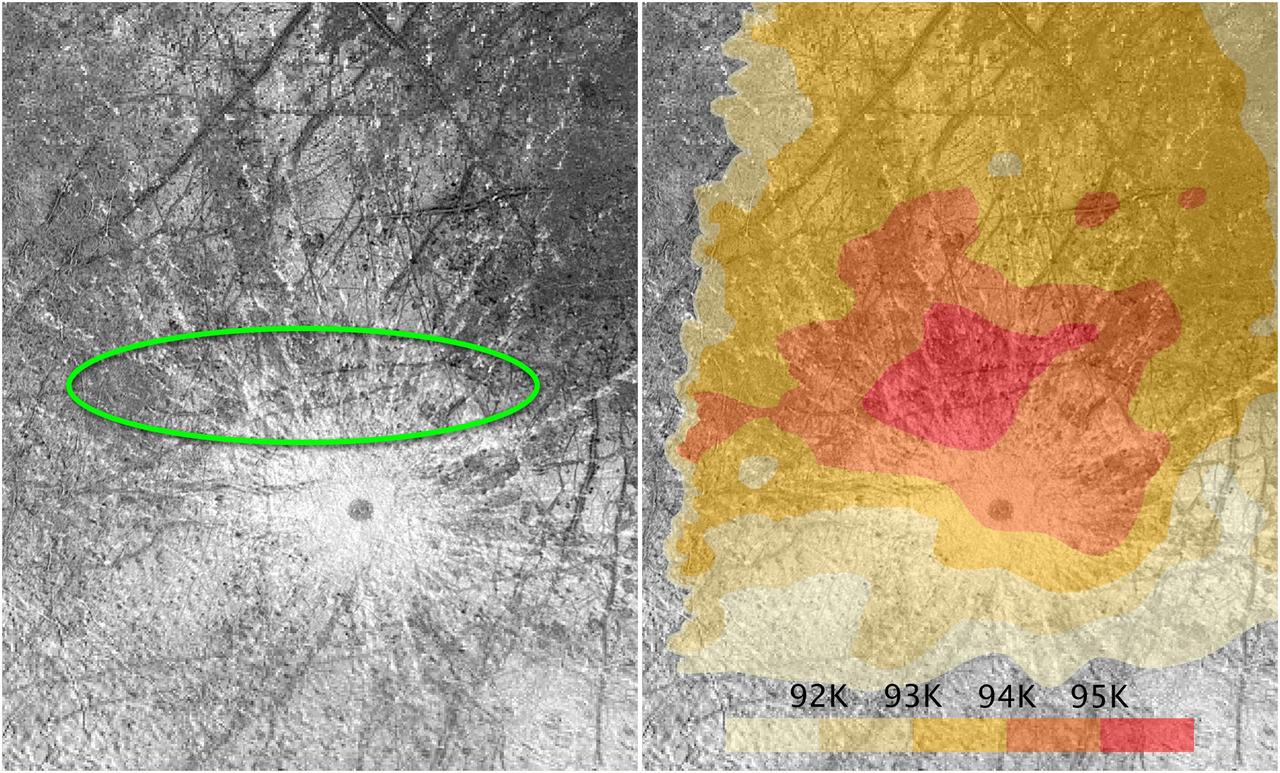
These images of the surface of the Jovian moon Europa, taken by NASA's Galileo spacecraft, focus on a "region of interest" on the icy moon. The image at left traces the location of the erupting plumes of material, observed by NASA's Hubble Space Telescope in 2014 and again in 2016. The plumes are located inside the area surrounded by the green oval. The green oval also corresponds to a warm region on Europa's surface, as identified by the temperature map at right. The map is based on observations by the Galileo spacecraft. The warmest area is colored bright red. Researchers speculate these data offer circumstantial evidence for unusual activity that may be related to a subsurface ocean on Europa. The dark circle just below center in both images is a crater and is not thought to be related to the warm spot or the plume activity. https://photojournal.jpl.nasa.gov/catalog/PIA21444
A sequence of full disk Io images was taken prior to Galileo's second encounter with Ganymede. The purpose of these observations was to view all longitudes of Io and search for active volcanic plumes. The images were taken at intervals of approximately one hour corresponding to Io longitude increments of about ten degrees. Because both the spacecraft and Io were traveling around Jupiter the lighting conditions on Io (e.g. the phase of Io) changed dramatically during the sequence. These images were registered at a common scale and processed to produce a time-lapse "movie" of Io. This movie combines all of the plume monitoring frames obtained by the Solid State Imaging system aboard NASA's Galileo spacecraft. The most prominent volcanic plume seen in this movie is Prometheus (latitude 1.6 south, longitude 153 west). The plume becomes visible as it moves into daylight, crosses the center of the disk, and is seen in profile against the dark of space at the edge of Io. This plume was first seen by the Voyager 1 spacecraft in 1979 and is believed to be a geyser-like eruption of sulfur dioxide snow and gas. Although details of the region around Prometheus have changed in the seventeen years since Voyager's visit, the shape and height of the plume have not changed significantly. It is possible that this geyser has been erupting nearly continuously over this time. Galileo's primary 24 month mission includes eleven orbits around Jupiter and will provide observations of Jupiter, its moons and its magnetosphere. North is to the top of all frames. The smallest features which can be discerned range from 13 to 31 kilometers across. The images were obtained between the 2nd and the 6th of September, 1996. The animation can be viewed at http://photojournal.jpl.nasa.gov/catalog/PIA01073
This illustration shows Saturn's icy moon Enceladus with the plume of ice particles, water vapor and organic molecules that sprays from fractures in the moon's south polar region. A cutaway version of this graphic is also available, showing the moon's interior ocean and hydrothermal activity — both of which were discovered by NASA's Cassini mission (see PIA20013). This global view was created using a Cassini-derived map of Enceladus (see PIA18435). More information about Enceladus is available at https://solarsystem.nasa.gov/moons/saturn-moons/enceladus/in-depth/. For more information about the Cassini-Huygens mission visit https://solarsystem.nasa.gov/missions/cassini/overview/. https://photojournal.jpl.nasa.gov/catalog/PIA23175
This image from one of the rear Hazard Cameras, or Hazcams, aboard NASA's Perseverance Mars rover, shows a smoke plume from the crashed descent stage that lowered the rover to the Martian surface. This image was taken within a minute or two after the rover landed on February 18, 2021. https://photojournal.jpl.nasa.gov/catalog/PIA24425
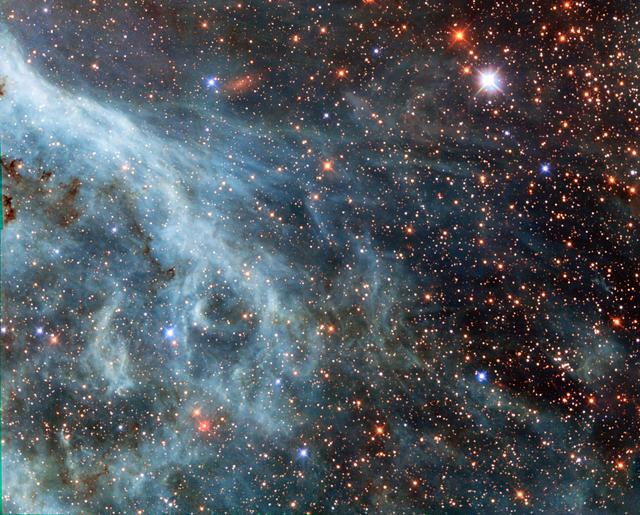
The brightly glowing plumes seen in this image are reminiscent of an underwater scene, with turquoise-tinted currents and nebulous strands reaching out into the surroundings. However, this is no ocean. This image actually shows part of the Large Magellanic Cloud (LMC), a small nearby galaxy that orbits our galaxy, the Milky Way, and appears as a blurred blob in our skies. The NASA/European Space Agency (ESA) Hubble Space Telescope has peeked many times into this galaxy, releasing stunning images of the whirling clouds of gas and sparkling stars (opo9944a, heic1301, potw1408a). This image shows part of the Tarantula Nebula's outskirts. This famously beautiful nebula, located within the LMC, is a frequent target for Hubble (heic1206, heic1402). In most images of the LMC the color is completely different to that seen here. This is because, in this new image, a different set of filters was used. The customary R filter, which selects the red light, was replaced by a filter letting through the near-infrared light. In traditional images, the hydrogen gas appears pink because it shines most brightly in the red. Here however, other less prominent emission lines dominate in the blue and green filters. This data is part of the Archival Pure Parallel Project (APPP), a project that gathered together and processed over 1,000 images taken using Hubble’s Wide Field Planetary Camera 2, obtained in parallel with other Hubble instruments. Much of the data in the project could be used to study a wide range of astronomical topics, including gravitational lensing and cosmic shear, exploring distant star-forming galaxies, supplementing observations in other wavelength ranges with optical data, and examining star populations from stellar heavyweights all the way down to solar-mass stars. Image Credit: ESA/Hubble & NASA: acknowledgement: Josh Barrington <b><a href="http://www.nasa.gov/audience/formedia/features/MP_Photo_Guidelines.html" rel="nofollow">NASA image use policy.</a></b> <b><a href="http://www.nasa.gov/centers/goddard/home/index.html" rel="nofollow">NASA Goddard Space Flight Center</a></b> enables NASA’s mission through four scientific endeavors: Earth Science, Heliophysics, Solar System Exploration, and Astrophysics. Goddard plays a leading role in NASA’s accomplishments by contributing compelling scientific knowledge to advance the Agency’s mission. <b>Follow us on <a href="http://twitter.com/NASAGoddardPix" rel="nofollow">Twitter</a></b> <b>Like us on <a href="http://www.facebook.com/pages/Greenbelt-MD/NASA-Goddard/395013845897?ref=tsd" rel="nofollow">Facebook</a></b> <b>Find us on <a href="http://instagram.com/nasagoddard?vm=grid" rel="nofollow">Instagram</a></b>
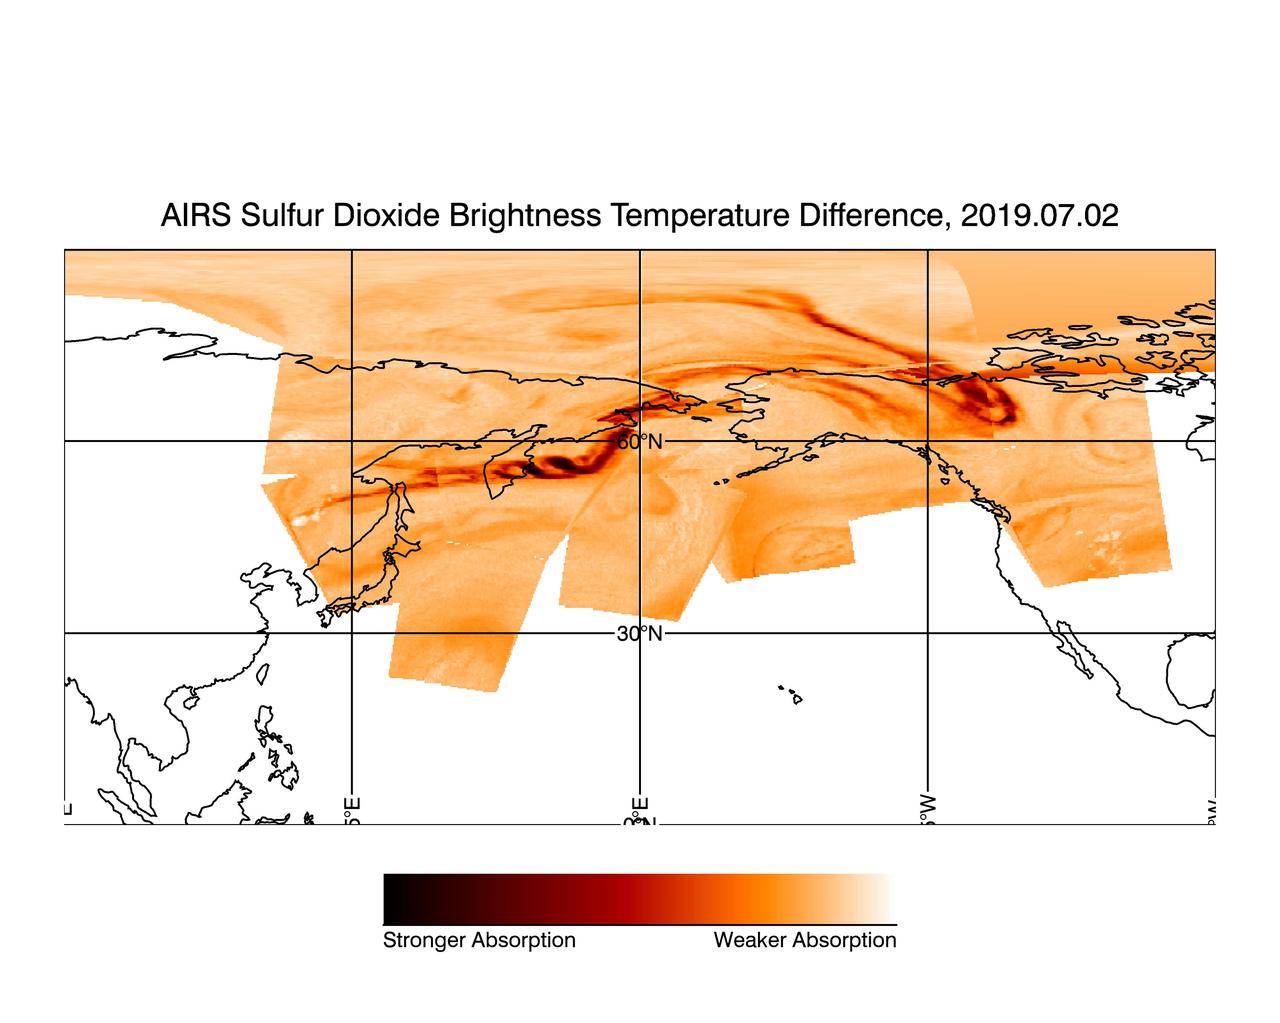
Dormant since 1924, the Raikoke Volcano on Russia's Kuril Islands began erupting on June 22, 2019. In this image made with data from the Atmospheric Infrared Sounder on NASA's Aqua satellite, sulfur dioxide (SO2) in the volcanic plume is observed over several overpasses on July 2, 2019, days after the Raikoke volcanic eruption. SO2 absorbs infrared radiance emitted from Earth's surface and the lower atmosphere in proportion with the quantity of SO2 present in the plume. Areas with higher quantities of sulfur dioxide are shown in dark red while areas with lower quantities of sulfur dioxide are shown in light orange. Areas where data was not included in the image, due to the lack of plume in those regions, are shown in white. The image combines multiple granules of AIRS data taken throughout the day. Each data granule collected by the instrument is outlined in green, with its corresponding time stamp (in UTC) printed in white. https://photojournal.jpl.nasa.gov/catalog/PIA23421
NASA Terra satellite flew directly over Iceland on April 19, 2010, to capture this stereo anaglyph generated from the nadir and 46-degree forward-viewing cameras of the Eyjafjallajökull volcano and its erupting ash plume. 3D glasses are necessary to vie
NASA image acquired December 4, 2010 After a respite of less than a month, Klyuchevskaya Volcano resumed erupting in late November 2010. The Global Volcanism Program reported several ash plumes that rose up to 7.9 kilometers (26,000 feet) above sea level from November 25–29. According to the Kamchatka Volcanic Eruption Response Team (KVERT) seismicity was “slightly above background levels” on November 26th and 27th, and they reported observations of strombolian activity on December 1st and 2nd. A plume of ash, steam, and other volcanic gases streamed from Klyuchevskaya on December 4, 2010, visible in this natural-color image acquired by the Advanced Land Imager (ALI) aboard the Earth Observing-1 (EO-1) satellite. In the large image, a much smaller plume is visible above neighboring Bezymianny Volcano. NASA Earth Observatory image by Jesse Allen & Robert Simmon, using ALI data from the NASA EO-1 team. Caption by Robert Simmon. Instrument: EO-1 - ALI Credit: <b><a href="http://www.earthobservatory.nasa.gov/" rel="nofollow"> NASA Earth Observatory</a></b> <b><a href="http://www.nasa.gov/centers/goddard/home/index.html" rel="nofollow">NASA Goddard Space Flight Center</a></b> enables NASA’s mission through four scientific endeavors: Earth Science, Heliophysics, Solar System Exploration, and Astrophysics. Goddard plays a leading role in NASA’s accomplishments by contributing compelling scientific knowledge to advance the Agency’s mission. <b>Follow us on <a href="http://twitter.com/NASA_GoddardPix" rel="nofollow">Twitter</a></b> <b>Join us on <a href="http://www.facebook.com/pages/Greenbelt-MD/NASA-Goddard/395013845897?ref=tsd" rel="nofollow">Facebook</a></b>
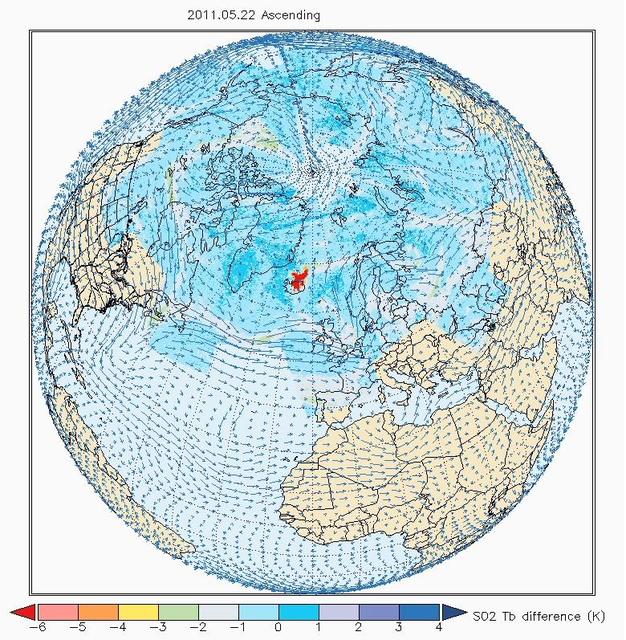
The Atmospheric Infrared Sounder AIRS on NASA Aqua satellite sees sulfur dioxide plume from Iceland Grímsvötn Volcano when it erupted May, 2011.
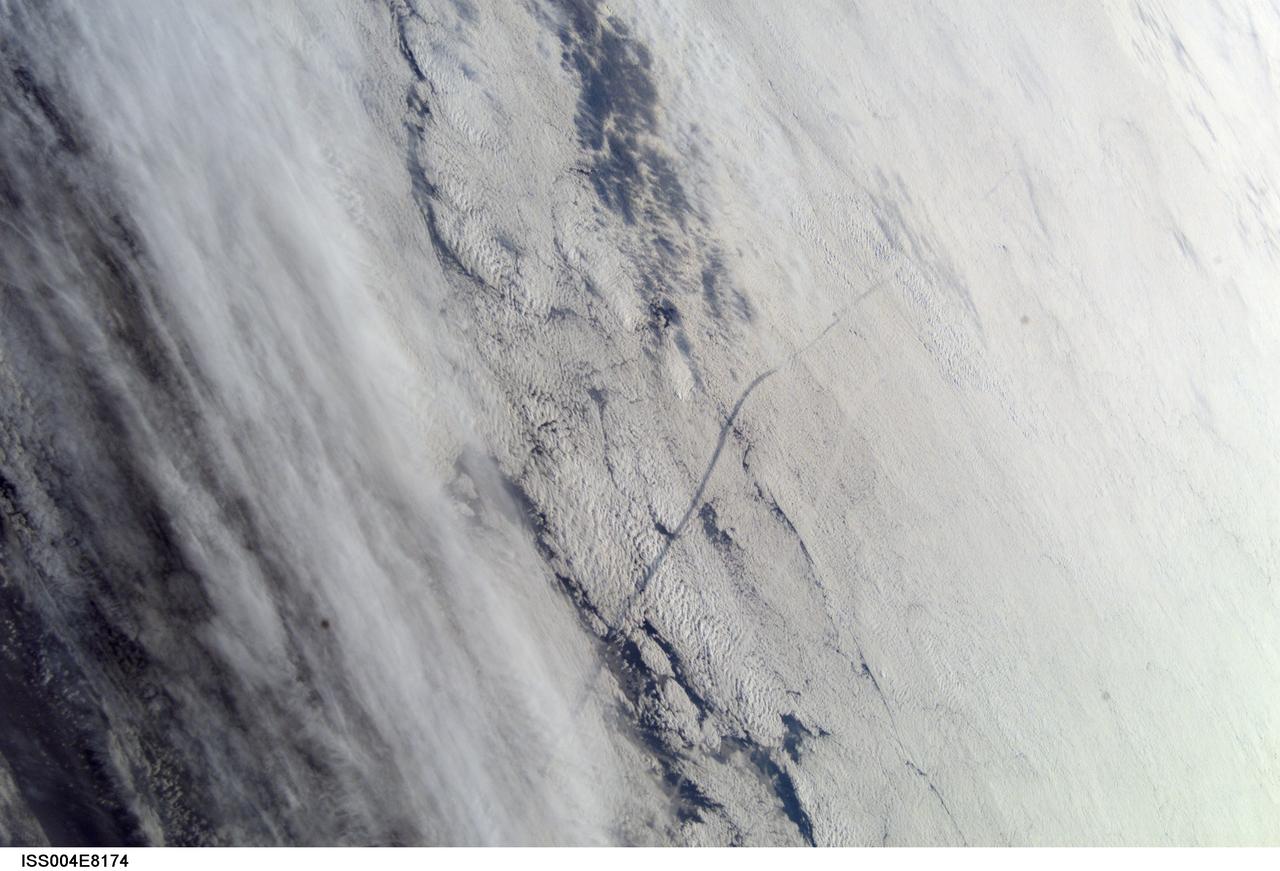
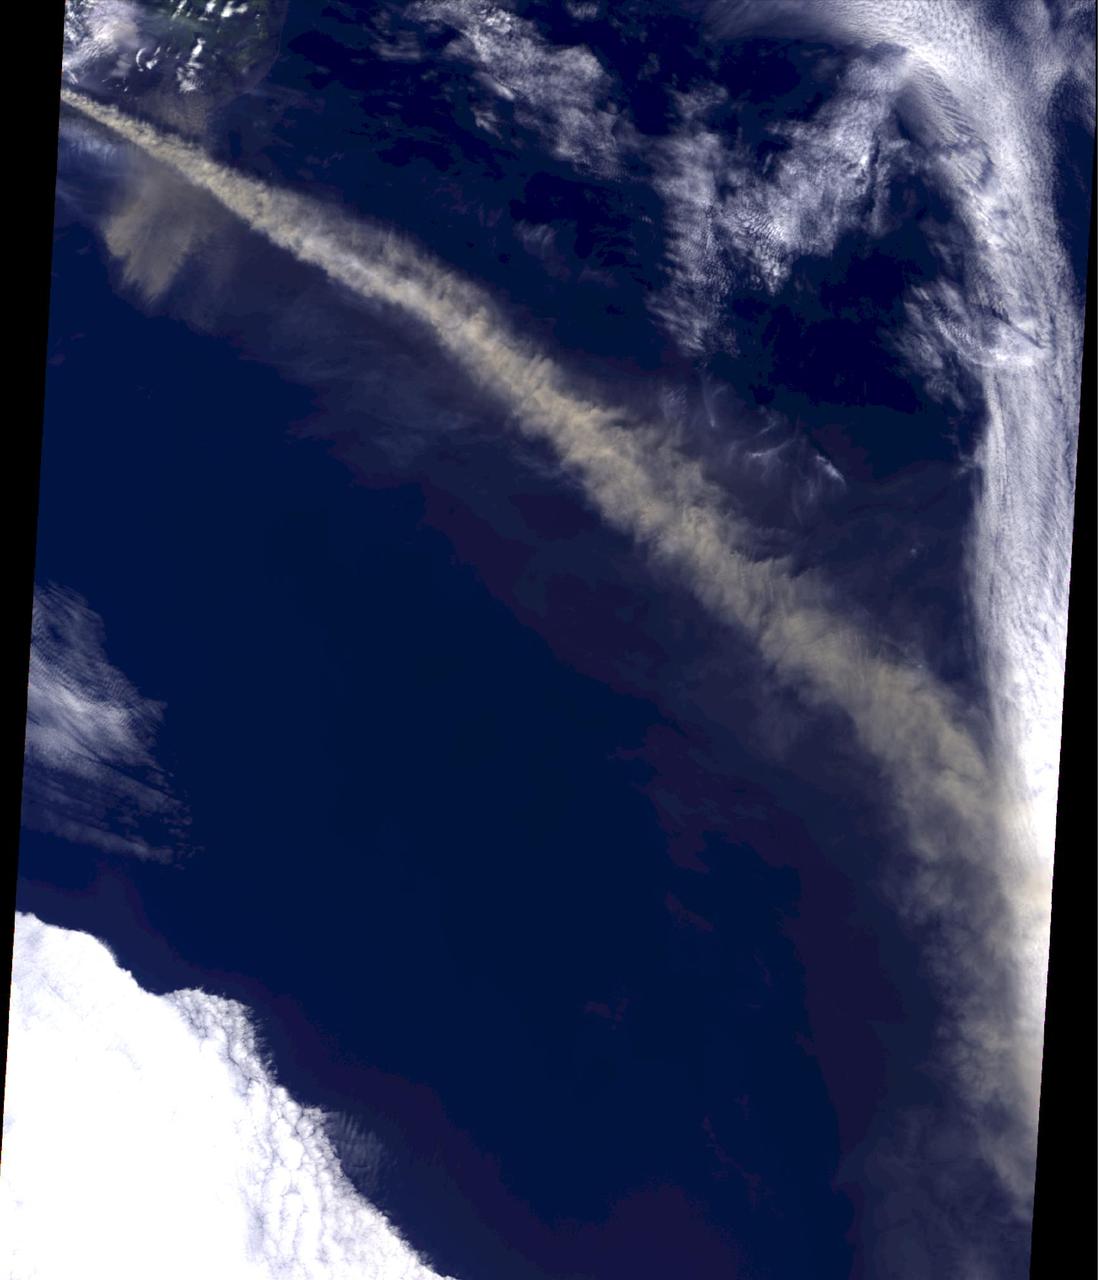
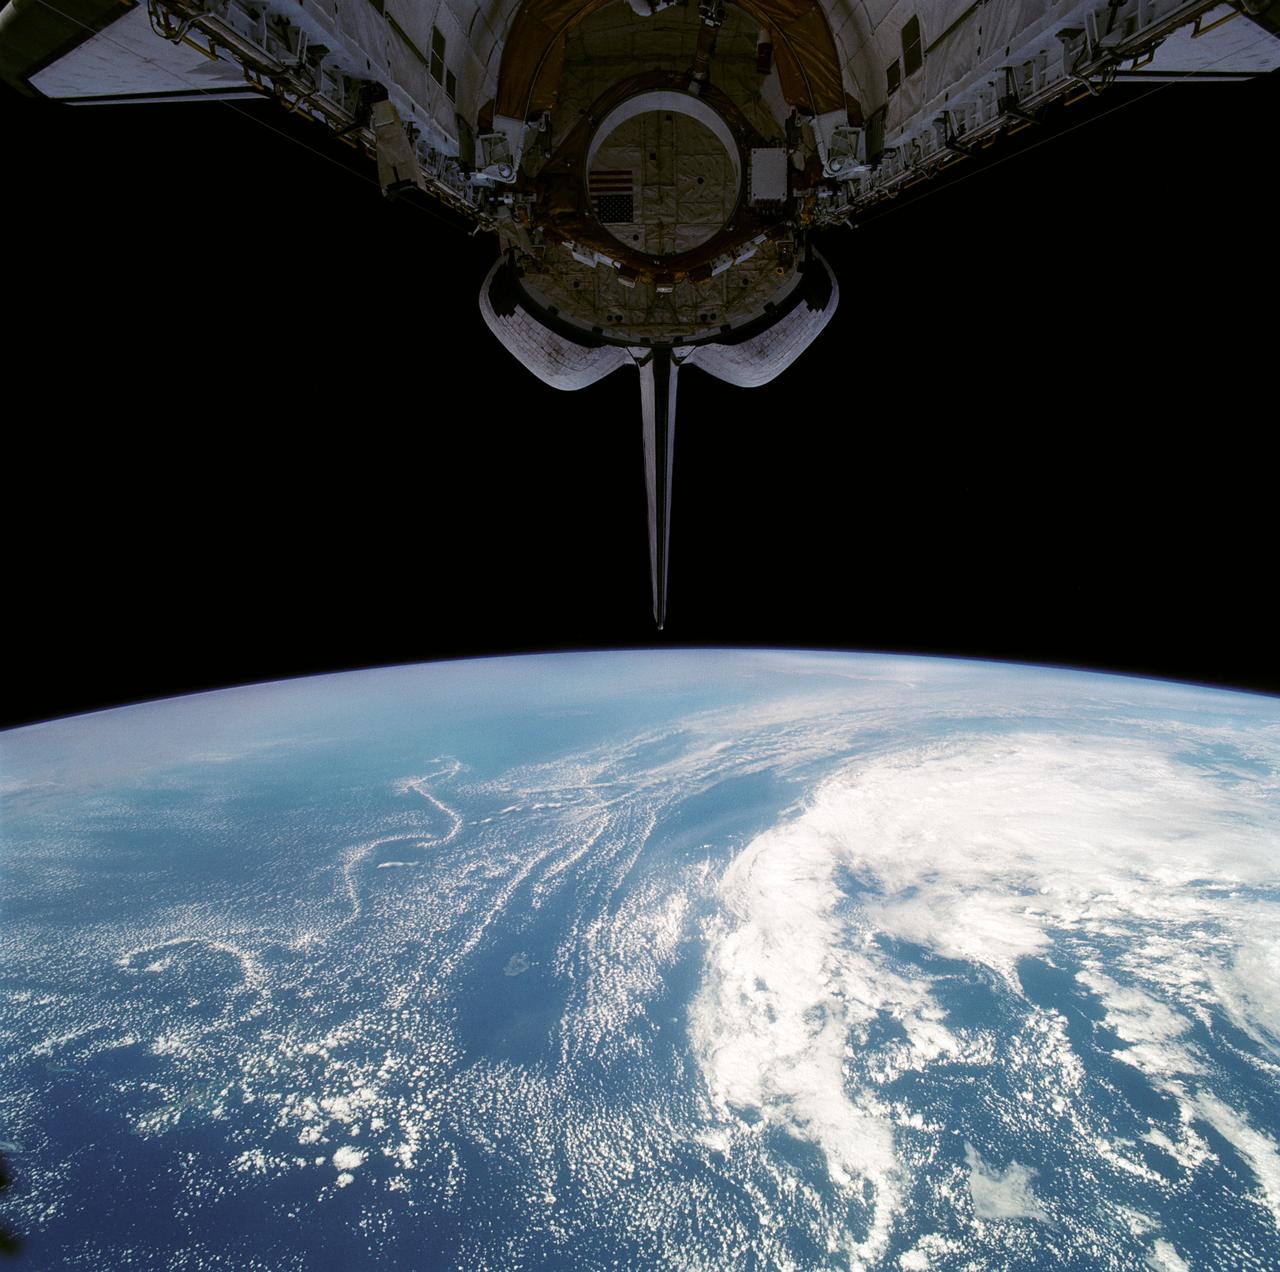
ISS004-E-8174 (1 March 2002) --- This image of Columbia's STS-109 launch plume was taken by the Expedition Four crew using a digital still camera on board the International Space Station. The space station crew shot this photograph as the Station flew high over the Atlantic Ocean moments before Columbia's liftoff. The Shuttle's plume is visible in the right side of this image, the plume's shadow is reflected off the clouds to the left.
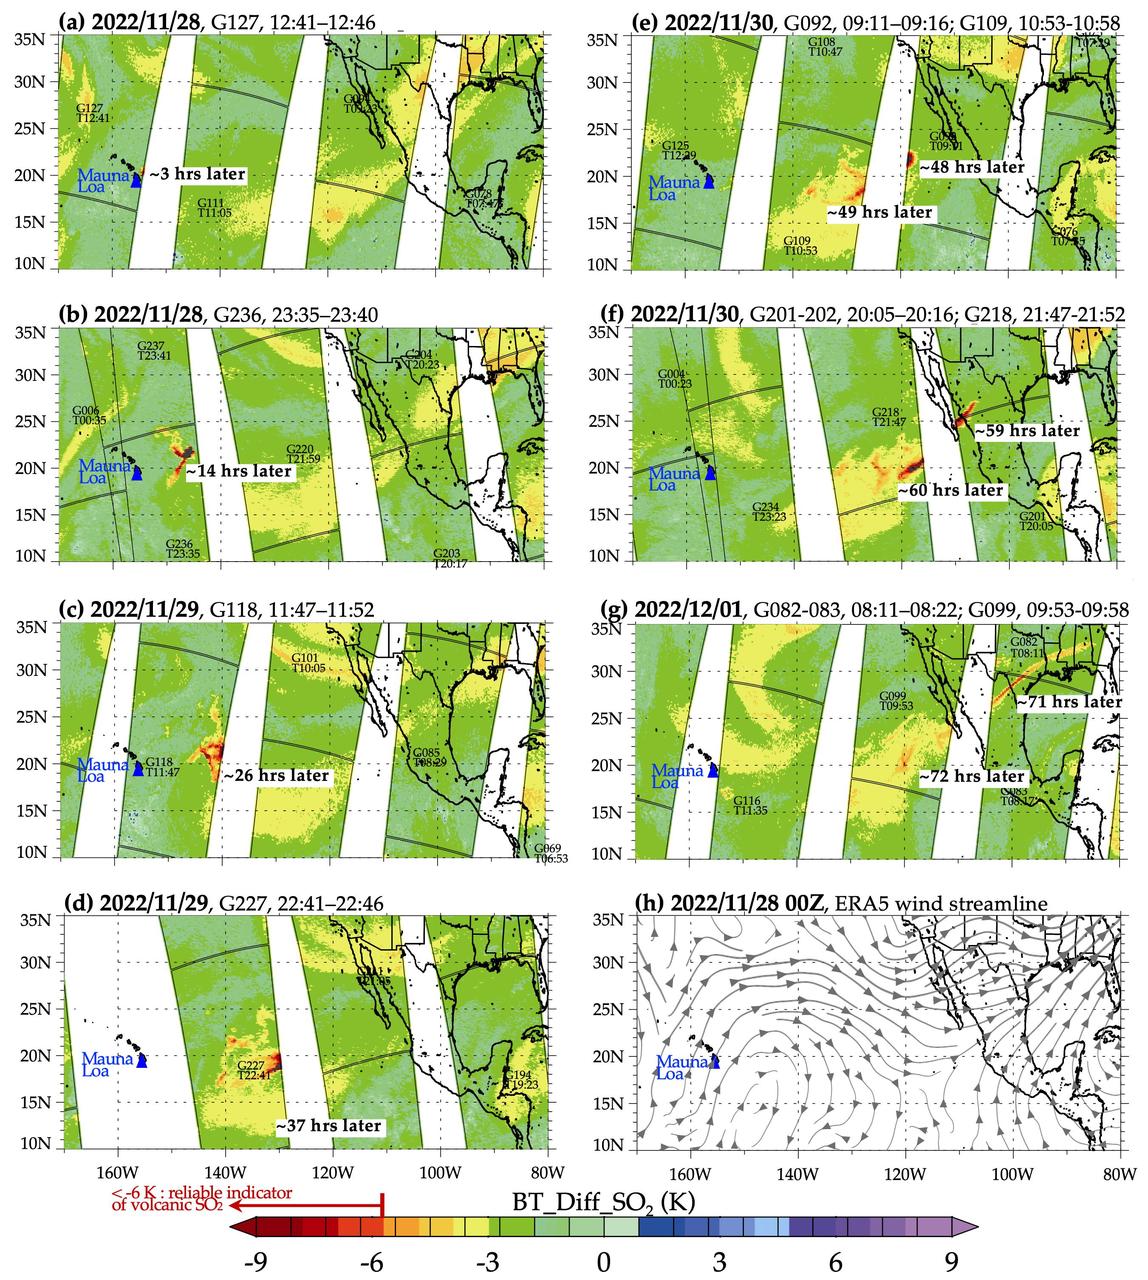
The Atmospheric Infrared Sounder (AIRS) instrument aboard NASA's Aqua satellite detected volcanic sulfur dioxide (SO₂) plumes emanating from Hawaii's Mauna Loa volcano, which started erupting late Sunday, Nov. 27, 2022, at 11:30 p.m. Hawaiian Standard Time (9:30 a.m. UTC, Nov. 28). The AIRS images shown here were taken from seven overpasses, capturing the SO₂ volcanic plumes and its pathways since the eruption. Starting from the upper left frame — captured at 2:41 a.m. HST (12:41 UTC) on Nov. 28, around three hours after the eruption began — a red patch that represents an SO₂ plume can be seen east of the volcano, which is shown as a blue triangle, then moving east and diffusing through subsequent frames. By 71 hours after the eruption, the eastern part of the plume is over the southeastern United States. SO₂ can be harmful to the human respiratory system when inhaled. In the atmosphere, it can also lead to the formation of other gaseous sulfur oxides (SOₓ). These substances can react with other chemicals to form particulate-matter pollution, which can cause breathing problems, contribute to acid rain, and reduce sky visibility. AIRS measures the amount of radiation reaching the instrument from the top of the atmosphere at more than 2,000 different wavelengths. Brightness temperature (BT) is a measure of the amount of radiation, and the images show the difference between BT observed at two different wavelengths. One of the wavelengths is sensitive to atmospheric SO₂, and the other is not, so the difference between the two measurements can give a reliable signal of volcanic SO₂ plumes. A fully automated volcanic plume detection rapid response system that uses AIRS data has been developed at the Jet Propulsion Laboratory in Southern California. This tool is available at the AIRS Rapid Response website, where detections of the most recent volcanic SO₂, dust, and clouds, in visible and infrared images, are updated in near real-time when a volcanic event anywhere on Earth triggers the system. AIRS historical detections of volcanic SO₂ and dust are archived on the site at https://airs.jpl.nasa.gov/volcanic_plumes/. AIRS, in conjunction with the Advanced Microwave Sounding Unit (AMSU), senses emitted infrared and microwave radiation from Earth to provide a three-dimensional look at the planet's weather and climate. Working in tandem, the two instruments make simultaneous observations down to Earth's surface. With more than 2,000 channels sensing different regions of the atmosphere, the system creates a global map of atmospheric temperature and humidity, cloud amounts and heights, greenhouse gas concentrations, and many other atmospheric phenomena. Launched into Earth orbit in 2002 aboard NASA's Aqua spacecraft, the AIRS and AMSU instruments are managed by JPL, under contract to NASA. JPL is a division of Caltech. https://photojournal.jpl.nasa.gov/catalog/PIA25562
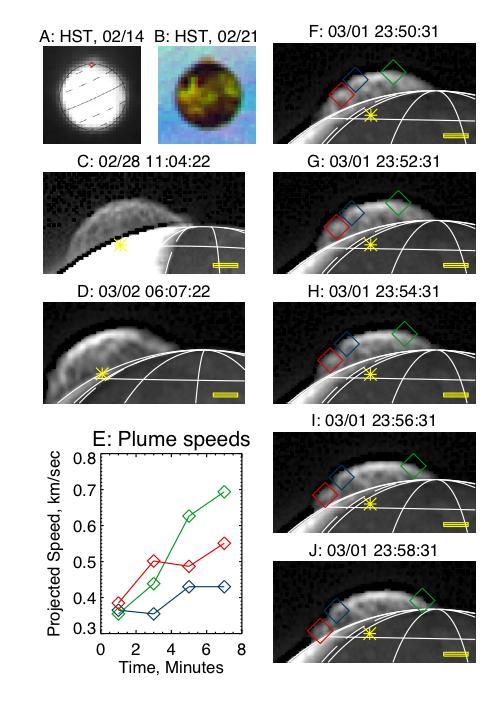
The Tvashtar plume on Io, seen by the Hubble Space Telescope HST and by New Horizons.
This image, taken by NASA Galileo spacecraft, shows a blue-colored volcanic plume consistent with the presence of sulfur dioxide gas and now condensing from the gas as the plume expands and cools. http://photojournal.jpl.nasa.gov/catalog/PIA00293
A ghostly view of Enceladus reveals the specter of the moon icy plume of fine particles. Scientists continue to monitor the plume, where mission planning allows, using the Cassini spacecraft imaging cameras
In August 2001, NASA Galileo spacecraft has returned imagery of a hot spot on Jupiter moon Io that was the source of a towering plume indicating a sulfur-dioxide concentration that may have been fallout from the plume.
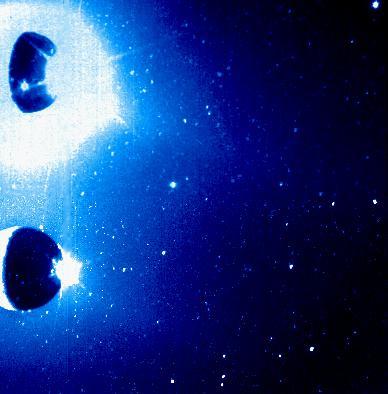
Voyager 2 took this picture of Io on the evening of July 9, 1979, from a range of 1.2 million kilometers. On the limb of Io are two blue volcanic eruption plumes about 100 kilometers high. These two plumes were first seen by Voyager 1 in March, 1979, and are designated Plume 5 (upper) and Plume 6 (lower). They have apparently been erupting for a period of at least 4 months and probably longer. A total of six plumes have been seen by Voyager 2, all of which were first seen by Voyager 1. The largest plume viewed by Voyager 1 (Plume 1) is no longer erupting. Plume 4 was not viewed on the edge of the moon's disc by Voyager 2 and therefore it is not known whether or not it is still erupting. This picture is one of a series taken to monitor the eruptions over a 6 hour period. http://photojournal.jpl.nasa.gov/catalog/PIA01362

STS064-311-031 (10 Sept. 1994) --- Astronaut Mark C. Lee, STS-64 mission specialist, at a Payload General Support Computer (PGSC) on the space shuttle Discovery's flight deck, talks to ground controllers about the Shuttle Plume Impingement Flight Experiment (SPIFEX). Astronaut L. Blaine Hammond, pilot, is partially visible in the background. Photo credit: NASA or National Aeronautics and Space Administration

STS064-311-033 (10 Sept. 1994) --- Half of the crew members share support of the Shuttle Plume Impingement Flight Experiment (SPIFEX) in this 35mm frame. Astronauts Susan J. Helms and Mark C. Lee (foreground) share a pertinent bit of data while astronaut L. Blaine Hammond in the background controls Reaction Control System (RCS) thrusters on the space shuttle Discovery. Helms' role was to control the Remote Manipulator System (RMS) arm, to which 30-feet of SPIFEX hardware were appended in order to measure the RCS plume induced loads in the far field region. Lee records data on a lap top Payload General Support Computer (PGSC). SPIFEX was developed to help understand the thruster effects on approaching spacecraft. Photo credit: NASA or National Aeronautics and Space Administration
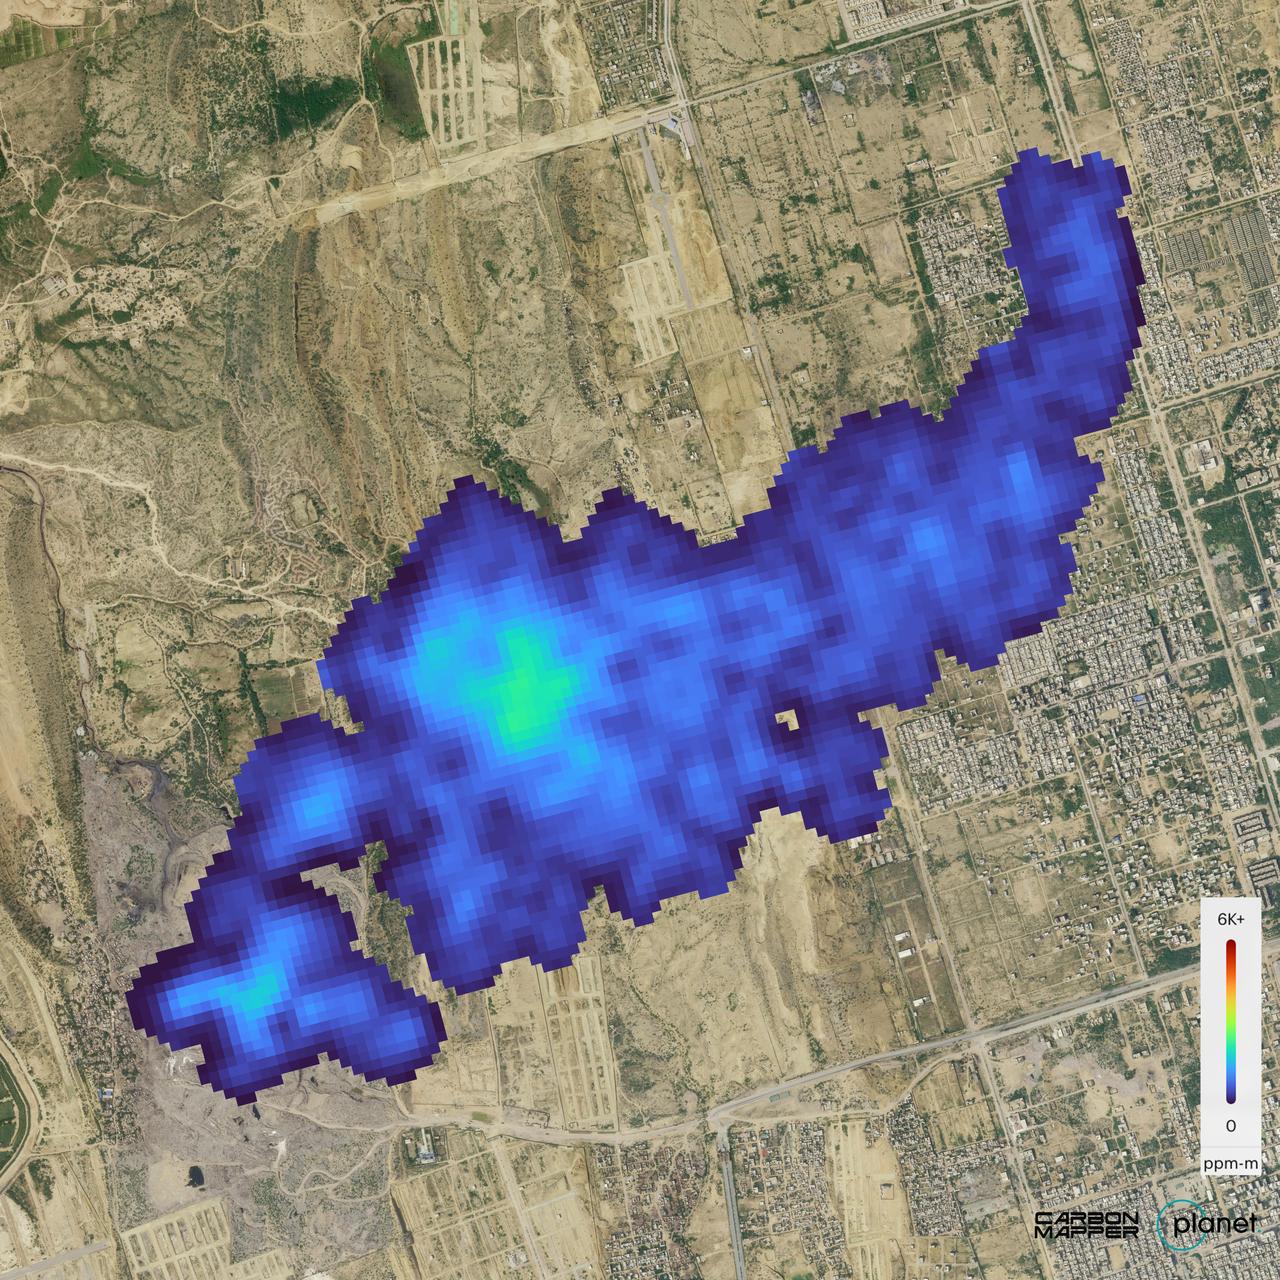
The Carbon Mapper Coalition's Tanager-1 satellite on Sept. 19, 2024, captured data over Karachi, Pakistan, showing the location and concentration of a methane plume measuring about 2½ miles (4 kilometers) long, emanating from a landfill. Enabled by the nonprofit Carbon Mapper and built by Planet Labs PBC, Tanager-1 uses an imaging spectrometer designed by NASA's Jet Propulsion Laboratory in Southern California. Carbon Mapper's preliminary estimate of the source emissions rate is about 2,600 pounds (1,200 kilograms) of methane released per hour. Launched from Vandenberg Space Force Base in California on Aug. 16, 2024, Tanager-1 is part of a broader effort by the nonprofit Carbon Mapper to identify and measure greenhouse gas point-source emissions on a global scale. Both Planet and JPL are members of the philanthropically funded Carbon Mapper Coalition. https://photojournal.jpl.nasa.gov/catalog/PIA26416
Stable, south flowing air over the western Pacific Ocean (26.0N, 131.0E) is disturbed by islands south of Korea, resulting in sinuous clouds known as von Karman vortices. The smoke plume from Japan's Mount Unzen Volcano on Kyushu, is visible just west of the large cloud mass and extending southward. A very large, purple tinged dust pall, originating in Mongolia, can be seen on the Earth's Limb, covering eastern China and extending into the East China Sea.
On June 14, 2011, NASA Earth Observing-1 EO-1 spacecraft obtained this image showing ash-rich volcanic plume billowing out of the vent, punching through a low cloud layer. The plume grey color is a reflection of its ash content.
Blazing like an icy torch, the plume of Enceladus shines in scattered sunlight as the moon casts a shadow onto Saturn E ring
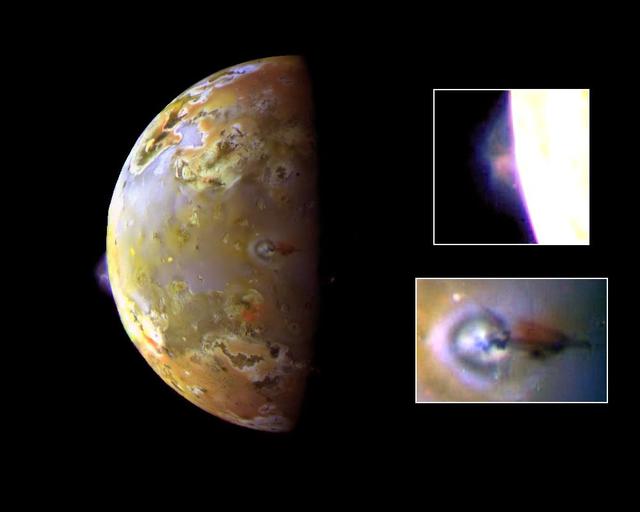
This image from NASA Galileo spacecraft is of Prometheus sunlit plume and Io illuminated crescent.

STS064-08-032 (10 Sept. 1994) --- At the commander's station on the space shuttle Discovery's forward flight deck, astronaut Richard N. Richards, STS-64 mission commander, initiates a thruster firing of the spacecraft during operations with the Shuttle Plume Impingement Flight Experiment (SPIFEX). Photo credit: NASA or National Aeronautics and Space Administration

STS064-72-093 (10 Sept. 1994) --- With the blue and white Earth as a backdrop 130 miles below, the Shuttle Plume Impingement Flight Experiment (SPIFEX) is at work on the end of the Remote Manipulator System (RMS) arm. The 50-feet-long arm is extended to 80 feet with the temporary addition of the SPIFEX hardware. The image was exposed with a 70mm handheld Hasselblad camera from inside the space shuttle Discovery's crew cabin. Photo credit: NASA or National Aeronautics and Space Administration

NASA's Earth Surface Mineral Dust Source Investigation (EMIT) detected a cluster of 12 methane plumes on Sept. 1, 2022, in an approximately 150-square-mile (400-square-kilometer) region of southern Uzbekistan. Methane is a potent greenhouse gas about 80 times more effective at trapping heat than carbon dioxide during the time methane spends in the atmosphere, which is typically about a decade. This an area no NASA airborne imaging spectrometers have covered. Whereas EMIT captured the scene in an instant, an airborne campaign might have taken about 65 hours of flight time to cover the same amount of land. The blue shading covers the area captured by EMIT in one "scene," which is 50 miles by 50 miles (80 kilometers by 80 kilometers). The emissions total about 49,734 pounds (22,559 kilograms) per hour. EMIT uses an imaging spectrometer to detect the unique pattern of reflected and absorbed light – called a spectral fingerprint – from various materials on Earth's surface and in its atmosphere. Perched on the International Space Station, EMIT was originally intended to map the prevalence of minerals in Earth's arid regions, such as the deserts of Africa and Australia. Scientists verified that EMIT could also detect methane and carbon dioxide when they were checking the accuracy of the image spectrometer's mineral data. EMIT was selected from the Earth Venture Instrument-4 solicitation under the Earth Science Division of NASA Science Mission Directorate and was developed at NASA's Jet Propulsion Laboratory, which is managed for the agency by Caltech in Pasadena, California. It launched aboard a SpaceX Dragon resupply spacecraft from NASA's Kennedy Space Center in Florida on July 14, 2022. The instrument's data will be delivered to the NASA Land Processes Distributed Active Archive Center (DAAC) for use by other researchers and the public. https://photojournal.jpl.nasa.gov/catalog/PIA26113
On Sunday, November 3, 2002, Mt. Etna's ash-laden plume was imaged by the Advanced Spaceborne Thermal Emission and Reflection Radiometer (ASTER) on NASA's Terra satellite. The plume is seen blowing toward the south-southeast, over the city and airport of Catania, Sicily. The previous day, the plume was blowing toward the northwest, and posed no hazard to Catania. The current eruption of Mt. Etna, Europe's most active volcano, began on October 27. These sorts of observations from space may help civil defense authorities mitigate hazards from active eruptions. Space data may also help scientists evaluate the behavior and effects volcanic eruptions have on our global climate system. http://photojournal.jpl.nasa.gov/catalog/PIA03881