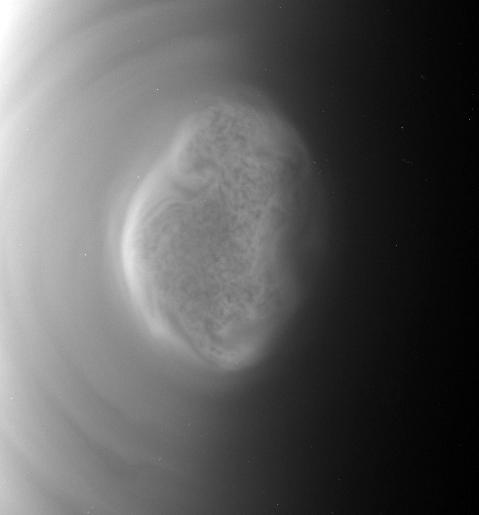
This image from a movie captured by NASAS Cassini spacecraft shows a south polar vortex, or shows a south polar vortex, or a swirling mass of gas around the pole in the atmosphere, at Saturn moon Titan.
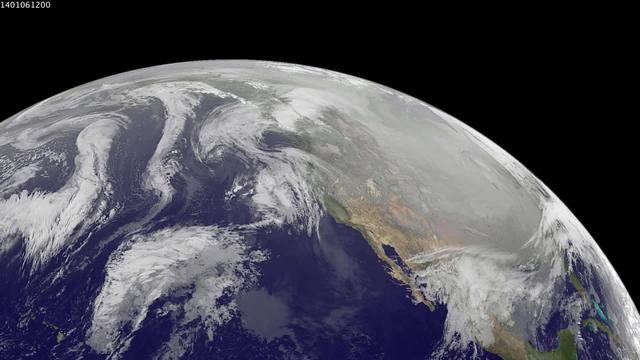
1-9 January 2014. The full-disk images every 3 hours from GOES-WEST capture the sweep of a polar vortex that emerged from the arctic at the beginning of the new year, pushing a blizzard into the northeastern USA on January 3, followed by extensive bitter cold (-20 F, windchill -50 F) around the Great Lakes, and single digit temperatures as far south as Atlanta, Georgia. This western viewpoint displays the persistent flow of arctic air from northern Alaska and Yukon into North America. <b><a href="http://goes.gsfc.nasa.gov/" rel="nofollow">Credit: NOAA/NASA GOES Project</a></b> <b><a href="http://www.nasa.gov/audience/formedia/features/MP_Photo_Guidelines.html" rel="nofollow">NASA image use policy.</a></b> <b><a href="http://www.nasa.gov/centers/goddard/home/index.html" rel="nofollow">NASA Goddard Space Flight Center</a></b> enables NASA’s mission through four scientific endeavors: Earth Science, Heliophysics, Solar System Exploration, and Astrophysics. Goddard plays a leading role in NASA’s accomplishments by contributing compelling scientific knowledge to advance the Agency’s mission. <b>Follow us on <a href="http://twitter.com/NASA_GoddardPix" rel="nofollow">Twitter</a></b> <b>Like us on <a href="http://www.facebook.com/pages/Greenbelt-MD/NASA-Goddard/395013845897?ref=tsd" rel="nofollow">Facebook</a></b> <b>Find us on <a href="http://instagram.com/nasagoddard?vm=grid" rel="nofollow">Instagram</a></b>

The Polar Vortex is a whirling and persistent large area of low pressure, found typically over both north and south poles. The northern Polar Vortex is pushing southward over western Wisconsin/eastern Minnesota today, Monday, January 6, 2014 and is bringing frigid temperatures to half of the continental United States. It is expected to move northward back over Canada toward the end of the week. This image was captured by NOAA's GOES-East satellite on January 6, 2014 at 1601 UTC/11:01 a.m. EST. A frontal system that brought rain to the coast is draped from north to south along the U.S. East Coast. Behind the front lies the clearer skies bitter cold air associated with the Polar Vortex. The GOES image also revealed snow on the ground in Minnesota, Wisconsin, Illinois, Indiana, Ohio, Michigan, Iowa and Missouri, stretching into the Great Plains. Cloudiness over Texas is associated with a low pressure system centered over western Oklahoma that is part of the cold front connected to the movement of the Polar Vortex. The GOES image was created at NASA's GOES Project, located at NASA's Goddard Space Flight Center in Greenbelt, Md. Both the northern and southern polar vortices are located in the middle and upper troposphere (lowest level of the atmosphere) and the stratosphere (next level up in the atmosphere). The polar vortex is a winter phenomenon. It develops and strengthens in its respective hemisphere's winter as the sun sets over the polar region and temperatures cool. They weaken in the summer. In the northern hemisphere, they circulate in a counter-clockwise direction, so the vortex sitting over western Wisconsin is sweeping in cold Arctic air around it. The Arctic Polar Vortex peaks in the Northern Hemisphere's wintertime and has already moved southward several times this winter. In the past, it has also moved southward over Europe.On January 21, 1985, the National Oceanic and Atmospheric Administration Daily Weather Map series showed a strong polar vortex centered over Maine. The Polar Vortex also affects ozone. For more information on the Polar Vortex and how it affects ozone, visit NASA's Ozone Watch page: <a href="http://ozonewatch.gsfc.nasa.gov/facts/vortex_NH.html" rel="nofollow">ozonewatch.gsfc.nasa.gov/facts/vortex_NH.html</a> Rob Gutro NASA's Goddard Space Flight Center <b><a href="http://goes.gsfc.nasa.gov/" rel="nofollow">Credit: NOAA/NASA GOES Project</a></b> <b><a href="http://www.nasa.gov/audience/formedia/features/MP_Photo_Guidelines.html" rel="nofollow">NASA image use policy.</a></b> <b><a href="http://www.nasa.gov/centers/goddard/home/index.html" rel="nofollow">NASA Goddard Space Flight Center</a></b> enables NASA’s mission through four scientific endeavors: Earth Science, Heliophysics, Solar System Exploration, and Astrophysics. Goddard plays a leading role in NASA’s accomplishments by contributing compelling scientific knowledge to advance the Agency’s mission. <b>Follow us on <a href="http://twitter.com/NASA_GoddardPix" rel="nofollow">Twitter</a></b> <b>Like us on <a href="http://www.facebook.com/pages/Greenbelt-MD/NASA-Goddard/395013845897?ref=tsd" rel="nofollow">Facebook</a></b> <b>Find us on <a href="http://instagram.com/nasagoddard?vm=grid" rel="nofollow">Instagram</a></b>
These two views of Saturn moon Titan show the southern polar vortex, a huge, swirling cloud that was first observed by NASA Cassini spacecraft in 2012.
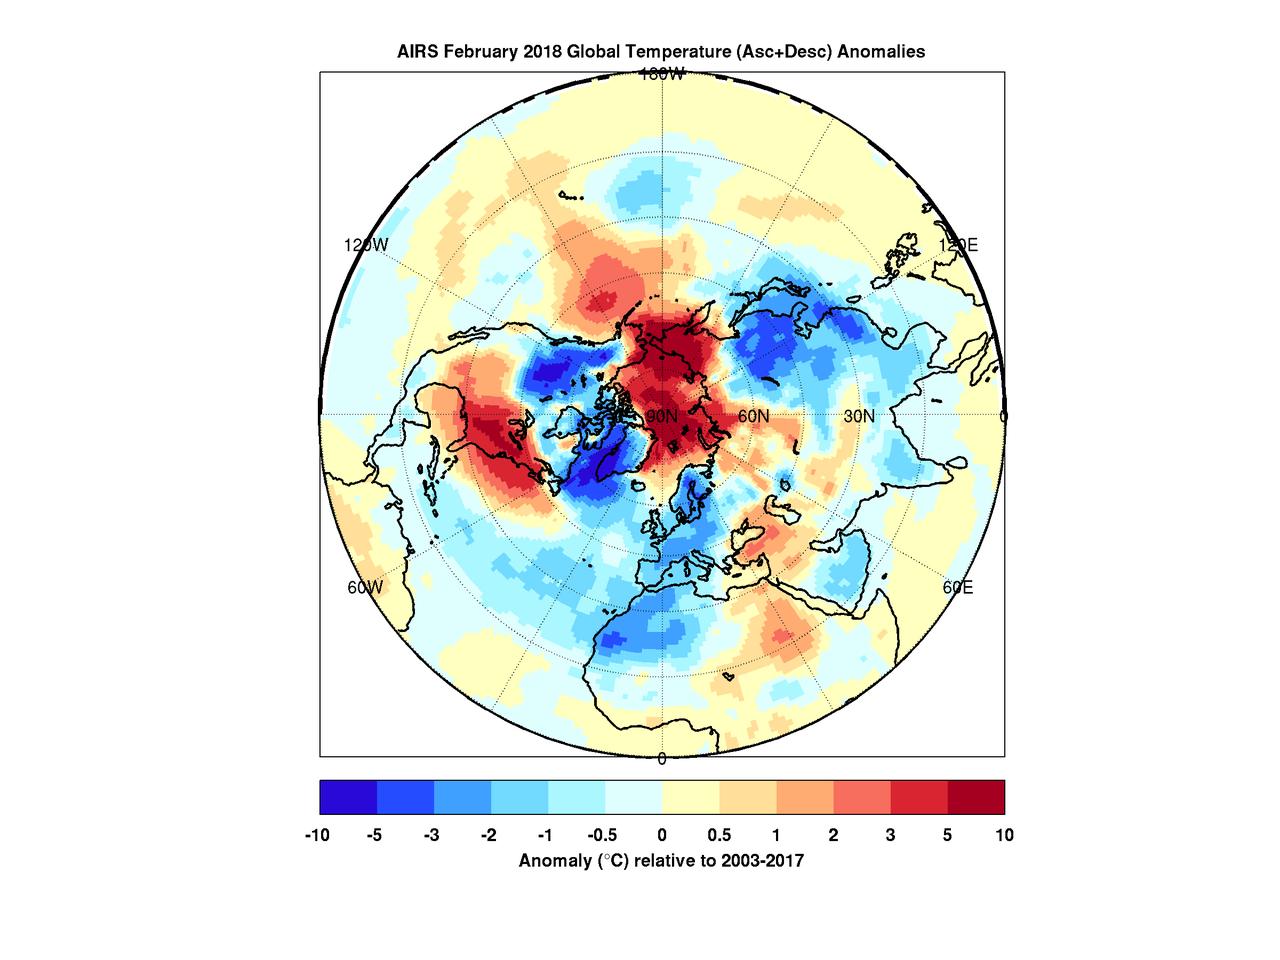
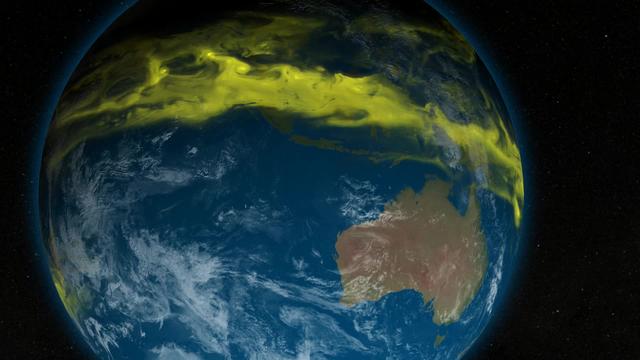
When the polar vortex dips south it often makes headlines. Frigid air, usually confined to the arctic, spills into lower parts of the continent making it a chilly challenge for people going about their day. But there's a warm part to the story as well. While the eastern and southern United States were shivering in January the arctic was experiencing above average temperatures. In maps created with data by the Atmospheric Infrared Sounder (AIRS) on NASA's Aqua satellite, warmer-than-normal temperatures are colored in red and below average temperatures are colored in blue. Provided in geographic and polar projections, the maps show regions of unusually cold air hovering over the eastern and southern U.S., eastern Canada and Greenland in January. February shows colder-than-normal air blanketing the northwest U.S., Canada, Western Europe, northwest Africa and East Asia. In both cases, the arctic remains exceptionally warm. During most winters the polar vortex is like a giant counterclockwise whirlpool spinning around the north pole with cold air at its center. Occasionally the vortex splits and its parts move south, usually over the continents. At the same time, warm air from the south moves in to fill the gap, and that northward movement usually occurs over the oceans. The cold air movement gets the most attention because it typically affects many millions of people. However, that cooling is very often accompanied by warming somewhere over the Arctic -- an equally important part of the polar vortex story that usually goes unnoticed but is very apparent in the images shown here. More images are available at https://photojournal.jpl.nasa.gov/catalog/PIA22344
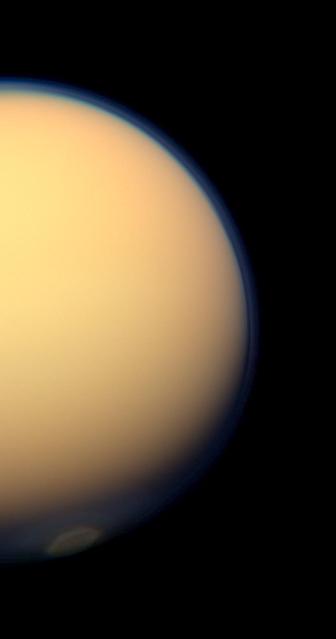
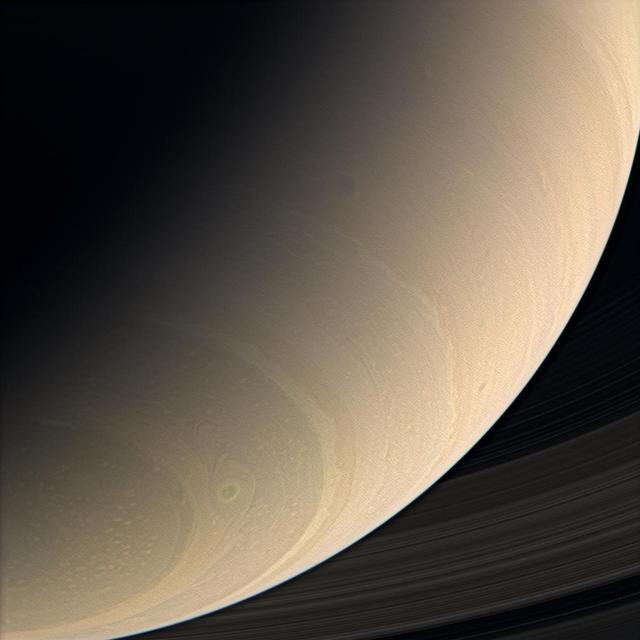
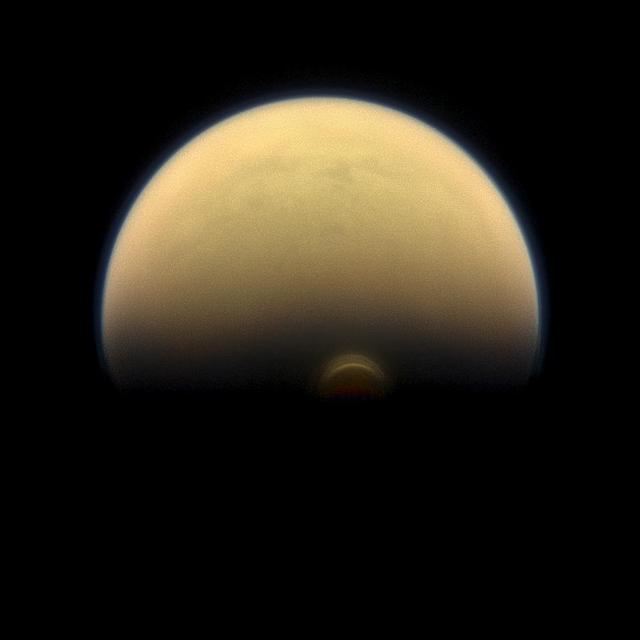
The recently formed south polar vortex stands out in the color-swaddled atmosphere of Saturn largest moon, Titan, in this natural color view from NASA Cassini spacecraft.

NASA's Atmospheric Infrared Sounder (AIRS) instrument captures a polar vortex moving from Central Canada into the U.S. Midwest from January 20 through January 29, 2019. The images show air temperatures at 600 millibars, around 2.5 miles (4 kilometers) high in Earth's troposphere. This polar vortex is responsible for surface air temperatures as low as -40 degrees Fahrenheit (also -40 degrees Celsius) and wind chill readings as low as the -50s and -60s Fahrenheit (-46 and -51 Celsius). Animation available at https://photojournal.jpl.nasa.gov/catalog/PIA22823
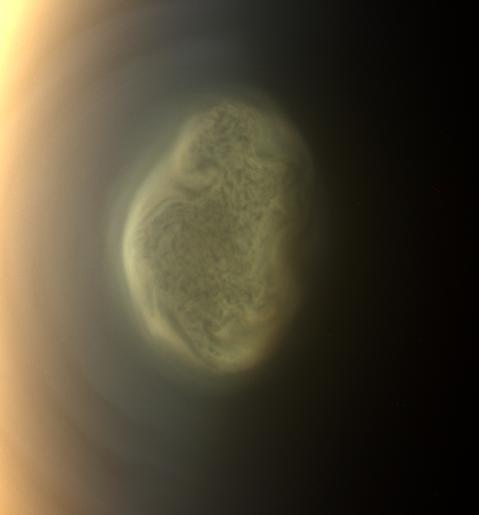
This true color image captured by NASAS Cassini spacecraft before a distant flyby of Saturn moon Titan on June 27, 2012, shows a south polar vortex, or a mass of fluid-like clouds and haze swirling around the pole in the atmosphere of the moon.
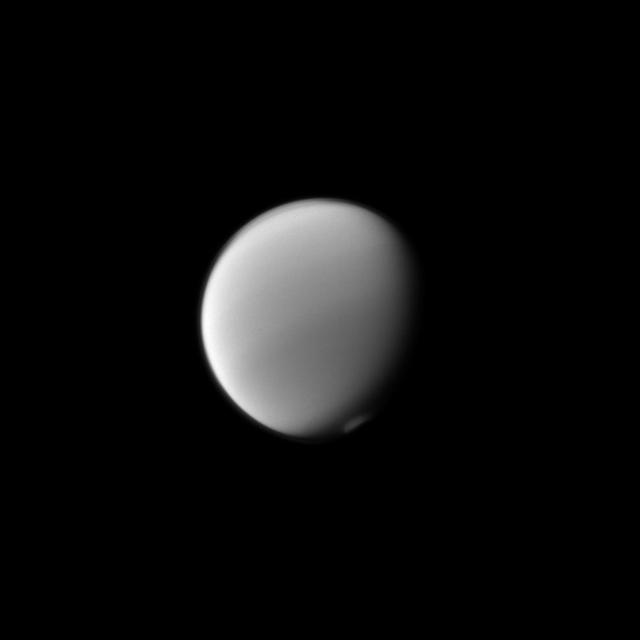
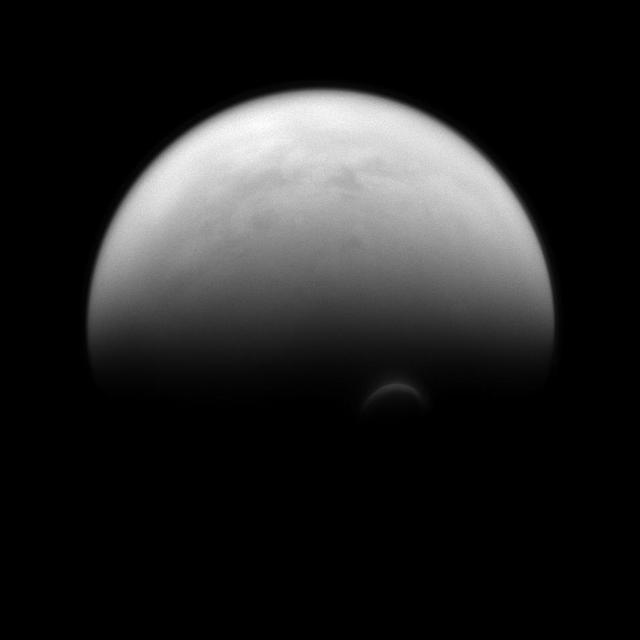
NASA Cassini spacecraft spies Titan south polar vortex from below the moon in this image. Imaging scientists are monitoring the vortex to study its seasonal development.
Titan shows us its active polar atmosphere with the north polar hood and south polar vortex both on display in this image captured by NASA Cassini spacecraft.
Titan polar vortex stands illuminated where all else is in shadow in this image from NASA Cassini spacecraft.
Titan atmosphere puts on a display with the detached haze to the north top of image and the polar vortex to the south as seen by NASA Cassini spacecraft.
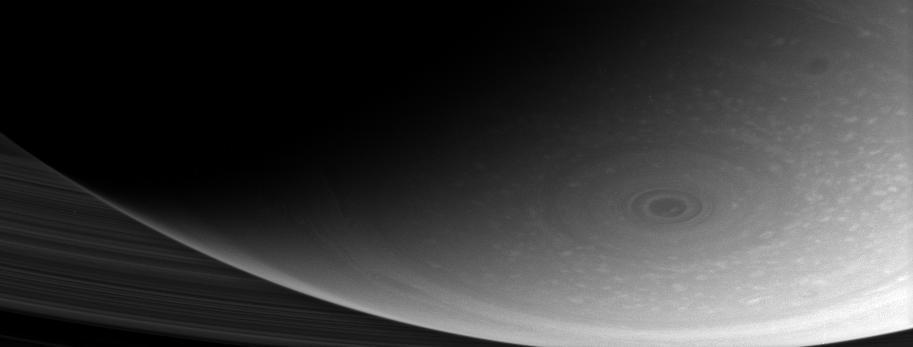
This dramatic close-up of Saturn south pole shows the hurricane-like vortex that resides there. The entire polar region is dotted with bright clouds, including one that appears to be inside the central ring of the polar storm

Dunes in the Vastitas Borealis region of Mars are seen in this image from NASA Mars Odyssey spacecraft. These sand seas migrate around the north polar cap following the strong polar vortex winds.
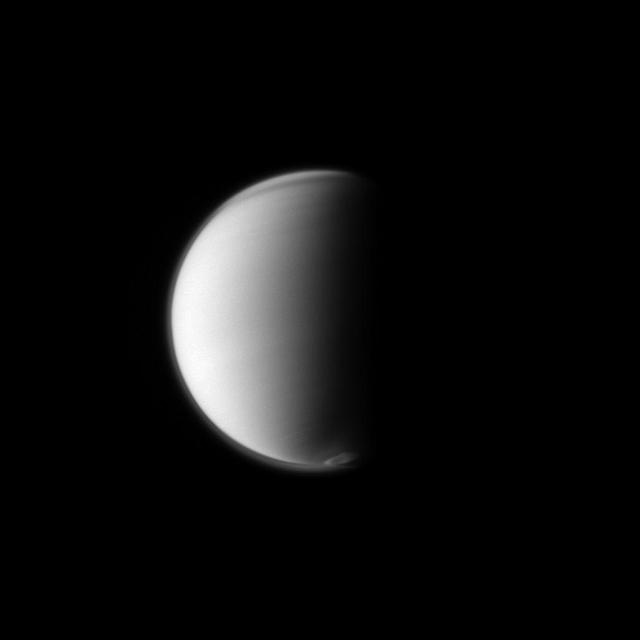
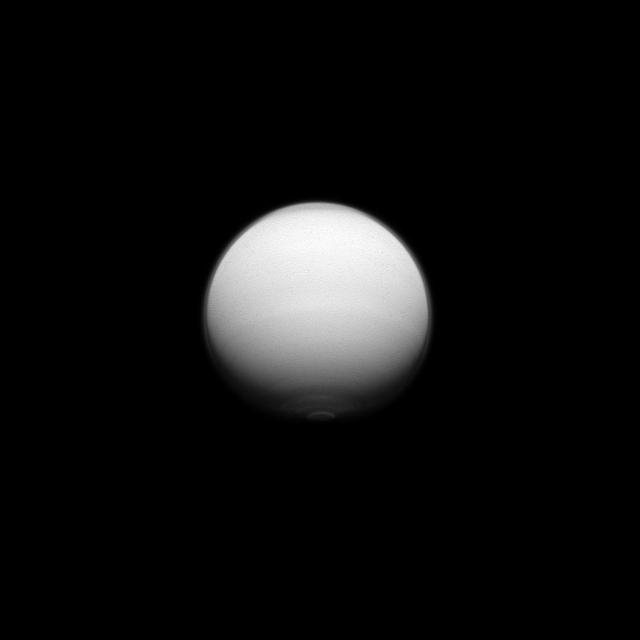
NASA Cassini spacecraft monitors Titan developing south polar vortex, which is a mass of swirling gas around the pole in the atmosphere of the moon.
The Cassini spacecraft views Saturn southern latitudes in color, spying a great, eye-shaped vortex just northward of the south polar region
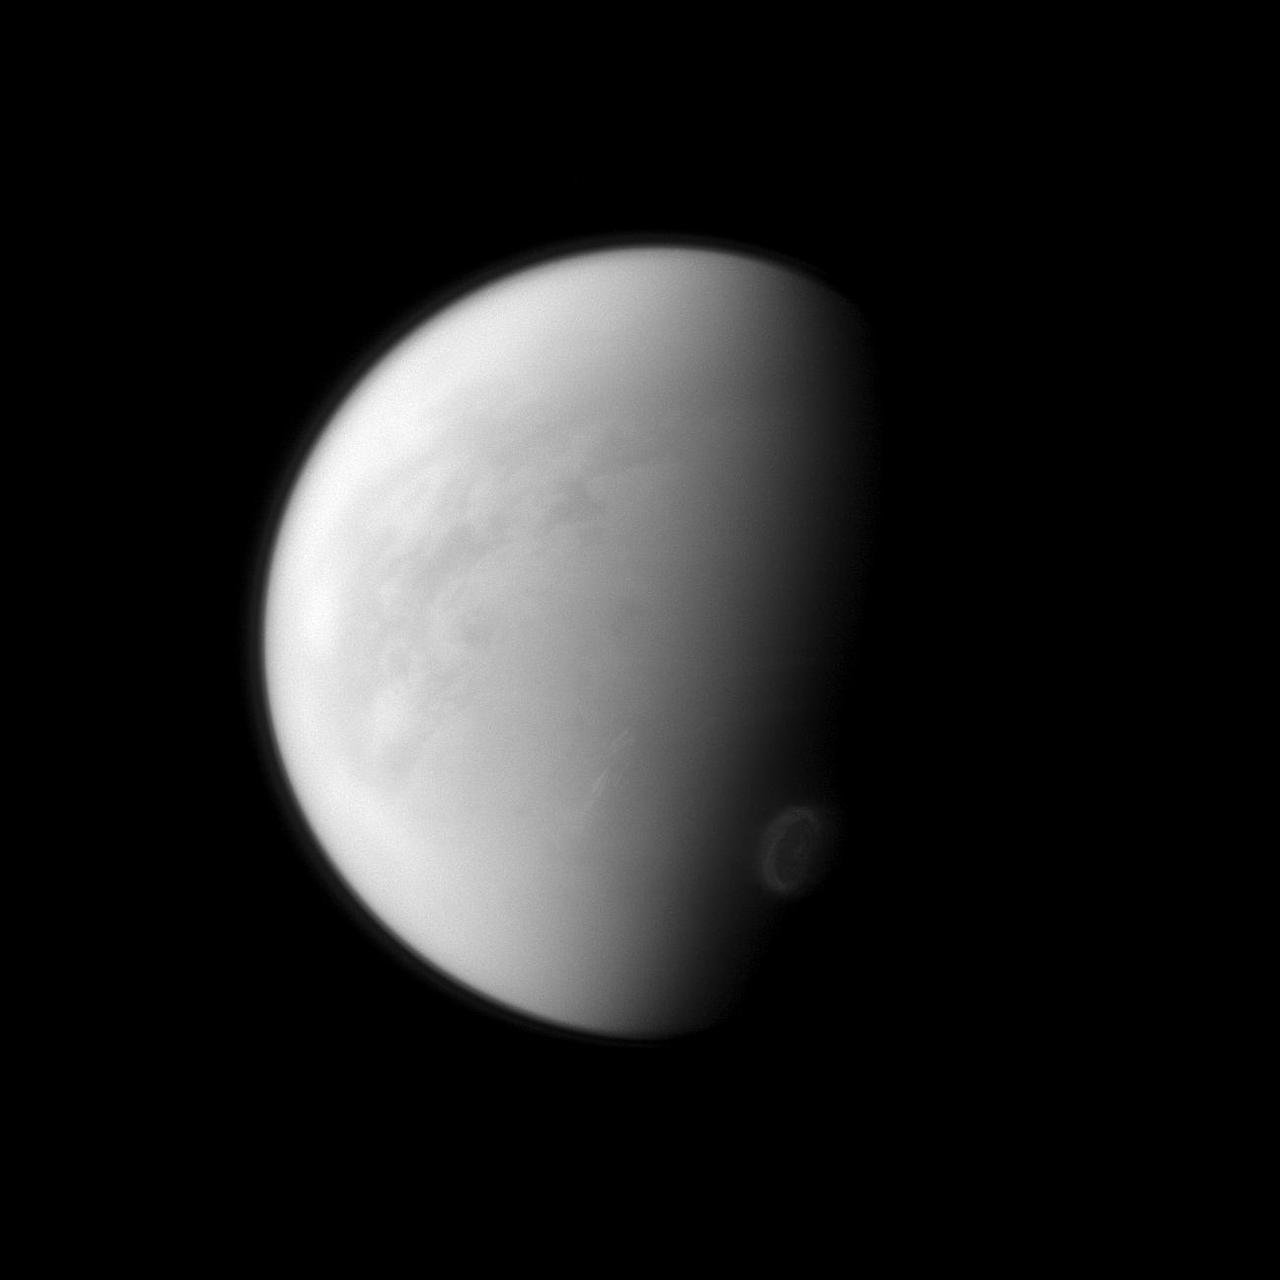
Titan swirling south-polar vortex stands out brightly against the other clouds of the south pole lower right in this image captured by NASA Cassini spacecraft.
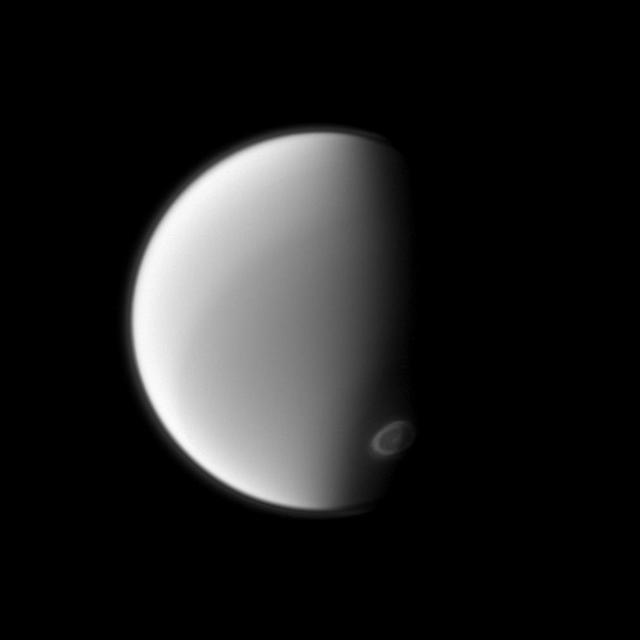
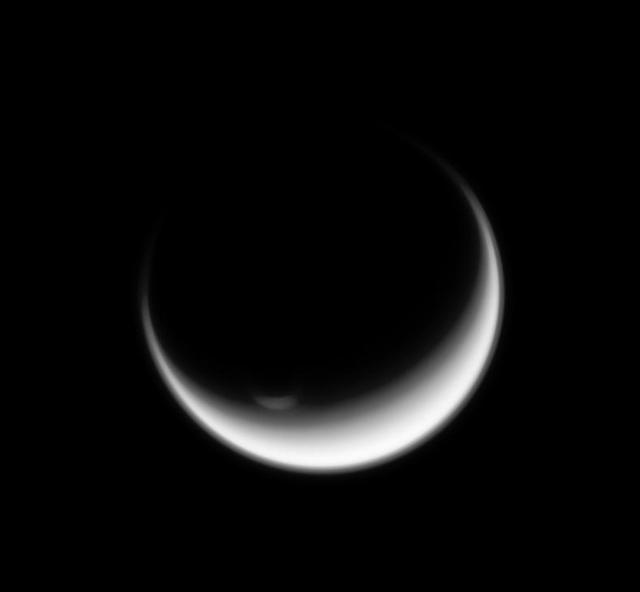
The sunlit edge of Titan south polar vortex stands out distinctly against the darkness of the moon unilluminated hazy atmosphere as seen by NASA Cassini spacecraft.
Titan south polar vortex seems to float above the moon south pole in this Cassini spacecraft view. The vortex, which is a mass of gas swirling around the south pole high in the moon atmosphere, can be seen in the lower right of this view.
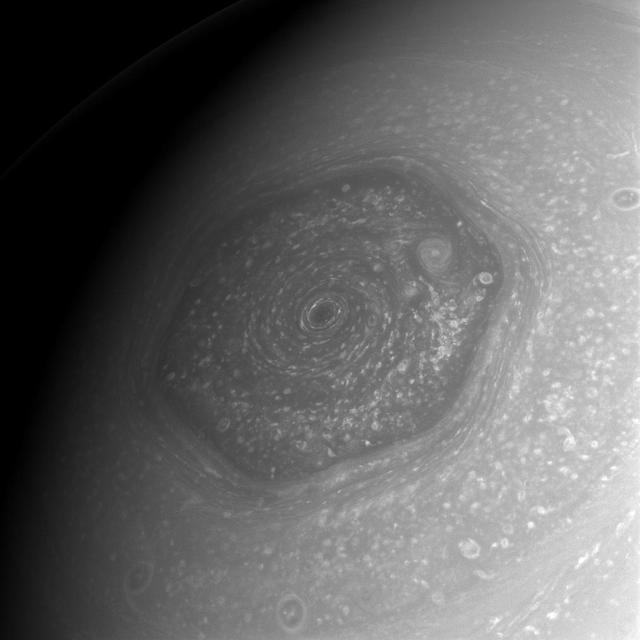
The area within Saturn north polar hexagon is shown by NASA Cassini spacecraft to contain myriad storms of various sizes, not the least of which is the remarkable and imposing vortex situated over the planet north pole.
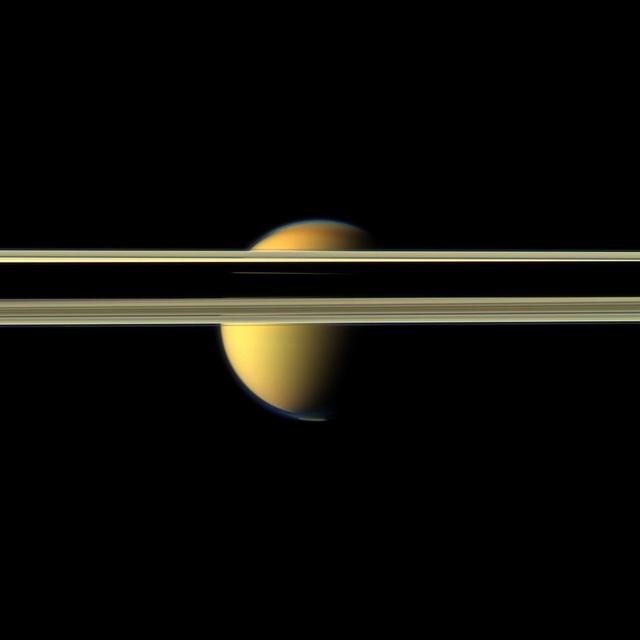
Saturn rings obscure part of Titan colorful visage in this image from NASA Cassini spacecraft. The south polar vortex that first appeared in Titan atmosphere in 2012 is visible at the bottom of this view.
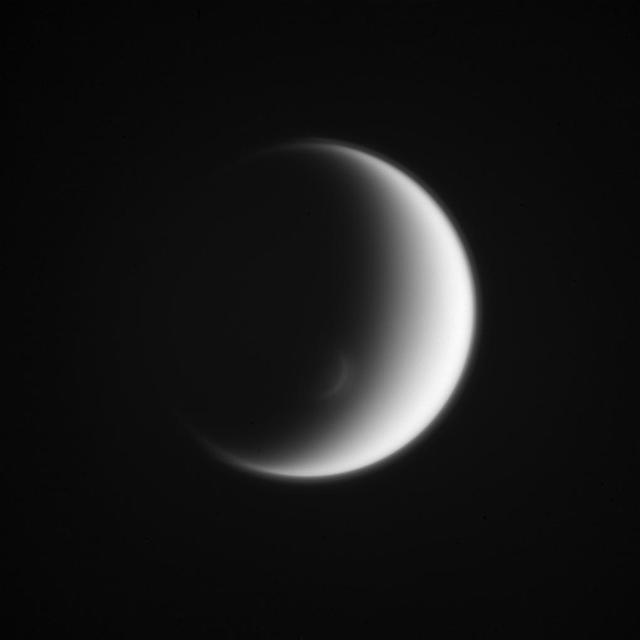
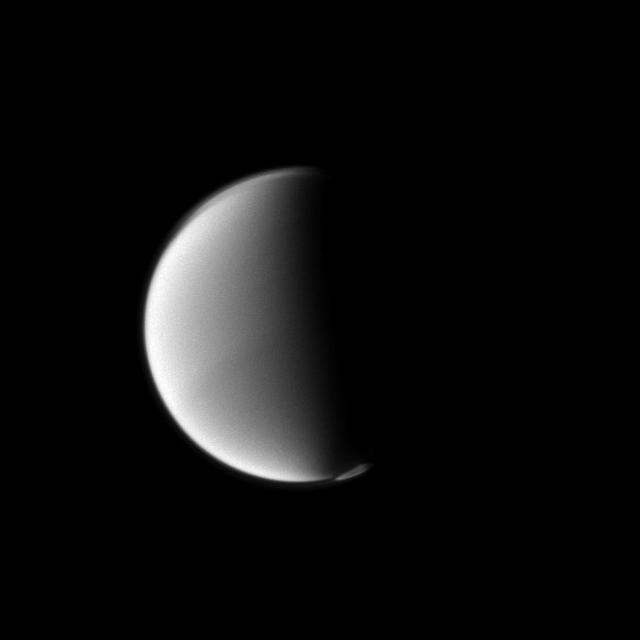
This view captured by NASA Cassini spacecraft looks toward the trailing hemisphere of Titan. Titan south polar vortex mimics the moon itself, creating an elegant crescent within a crescent.
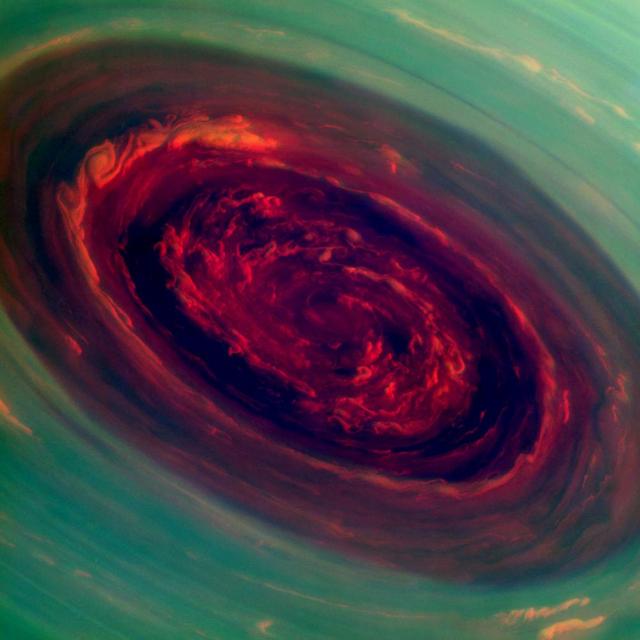
The spinning vortex of Saturn north polar storm resembles a deep red rose of giant proportions surrounded by green foliage in this false-color image from NASA Cassini spacecraft.
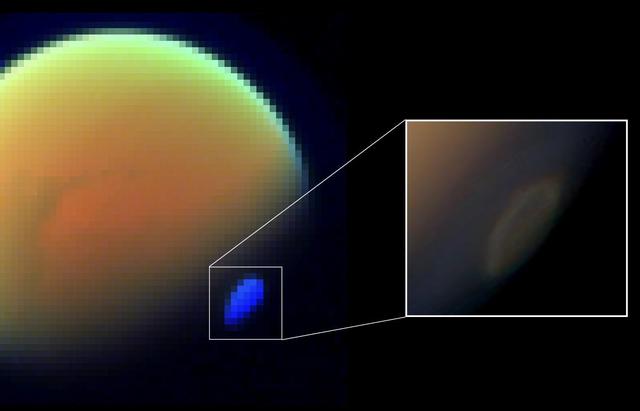
Slipping into shadow, the south polar vortex at Saturn's moon Titan still stands out against the orange and blue haze layers that are characteristic of Titan's atmosphere. Images like this, from NASA's Cassini spacecraft, lead scientists to conclude that the polar vortex clouds form at a much higher altitude -- where sunlight can still reach -- than the lower-altitude surrounding haze. This view looks towards the trailing hemisphere of Titan (3,200 miles or 5,150 kilometers across). North on Titan is up and rotated 17 degrees to the left. Images taken using red, green and blue spectral filters were combined to create this natural-color view. The image was taken with the Cassini spacecraft narrow-angle camera on July 30, 2013. The view was acquired at a distance of approximately 895,000 miles (1.441 million kilometers) from Titan. Image scale is 5 miles (9 kilometers) per pixel. http://photojournal.jpl.nasa.gov/catalog/PIA17177
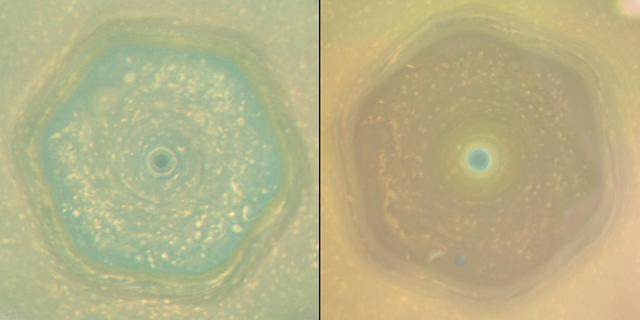
These natural color views from NASA's Cassini spacecraft compare the appearance of Saturn's north-polar region in June 2013 and April 2017. In both views, Saturn's polar hexagon dominates the scene. The comparison shows how clearly the color of the region changed in the interval between the two views, which represents the latter half of Saturn's northern hemisphere spring. In 2013, the entire interior of the hexagon appeared blue. By 2017, most of the hexagon's interior was covered in yellowish haze, and only the center of the polar vortex retained the blue color. The seasonal arrival of the sun's ultraviolet light triggers the formation of photochemical aerosols, leading to haze formation. The general yellowing of the polar region is believed to be caused by smog particles produced by increasing solar radiation shining on the polar region as Saturn approached the northern summer solstice on May 24, 2017. Scientists are considering several ideas to explain why the center of the polar vortex remains blue while the rest of the polar region has turned yellow. One idea is that, because the atmosphere in the vortex's interior is the last place in the northern hemisphere to be exposed to spring and summer sunlight, smog particles have not yet changed the color of the region. A second explanation hypothesizes that the polar vortex may have an internal circulation similar to hurricanes on Earth. If the Saturnian polar vortex indeed has an analogous structure to terrestrial hurricanes, the circulation should be downward in the eye of the vortex. The downward circulation should keep the atmosphere clear of the photochemical smog particles, and may explain the blue color. Images captured with Cassini's wide-angle camera using red, green and blue spectral filters were combined to create these natural-color views. The 2013 view (left in the combined view), was captured on June 25, 2013, when the spacecraft was about 430,000 miles (700,000 kilometers) away from Saturn. The original versions of these images, as sent by the spacecraft, have a size of 512 by 512 pixels and an image scale of about 52 miles (80 kilometers) per pixel; the images have been mapped in polar stereographic projection to the resolution of approximately 16 miles (25 kilometers) per pixel. The second and third frames in the animation were taken approximately 130 and 260 minutes after the first image. The 2017 sequence (right in the combined view) was captured on April 25, 2017, just before Cassini made its first dive between Saturn and its rings. During the imaging sequence, the spacecraft's distance from the center of the planet changed from 450,000 miles (725,000 kilometers) to 143,000 miles (230,000 kilometers). The original versions of these images, as sent by the spacecraft, have a size of 512 by 512 pixels. The resolution of the original images changed from about 52 miles (80 kilometers) per pixel at the beginning to about 9 miles (14 kilometers) per pixel at the end. The images have been mapped in polar stereographic projection to the resolution of approximately 16 miles (25 kilometers) per pixel. The average interval between the frames in the movie sequence is 230 minutes. Corresponding animated movie sequences are available at https://photojournal.jpl.nasa.gov/catalog/PIA21611 https://photojournal.jpl.nasa.gov/catalog/PIA21611

The Atmospheric Infrared Sounder (AIRS) provides a daily global 3-dimensional view of Earth's ozone layer. Since AIRS observes in the thermal infrared spectral range, it also allows scientists to view from space the Antarctic ozone hole for the first time continuously during polar winter. This image sequence captures the intensification of the annual ozone hole in the Antarctic Polar Vortex. http://photojournal.jpl.nasa.gov/catalog/PIA09938
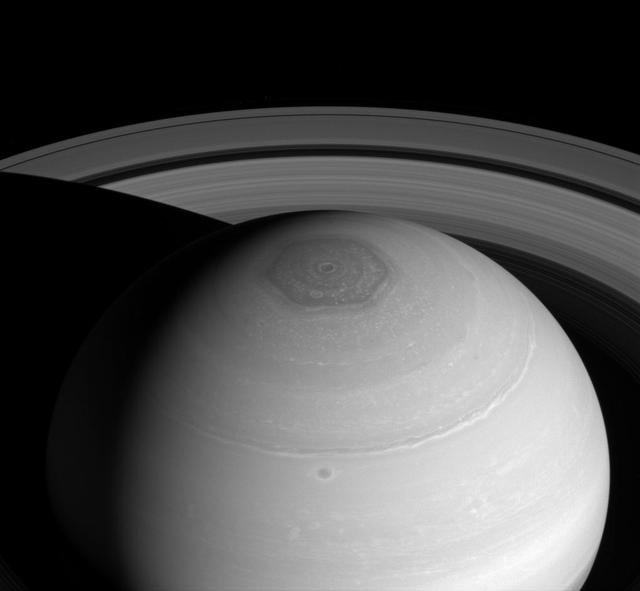
NASA Cassini spacecraft captures three magnificent sights at once: Saturn north polar vortex and hexagon along with its expansive rings. The hexagon, which is wider than two Earths, owes its appearance to the jet stream that forms its perimeter. The jet stream forms a six-lobed, stationary wave which wraps around the north polar regions at a latitude of roughly 77 degrees North. This view looks toward the sunlit side of the rings from about 37 degrees above the ringplane. The image was taken with the Cassini spacecraft wide-angle camera on April 2, 2014 using a spectral filter which preferentially admits wavelengths of near-infrared light centered at 752 nanometers. The view was obtained at a distance of approximately 1.4 million miles (2.2 million kilometers) from Saturn and at a Sun-Saturn-spacecraft, or phase, angle of 43 degrees. Image scale is 81 miles (131 kilometers) per pixel. http://photojournal.jpl.nasa.gov/catalog/PIA18274
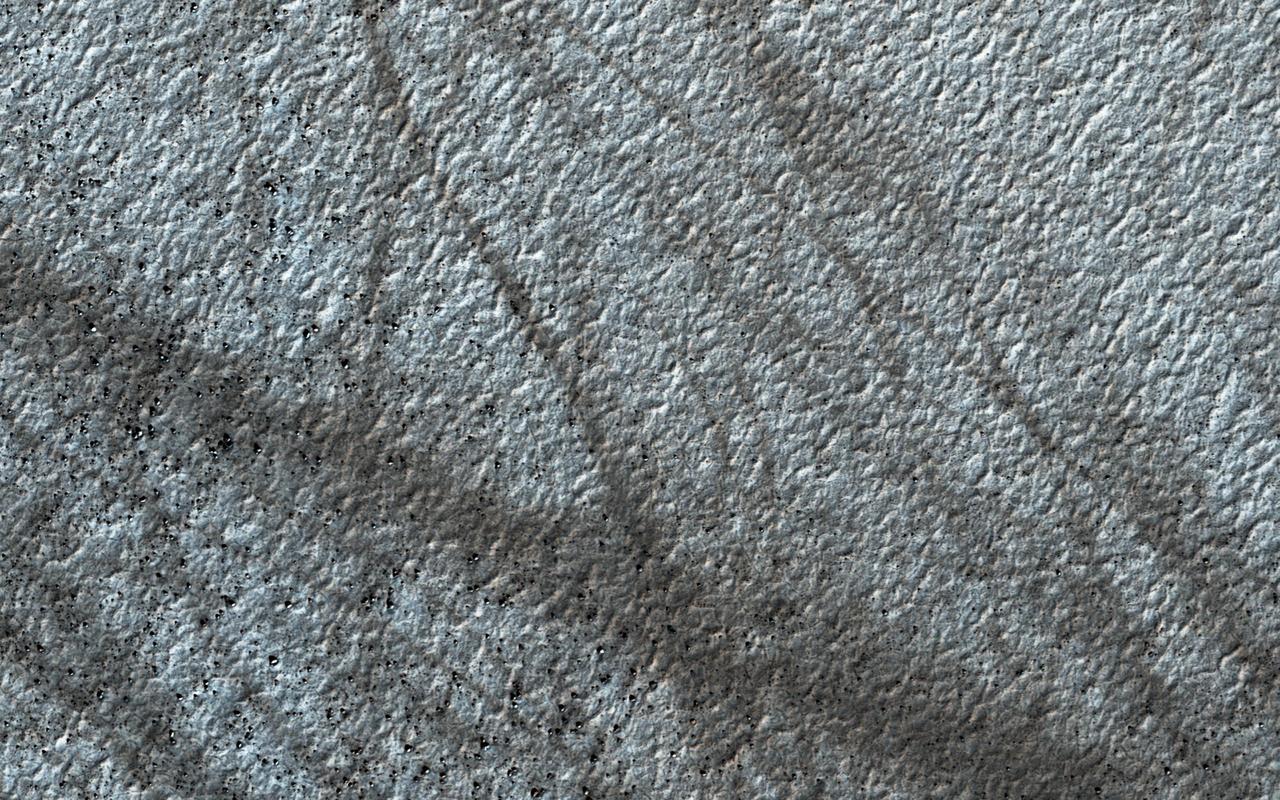
Dust devils on Mars often create long, dark markings where they pull a thin coat of dust off the surface. This image shows a cluster of these tracks on the flat ground below the south polar layered deposits, but none on the layers themselves. This tells us that either dust devils do not cross the layers, or they do not leave a track there. There are several possible reasons for this. For instance, the dust might be thick enough that the vortex of the dust devil doesn't expose darker material from underneath the surface. https://photojournal.jpl.nasa.gov/catalog/PIA23064
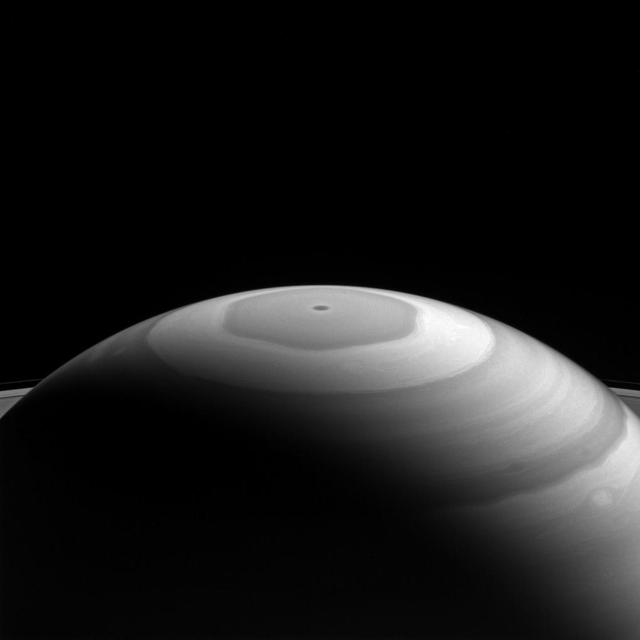
Saturn's north polar region displays its beautiful bands and swirls, which somewhat resemble the brushwork in a watercolor painting. Each latitudinal band represents air flowing at different speeds, and clouds at different heights, compared to neighboring bands. Where they meet and flow past each other, the bands' interactions produce many eddies and swirls. The northern polar region of Saturn is dominated by the famous hexagon shape (see PIA11682) which itself circumscribes the northern polar vortex -- seen as a dark spot at the planet's pole in the above image-- which is understood to the be eye of a hurricane-like storm (PIA14946). This view looks toward the sunlit side of the rings from about 20 degrees above the ring plane. The image was taken with the Cassini spacecraft wide-angle camera on Sept. 5, 2016 using a spectral filter which preferentially admits wavelengths of near-infrared light centered at 728 nanometers. The view was obtained at a distance of approximately 890,000 miles (1.4 million kilometers) from Saturn. Image scale is 53 miles (86 kilometers) per pixel. http://photojournal.jpl.nasa.gov/catalog/PIA20507
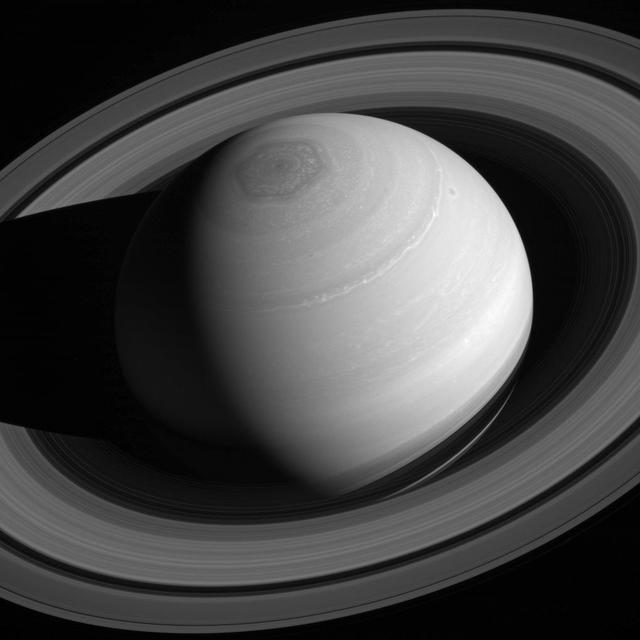
Saturn reigns supreme, encircled by its retinue of rings. Although all four giant planets have ring systems, Saturn's is by far the most massive and impressive. Scientists are trying to understand why by studying how the rings have formed and how they have evolved over time. Also seen in this image is Saturn's famous north polar vortex and hexagon. This view looks toward the sunlit side of the rings from about 37 degrees above the ringplane. The image was taken with the Cassini spacecraft wide-angle camera on May 4, 2014 using a spectral filter which preferentially admits wavelengths of near-infrared light centered at 752 nanometers. The view was acquired at a distance of approximately 2 million miles (3 million kilometers) from Saturn. Image scale is 110 miles (180 kilometers) per pixel. http://photojournal.jpl.nasa.gov/catalog/PIA18278

This sequence of color-enhanced images shows how quickly the viewing geometry changes for NASA's Juno spacecraft as it swoops by Jupiter. The images were obtained by JunoCam. Once every 53 days, Juno swings close to Jupiter, speeding over its clouds. In just two hours, the spacecraft travels from a perch over Jupiter's north pole through its closest approach (perijove), then passes over the south pole on its way back out. This sequence shows 11 color-enhanced images from Perijove 8 (Sept. 1, 2017) with the south pole on the left (11th image in the sequence) and the north pole on the right (first image in the sequence). The first image on the right shows a half-lit globe of Jupiter, with the north pole approximately at the upper center of the image close to the terminator -- the dividing line between night and day. As the spacecraft gets closer to Jupiter, the horizon moves in and the range of visible latitudes shrinks. The second and third images in this sequence show the north polar region rotating away from the spacecraft's field of view while the first of Jupiter's lighter-colored bands comes into view. The fourth through the eighth images display a blue-colored vortex in the mid-southern latitudes near Points of Interest "Collision of Colours," "Sharp Edge," "Caltech, by Halka," and "Structure01." The Points of Interest are locations in Jupiter's atmosphere that were identified and named by members of the general public. Additionally, a darker, dynamic band can be seen just south of the vortex. In the ninth and tenth images, the south polar region rotates into view. The final image on the left displays Jupiter's south pole in the center. From the start of this sequence of images to the end, roughly 1 hour and 35 minutes elapsed. https://photojournal.jpl.nasa.gov/catalog/PIA21967 . - Enhanced image by Kevin M. Gill (CC-BY) based on images provided courtesy of NASA/JPL-Caltech/SwRI/MSSS
Caption: This is a conceptual animation showing ozone-depleting chemicals moving from the equator to the poles. The chemicals become trapped by the winds of the polar vortex, a ring of fast moving air that circles the South Pole. Watch full video: <a href="https://youtu.be/7n2km69jZu8" rel="nofollow">youtu.be/7n2km69jZu8</a> -- The next three decades will see an end of the era of big ozone holes. In a new study, scientists from NASA Goddard Space Flight Center say that the ozone hole will be consistently smaller than 12 million square miles by the year 2040. Ozone-depleting chemicals in the atmosphere cause an ozone hole to form over Antarctica during the winter months in the Southern Hemisphere. Since the Montreal Protocol agreement in 1987, emissions have been regulated and chemical levels have been declining. However, the ozone hole has still remained bigger than 12 million square miles since the early 1990s, with exact sizes varying from year to year. The size of the ozone hole varies due to both temperature and levels of ozone-depleting chemicals in the atmosphere. In order to get a more accurate picture of the future size of the ozone hole, scientists used NASA’s AURA satellite to determine how much the levels of these chemicals in the atmosphere varied each year. With this new knowledge, scientists can confidently say that the ozone hole will be consistently smaller than 12 million square miles by the year 2040. Scientists will continue to use satellites to monitor the recovery of the ozone hole and they hope to see its full recovery by the end of the century. Research: Inorganic chlorine variability in the Antarctic vortex and implications for ozone recovery. Journal: Geophysical Research: Atmospheres, December 18, 2014. Link to paper: <a href="http://onlinelibrary.wiley.com/doi/10.1002/2014JD022295/abstract" rel="nofollow">onlinelibrary.wiley.com/doi/10.1002/2014JD022295/abstract</a>.
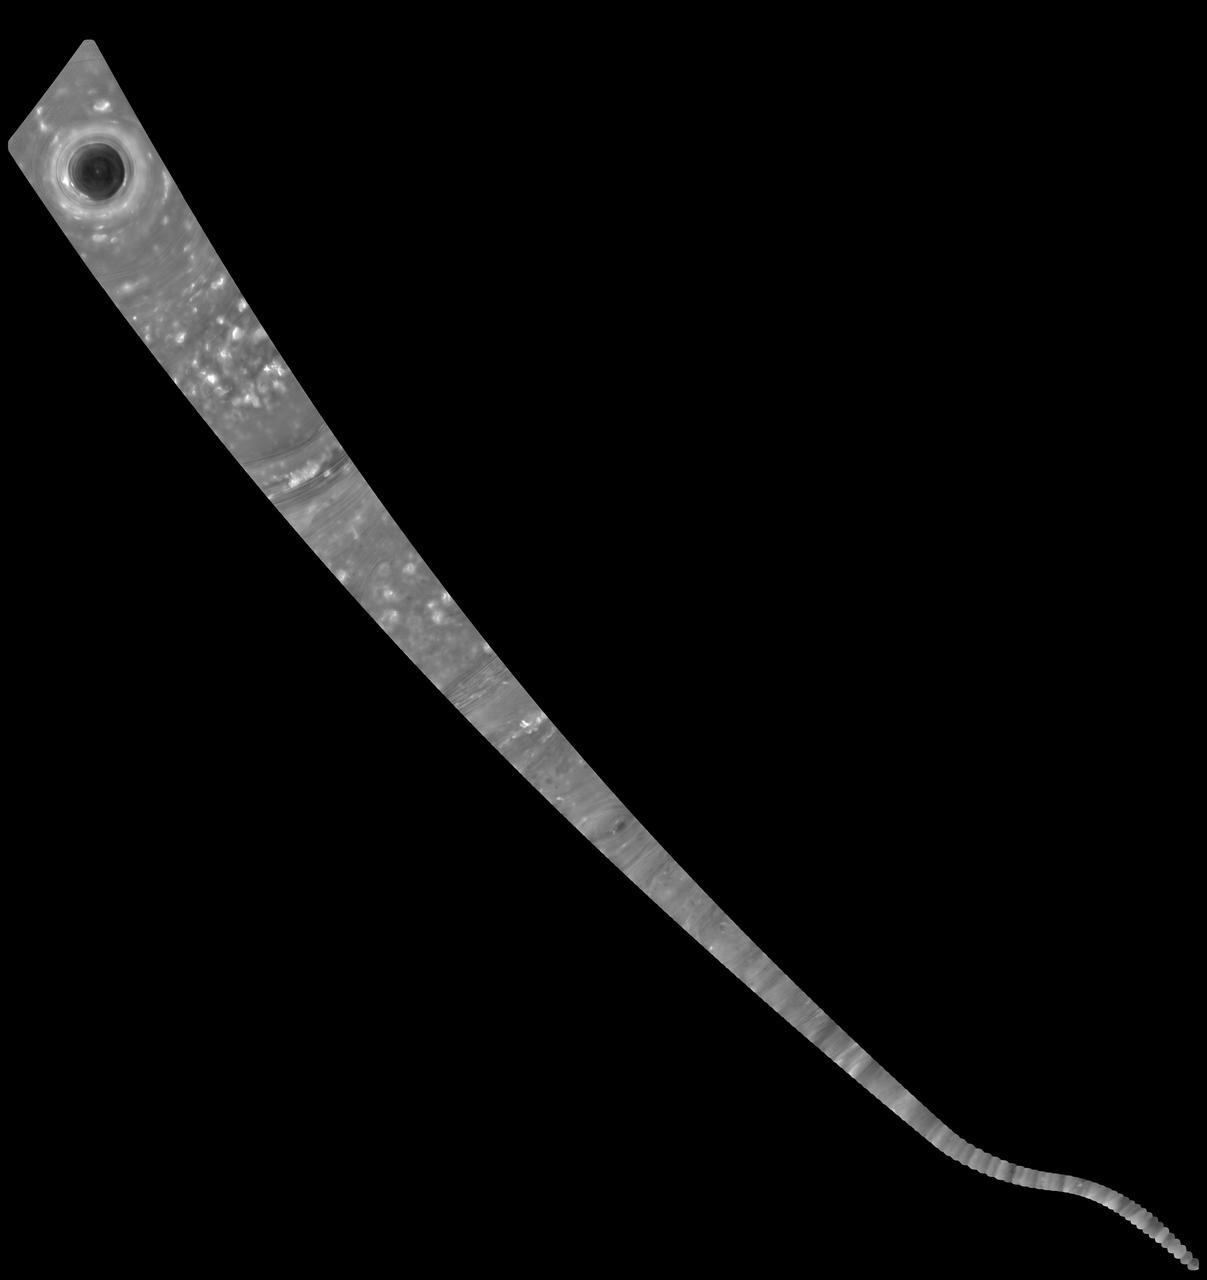
This mosaic of images combines views captured by NASA's Cassini spacecraft as it made the first dive of the mission's Grand Finale on April 26, 2017. It shows a vast swath of Saturn's atmosphere, from the north polar vortex to the boundary of the hexagon-shaped jet stream, to details in bands and swirls at middle latitudes and beyond. The mosaic is a composite of 137 images captured as Cassini made its first dive toward the gap between Saturn and its rings. It is an update to a previously released image product. In the earlier version, the images were presented as individual movie frames, whereas here, they have been combined into a single, continuous mosaic. The mosaic is presented as a still image as well as a video that pans across its length. Imaging scientists referred to this long, narrow mosaic as a "noodle" in planning the image sequence. The first frame of the mosaic is centered on Saturn's north pole, and the last frame is centered on a region at 18 degrees north latitude. During the dive, the spacecraft's altitude above the clouds changed from 45,000 to 3,200 miles (72,400 to 8374 kilometers), while the image scale changed from 5.4 miles (8.7 kilometers) per pixel to 0.6 mile (1 kilometer) per pixel. The bottom of the mosaic (near the end of the movie) has a curved shape. This is where the spacecraft rotated to point its high-gain antenna in the direction of motion as a protective measure before crossing Saturn's ring plane. The images in this sequence were captured in visible light using the Cassini spacecraft wide-angle camera. The original versions of these images, as sent by the spacecraft, have a size of 512 by 512 pixels. The small image size was chosen in order to allow the camera to take images quickly as Cassini sped over Saturn. These images of the planet's curved surface were projected onto a flat plane before being combined into a mosaic. Each image was mapped in stereographic projection centered at 55 degree north latitude. A movie is available at https://photojournal.jpl.nasa.gov/catalog/PIA21617