
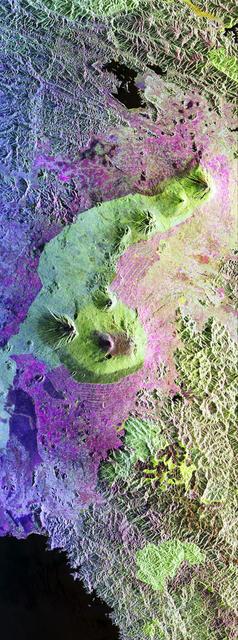
Radar Swath of Oct. 28, 2005, Titan Flyby
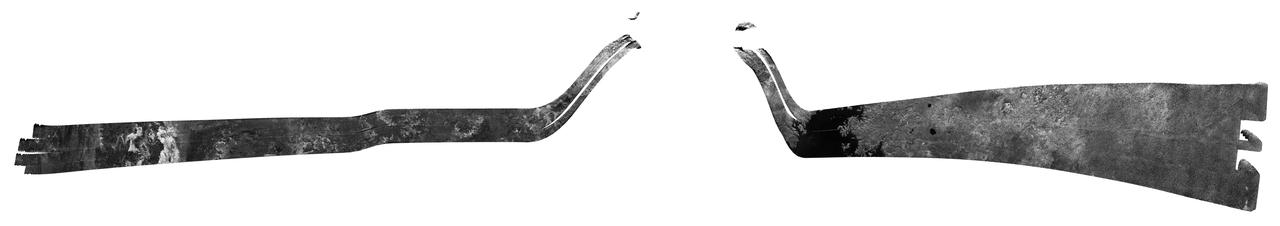
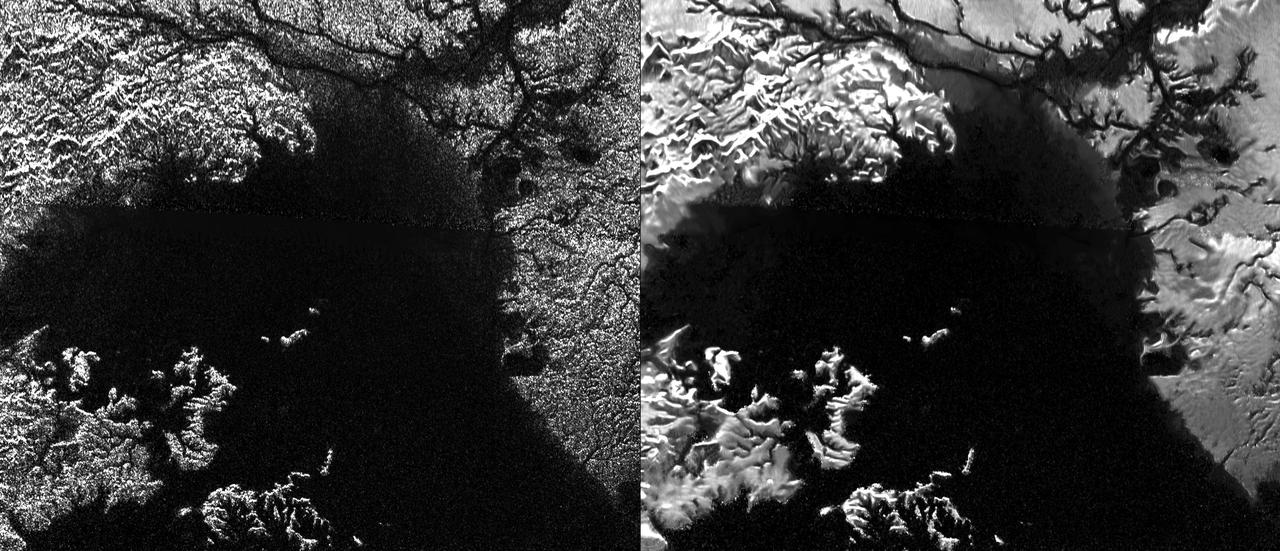
During its final targeted flyby of Titan on April 22, 2017, Cassini's radar mapper got the mission's last close look at the moon's surface. On this 127th targeted pass by Titan (unintuitively named "T-126"), the radar was used to take two images of the surface, shown at left and right. Both images are about 200 miles (300 kilometers) in width, from top to bottom. Objects appear bright when they are tilted toward the spacecraft or have rough surfaces; smooth areas appear dark. At left are the same bright, hilly terrains and darker plains that Cassini imaged during its first radar pass of Titan, in 2004. Scientists do not see obvious evidence of changes in this terrain over the 13 years since the original observation. At right, the radar looked once more for Titan's mysterious "magic island" (PIA20021) in a portion of one of the large hydrocarbon seas, Ligeia Mare. No "island" feature was observed during this pass. Scientists continue to work on what the transient feature might have been, with waves and bubbles being two possibilities. In between the two parts of its imaging observation, the radar instrument switched to altimetry mode, in order to make a first-ever (and last-ever) measurement of the depths of some of the lakes that dot the north polar region. For the measurements, the spacecraft pointed its antenna straight down at the surface and the radar measured the time delay between echoes from the lakes' surface and bottom. A graph is available at https://photojournal.jpl.nasa.gov/catalog/PIA21626
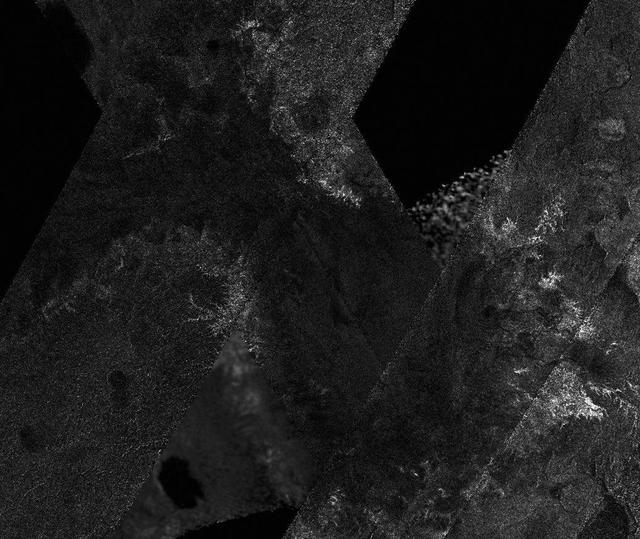
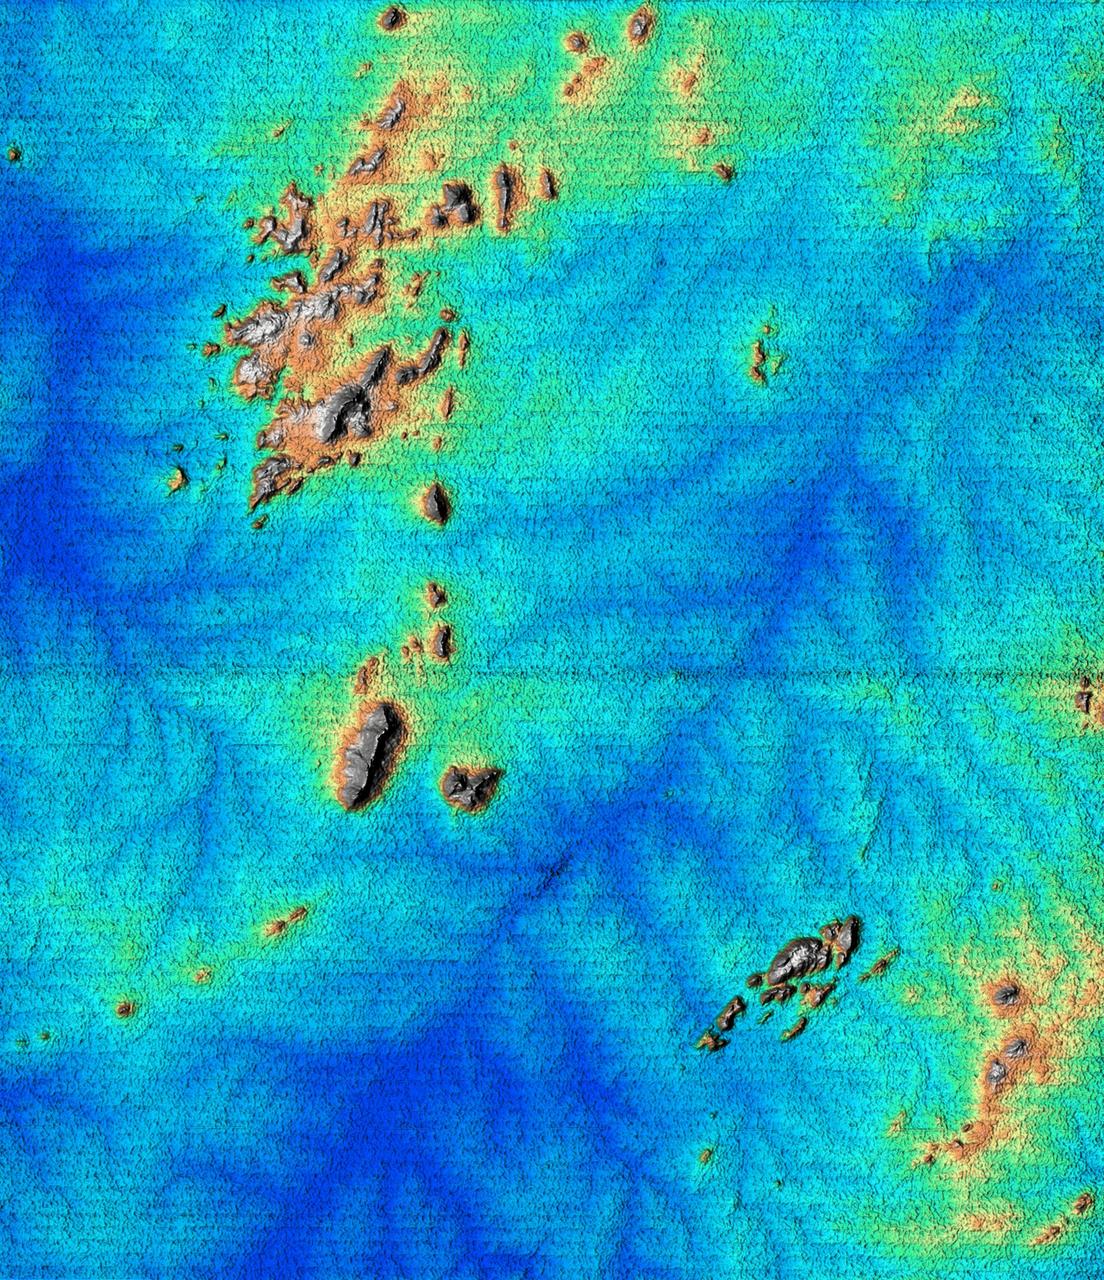
This mosaic of image swaths from Cassini’s Titan Radar Mapper, taken with the synthetic-aperture radar SAR, features a large dark region several hundred kilometers across that differs in several significant ways from potential lakes observed on Titan.
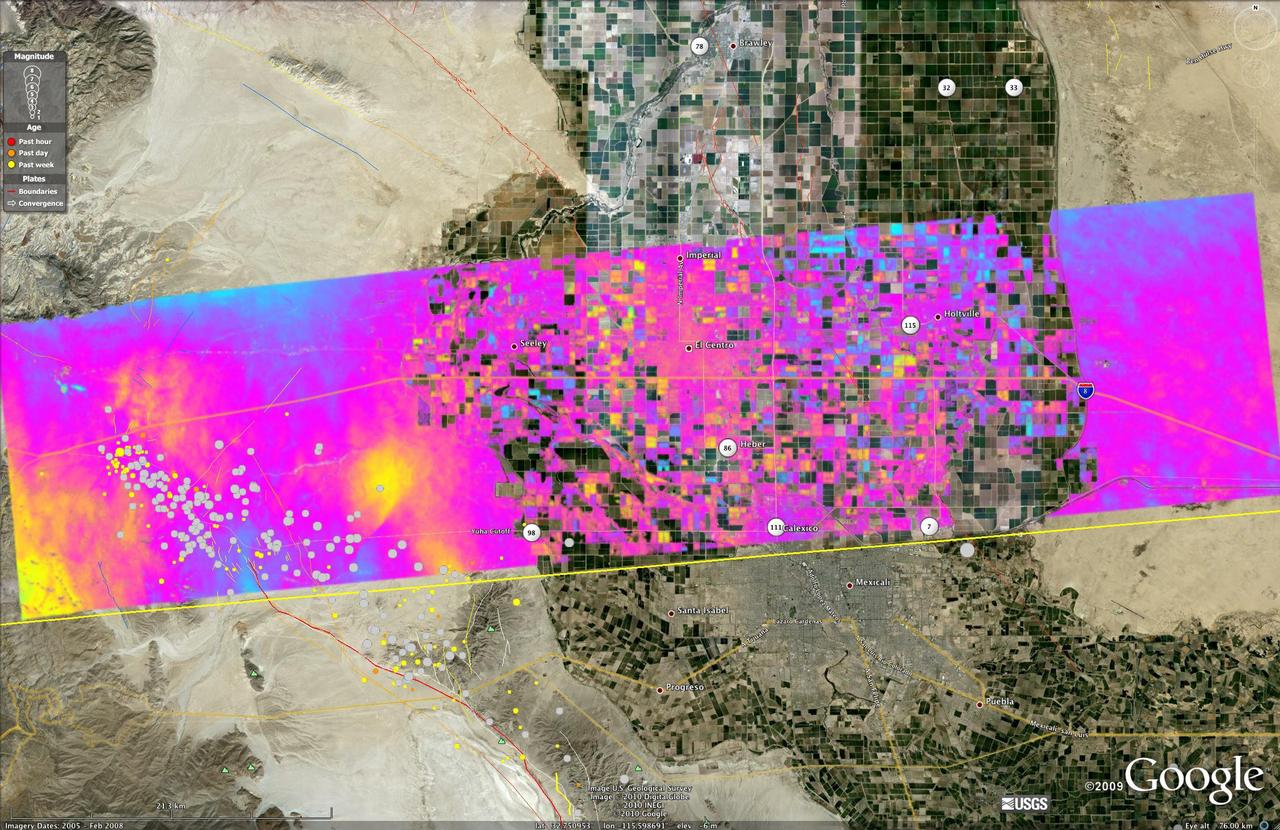
This image shows a UAVSAR interferogram swath overlaid atop a Google Earth image. New NASA airborne radar images show the continuing deformation in Earth surface resulting from the magnitude 7.2 temblor in Baja California on April 4, 2010.
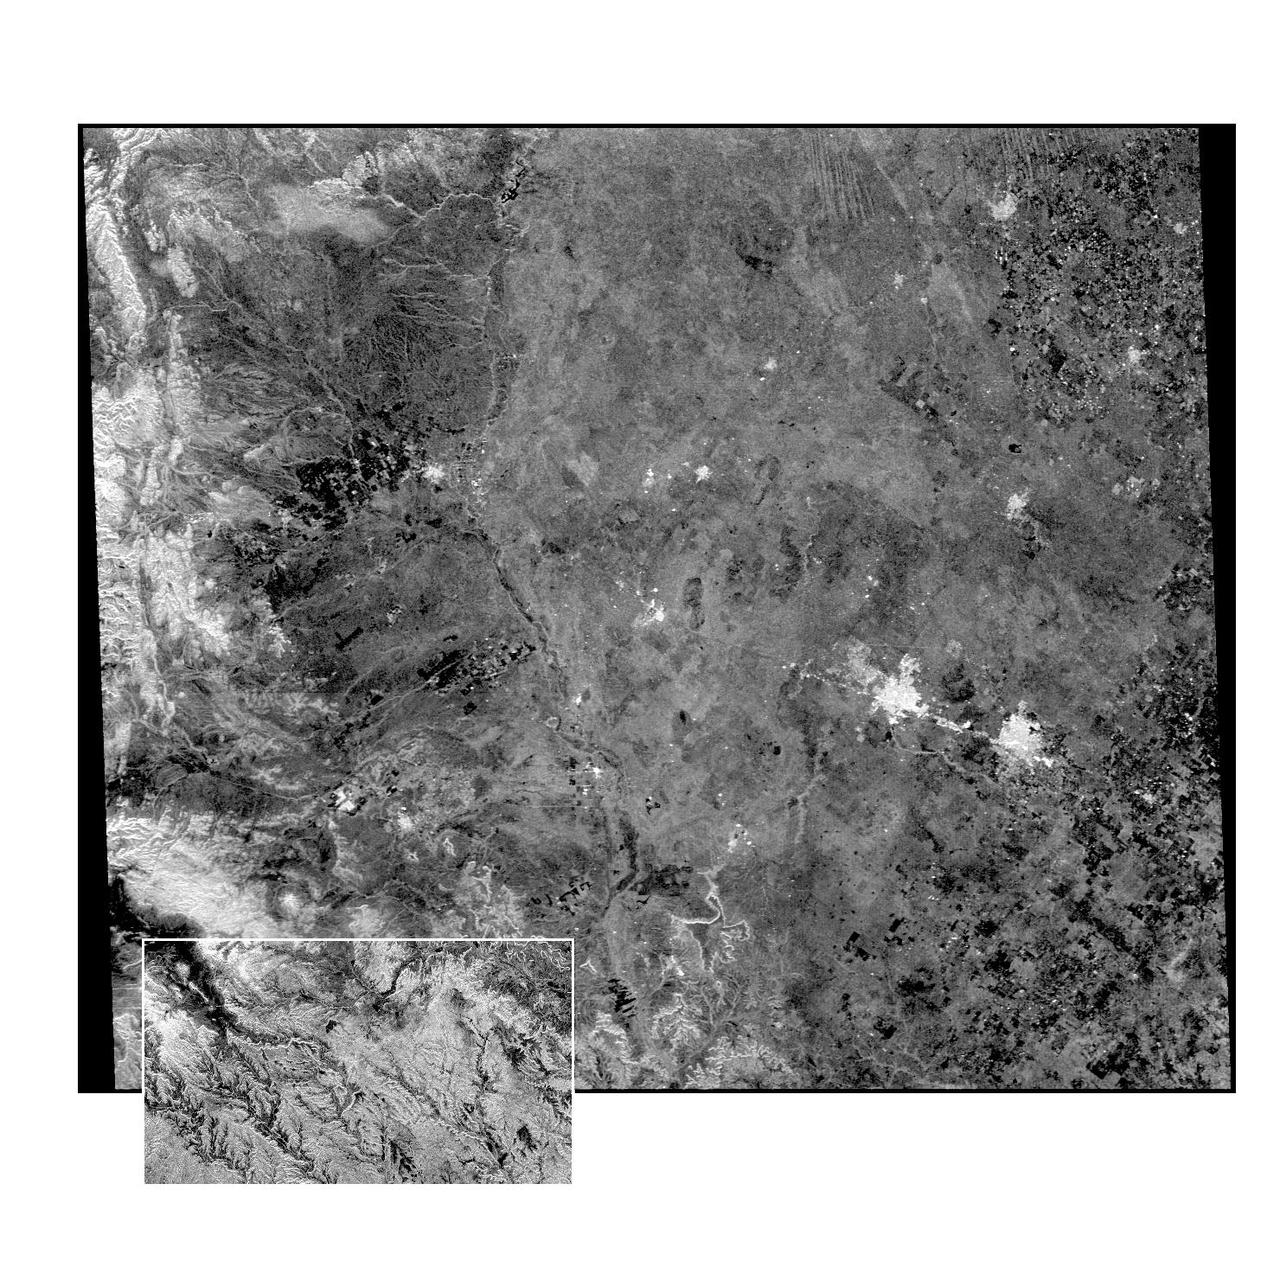
This radar image of the Midland/Odessa region of West Texas, demonstrates an experimental technique, called ScanSAR, that allows scientists to rapidly image large areas of the Earth's surface. The large image covers an area 245 kilometers by 225 kilometers (152 miles by 139 miles). It was obtained by the Spaceborne Imaging Radar-C/X-Band Synthetic Aperture Radar (SIR-C/X-SAR) flying aboard the space shuttle Endeavour on October 5, 1994. The smaller inset image is a standard SIR-C image showing a portion of the same area, 100 kilometers by 57 kilometers (62 miles by 35 miles) and was taken during the first flight of SIR-C on April 14, 1994. The bright spots on the right side of the image are the cities of Odessa (left) and Midland (right), Texas. The Pecos River runs from the top center to the bottom center of the image. Along the left side of the image are, from top to bottom, parts of the Guadalupe, Davis and Santiago Mountains. North is toward the upper right. Unlike conventional radar imaging, in which a radar continuously illuminates a single ground swath as the space shuttle passes over the terrain, a Scansar radar illuminates several adjacent ground swaths almost simultaneously, by "scanning" the radar beam across a large area in a rapid sequence. The adjacent swaths, typically about 50 km (31 miles) wide, are then merged during ground processing to produce a single large scene. Illumination for this L-band scene is from the top of the image. The beams were scanned from the top of the scene to the bottom, as the shuttle flew from left to right. This scene was acquired in about 30 seconds. A normal SIR-C image is acquired in about 13 seconds. The ScanSAR mode will likely be used on future radar sensors to construct regional and possibly global radar images and topographic maps. The ScanSAR processor is being designed for 1996 implementation at NASA's Alaska SAR Facility, located at the University of Alaska Fairbanks, and will produce digital images from the forthcoming Canadian RADARSAT satellite. http://photojournal.jpl.nasa.gov/catalog/PIA01787
Presented here are side-by-side comparisons of a traditional Cassini Synthetic Aperture Radar (SAR) view and one made using a new technique for handling electronic noise that results in clearer views of Titan's surface. The technique, called despeckling, produces images that can be easier for researchers to interpret. The view is a mosaic of SAR swaths over Ligeia Mare, one of the large hydrocarbons seas on Titan. In particular, despeckling improves the visibility of channels flowing down to the sea. http://photojournal.jpl.nasa.gov/catalog/PIA19052
This image was obtained by NASA's Cassini radar instrument during a flyby on Feb. 7, 2009. The radar antenna was pointing toward Titan at an altitude of 960 kilometers 597 miles during the closest approach. The image has been processed with a resolution of 128 pixels/deg. https://photojournal.jpl.nasa.gov/catalog/PIA04394

This image was obtained by NASA Cassini radar instrument during a flyby on Oct. 2, 2007. The radar antenna was pointing toward Titan at an altitude of 965 kilometers 600 miles during the closest approach. The image has been processed with a resolution of 128 pixels/deg. https://photojournal.jpl.nasa.gov/catalog/PIA04390
These images were obtained by NASA's Cassini radar instrument during a flyby on Dec. 21, 2008. The radar antenna was pointing toward Titan at an altitude of 970 kilometers 684 miles during the closest approach. The image has been processed with a resolution of 128 pixels/deg. https://photojournal.jpl.nasa.gov/catalog/PIA04393

This image was obtained by NASA Cassini radar instrument during a flyby on Dec. 12, 2006. North Polar Pass Northern Lakes Region, Aaru. https://photojournal.jpl.nasa.gov/catalog/PIA04308
This image was obtained by NASA's Cassini radar instrument during a flyby on Dec. 28, 2009. The radar antenna was pointing toward Titan at an altitude of 955 kilometers 593 miles during the closest approach. The image has been processed with a resolution of 128 pixels/deg. https://photojournal.jpl.nasa.gov/catalog/PIA06678

This image was obtained by NASA's Cassini radar instrument during a flyby on June 6, 2009. The radar antenna was pointing toward Titan at an altitude of 965 kilometers 599 miles during the closest approach. The radar antenna was pointing toward Titan at a 965 km altitude at the closest approach. The image has been processed with a resolution of 128 pixels/deg. https://photojournal.jpl.nasa.gov/catalog/PIA04396

This image was obtained by NASA's Cassini radar instrument during a flyby on June 22, 2009. The radar antenna was pointing toward Titan at an altitude of 955 kilometers 593 miles during the closest approach. The image has been processed with a resolution of 128 pixels/deg. https://photojournal.jpl.nasa.gov/catalog/PIA04397
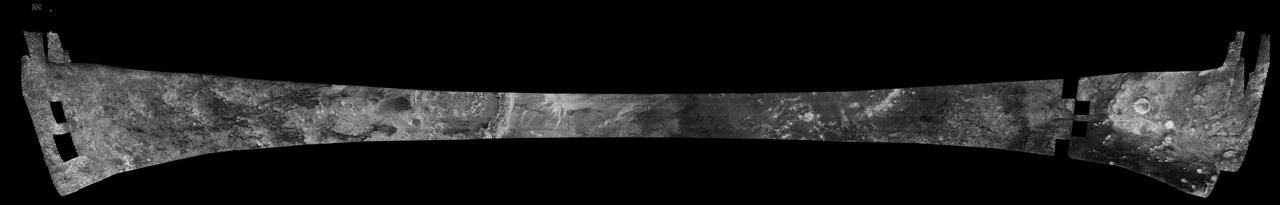
This image was obtained by NASA's Cassini radar instrument during a flyby on Dec. 20, 2007. South Polar Region, Western Mezzoramia. https://photojournal.jpl.nasa.gov/catalog/PIA01854

This image was obtained by NASA Cassini radar instrument during a flyby on April 26, 2007. The radar antenna was pointing toward Titan at an altitude of 980 kilometers 609 miles during the closest approach. The radar antenna was pointing toward Titan at a 980 km altitude at the closest approach. The image has been processed with a resolution of 128 pixels/deg. https://photojournal.jpl.nasa.gov/catalog/PIA04391

This image was obtained by NASA Cassini radar instrument during a flyby on July 7, 2010. Southern mid-latitudes trailing hemisphere, Northern Mezzoramia. https://photojournal.jpl.nasa.gov/catalog/PIA06679
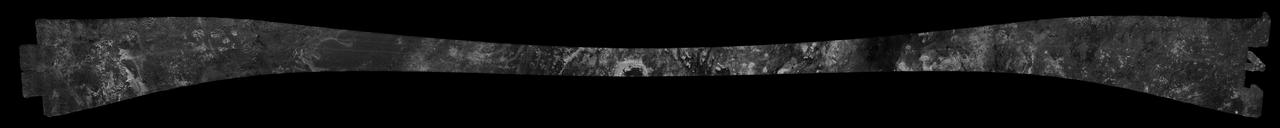
This image was obtained by NASA Cassini radar instrument during a flyby on Sept. 7, 2005. Southern Mid-latitudes Central Tsegihi, Mezzoramia. https://photojournal.jpl.nasa.gov/catalog/PIA01855

This image was obtained by NASA's Cassini radar instrument during a flyby on May 21, 2009. The radar antenna was pointing toward Titan at an altitude of 965 kilometers 599 miles during the closest approach. The radar antenna was pointing toward Titan at a 965 km altitude at the closest approach. https://photojournal.jpl.nasa.gov/catalog/PIA04395
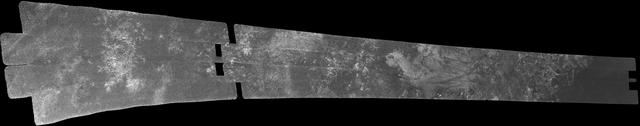
This image was obtained by NASA Cassini radar instrument during a flyby on Jan. 13, 2007. Northern mid-latitudes to equator Ganesa Macula, Aaru, western Senkyo, Tsegihi. https://photojournal.jpl.nasa.gov/catalog/PIA00928
This image was obtained by NASA Cassini radar instrument during a flyby on Feb. 15, 2005. The radar antenna was pointing toward Titan at an altitude of 1,577 kilometers 890 miles during the closest approach. https://photojournal.jpl.nasa.gov/catalog/PIA04389

This image was obtained by NASA Cassini radar instrument during a flyby on Oct. 9, 2006. North Polar Pass Northern Lakes Region, Aaru. https://photojournal.jpl.nasa.gov/catalog/PIA03187
This image was obtained by NASA's Cassini radar instrument during a flyby on July 24, 2009. The radar antenna was pointing toward Titan at an altitude of 955 kilometers 593 miles during the closest approach. he radar antenna was pointing toward Titan at a 955 km altitude at the closest approach. The image has been processed with a resolution of 128 pixels/deg. https://photojournal.jpl.nasa.gov/catalog/PIA04399

This image was obtained by NASA Cassini radar instrument during a flyby on Jan. 12, 2010. High southern latitudes Ontario Lacus, Mezzoramia. https://photojournal.jpl.nasa.gov/catalog/PIA00927
These images were obtained by NASA's Cassini radar instrument during a flyby on Feb. 22, 2008. The radar antenna was pointing toward Titan at an altitude of 1,000 kilometers (621 miles) during the closest approach. https://photojournal.jpl.nasa.gov/catalog/PIA04392
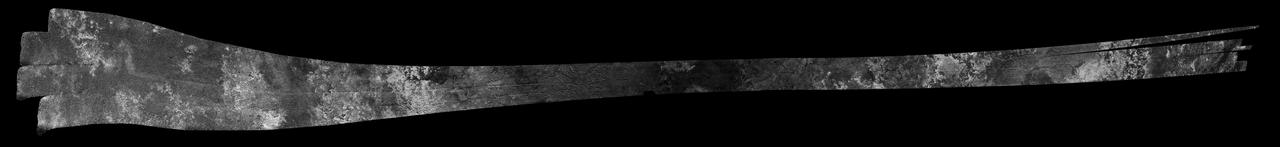
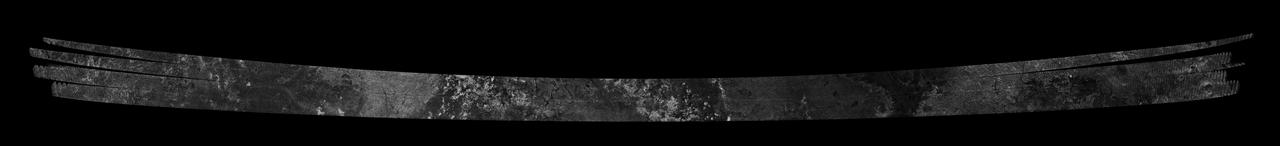
This image was obtained by NASA Cassini radar instrument during a flyby on Oct. 28, 2005. Equatorial Pass Trailing hemisphere, Central Adiri, Central Belet, Huygens Landing Site, Antillia Faculae.

This image was obtained by NASA's Cassini radar instrument during a flyby on Dec. 5, 2008. Equatorial Anti-Saturnian hemisphere Southern half of Guabonito, northern Shikoku Facula, and parts of Shangri-la and Dilmun. https://photojournal.jpl.nasa.gov/catalog/PIA00699
This image was obtained by NASA's Cassini radar instrument during a flyby on Aug. 25, 2009. The radar antenna was pointing toward Titan at an altitude of 970 kilometers 603 miles during the closest approach. The image has been processed with a resolution of 128 pixels/deg. https://photojournal.jpl.nasa.gov/catalog/PIA06677
This is a false-color radar image of Central Africa, showing the Virunga Volcano chain along the borders of Rwanda, Zaire and Uganda. This area is home to the endangered mountain gorillas. This C-band L-band image was acquired on April 12, 1994, on orbit 58 of space shuttle Endeavour by the Spaceborne Imaging Radar-C/X-band Synthetic Aperture Radar (SIR-C/X-SAR). The area is centered at about 1.75 degrees south latitude and 29.5 degrees east longitude. The image covers an area 58 kilometers by 178 kilometers (48 miles by 178 miles). The false-color composite is created by displaying the L-band HH return in red, the L-band HV return in green and the C-band HH return in blue. The dark area in the bottom of the image is Lake Kivu, which forms the border between Zaire (to the left) and Rwanda (to the right). The airport at Goma, Zaire is shown as a dark line just above the lake in the bottom left corner of the image. Volcanic flows from the 1977 eruption of Mt. Nyiragongo are shown just north of the airport. Mt. Nyiragongo is not visible in this image because it is located just to the left of the image swath. Very fluid lava flows from the 1977 eruption killed 70 people. http://photojournal.jpl.nasa.gov/catalog/PIA01724
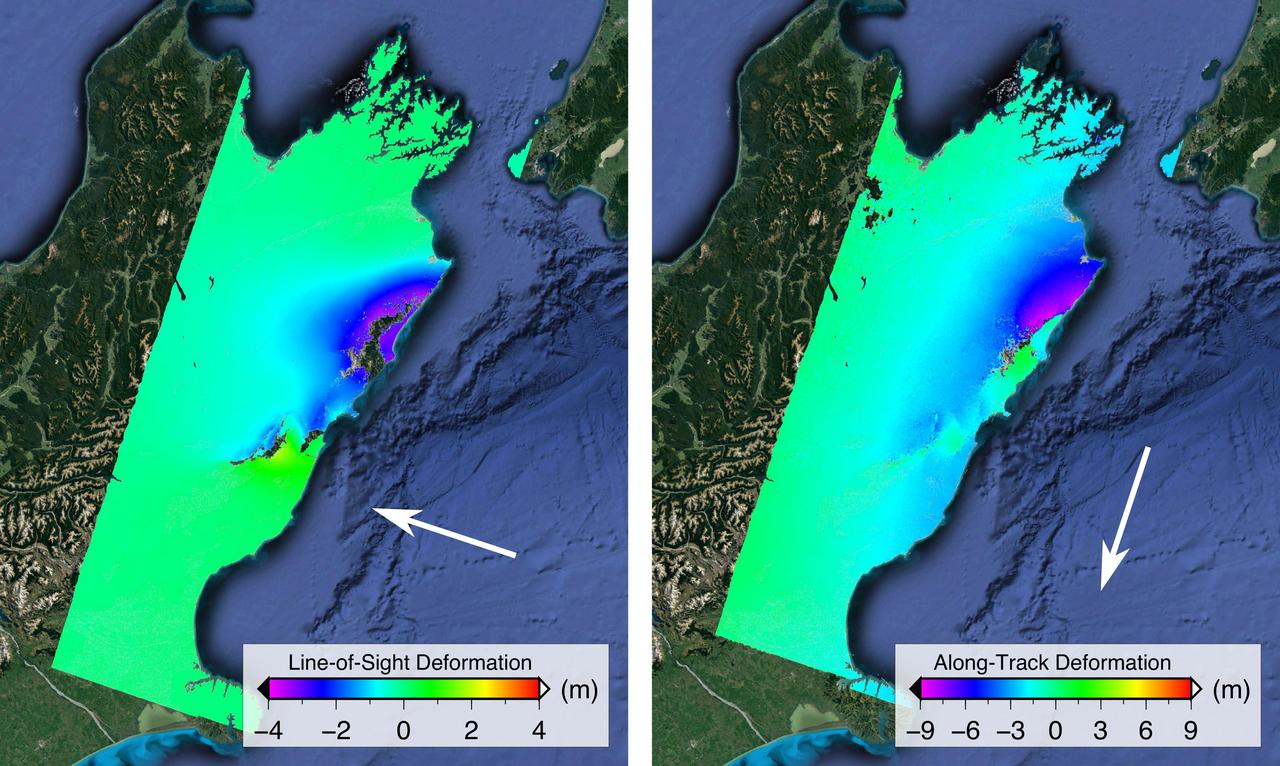
NASA and its partners are contributing important observations and expertise to the ongoing response to the Nov. 14, 2016, magnitude 7.8 Kaikoura earthquake in New Zealand. This shallow earthquake was so complex and unusual, it is likely to change how scientists think about earthquake hazards in plate boundary zones around the world. Scientists with the Advanced Rapid Imaging and Analysis project (ARIA), a collaboration between NASA's Jet Propulsion Laboratory, Pasadena, California, and Caltech in Pasadena, analyzed interferometric synthetic aperture radar images from the PALSAR-2 instrument on the ALOS-2 satellite operated by the Japan Aerospace Exploration Agency (JAXA) to calculate maps of the deformation of Earth's surface caused by the quake. Two maps show motion of the surface in two different directions. Each false-color map shows the amount of permanent surface movement caused almost entirely by the earthquake, as viewed by the satellite, during a 28-day interval between two ALOS-2 wide-swath images acquired on Oct. 18 and Nov. 15, 2016. In these two new maps made from the wide-swath images, the colors of the surface displacements are proportional to the surface motion. The wide-swath images cover the entire 106-mile (170-kilometer) length of the complex set of earthquake ruptures. The arrows show the direction of the radar motion measurement. In the left image, the blue and purple tones show the areas where the land around the Kaikoura peninsula in the Marlborough region of New Zealand's South Island has moved toward the satellite by up to 13.2 feet (4 meters), both eastward and upward. In the right image, the blue and purple tones show the areas that moved to the north by up to 30 feet (9 meters) and green tones show the area that moved to the south. The sharp line of color change is across the Kekerengu Fault, which had the largest amount of motion in the earthquake. Field studies found maximum rupture at the surface was measured at 39 feet (12 meters) of horizontal displacement. Several other faults have sharp color changes due to smaller amounts of motion, with a total of at least 12 faults rupturing in this single large earthquake. Areas without color have snow, heavy vegetation or open water that prevents the radar measurements from being coherent between satellite images – a required condition to measure ground displacement. Scientists use these maps to build detailed models of the fault slip at depth and associated land movements to better understand the impact on future earthquake activity. The PALSAR-2 data were provided by JAXA through the Committee on Earth Observation Satellites (CEOS) and through scientific research projects. The background image is from Google Earth. http://photojournal.jpl.nasa.gov/catalog/PIA21210
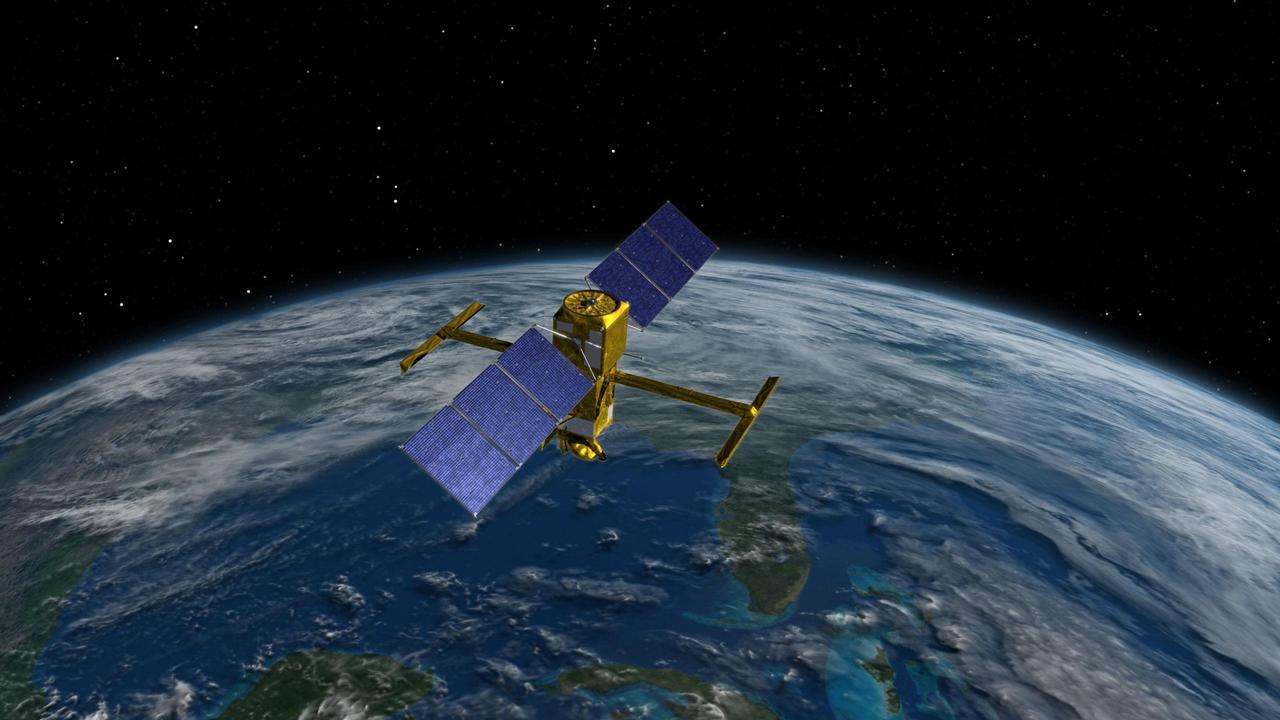
This illustration depicts the Surface Water and Ocean Topography (SWOT) satellite, a mission led by NASA and the French space agency Centre National d'Études Spatiales (CNES). The scientific heart of the SWOT satellite is the Ka-band Radar Interferometer (KaRIn) instrument, which will measure the height of water in Earth's lakes, rivers, reservoirs, and ocean. To do that, KaRIn will transmit radar pulses to Earth's surface and use two antennas – seen to the left and right of the spacecraft bus – to triangulate the return signals that bounce back. Mounted at the ends of a boom 33 feet (10 meters) long, the antennas will collect data over two swaths of Earth's surface at a time, each of them 30 miles (50 kilometers) wide and located on either side of the satellite. KaRIn will operate in two modes: A lower-resolution mode over the ocean will involve significant onboard processing of the data to reduce the volume of information sent during downlinks to Earth; a higher-resolution mode will be used mainly over land. https://photojournal.jpl.nasa.gov/catalog/PIA25621
This illustration depicts the Surface Water and Ocean Topography satellite, a mission led by NASA and the French space agency Centre National d'Études Spatiales (CNES). The scientific heart of the SWOT satellite is the Ka-band Radar Interferometer (KaRIn) instrument, which will measure the height of water in Earth's lakes, rivers, reservoirs, and ocean. To do that, KaRIn will transmit radar pulses to Earth's surface and use two antennas – seen to the left and right of the spacecraft bus – to triangulate the return signals that bounce back. Mounted at the ends of a boom 33 feet (10 meters) long, the antennas will collect data over two swaths of Earth's surface at a time, each of them 30 miles (50 kilometers) wide and located on either side of the satellite. KaRIn will operate in two modes: A lower-resolution mode over the ocean will involve significant onboard processing of the data to reduce the volume of information sent during downlinks to Earth; a higher-resolution mode will be used mainly over land. https://photojournal.jpl.nasa.gov/catalog/PIA24530
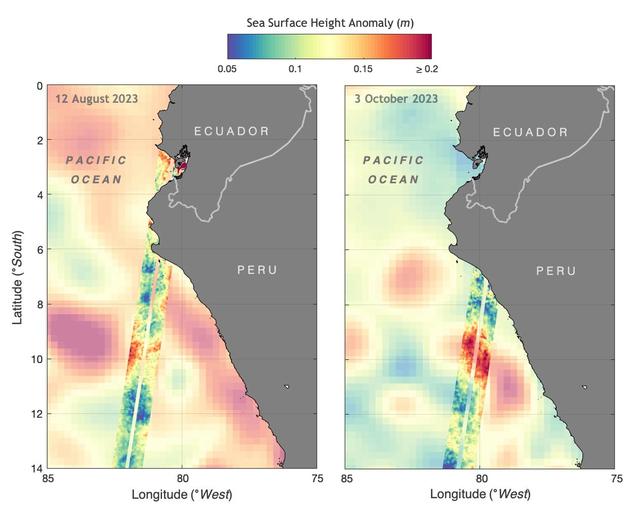
The illustration above shows sea levels off the coasts of Peru and Ecuador on Aug. 12, 2023, and Oct. 3, 2023. The Surface Water and Ocean Topography (SWOT) satellite collected the ocean data during its operational phase, which began in late July. The red and orange colors represent sea levels that are higher than average (units are in meters), while green and blue indicate sea levels that are lower than average. The SWOT data shows some of the development of an El Niño along the west coast of the Americas. The SWOT science team made the measurements using the spacecraft's Ka-band Radar Interferometer (KaRIn) instrument. With two antennas spread 33 feet (10 meters) apart on a boom, KaRIn produces a pair of data swaths (tracks visible in the animation) as it circles the globe, bouncing radar pulses off the water's surface to collect surface-height measurements. Launched on Dec. 16, 2022, from Vandenberg Space Force Base in central California, SWOT is now in its operations phase, measuring the height of nearly all water on Earth's surface. The satellite will provide one of the most detailed, comprehensive views yet of the planet's oceans and fresh water lakes and rivers, collecting data that will be used for research and other purposes. https://photojournal.jpl.nasa.gov/catalog/PIA26181
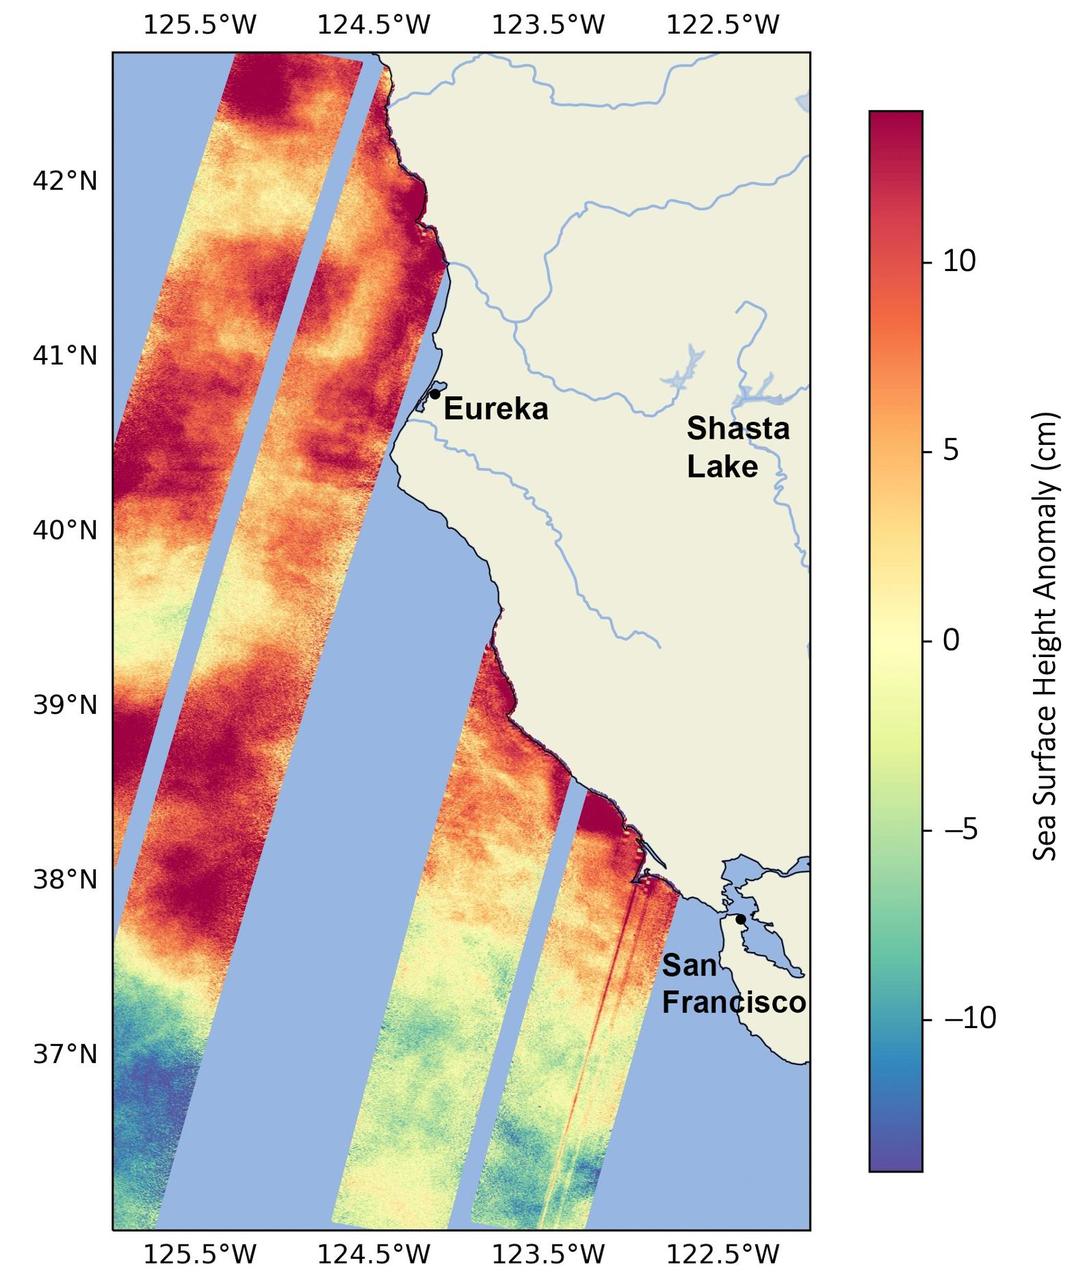
This data visualization image above shows sea surface heights off the northern California coast in August 2023 as measured by the Surface Water and Ocean Topography (SWOT) satellite. Red indicates higher-than-average ocean heights, while blue represents lower-than-average heights. Warm ocean waters from the developing El Niño are shifting north along coastlines in the eastern Pacific Ocean. Along the coast of California, these warm waters are interacting with a persistent marine heat wave that recently influenced the development of Hurricane Hilary. SWOT is able to spot the movement of these warm ocean waters in unprecedented detail. The SWOT science team made the measurements with the Ka-band Radar Interferometer (KaRIn) instrument. With two antennas spread 33 feet (10 meters) apart on a boom, KaRIn produces a pair of data swaths as it circles the globe, bouncing radar pulses off the water's surface to collect water-height measurements. The visualization combines data from two passes of the SWOT satellite. https://photojournal.jpl.nasa.gov/catalog/PIA26091

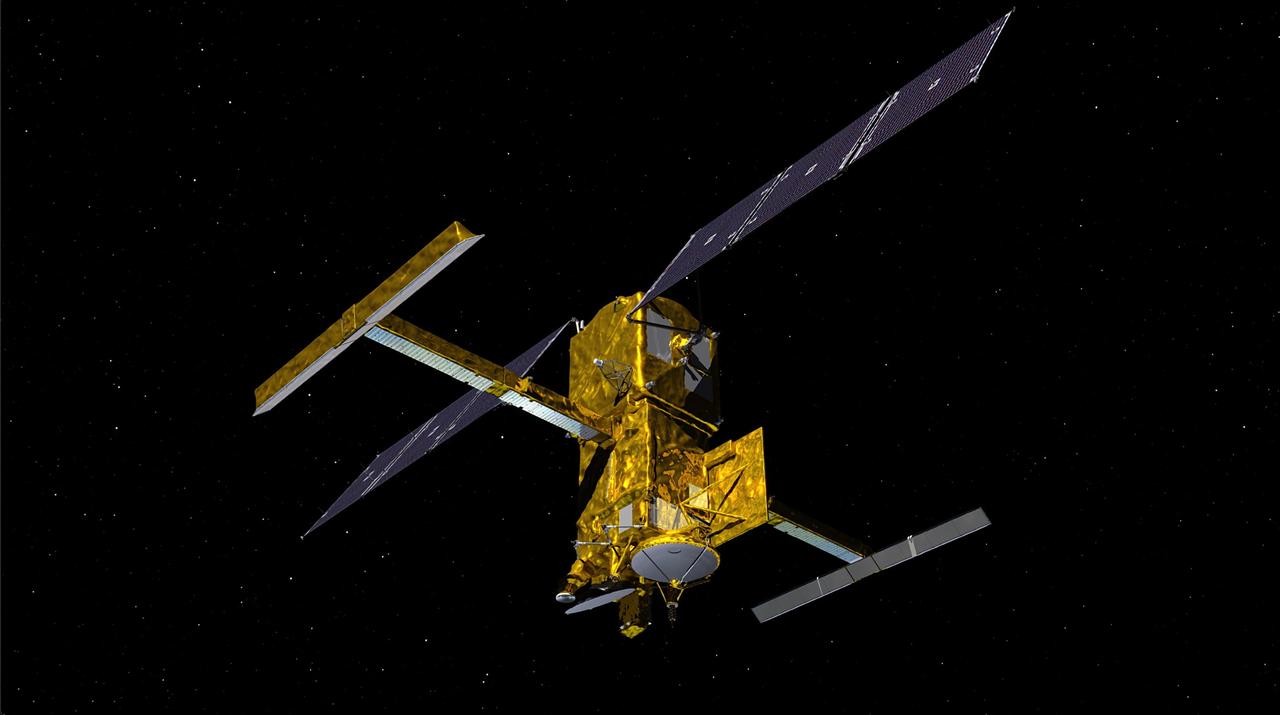
This illustration depicts the Surface Water and Ocean Topography (SWOT) satellite with solar arrays fully deployed. Measuring 48.8 feet (14.9 meters) in length with an area of 335 square feet (31 square meters), the two arrays will remain pointed at the Sun via small motors to provide 8 kilowatts of power; the spacecraft has a 1.5-kilowatt total power demand. The scientific heart of the SWOT satellite is the Ka-band Radar Interferometer (KaRIn) instrument, which will measure the height of water in Earth's lakes, rivers, reservoirs, and ocean. To do that, KaRIn will transmit radar pulses to Earth's surface and use two antennas – seen to the left and right of the spacecraft bus – to triangulate the return signals that bounce back. Mounted at the ends of a boom 33 feet (10 meters) long, the antennas will collect data over two swaths of Earth's surface at a time, each of them 30 miles (50 kilometers) wide and located on either side of the satellite. KaRIn will operate in two modes: A lower-resolution mode over the ocean will involve significant onboard processing of the data to reduce the volume of information sent during downlinks to Earth; a higher-resolution mode will be used mainly over land. https://photojournal.jpl.nasa.gov/catalog/PIA25623
This is an X-band image showing seasonal changes at the hydrological test site of Bebedouro in Brazil. The image is centered at 9 degrees south latitude and 40.2 degrees west longitude. This image was acquired by the Spaceborne Imaging Radar-C and X-band Synthetic Aperture Radar (SIR-C/X-SAR) aboard the space shuttle Endeavour on April 10, 1994, during the first flight of the radar system, and on October 1, 1994, during the second mission. The swath width is approximately 16.5 kilometers (10.5 miles) wide. The image channels have the following color assignments: red represents data acquired on April 10; green represents data acquired on October 1; blue corresponds to the ratio of the two data sets. Agriculture plays an important economic and social role in Brazil. One of the major problems related to Brazilian agriculture is estimating the size of planting areas and their productivity. Due to cloud cover and the rainy season, which occurs from November through April, optical and infrared Earth observations are seldom used to survey the region. An additional goal of monitoring this region is to watch the floodplains of rivers like Rio Sao Francisco in order to determine suitable locations for additional agricultural fields. This area belongs to the semi-arid northeastern region of Brazil, where estimates have suggested that about 10 times more land could be used for agriculture, including some locations which could be used for irrigation projects. Monitoring of soil moisture during the important summer crop season is of high priority for the future development and productivity of this region. In April the area was covered with vegetation because of the moisture of the soil and only small differences could be seen in X-band data. In October the run-off channels of this hilly region stand out quite clearly because the greenish areas indicated much less soil moisture and water content in plants. http://photojournal.jpl.nasa.gov/catalog/PIA01733
The international Surface Water and Ocean Topography (SWOT) satellite is shown in orbit over Earth in this illustration, with sunlight glinting off one of its solar arrays and both antennas of its Ka-band Radar Interferometer (KaRIn) instrument extended. The mission is a collaborative effort between NASA and the French space agency Centre National d'Études Spatiales (CNES) – with contributions from the Canadian Space Agency (CSA) and the UK Space Agency. KaRIn is the scientific heart of the SWOT satellite, which will survey the water on more than 90% of Earth's surface, measuring the height of water in lakes, rivers, reservoirs, and the ocean. To do that, KaRIn will transmit radar pulses to Earth's surface and use its two antennas to triangulate the return signals that bounce back. Mounted at the ends of a boom 33 feet (10 meters) long, the antennas will collect data along a swath 30 miles (50 kilometers) wide on either side of the satellite. KaRIn will operate in two modes: A lower-resolution mode over the ocean will involve significant onboard processing of the data to reduce the volume of information sent during downlinks to Earth; a higher-resolution mode will be used mainly over land. Scheduled to launch from Vandenberg Space Force Base in Central California on Dec. 15, 2022, SWOT is being jointly developed by NASA and CNES, with contributions from the CSA and the UK Space Agency. NASA's Jet Propulsion Laboratory, which is managed for the agency by Caltech in Pasadena, California, leads the U.S. component of the project. For the flight system payload, NASA is providing the Ka-band Radar Interferometer (KaRIn) instrument, a GPS science receiver, a laser retroreflector, a two-beam microwave radiometer, and NASA instrument operations. CNES is providing the Doppler Orbitography and Radioposition Integrated by Satellite (DORIS) system, the dual frequency Poseidon altimeter (developed by Thales Alenia Space), the KaRIn radio-frequency subsystem (together with Thales Alenia Space and with support from the UK Space Agency), the satellite platform, and ground control segment. CSA is providing the KaRIn high-power transmitter assembly. NASA is providing the launch vehicle and associated launch services. https://photojournal.jpl.nasa.gov/catalog/PIA25595

Members of the international Surface Water and Ocean Topography (SWOT) mission test one of the antennas for the Ka-band Radar Interferometer (KaRIn) instrument in a clean room at NASA's Jet Propulsion Laboratory in Southern California. The mission is a collaborative effort between NASA and the French space agency Centre National d'Études Spatiales (CNES) – with contributions from the Canadian Space Agency (CSA) and the UK Space Agency. KaRIn is the scientific heart of the SWOT satellite, which will survey the water on more than 90% of Earth's surface, measuring the height of water in lakes, rivers, reservoirs, and the ocean. To do that, KaRIn will transmit radar pulses to Earth's surface and use its two antennas to triangulate the return signals that bounce back. Mounted at the ends of a boom 33 feet (10 meters) long, the antennas will collect data along a swath 30 miles (50 kilometers) wide on either side of the satellite. KaRIn will operate in two modes: A lower-resolution mode over the ocean will involve significant onboard processing of the data to reduce the volume of information sent during downlinks to Earth; a higher-resolution mode will be used mainly over land. Scheduled to launch from Vandenberg Space Force Base in Central California on Dec. 15, 2022, SWOT is being jointly developed by NASA and CNES, with contributions from the CSA and the UK Space Agency. NASA's Jet Propulsion Laboratory, which is managed for the agency by Caltech in Pasadena, California, leads the U.S. component of the project. For the flight system payload, NASA is providing the Ka-band Radar Interferometer (KaRIn) instrument, a GPS science receiver, a laser retroreflector, a two-beam microwave radiometer, and NASA instrument operations. CNES is providing the Doppler Orbitography and Radioposition Integrated by Satellite (DORIS) system, the dual frequency Poseidon altimeter (developed by Thales Alenia Space), the KaRIn radio-frequency subsystem (together with Thales Alenia Space and with support from the UK Space Agency), the satellite platform, and ground control segment. CSA is providing the KaRIn high-power transmitter assembly. NASA is providing the launch vehicle and associated launch services. https://photojournal.jpl.nasa.gov/catalog/PIA25594
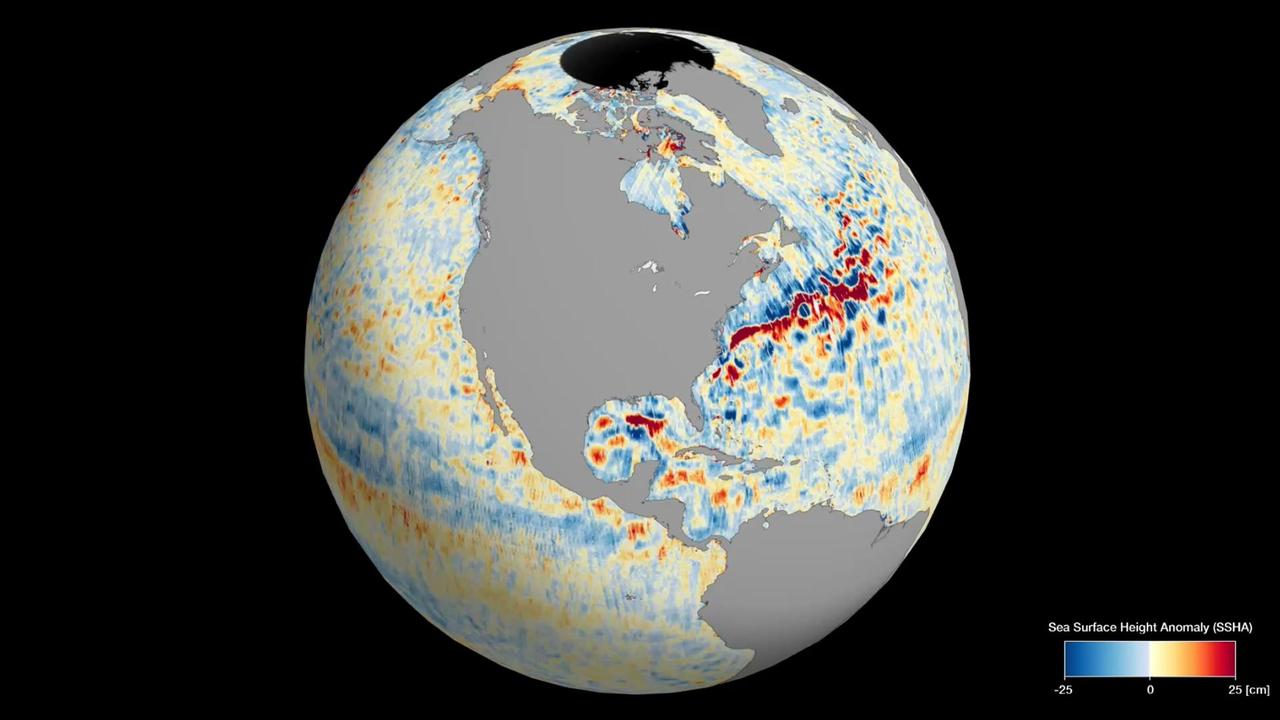
This animation shows global sea level data collected by the Surface Water and Ocean Topography (SWOT) satellite during its first 21-day science orbit, which it completed from July 26 to Aug. 16, 2023. Red and orange indicate ocean heights that were higher than the global mean sea surface height, while blue represents lower-than-the mean. Sea level differences can highlight ocean currents, like the Gulf Stream coming off the U.S. East Coast or the Kuroshio current off the east coast of Japan. Increased sea surface heights can also indicate regions of relatively warmer water – like the eastern part of the equatorial Pacific Ocean during an El Niño – because water expands as it warms. The SWOT science team made the measurements using the spacecraft's Ka-band Radar Interferometer (KaRIn) instrument. With two antennas spread 33 feet (10 meters) apart on a boom, KaRIn produces a pair of data swaths (tracks visible in the animation) as it circles the globe, bouncing radar pulses off the water's surface to collect surface-height measurements. Launched on Dec. 16, 2022, from Vandenberg Space Force Base in central California, SWOT is now in its operations phase, measuring the height of nearly all water on Earth's surface. The satellite will provide one of the most detailed, comprehensive views yet of the planet's oceans and fresh water lakes and rivers, collecting data that will be used for research and other purposes. Animation available at https://photojournal.jpl.nasa.gov/catalog/PIA26100
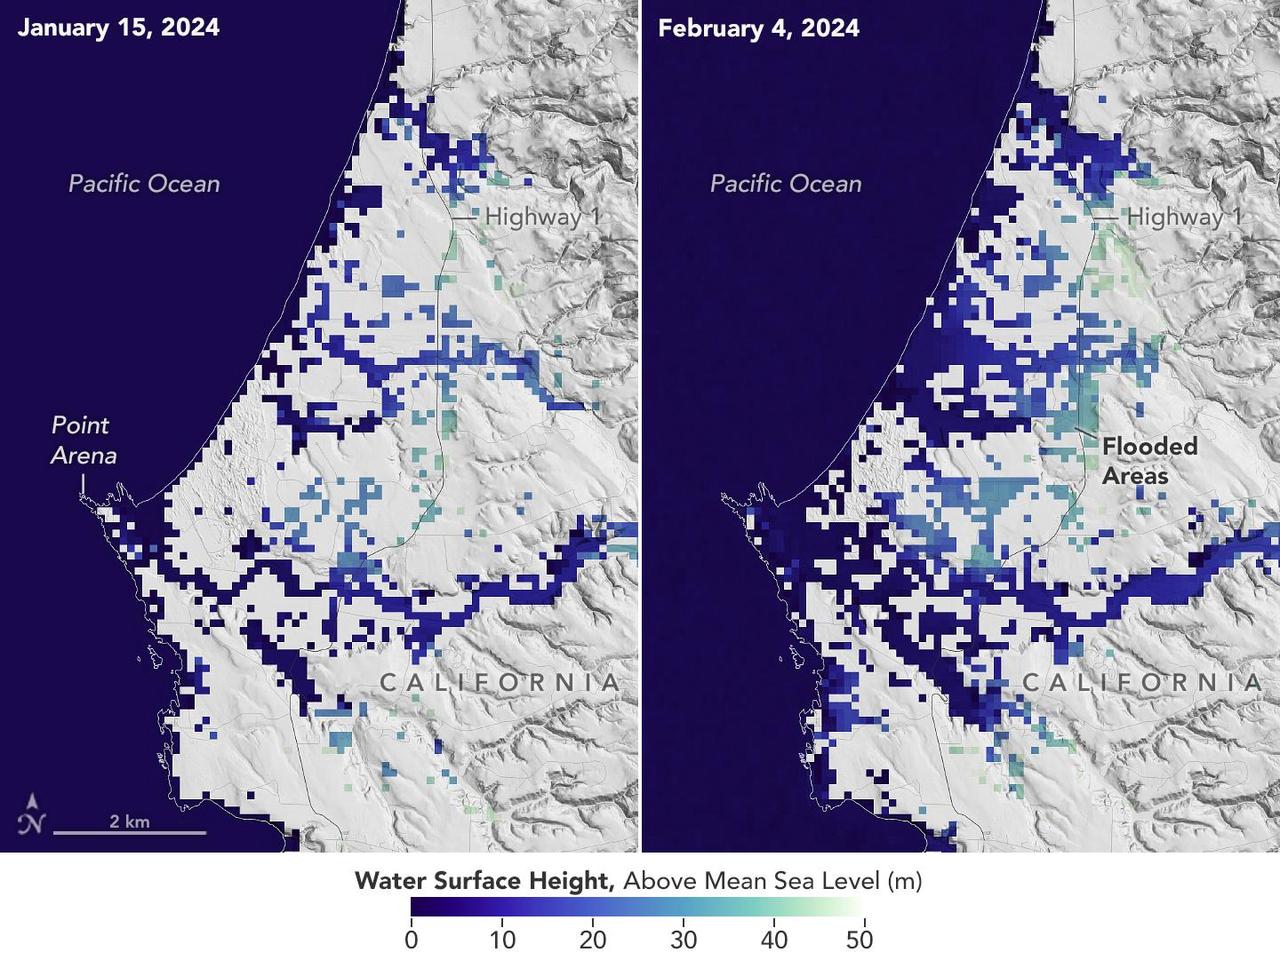
A series of atmospheric rivers drenched California in February 2024, with record amounts of rainfall and hurricane-force winds sweeping across parts of the state. The Surface Water and Ocean Topography (SWOT) mission captured data on coastal flooding near the community of Manchester, roughly 105 miles (169 kilometers) north of San Francisco. The satellite is a collaboration between NASA and the French space agency, CNES (Centre National d'Études Spatiales). The image shows the area on Jan. 15, 2024, before the rain and snow from atmospheric rivers hit California, and then again on Feb. 4, 2024, after the first in a series of storms soaked the state. Water heights are shown in shades of green and blue, with lighter hues indicating the highest levels relative to mean sea level. (Data for inland areas includes the height of the floodwaters plus the ground elevation beneath it.) Each pixel in the image represents an area that is 330 feet by 330 feet (100 meters by 100 meters). Since December 2022, SWOT has been measuring the height of nearly all water on Earth's surface, developing one of the most detailed, comprehensive views yet of the planet's oceans and freshwater lakes and rivers. Not only can the satellite detect the extent of the water on Earth's surface, as other satellites can, but SWOT can also provide water level data. The mission science team made the measurements using the Ka-band Radar Interferometer (KaRIn) instrument. With two antennas spread 33 feet (10 meters) apart on a boom, KaRIn produces a pair of data swaths as it circles the globe, bouncing radar pulses off water surfaces to collect surface-height measurements. Launched from Vandenberg Space Force Base in central California, SWOT is now in its operations phase, collecting data that will be used for research and other purposes. https://photojournal.jpl.nasa.gov/catalog/PIA26182
This video animation shows antennas for the Ka-band Radar Interferometer (KaRIn) instrument deploying on the Surface Water and Ocean Topography (SWOT) satellite. KaRIn is the scientific heart of the spacecraft, which launched into Earth orbit on Friday, Dec. 16, 2022, from Vandenberg Space Force Base in central California. SWOT will measure the height of water on over 90% of Earth's surface, providing a high-definition survey of our planet's water for the first time. But before it can do that, engineers need to deploy the satellite's solar panel arrays, which power the spacecraft, and unfold the large mast and antenna panels for the KaRIn instrument. The mast and antenna deployment is a four-day process. Thirty-three feet (10 meters) apart, at either end of the mast, the two antennas are designed to capture precise measurements of the height of water in Earth's freshwater bodies and the ocean. KaRIn will see eddies, currents, and other ocean features less than 13 miles (20 kilometers) across, and it will collect data on lakes and reservoirs larger than 15 acres (62,500 square meters) and rivers wider than 330 feet (100 meters) across. KaRIn will do this by bouncing radar pulses off the surface of the water and receiving the return signals with both of those antennas, collecting data along a swath on the surface that's 30 miles (50 kilometers) wide on either side of the satellite. The data SWOT provides will help researchers and decision-makers address some of the most pressing climate questions of our time and help communities prepare for a warming world. Animation available at https://photojournal.jpl.nasa.gov/catalog/PIA25596

An oil slick in the Gulf of Mexico following Hurricane Ida – a high-end Category 4 when it made landfall near Port Fourchon, Louisiana, on Aug. 29, 2021 – appears as a green trail in the inset false-color graphic provided by NASA's Delta-X project, while the surrounding seawater appears orange. The National Oceanic and Atmospheric Administration (NOAA) regularly monitors U.S. coastal waters for potential spills and noticed slicks that appeared just off the coast after the hurricane. They were able to use this information from Delta-X to corroborate other data they had about oil slicks in the area (satellite image in the second inset picture). The blue-green swath crossing from the Gulf of Mexico over the Louisiana coast denotes the flight path of the Delta-X radar instrument on Sept. 1, just before 11:30 a.m. CDT. Charged with studying the Mississippi River Delta, Delta-X was gearing up to collect data on Louisiana's coastal wetlands when Hurricane Ida barreled ashore in late August. The storm damaged buildings and infrastructure alike, resulting in power outages, flooding, and oil slicks in the Gulf of Mexico. Oil tends to smooth out the bumps on the ocean's surface, which results in a distinct radar signal that the Delta-X mission was able to pick out of their data. Delta-X added flight paths to their planned schedule – with the support of NASA's Applied Science Disaster Program – in order to collect information over the gulf in areas of interest to NOAA. Delta-X is studying two wetlands – the Atchafalaya and Terrebonne Basins – by land, boat, and air to quantify water and sediment flow as well as vegetation growth. While the Atchafalaya Basin has been gaining land through sediment accumulation, Terrebonne Basin, which is right next to the Atchafalaya, has been rapidly losing land. The data collected by the project will be applied to models used to forecast which areas of the delta are likely to gain or lose land under various sea level rise, river flow, and watershed management scenarios. The mission uses several instruments to collect its data. Affixed to the bottom of a Gulfstream-III airplane, one of those instruments, the all-weather Uninhabited Aerial Vehicle Synthetic Aperture Radar (UAVSAR), bounces radar signals off of Earth's surface, forming a kind of image of a particular area. Repeated images of the same regions, captured at different times, enable researchers to detect changes in those areas, such as fluctuating water levels beneath the vegetation as the tides move in and out of these wetlands. In addition to radar measurements, teams from Caltech, Louisiana State University, Florida International University, and other collaborating institutions gather water and vegetation samples – among other data – by boat, other airborne sensors, and from instruments on the ground. Funded by NASA's Earth Venture Suborbital (EVS-3) program, Delta-X is managed by the agency's Jet Propulsion Laboratory. Caltech in Pasadena, California, manages JPL for NASA. Fall 2021 was Delta-X's last scheduled field campaign, although the five-year mission will run through the end of 2023. https://photojournal.jpl.nasa.gov/catalog/PIA24540
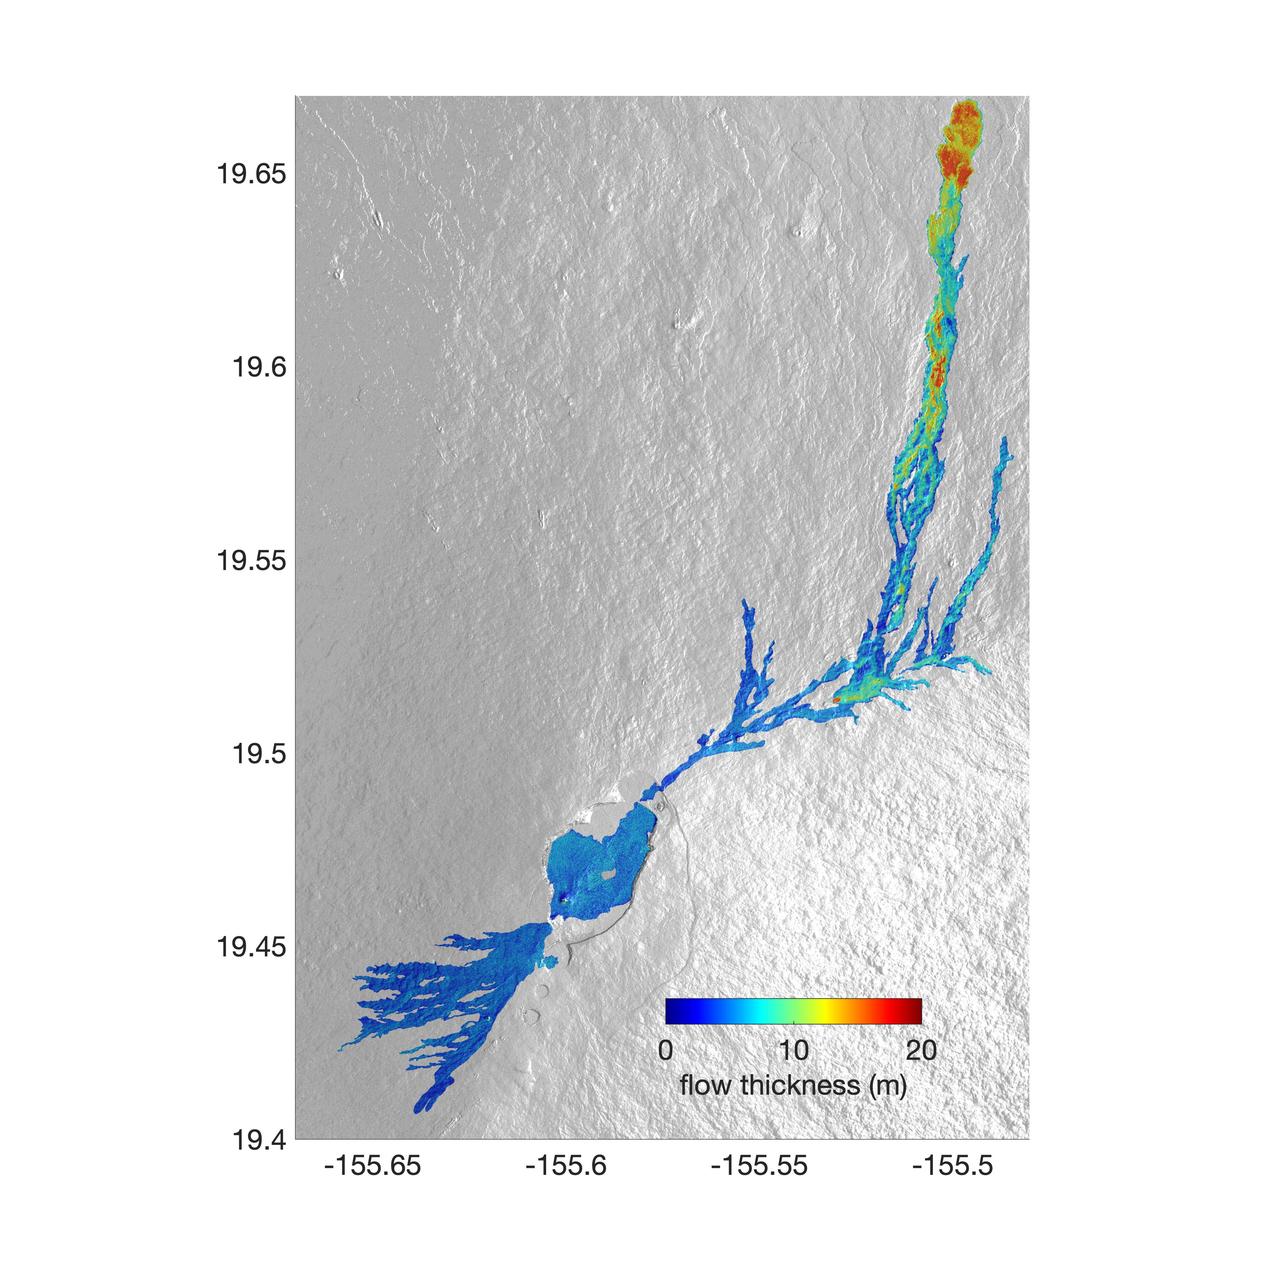
The world's largest active volcano – Hawaii's Mauna Loa – had been quiet for 38 years. But in 2022, the volcano began to stir, showing increased numbers of small earthquakes and subtle swelling of certain land surfaces in September. On November 27, fountains of lava began spurting from the mountain's Northeast Rift Zone and streams of molten rock flowed to the north. Ten days into the eruption, a NASA aircraft conducted its first flight over the erupting volcano. It carried NASA's Uninhabited Aerial Vehicle Synthetic Aperture Radar (UAVSAR) system, which was used to map the volcano's topography in fine detail with a Ka-band instrument called GLISTIN-A. Teams from NASA's Jet Propulsion Laboratory and the United States Geological Survey (USGS) used data from that sensor to map the thickness of those flows during a series of flights on December 7, 8, and 10. The map above shows the thickness of the lava flows during the flight on December 7, the day before USGS scientists noticed a significant decline in the pace of the eruption. A few days later, they declared the eruption had stopped. The map shows the thickness of the lava flows in the summit caldera, where the eruption began, and of lava flows on Mauna Loa's northeastern flank. The color variation from blue to orange indicates increasing lava flow thickness. A maximum thickness of roughly 25 meters (82 feet) is shown, though values exceeding 40 meters (131 feet) were observed in some areas. The thickening at the northern end of the flow is due to lava accumulating away from the vent, along with a flattening of the terrain at the saddle between the Mauna Loa and Mauna Kea volcanoes. By comparing to pre-eruption maps of this area's topography, including GLISTIN-A data collected in 2017, the USGS researchers were able to calculate the size and volume of the lava flow. Over the roughly 14-day eruption, Mauna Loa erupted more than 8.8 billion cubic feet (230 million cubic meters) along a lava flow that extended up to 16.5 miles (19.5 kilometers) from the vent, according to the USGS. The UAVSAR operates from a pod mounted beneath a crewed Gulfstream III jet from NASA's Armstrong Flight Research Center in California. Repeated topographic maps generated with each flight reveal the progression and thickening of lava with time – important information for scientific understanding of volcano processes and for emergency response. For the Mauna Loa science flights, the instrument suite featured an additional state-of-the-art imaging tool: the synthetic aperture radar-fusion optical short-wave infrared (SAR-Fusion Optical/SWIR) camera system. SAR-Fusion collects data over the same ground swath as GLISTIN-A to map land surface changes using optical/SWIR photogrammetry methods. GLISTIN-A was designed to provide all-weather, high-resolution surface topography not available through existing lidar or radar sensors. GLISTIN-A was originally demonstrated as a new radar technique for mapping ice surfaces. Science demonstration flights began in 2013 over alpine glaciers and sea ice in Alaska, and a floodplain in California. Its applications have since expanded to other areas, such as snow accumulation and volcano dynamics. The first time the instrument was deployed for volcano response was in 2018 during the three-month eruption of Kilauea. The success of that operation paved the way for deployment to Mauna Loa. https://photojournal.jpl.nasa.gov/catalog/PIA25526
This topographic image acquired by SRTM shows an area south of the Sao Francisco River in Brazil. The scrub forest terrain shows relief of about 400 meters (1300 feet). Areas such as these are difficult to map by traditional methods because of frequent cloud cover and local inaccessibility. This region has little topographic relief, but even subtle changes in topography have far-reaching effects on regional ecosystems. The image covers an area of 57 km x 79 km and represents one quarter of the 225 km SRTM swath. Colors range from dark blue at water level to white and brown at hill tops. The terrain features that are clearly visible in this image include tributaries of the Sao Francisco, the dark-blue branch-like features visible from top right to bottom left, and on the left edge of the image, and hills rising up from the valley floor. The San Francisco River is a major source of water for irrigation and hydroelectric power. Mapping such regions will allow scientists to better understand the relationships between flooding cycles, forestation and human influences on ecosystems. This shaded relief image was generated using topographic data from the Shuttle Radar Topography Mission. A computer-generated artificial light source illuminates the elevation data to produce a pattern of light and shadows. Slopes facing the light appear bright, while those facing away are shaded. On flatter surfaces, the pattern of light and shadows can reveal subtle features in the terrain. Shaded relief maps are commonly used in applications such as geologic mapping and land use planning. http://photojournal.jpl.nasa.gov/catalog/PIA02700
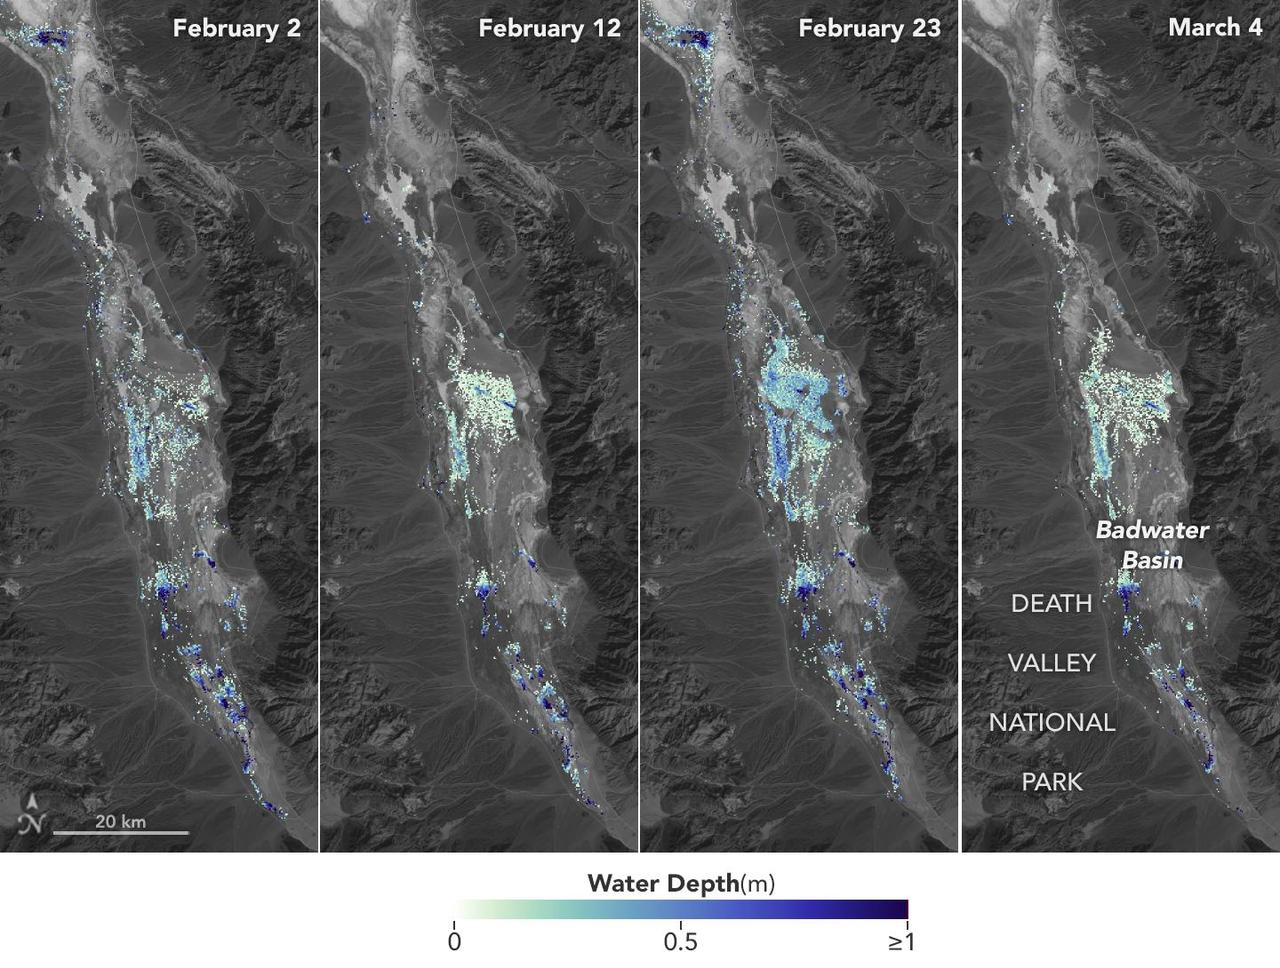
California's Death Valley, the driest place in North America, has hosted an ephemeral lake since late 2023. In March 2024, a NASA-led analysis calculated water depths in the temporary lake over several weeks in February and March 2024, demonstrating the possibilities of the latest water-observing mission, the U.S.-French Surface Water and Ocean Topography (SWOT) satellite. The analysis found that water depths in the lake ranged between about 3 feet (1 meter) to less than 1.5 feet (0.5 meters) over the course of several weeks. This period included a series of storms that swept across California, bringing record amounts of rainfall. To estimate the depth of the lake, known informally as Lake Manly, researchers used water level data collected by SWOT and subtracted corresponding U.S. Geological Survey land elevation information for Badwater Basin. The researchers found that the water levels varied across space and time in the roughly 10-day period between SWOT observations. In the visualization above, water depths of about 3 feet (1 meter) appear dark blue; those of less than 1.5 feet (0.5 meters) appear light yellow. Right after a series of storms in early February, the temporary lake was about 6 miles (10 kilometers) long and 3 miles (5 kilometers) wide. Each pixel in the image represents an area that is about 330 feet by 330 feet (100 meters by 100 meters). Unlike many lakes around the world, Death Valley's lake is temporary, relatively shallow, and strong winds are enough to move the freshwater body a couple of miles, as happened from Feb. 29 to March 2. Since there isn't typically water in Badwater Basin, researchers don't have permanent instruments in place for studying water in this area. SWOT can fill the data gap for when places like this, and others around the world, become inundated. Since shortly after launch in December 2022, SWOT has been measuring the height of nearly all water on Earth's surface, developing one of the most detailed and comprehensive views of the planet's oceans and freshwater lakes and rivers. Not only can the satellite detect the extent of water, as other satellites can, but SWOT can also measure water surface levels. Combined with other types of information, SWOT measurements can yield water depth data for inland features like lakes and rivers. The SWOT science team makes its measurements using the Ka-band Radar Interferometer (KaRIn) instrument. With two antennas spread 33 feet (10 meters) apart on a boom, KaRIn produces a pair of data swaths as it circles the globe, bouncing radar pulses off water surfaces to collect surface-height information. Launched from Vandenberg Space Force Base in central California, SWOT is now in its operations phase, collecting data that will be used for research and other purposes. Animation available at https://photojournal.jpl.nasa.gov/catalog/PIA26184
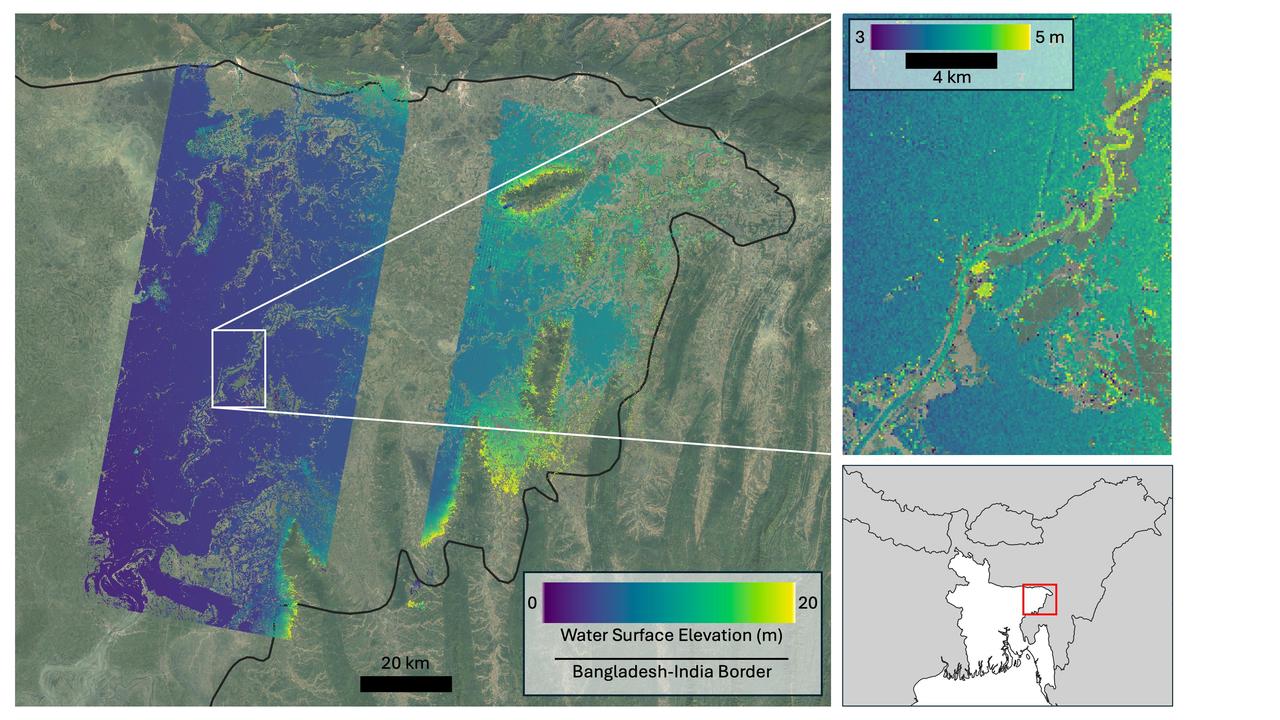
Flooding from monsoon rains covers a wide region of northeast Bangladesh near the India border in this Oct. 8, 2023, image showing data from the U.S.-French Surface Water and Ocean Topography (SWOT) satellite. Around that time, heavy monsoon rains affected various parts of Bangladesh, including the region depicted here, home to Sylhet, the country's fifth-largest city (population approximately 700,000). Sylhet and surrounding areas experienced substantial flooding. The SWOT data, overlaid on a standard Google Earth image, shows the precise surface elevation of the floodwaters. The vast majority of the land area within the region imaged by SWOT is flooded. In the main image at left, dark blue indicates waters just above sea level, while yellow represents 65 feet (20 meters) above sea level. The inset at top right zooms in on a section of the Kalni River, a tributary of one of Bangladesh's three major rivers, the Meghna. The main channel of the Kalni is about 650 feet (200 meters) wide. In the inset at top right, dark blue indicates water about 10 feet (3 meters) above sea level and yellow is used for waters about 16 feet (5 meters) above sea level. The zoomed-in data can be used to determine the slope of the river, which tells hydrologists how fast water flows through it and off a landscape. The water surface elevations depicted are higher in the top right of the inset than they are in the bottom left. The data also shows the elevation of the river is generally greater than that of water in the floodplain around it, telling hydrologists that water is likely flowing from the river into the floodplain. Each pixel in the image represents an area that is about 330 feet by 330 feet (100 meters by 100 meters). The image shows data from SWOT's Ka-band Radar Interferometer (KaRIn) instrument antennas, which don't cover a 12-mile-wide (20-kilometer-wide) strip right underneath the satellite. For that gap, a separate instrument collects water surface elevation data that isn't shown here. Bangladesh is a low-lying, generally flat country that chronically suffers from two types of flooding. Monsoon rains cause rivers that flow into Bangladesh from neighboring countries, especially India, to flood. And flash flooding occurs during the pre-monsoon season and can damage agricultural crops if not forecast with sufficient warning. While the use of satellite altimetry and precipitation in models has shown some promise for flood forecasting in Bangladesh, forecasting both types of flooding with sufficient lead time has remained challenging due to a lack of timely, high-spatial-resolution information on water elevation. SWOT is the first satellite to provide this information over entire regions, enabling improved forecasts and filling the data gap when places like Bangladesh become inundated. The Bangladesh Water Development Board, which is in charge of national flood forecasting and management, is now exploring how to incorporate SWOT water elevation information into its flood inundation forecasting system. Since shortly after launch in December 2022, SWOT has been measuring the height of nearly all water on Earth's surface, developing one of the most detailed, comprehensive views yet of the planet's oceans and freshwater lakes and rivers. The mission science team makes measurements using the KaRIn instrument. With two antennas spread 33 feet (10 meters) apart on a boom, KaRIn produces a pair of data swaths as it circles the globe, bouncing radar pulses off water surfaces to collect surface-height information. https://photojournal.jpl.nasa.gov/catalog/PIA26343
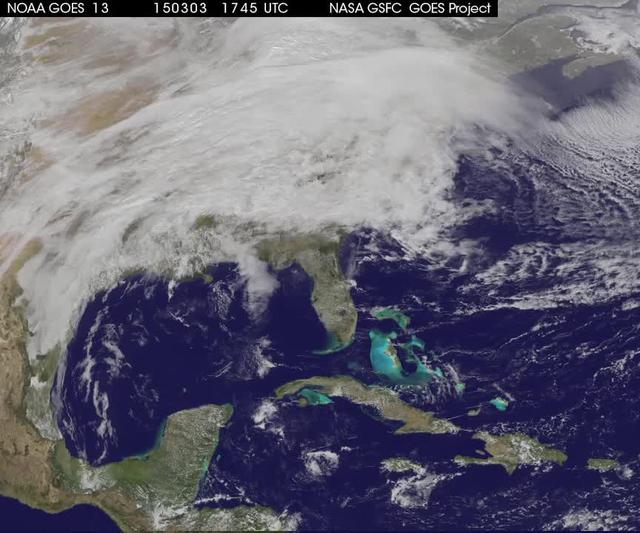
A winter storm was bringing snow, sleet and freezing rain from lower Mississippi Valley to Northeastern U.S. on Thursday, March 5, 2015. A new NASA animation of NOAA's GOES-East satellite imagery showed the progression of the clouds associated with the storm system that triggered winter storm warnings and winter weather advisories from the southern Plains eastward through the Mid-Atlantic and southern New England coast. The system also triggered flood warnings along and to the west of the central Appalachians. An animation of GOES satellite visible and infrared imagery from March 3 through March 5 showed clouds associated with a cold front push over U.S. East coast. Behind the front, Arctic air is expected to drop low temperatures into the single numbers from Washington, D.C. to Minnesota overnight. Temperatures in the Carolinas and Tennessee are expected to drop to the low 20s. NOAA's National Weather Service Weather Prediction Center (NWS NPC) in College Park, Maryland noted "a strong cold front moving across the eastern U.S. will bring heavy snow from parts of the Ohio Valley to the Northeast today (March 5) with rain, freezing rain and sleet possible from parts of the lower Mississippi Valley across the Southeast to the southern Mid-Atlantic. Snowfall totals of 5 to 10 inches are possible for some areas. Winter Storm Warnings remain in effect from Texas to Nantucket." The animation ends at 17:45 UTC (12:45 p.m. EST). Before the end of the animation, the low pressure center along an arctic frontal boundary was nearly stationary over western North Carolina at 9 a.m. EST on March 5, according to the NWS NPC. NWS radar and surface observations indicated an extended swath of precipitation from near the Texas Gulf Coast through the interior eastern U.S. into southern New England. NPC's storm summary noted at that time "rain was changing to sleet/freezing rain and to all snow along a band within this swath as colder air continues to filter in from the north. Some areas in Tennessee, the northern mid-Atlantic and southern New England were reporting moderate to heavy snow." To create the video and imagery, NASA/NOAA's GOES Project takes the cloud data from NOAA's GOES-East satellite and overlays it on a true-color image of land and ocean created by data from the Moderate Resolution Imaging Spectroradiometer, or MODIS, instrument that flies aboard NASA's Aqua and Terra satellites. Together, those data created the entire picture of the storm and show its movement. After the storm system passes, the snow on the ground becomes visible. GOES satellites provide the kind of continuous monitoring necessary for intensive data analysis. Geostationary describes an orbit in which a satellite is always in the same position with respect to the rotating Earth. This allows GOES to hover continuously over one position on Earth's surface, appearing stationary. For updated information about the storm system, visit NOAA's NWS website: <a href="http://www.weather.gov" rel="nofollow">www.weather.gov</a> For more information about GOES satellites, visit: <a href="http://www.goes.noaa.gov/" rel="nofollow">www.goes.noaa.gov/</a> or goes.gsfc.nasa.gov/ Rob Gutro NASA's Goddard Space Flight Center <b><a href="http://www.nasa.gov/audience/formedia/features/MP_Photo_Guidelines.html" rel="nofollow">NASA image use policy.</a></b> <b><a href="http://www.nasa.gov/centers/goddard/home/index.html" rel="nofollow">NASA Goddard Space Flight Center</a></b> enables NASA’s mission through four scientific endeavors: Earth Science, Heliophysics, Solar System Exploration, and Astrophysics. Goddard plays a leading role in NASA’s accomplishments by contributing compelling scientific knowledge to advance the Agency’s mission. <b>Follow us on <a href="http://twitter.com/NASAGoddardPix" rel="nofollow">Twitter</a></b> <b>Like us on <a href="http://www.facebook.com/pages/Greenbelt-MD/NASA-Goddard/395013845897?ref=tsd" rel="nofollow">Facebook</a></b> <b>Find us on <a href="http://instagrid.me/nasagoddard/?vm=grid" rel="nofollow">Instagram</a></b>
![The monster winter storm that brought icing to the U.S. southeast moved northward along the Eastern Seaboard and brought snow, sleet and rain from the Mid-Atlantic to New England on February 13. A new image from NOAA's GOES satellite showed clouds associated with the massive winter storm stretch from the U.S. southeast to the northeast. Data from NOAA's GOES-East satellite taken on Feb. 13 at 1455 UTC/9:45 a.m. EST were made into an image by NASA/NOAA's GOES Project at NASA's Goddard Space Flight Center in Greenbelt, Md. The clouds and fallen snow data from NOAA's GOES-East satellite were overlaid on a true-color image of land and ocean created by data from the Moderate Resolution Imaging Spectroradiometer or MODIS instrument that flies aboard NASA's Aqua and Terra satellites.The image showed that the clouds associated with the storm were blanketing much of the U.S. East Coast. At 3:11 a.m. EST, a surface map issued by the National Weather Service or NWS showed the storm's low pressure area was centered over eastern North Carolina. Since then, the low has continued to track north along the eastern seaboard. By 11 a.m. EST, precipitation from the storm was falling from South Carolina to Maine, according to National Weather Service radar. By 11 a.m. EST, the Washington, D.C. region snow and sleet totals ranged from 3" in far eastern Maryland to over 18" in the northern and western suburbs in Maryland and Virginia. NWS reported that snow, sleet and rain were still falling and more snow is expected as the back side of the low moves into the region. The New York City region remained under an NWS Winter Storm Warning until 6 a.m. on Friday, February 14 and the National Weather Service expects minor coastal impacts Thursday into Friday afternoon. New England was also being battered by the storm. At 10:56 a.m. EST, Barnstable, Mass. on Cape Cod was experiencing rain and winds gusting to 28 mph. An NWS wind advisory is in effect for Cape Cod until 7 p.m. EST. Further north, Portland, Maine was experiencing heavy snow with winds from the northeast at 6 mph. The National Weather Service in Gray, Maine noted "Significant snowfall is likely for much of western Maine and New Hampshire as this storm passes by. There will be a mix or changeover to sleet and freezing rain over southern and coastal sections tonight...before all areas end as a period of snow Friday (Feb. 14) morning." On February 13 at 10 a.m. EST, NOAA's National Weather Service noted "An abundance of Atlantic moisture getting wrapped into the storm will continue to fuel widespread precipitation...which should lift through the Mid-Atlantic States and Northeast Thursday into Friday. A wide swath of heavy snow accumulations are expected with this storm...but air [moving] off the warmer ocean water should change snow over to rain along the coastal areas. Also...a narrow axis of sleet and freezing rain will be possible within the transition zone...which is expected to set up near the I-95 corridor." For updates on local forecasts, watches and warnings, visit NOAA's <a href="http://www.weather.gov" rel="nofollow">www.weather.gov</a> webpage. GOES satellites provide the kind of continuous monitoring necessary for intensive data analysis. Geostationary describes an orbit in which a satellite is always in the same position with respect to the rotating Earth. This allows GOES to hover continuously over one position on Earth's surface, appearing stationary. As a result, GOES provide a constant vigil for the atmospheric "triggers" for severe weather conditions such as tornadoes, flash floods, hail storms and hurricanes. For updated information about the storm system, visit NOAA's WPC website: <a href="http://www.hpc.ncep.noaa.gov/" rel="nofollow">www.hpc.ncep.noaa.gov/</a> For more information about GOES satellites, visit: <a href="http://www.goes.noaa.gov/" rel="nofollow">www.goes.noaa.gov/</a> or <a href="http://goes.gsfc.nasa.gov/" rel="nofollow">goes.gsfc.nasa.gov/</a> Credit: NASA/GSFC/Jeff Schmaltz/MODIS Land Rapid Response Team <b><a href="http://www.nasa.gov/audience/formedia/features/MP_Photo_Guidelines.html" rel="nofollow">NASA image use policy.</a></b> <b><a href="http://www.nasa.gov/centers/goddard/home/index.html" rel="nofollow">NASA Goddard Space Flight Center</a></b> enables NASA’s mission through four scientific endeavors: Earth Science, Heliophysics, Solar System Exploration, and Astrophysics. Goddard plays a leading role in NASA’s accomplishments by contributing compelling scientific knowledge to advance the Agency’s mission. <b>Follow us on <a href="http://twitter.com/NASAGoddardPix" rel="nofollow">Twitter</a></b> <b>Like us on <a href="http://www.facebook.com/pages/Greenbelt-MD/NASA-Goddard/395013845897?ref=tsd" rel="nofollow">Facebook</a></b> <b>Find us on <a href="http://instagram.com/nasagoddard?vm=grid" rel="nofollow">Instagram</a></b>](https://images-assets.nasa.gov/image/GSFC_20171208_Archive_e001229/GSFC_20171208_Archive_e001229~medium.jpg)
The monster winter storm that brought icing to the U.S. southeast moved northward along the Eastern Seaboard and brought snow, sleet and rain from the Mid-Atlantic to New England on February 13. A new image from NOAA's GOES satellite showed clouds associated with the massive winter storm stretch from the U.S. southeast to the northeast. Data from NOAA's GOES-East satellite taken on Feb. 13 at 1455 UTC/9:45 a.m. EST were made into an image by NASA/NOAA's GOES Project at NASA's Goddard Space Flight Center in Greenbelt, Md. The clouds and fallen snow data from NOAA's GOES-East satellite were overlaid on a true-color image of land and ocean created by data from the Moderate Resolution Imaging Spectroradiometer or MODIS instrument that flies aboard NASA's Aqua and Terra satellites.The image showed that the clouds associated with the storm were blanketing much of the U.S. East Coast. At 3:11 a.m. EST, a surface map issued by the National Weather Service or NWS showed the storm's low pressure area was centered over eastern North Carolina. Since then, the low has continued to track north along the eastern seaboard. By 11 a.m. EST, precipitation from the storm was falling from South Carolina to Maine, according to National Weather Service radar. By 11 a.m. EST, the Washington, D.C. region snow and sleet totals ranged from 3" in far eastern Maryland to over 18" in the northern and western suburbs in Maryland and Virginia. NWS reported that snow, sleet and rain were still falling and more snow is expected as the back side of the low moves into the region. The New York City region remained under an NWS Winter Storm Warning until 6 a.m. on Friday, February 14 and the National Weather Service expects minor coastal impacts Thursday into Friday afternoon. New England was also being battered by the storm. At 10:56 a.m. EST, Barnstable, Mass. on Cape Cod was experiencing rain and winds gusting to 28 mph. An NWS wind advisory is in effect for Cape Cod until 7 p.m. EST. Further north, Portland, Maine was experiencing heavy snow with winds from the northeast at 6 mph. The National Weather Service in Gray, Maine noted "Significant snowfall is likely for much of western Maine and New Hampshire as this storm passes by. There will be a mix or changeover to sleet and freezing rain over southern and coastal sections tonight...before all areas end as a period of snow Friday (Feb. 14) morning." On February 13 at 10 a.m. EST, NOAA's National Weather Service noted "An abundance of Atlantic moisture getting wrapped into the storm will continue to fuel widespread precipitation...which should lift through the Mid-Atlantic States and Northeast Thursday into Friday. A wide swath of heavy snow accumulations are expected with this storm...but air [moving] off the warmer ocean water should change snow over to rain along the coastal areas. Also...a narrow axis of sleet and freezing rain will be possible within the transition zone...which is expected to set up near the I-95 corridor." For updates on local forecasts, watches and warnings, visit NOAA's <a href="http://www.weather.gov" rel="nofollow">www.weather.gov</a> webpage. GOES satellites provide the kind of continuous monitoring necessary for intensive data analysis. Geostationary describes an orbit in which a satellite is always in the same position with respect to the rotating Earth. This allows GOES to hover continuously over one position on Earth's surface, appearing stationary. As a result, GOES provide a constant vigil for the atmospheric "triggers" for severe weather conditions such as tornadoes, flash floods, hail storms and hurricanes. For updated information about the storm system, visit NOAA's WPC website: <a href="http://www.hpc.ncep.noaa.gov/" rel="nofollow">www.hpc.ncep.noaa.gov/</a> For more information about GOES satellites, visit: <a href="http://www.goes.noaa.gov/" rel="nofollow">www.goes.noaa.gov/</a> or <a href="http://goes.gsfc.nasa.gov/" rel="nofollow">goes.gsfc.nasa.gov/</a> Credit: NASA/GSFC/Jeff Schmaltz/MODIS Land Rapid Response Team <b><a href="http://www.nasa.gov/audience/formedia/features/MP_Photo_Guidelines.html" rel="nofollow">NASA image use policy.</a></b> <b><a href="http://www.nasa.gov/centers/goddard/home/index.html" rel="nofollow">NASA Goddard Space Flight Center</a></b> enables NASA’s mission through four scientific endeavors: Earth Science, Heliophysics, Solar System Exploration, and Astrophysics. Goddard plays a leading role in NASA’s accomplishments by contributing compelling scientific knowledge to advance the Agency’s mission. <b>Follow us on <a href="http://twitter.com/NASAGoddardPix" rel="nofollow">Twitter</a></b> <b>Like us on <a href="http://www.facebook.com/pages/Greenbelt-MD/NASA-Goddard/395013845897?ref=tsd" rel="nofollow">Facebook</a></b> <b>Find us on <a href="http://instagram.com/nasagoddard?vm=grid" rel="nofollow">Instagram</a></b>
![The monster winter storm that brought icing to the U.S. southeast moved northward along the Eastern Seaboard and brought snow, sleet and rain from the Mid-Atlantic to New England on February 13. A new image from NOAA's GOES satellite showed clouds associated with the massive winter storm stretch from the U.S. southeast to the northeast. Data from NOAA's GOES-East satellite taken on Feb. 13 at 1455 UTC/9:45 a.m. EST were made into an image by NASA/NOAA's GOES Project at NASA's Goddard Space Flight Center in Greenbelt, Md. The clouds and fallen snow data from NOAA's GOES-East satellite were overlaid on a true-color image of land and ocean created by data from the Moderate Resolution Imaging Spectroradiometer or MODIS instrument that flies aboard NASA's Aqua and Terra satellites.The image showed that the clouds associated with the storm were blanketing much of the U.S. East Coast. At 3:11 a.m. EST, a surface map issued by the National Weather Service or NWS showed the storm's low pressure area was centered over eastern North Carolina. Since then, the low has continued to track north along the eastern seaboard. By 11 a.m. EST, precipitation from the storm was falling from South Carolina to Maine, according to National Weather Service radar. By 11 a.m. EST, the Washington, D.C. region snow and sleet totals ranged from 3" in far eastern Maryland to over 18" in the northern and western suburbs in Maryland and Virginia. NWS reported that snow, sleet and rain were still falling and more snow is expected as the back side of the low moves into the region. The New York City region remained under an NWS Winter Storm Warning until 6 a.m. on Friday, February 14 and the National Weather Service expects minor coastal impacts Thursday into Friday afternoon. New England was also being battered by the storm. At 10:56 a.m. EST, Barnstable, Mass. on Cape Cod was experiencing rain and winds gusting to 28 mph. An NWS wind advisory is in effect for Cape Cod until 7 p.m. EST. Further north, Portland, Maine was experiencing heavy snow with winds from the northeast at 6 mph. The National Weather Service in Gray, Maine noted "Significant snowfall is likely for much of western Maine and New Hampshire as this storm passes by. There will be a mix or changeover to sleet and freezing rain over southern and coastal sections tonight...before all areas end as a period of snow Friday (Feb. 14) morning." On February 13 at 10 a.m. EST, NOAA's National Weather Service noted "An abundance of Atlantic moisture getting wrapped into the storm will continue to fuel widespread precipitation...which should lift through the Mid-Atlantic States and Northeast Thursday into Friday. A wide swath of heavy snow accumulations are expected with this storm...but air [moving] off the warmer ocean water should change snow over to rain along the coastal areas. Also...a narrow axis of sleet and freezing rain will be possible within the transition zone...which is expected to set up near the I-95 corridor." For updates on local forecasts, watches and warnings, visit NOAA's <a href="http://www.weather.gov" rel="nofollow">www.weather.gov</a> webpage. GOES satellites provide the kind of continuous monitoring necessary for intensive data analysis. Geostationary describes an orbit in which a satellite is always in the same position with respect to the rotating Earth. This allows GOES to hover continuously over one position on Earth's surface, appearing stationary. As a result, GOES provide a constant vigil for the atmospheric "triggers" for severe weather conditions such as tornadoes, flash floods, hail storms and hurricanes. For updated information about the storm system, visit NOAA's WPC website: <a href="http://www.hpc.ncep.noaa.gov/" rel="nofollow">www.hpc.ncep.noaa.gov/</a> For more information about GOES satellites, visit: <a href="http://www.goes.noaa.gov/" rel="nofollow">www.goes.noaa.gov/</a> or <a href="http://goes.gsfc.nasa.gov/" rel="nofollow">goes.gsfc.nasa.gov/</a> Credit: NASA/GSFC/Jeff Schmaltz/MODIS Land Rapid Response Team <b><a href="http://www.nasa.gov/audience/formedia/features/MP_Photo_Guidelines.html" rel="nofollow">NASA image use policy.</a></b> <b><a href="http://www.nasa.gov/centers/goddard/home/index.html" rel="nofollow">NASA Goddard Space Flight Center</a></b> enables NASA’s mission through four scientific endeavors: Earth Science, Heliophysics, Solar System Exploration, and Astrophysics. Goddard plays a leading role in NASA’s accomplishments by contributing compelling scientific knowledge to advance the Agency’s mission. <b>Follow us on <a href="http://twitter.com/NASAGoddardPix" rel="nofollow">Twitter</a></b> <b>Like us on <a href="http://www.facebook.com/pages/Greenbelt-MD/NASA-Goddard/395013845897?ref=tsd" rel="nofollow">Facebook</a></b> <b>Find us on <a href="http://instagram.com/nasagoddard?vm=grid" rel="nofollow">Instagram</a></b>](https://images-assets.nasa.gov/image/GSFC_20171208_Archive_e001228/GSFC_20171208_Archive_e001228~medium.jpg)
The monster winter storm that brought icing to the U.S. southeast moved northward along the Eastern Seaboard and brought snow, sleet and rain from the Mid-Atlantic to New England on February 13. A new image from NOAA's GOES satellite showed clouds associated with the massive winter storm stretch from the U.S. southeast to the northeast. Data from NOAA's GOES-East satellite taken on Feb. 13 at 1455 UTC/9:45 a.m. EST were made into an image by NASA/NOAA's GOES Project at NASA's Goddard Space Flight Center in Greenbelt, Md. The clouds and fallen snow data from NOAA's GOES-East satellite were overlaid on a true-color image of land and ocean created by data from the Moderate Resolution Imaging Spectroradiometer or MODIS instrument that flies aboard NASA's Aqua and Terra satellites.The image showed that the clouds associated with the storm were blanketing much of the U.S. East Coast. At 3:11 a.m. EST, a surface map issued by the National Weather Service or NWS showed the storm's low pressure area was centered over eastern North Carolina. Since then, the low has continued to track north along the eastern seaboard. By 11 a.m. EST, precipitation from the storm was falling from South Carolina to Maine, according to National Weather Service radar. By 11 a.m. EST, the Washington, D.C. region snow and sleet totals ranged from 3" in far eastern Maryland to over 18" in the northern and western suburbs in Maryland and Virginia. NWS reported that snow, sleet and rain were still falling and more snow is expected as the back side of the low moves into the region. The New York City region remained under an NWS Winter Storm Warning until 6 a.m. on Friday, February 14 and the National Weather Service expects minor coastal impacts Thursday into Friday afternoon. New England was also being battered by the storm. At 10:56 a.m. EST, Barnstable, Mass. on Cape Cod was experiencing rain and winds gusting to 28 mph. An NWS wind advisory is in effect for Cape Cod until 7 p.m. EST. Further north, Portland, Maine was experiencing heavy snow with winds from the northeast at 6 mph. The National Weather Service in Gray, Maine noted "Significant snowfall is likely for much of western Maine and New Hampshire as this storm passes by. There will be a mix or changeover to sleet and freezing rain over southern and coastal sections tonight...before all areas end as a period of snow Friday (Feb. 14) morning." On February 13 at 10 a.m. EST, NOAA's National Weather Service noted "An abundance of Atlantic moisture getting wrapped into the storm will continue to fuel widespread precipitation...which should lift through the Mid-Atlantic States and Northeast Thursday into Friday. A wide swath of heavy snow accumulations are expected with this storm...but air [moving] off the warmer ocean water should change snow over to rain along the coastal areas. Also...a narrow axis of sleet and freezing rain will be possible within the transition zone...which is expected to set up near the I-95 corridor." For updates on local forecasts, watches and warnings, visit NOAA's <a href="http://www.weather.gov" rel="nofollow">www.weather.gov</a> webpage. GOES satellites provide the kind of continuous monitoring necessary for intensive data analysis. Geostationary describes an orbit in which a satellite is always in the same position with respect to the rotating Earth. This allows GOES to hover continuously over one position on Earth's surface, appearing stationary. As a result, GOES provide a constant vigil for the atmospheric "triggers" for severe weather conditions such as tornadoes, flash floods, hail storms and hurricanes. For updated information about the storm system, visit NOAA's WPC website: <a href="http://www.hpc.ncep.noaa.gov/" rel="nofollow">www.hpc.ncep.noaa.gov/</a> For more information about GOES satellites, visit: <a href="http://www.goes.noaa.gov/" rel="nofollow">www.goes.noaa.gov/</a> or <a href="http://goes.gsfc.nasa.gov/" rel="nofollow">goes.gsfc.nasa.gov/</a> Credit: NASA/GSFC/Jeff Schmaltz/MODIS Land Rapid Response Team <b><a href="http://www.nasa.gov/audience/formedia/features/MP_Photo_Guidelines.html" rel="nofollow">NASA image use policy.</a></b> <b><a href="http://www.nasa.gov/centers/goddard/home/index.html" rel="nofollow">NASA Goddard Space Flight Center</a></b> enables NASA’s mission through four scientific endeavors: Earth Science, Heliophysics, Solar System Exploration, and Astrophysics. Goddard plays a leading role in NASA’s accomplishments by contributing compelling scientific knowledge to advance the Agency’s mission. <b>Follow us on <a href="http://twitter.com/NASAGoddardPix" rel="nofollow">Twitter</a></b> <b>Like us on <a href="http://www.facebook.com/pages/Greenbelt-MD/NASA-Goddard/395013845897?ref=tsd" rel="nofollow">Facebook</a></b> <b>Find us on <a href="http://instagram.com/nasagoddard?vm=grid" rel="nofollow">Instagram</a></b>