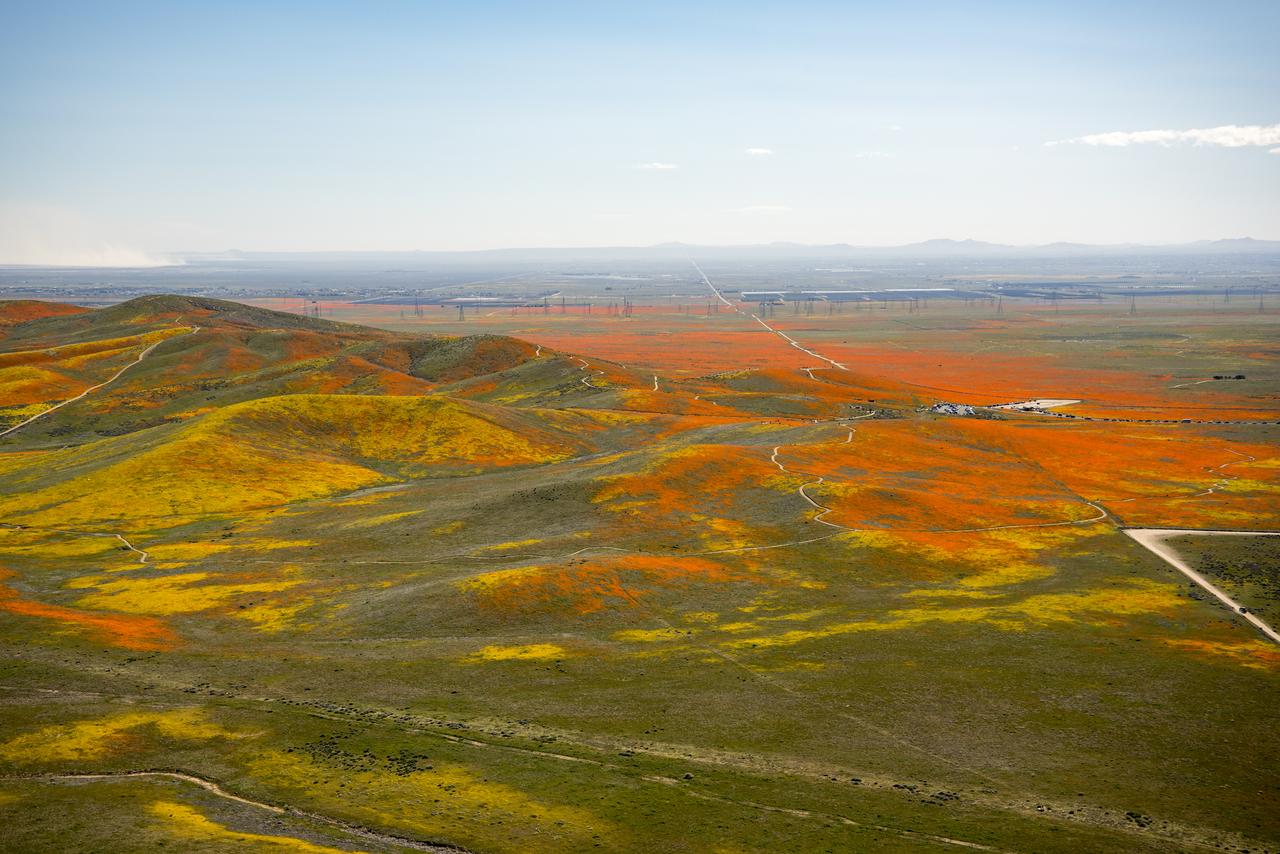
View from a NASA aircraft, TG-14, over the Superbloom of yellow wildflowers and orange poppies from the Antelope Valley in Southern California, Poppy Reserve and solar panels are in the background.
View from a NASA aircraft, TG-14, over the Superbloom of wildflowers and poppies from the Antelope Valley in Southern California, Poppy Reserve and solar panels are in the background.
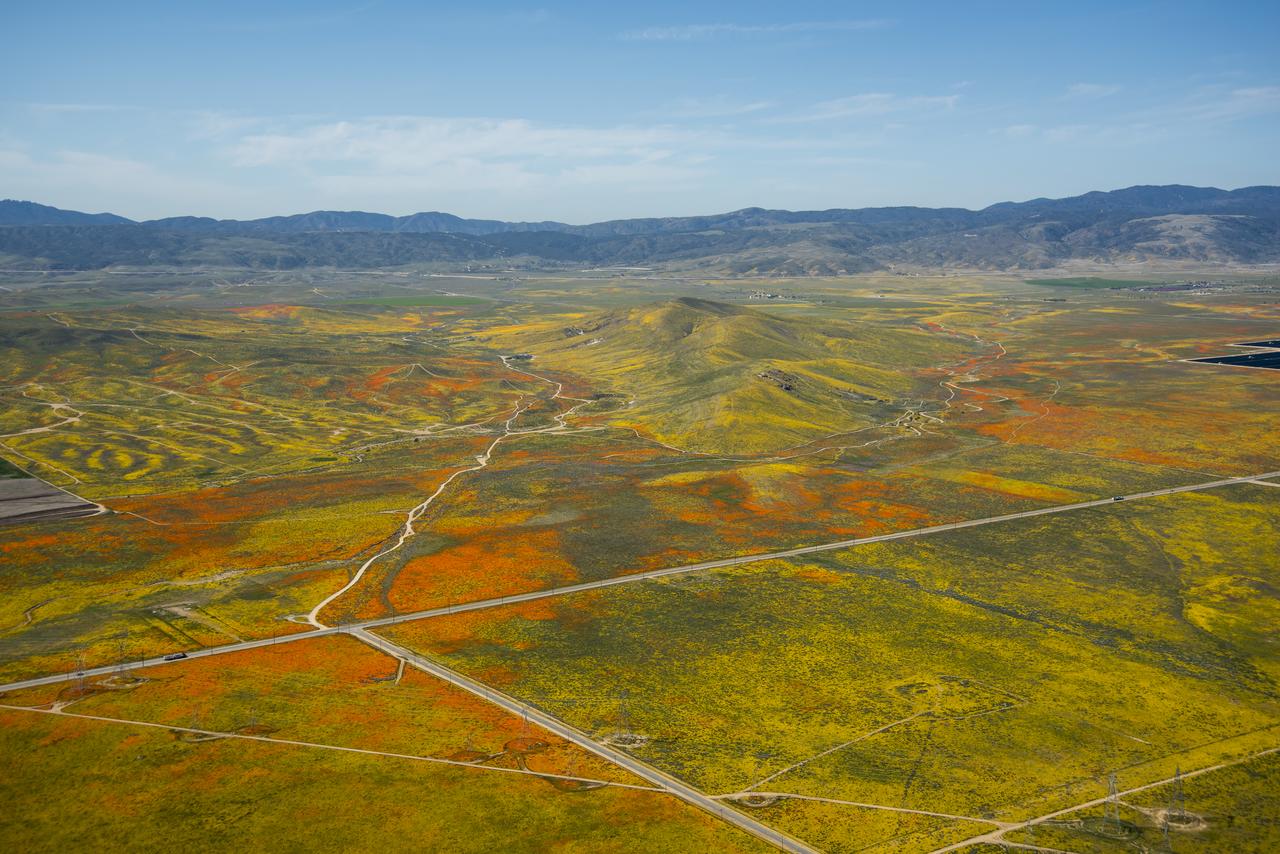
Image from a NASA aircraft, TG-14, over the Superbloom of wildflowers and poppies from the Antelope Valley in Southern California
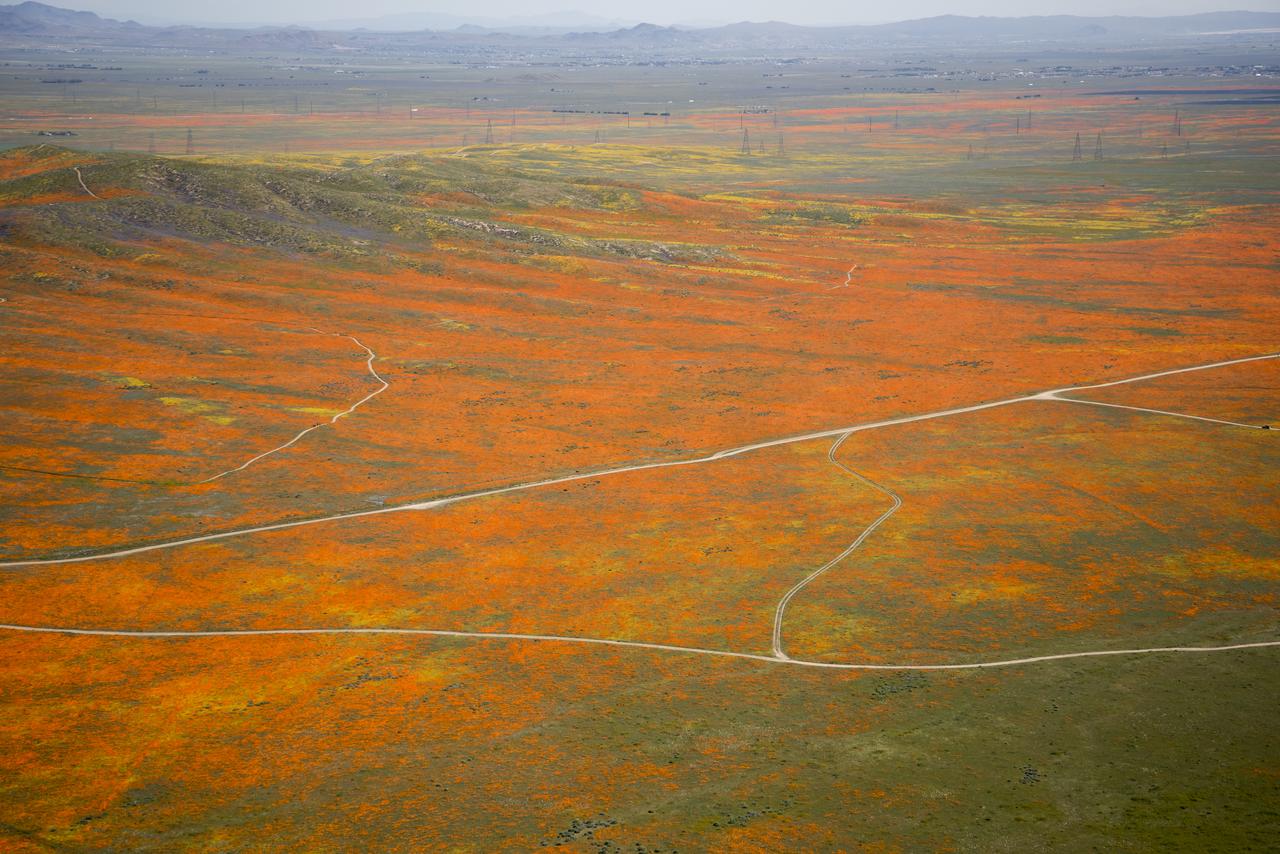
View from a NASA aircraft, TG-14, over the Superbloom of yellow wildflowers and orange poppies from the Antelope Valley in Southern California. The poppy is the state flower.

View from a NASA aircraft, TG-14, over the Superbloom of wildflowers and poppies from the Antelope Valley in Southern California and Poppy Reserve and solar panels in background
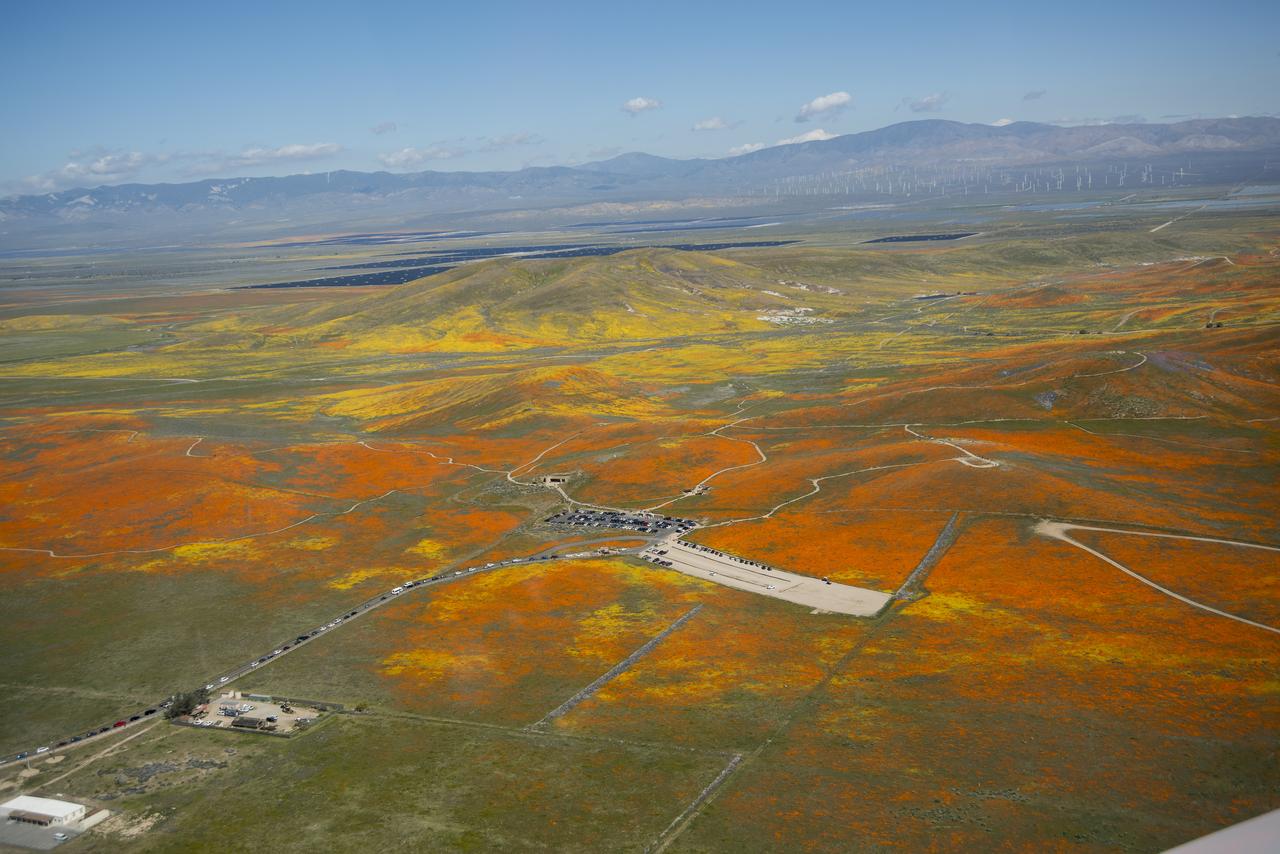
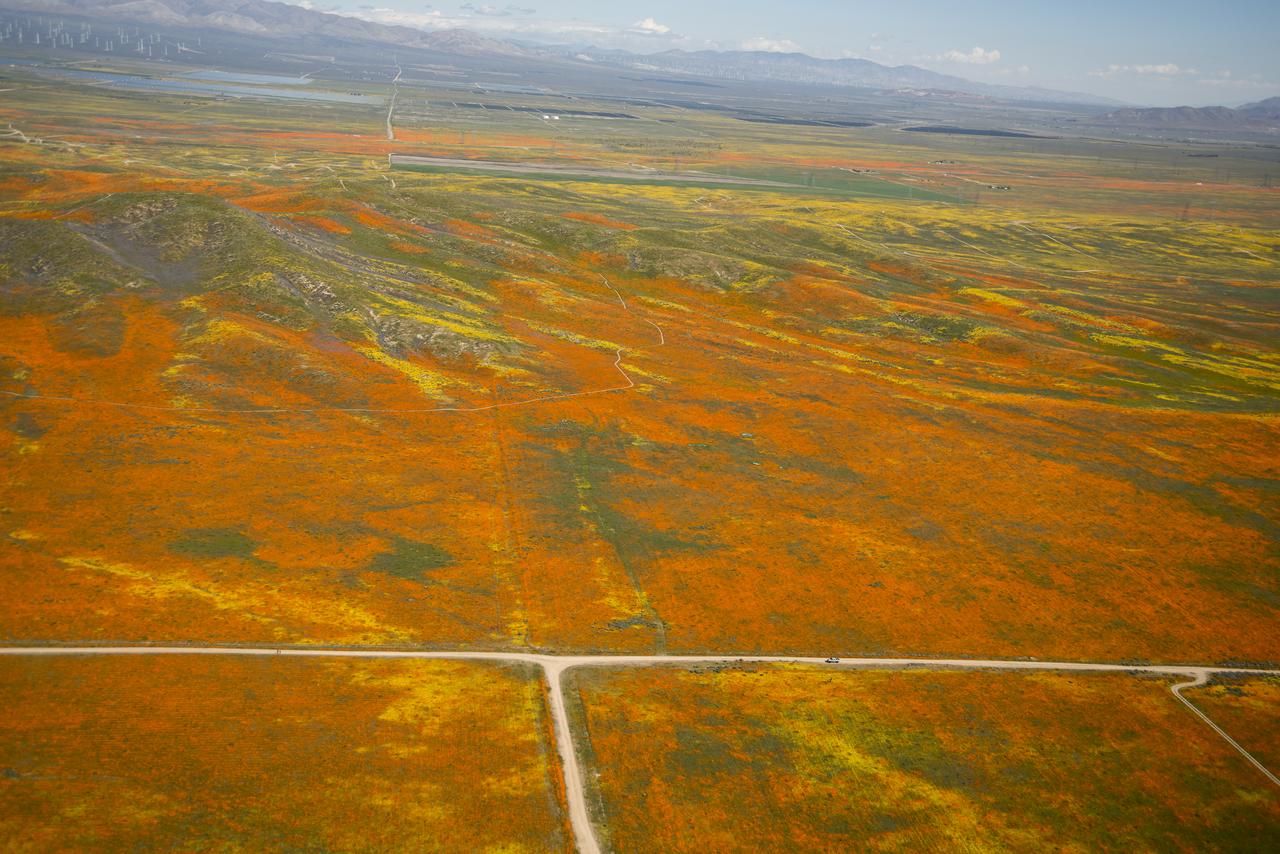
View from a NASA aircraft, TG-14, over the Superbloom of wildflowers and poppies from the Antelope Valley in Southern California. The Poppy Reserve is in the foreground and solar panels are in the background.
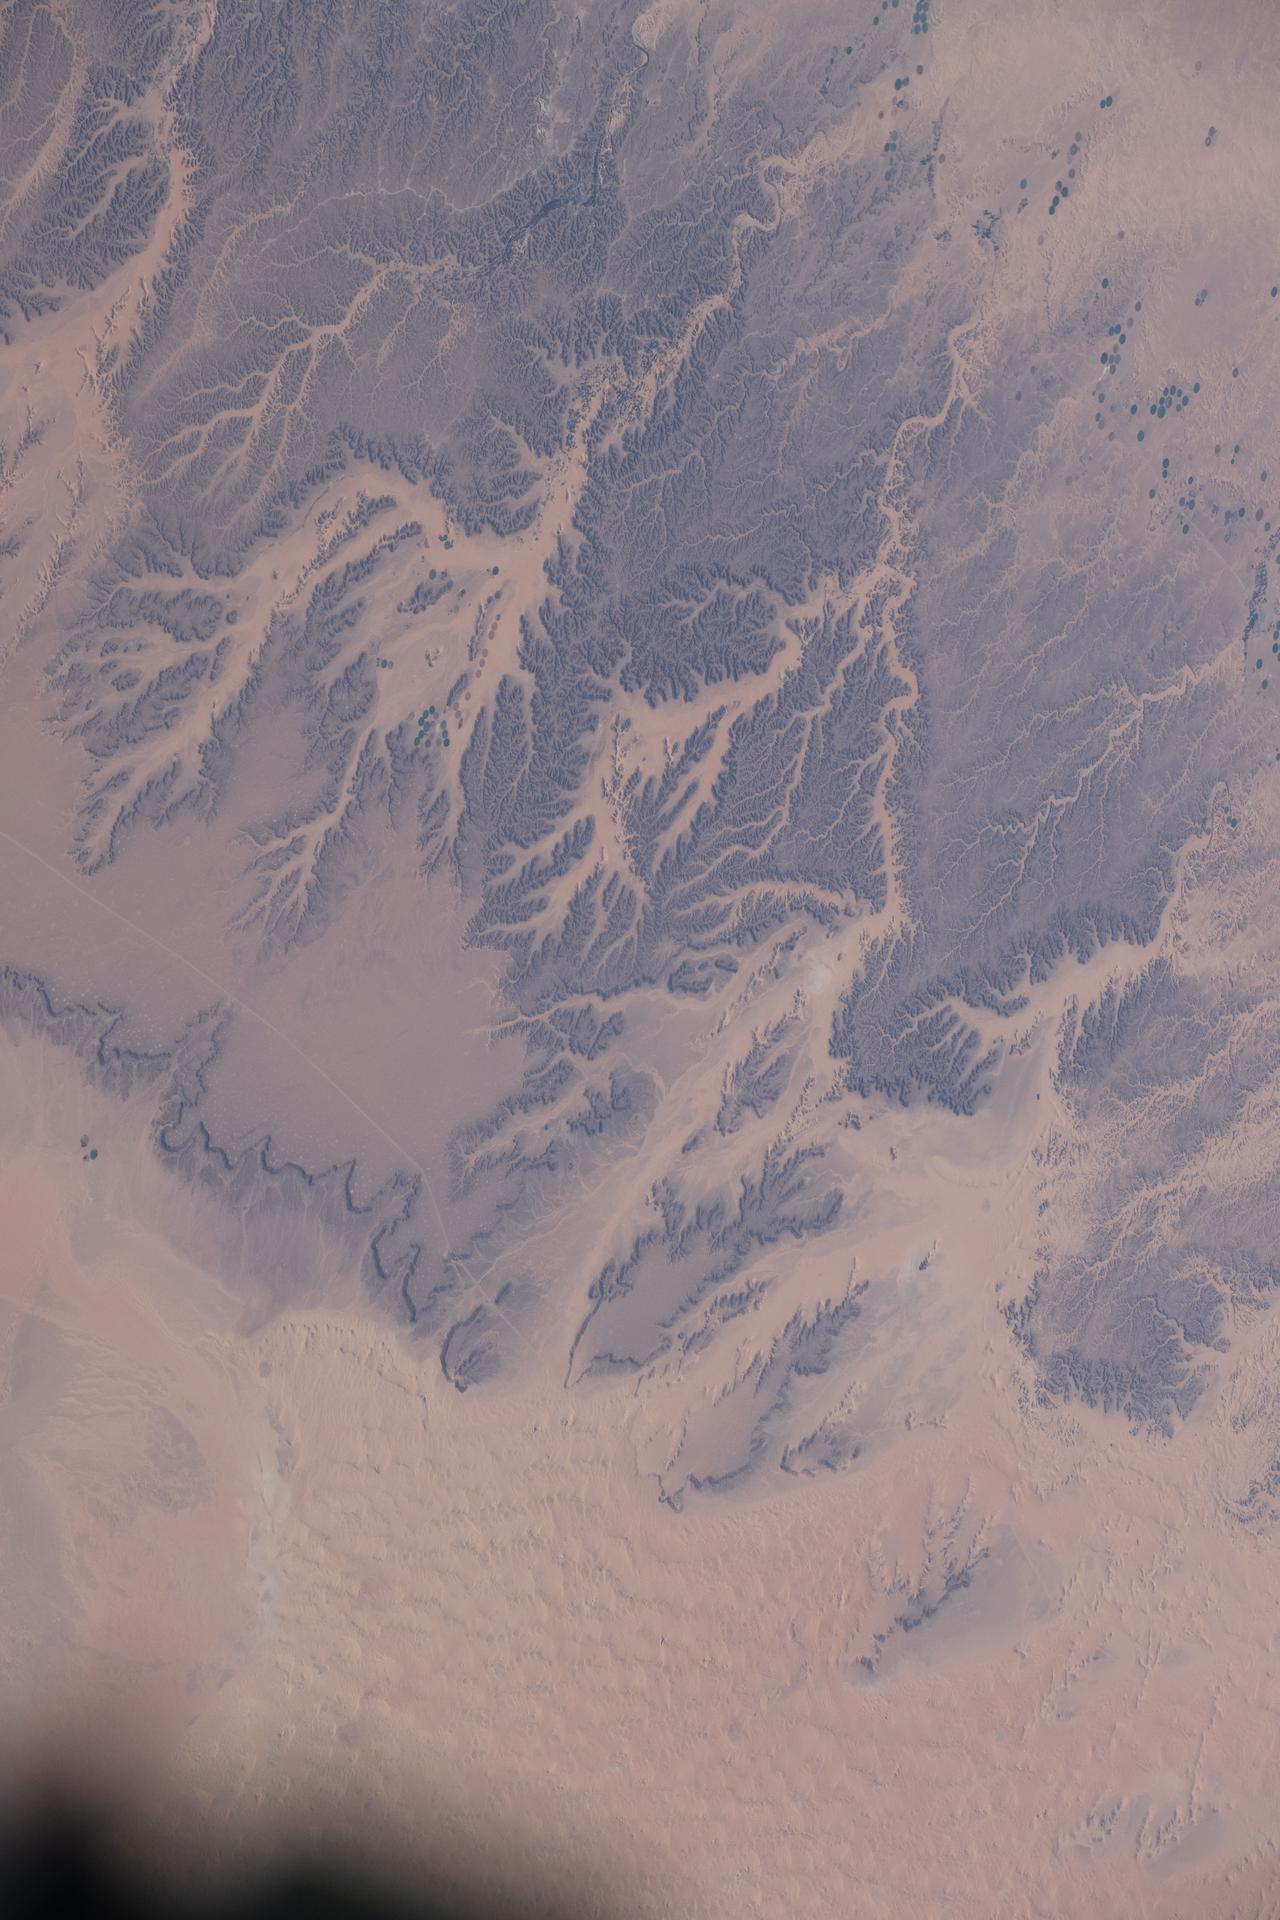
iss074e0320309 (Feb. 21, 2026) --- Wadis, dry riverbeds or channels that carry water only during the rainy season, are pictured in the northern Sahara Desert region of Algeria. The International Space Station was orbiting 260 miles above the North African nation when this photograph was taken. Credit: NASA/Jessica Meir

NASA’s T-34 aircraft flown from the agency’s Armstrong Flight Research Center heading toward Southern California’s Antelope Valley Poppy Reserve. The aircraft was flown from the agency’s Armstrong Flight Research Center.

NASA's T-34 aircraft flown from the agency's Armstrong Flight Research Center aims the plane toward Southern California's Antelope Valley Poppy Reserve. The aircraft was flown from the agency's Armstrong Flight Research Center.

NASA’s T-34 aircraft flown from the agency’s Armstrong Flight Research Center aims the plane toward Southern California’s Antelope Valley Poppy Reserve flying over yellow wildflowers. The aircraft was flown from the agency’s Armstrong Flight Research Center.
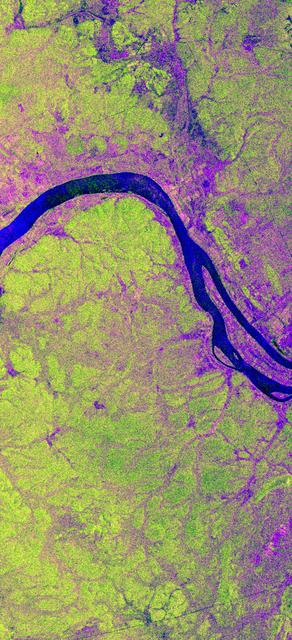
This is an X-band image showing seasonal changes at the hydrological test site of Bebedouro in Brazil. The image is centered at 9 degrees south latitude and 40.2 degrees west longitude. This image was acquired by the Spaceborne Imaging Radar-C and X-band Synthetic Aperture Radar (SIR-C/X-SAR) aboard the space shuttle Endeavour on April 10, 1994, during the first flight of the radar system, and on October 1, 1994, during the second mission. The swath width is approximately 16.5 kilometers (10.5 miles) wide. The image channels have the following color assignments: red represents data acquired on April 10; green represents data acquired on October 1; blue corresponds to the ratio of the two data sets. Agriculture plays an important economic and social role in Brazil. One of the major problems related to Brazilian agriculture is estimating the size of planting areas and their productivity. Due to cloud cover and the rainy season, which occurs from November through April, optical and infrared Earth observations are seldom used to survey the region. An additional goal of monitoring this region is to watch the floodplains of rivers like Rio Sao Francisco in order to determine suitable locations for additional agricultural fields. This area belongs to the semi-arid northeastern region of Brazil, where estimates have suggested that about 10 times more land could be used for agriculture, including some locations which could be used for irrigation projects. Monitoring of soil moisture during the important summer crop season is of high priority for the future development and productivity of this region. In April the area was covered with vegetation because of the moisture of the soil and only small differences could be seen in X-band data. In October the run-off channels of this hilly region stand out quite clearly because the greenish areas indicated much less soil moisture and water content in plants. http://photojournal.jpl.nasa.gov/catalog/PIA01733
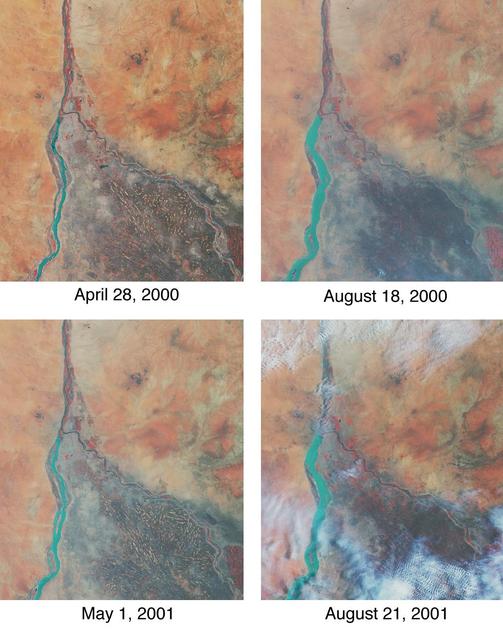
Throughout history, the rising and falling waters of the mighty Nile River have directly impacted the lives of the people who live along its banks. These images of the area around Sudan's capital city of Khartoum capture the river's dynamic nature. Acquired by the Multi-angle Imaging SpectroRadiometer's nadir (vertical-viewing) camera, they display the extent of the Nile waters before and after the onset of the rainy seasons of 2000 (top pair) and 2001 (bottom pair). The images are displayed in "false color," using the camera's near-infrared, green, and blue bands. With this particular spectral combination, water appears in shades of blue and turquoise, and highly vegetated areas show up as bright red. Originating in Uganda and Ethiopia, respectively, the waters of the White Nile (western branch) and Blue Nile (eastern branch) converge at Khartoum (about half-way between image center and the left-hand side), and continue to flow northward as the Great Nile. Although the most obvious feature in these images is the increased width of the White Nile between spring and summer, careful inspection shows that the Great Nile is at its widest in August 2001 (note in particular the area between the clouds near the top of this panel). Heavy rains in the Blue Nile catchment area of the Ethiopian highlands led to a rapid overflow of the river's floodwaters into the main stream of the Great Nile, leading to extensive flooding, the worst effects of which occurred north of Khartoum. According to the Food and Agriculture Organization of the United Nations, tens of thousands of people have fled their homes, and the number of people in need of urgent food assistance in Sudan, estimated at three million earlier in the year, was likely to increase with the onset of these floods. South of the confluence of the White Nile and the Blue Nile, the area of a cross-hatched appearance is the irrigated plain of El Gezira. The Gezira irrigation scheme uses water from the Makwar Dam (now called the Sennar Dam), located across the Blue Nile south of Khartoum. Among the main agricultural products of this region are cotton, millet, peanuts and fodder crops. Overall prospects for Sudan's 2001 grain crop were already poor prior to the flooding due to a late start of the rainy season in parts of the country. Following two consecutive years of serious drought, precipitation arrived too late to save the grain harvest that normally begins in late August. Lower harvests for the past two years coupled with depletion of stocks have led to a rise in cereal prices, reducing access to food for the Sudan's poorer citizens, already suffering from the effects of Africa's longest running civil war. Each of these images represents an area of about 130 kilometers x 150 kilometers. The data were obtained during Terra orbits 1922, 3553, 7281, and 8912. http://photojournal.jpl.nasa.gov/catalog/PIA03420
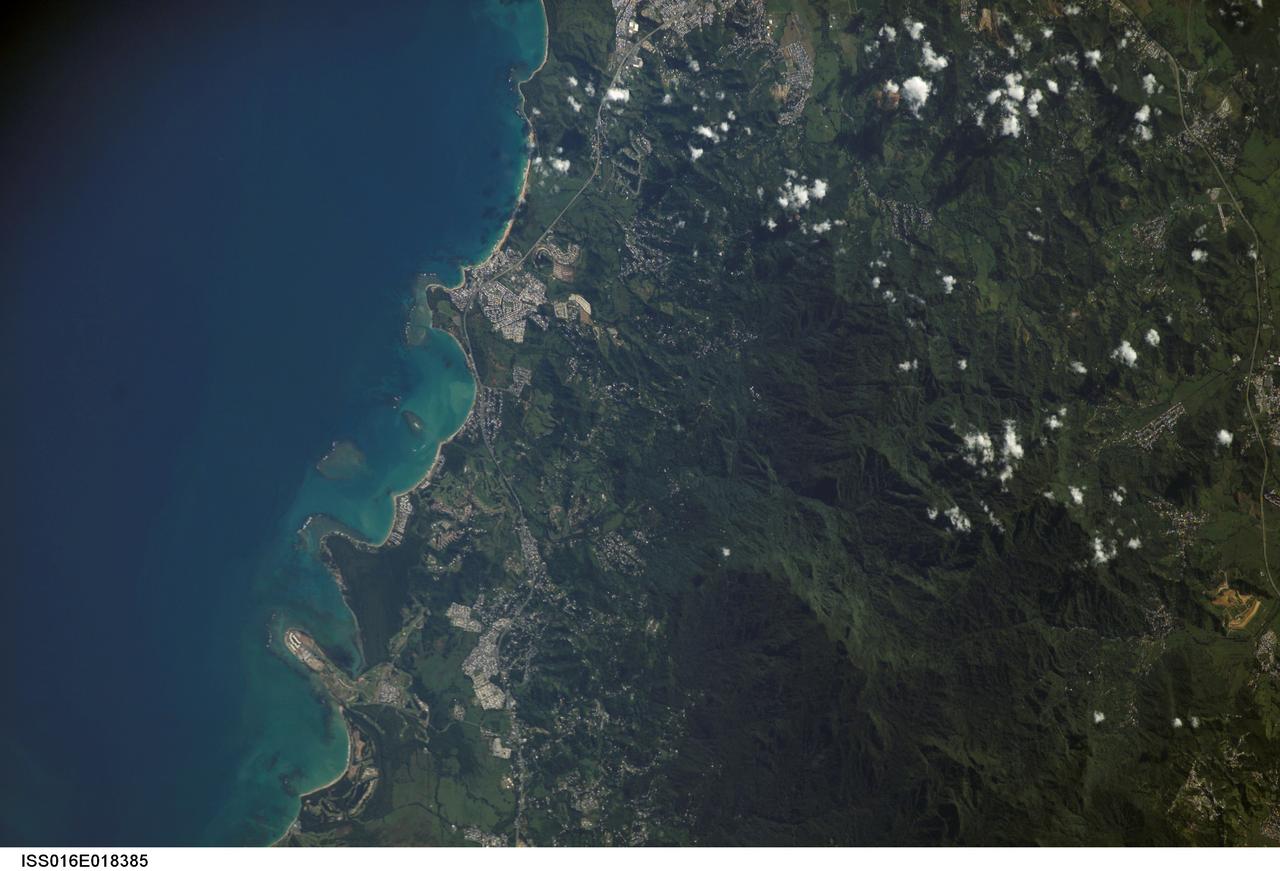
ISS016-E-018385 (23 Dec. 2008) --- Luquillo Mountains, Puerto Rico are featured in this image photographed by an Expedition 16 crewmember on the International Space Station. The Luquillo Mountains are located in the northeastern portion of Puerto Rico and rise to elevations of 1,075 meters. According to scientists, the mountains are comprised mainly of volcanic rock material that was uplifted by tectonism - Puerto Rico is located between the junction of the North American and Caribbean plates - approximately 37--28 million years ago. Prevailing easterly winds bring moisture from the Caribbean Sea that falls as precipitation as they cross the mountains. Higher elevations receive more rainfall than lower elevations, leading to subtropical forest types in the lowlands and montane forest types near the summits. This image, taken during the rainy season, illustrates the rich vegetation cover of the mountains. The rapid change in ecosystems with elevation, land use history, and exposure to frequent natural disturbances (such as hurricanes) makes the Luquillo Mountains as ideal location for ecological study. The Luquillo Experimental Forest Long Term Ecological Research (LTER) site is contained within the Luquillo National Forest, covering much of the mountains to the southwest of the city of Luquillo (center). Historical human land uses in the Forest -- such as logging, agriculture, charcoal production, and coffee plantations - have determined much of the current ecosystem structure. Results of LTER site research indicates that the forest ecosystems recover more rapidly from natural disturbances (like hurricanes) than they do from human disturbance.
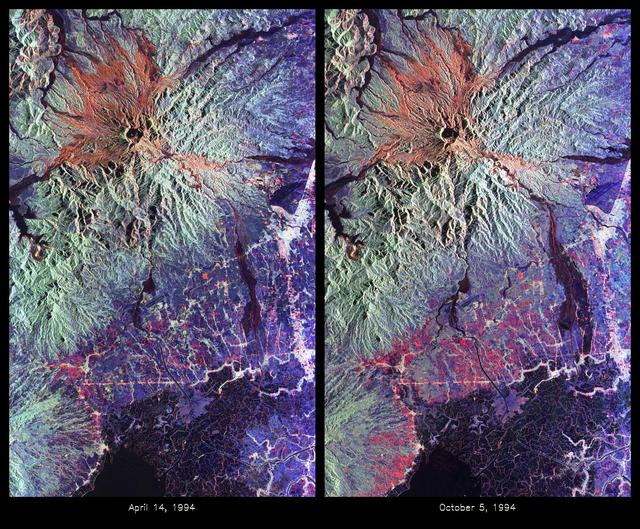
These are color composite radar images showing the area around Mount Pinatubo in the Philippines. The images were acquired by the Spaceborne Imaging Radar-C and X-band Synthetic Aperture Radar (SIR-C/X-SAR) aboard the space shuttle Endeavour on April 14, 1994 (left image) and October 5,1994 (right image). The images are centered at about 15 degrees north latitude and 120.5 degrees east longitude. Both images were obtained with the same viewing geometry. The color composites were made by displaying the L-band (horizontally transmitted and received) in red; the L-band (horizontally transmitted and vertically received) in green; and the C-band (horizontally transmitted and vertically received) in blue. The area shown is approximately 40 kilometers by 65 kilometers (25 miles by 40 miles). The main volcanic crater on Mount Pinatubo produced by the June 1991 eruptions and the steep slopes on the upper flanks of the volcano are easily seen in these images. Red on the high slopes shows the distribution of the ash deposited during the 1991 eruption, which appears red because of the low cross-polarized radar returns at C and L bands. The dark drainages radiating away from the summit are the smooth mudflows, which even three years after the eruptions continue to flood the river valleys after heavy rain. Comparing the two images shows that significant changes have occurred in the intervening five months along the Pasig-Potrero rivers (the dark area in the lower right of the images). Mudflows, called "lahars," that occurred during the 1994 monsoon season filled the river valleys, allowing the lahars to spread over the surrounding countryside. Three weeks before the second image was obtained, devastating lahars more than doubled the area affected in the Pasig-Potrero rivers, which is clearly visible as the increase in dark area on the lower right of the images. Migration of deposition to the east (right) has affected many communities. Newly affected areas included the community of Bacolor, Pampanga, where thousands of homes were buried in meters of hot mud and rock as 80,000 people fled the lahar-stricken area. Scientists are closely monitoring the westward migration ( toward the left in this image) of the lahars as the Pasig-Potrero rivers seek to join with the Porac River, an area that has not seen laharic activity since the eruption. This could be devastating because the Pasig-Potrero rivers might be permanently redirected to lower elevations along the Porac River where communities are located. Ground saturation with water during the rainy season reveals inactive channels that were dry in the April image. A small lake has turned into a pond in the lower reaches of the Potrero River because the channels are full of lahar deposits and the surface runoff has no where to flow. Changes in the degree of erosion in ash and pumice deposits from the 1991 eruption can also be seen in the channels that deliver the mudflow material to the Pasig-Potrero rivers. The 1991 Mount Pinatubo eruption is well known for its near-global effects on the atmosphere and short-term climate due to the large amount of sulfur dioxide that was injected into the upper atmosphere. Locally, however, the effects will most likely continue to impact surrounding areas for as long as the next 10 to 15 years. Mudflows, quite certainly, will continue to pose severe hazards to adjacent areas. Radar observations like those obtained by SIR-C/X-SAR will play a key role in monitoring these changes because of the radar's ability to see in daylight or darkness and even in the worst weather conditions. Radar imaging will be particularly useful, for example, during the monsoon season, when the lahars form. Frequent imaging of these lahar fields will allow scientists to better predict when they are likely to begin flowing again and which communities might be at risk. http://photojournal.jpl.nasa.gov/catalog/PIA01743