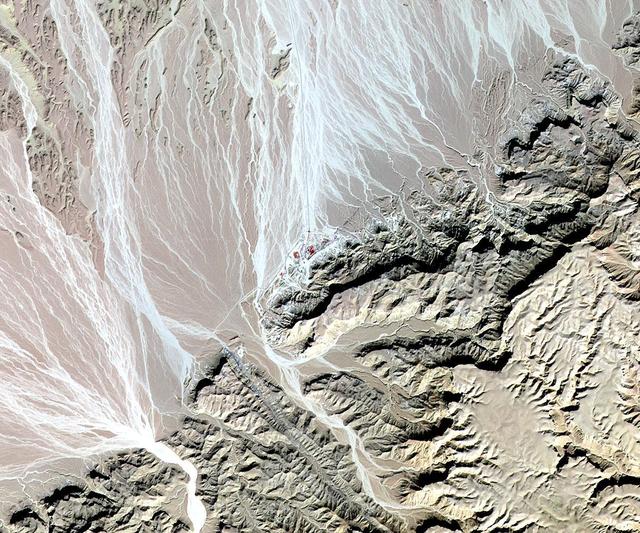
NASA Terra spacecraft acquired this image of St. Anthony, the world oldest Christian monastery, settled in the remote mountainous area of eastern Egypt near the Red Sea.
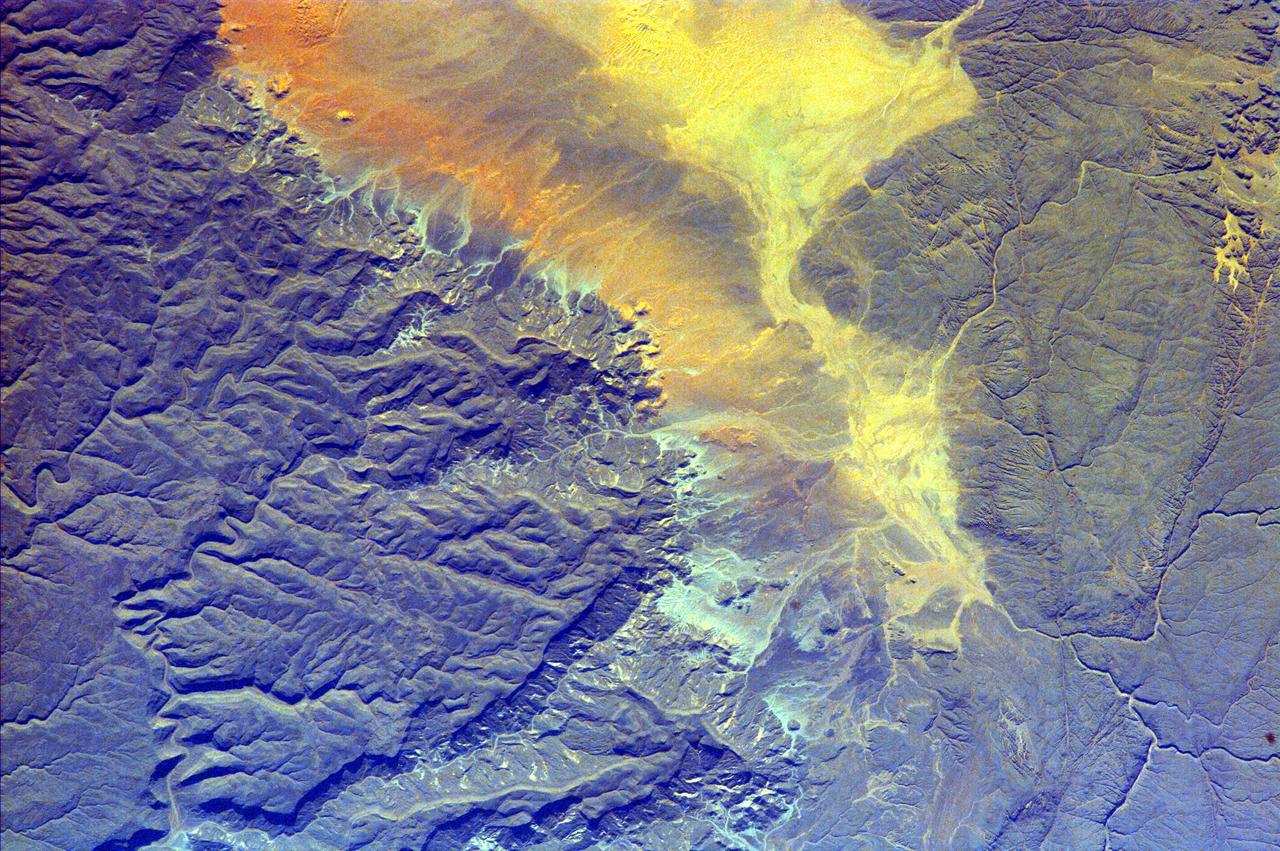
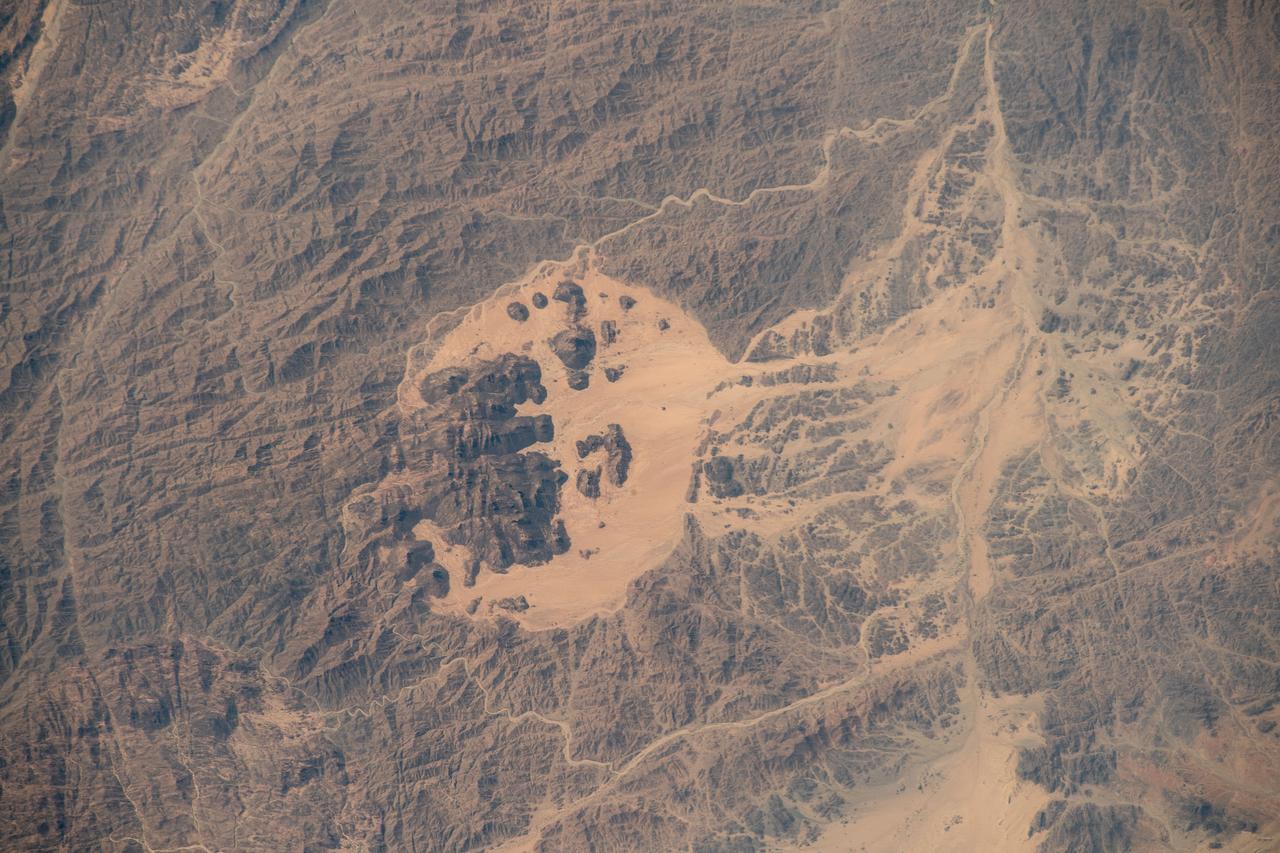
The impermanent waterways shown here from NASA EarthKAM are part of Oued Irharrhar, which appear to be carrying sulfur yellow and iron red deposits. The city of Amguid is located on these waterways, and all lie in the Mouydir Mountains in Algeria.
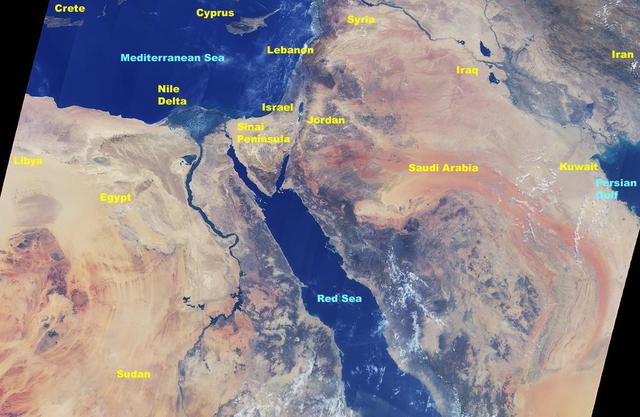
This image from NASA Terra satellite in August, 2000, shows the northern tip of the Red Sea, the Gulf of Suez and the Gulf of Aqaba frame the sandy deserts and spectacular mountains of the Sinai Peninsula.

Ames 70 Year Anniversary Exhibit in downtown Mountain View, California. Exhibits at the Red Rock Cafe on Castro Street.
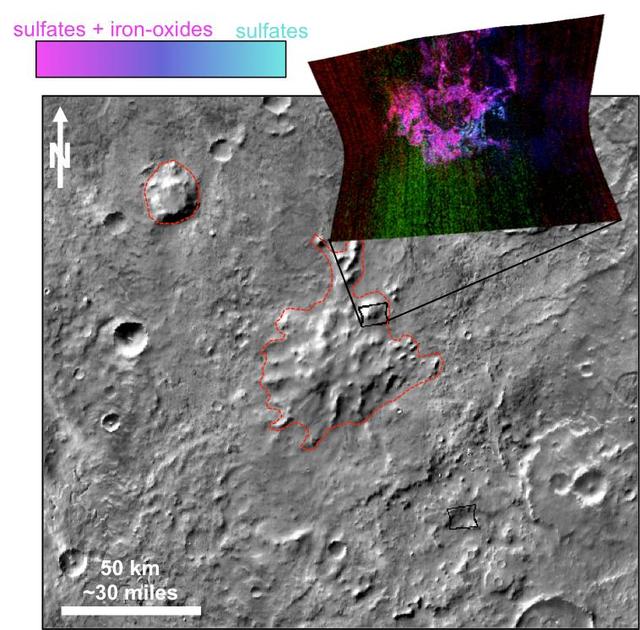
These mountains are in a region called Sisyphi Montes. The base image from NASA 2001 Mars Odyssey shows a portion of the region about 130 miles. Red outlines indicate possible subglacial volcanic structures. MRO CRISM data are at upper right.
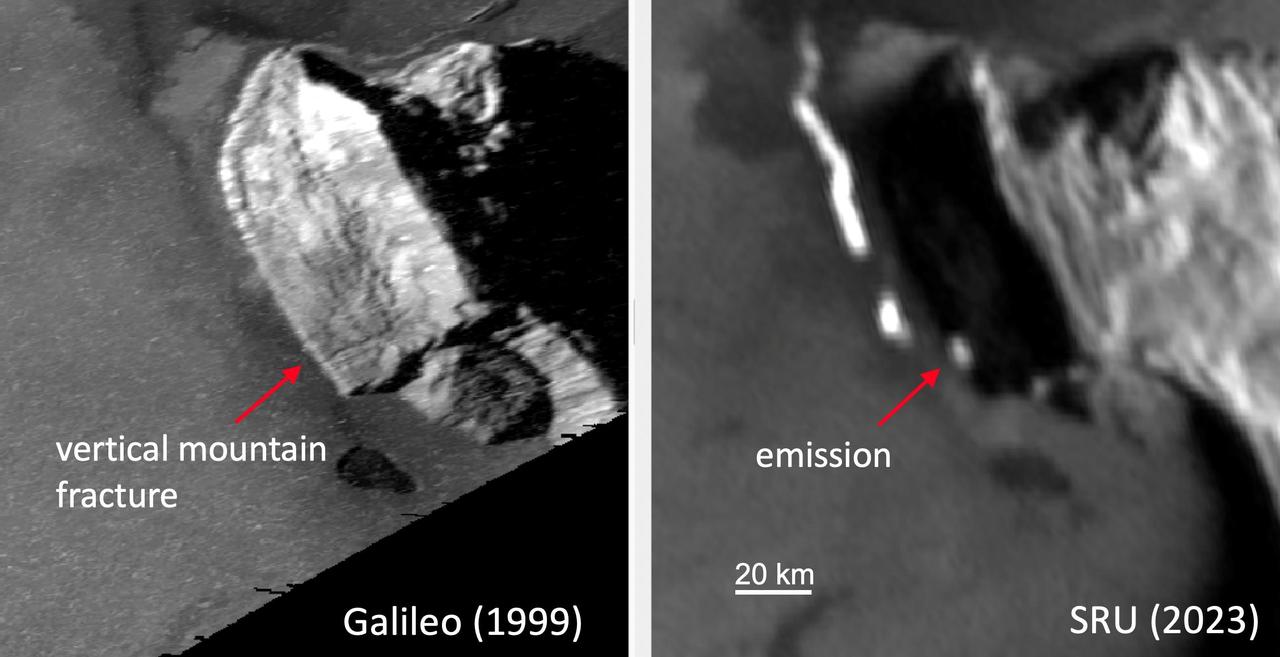
While imaging Io's night side under illumination from Jupiter-shine on Dec. 30, 2023, the Stellar Reference Unit (SRU) on NASA's Juno spacecraft observed an unprecedented glow from active lava at the base of a mountain on Io (red arrow, right panel). The thermal emission signature was located at the base of the western flank of South Zal Mons. Sunlit imagery of the region by captured by NASA's Galileo mission circa 1999 (at left) shows a vertical mountain fracture running from the top of the mountain to the location of the SRU-observed "glow" (red arrow, left panel). One hypothesis is that an extension of the mountain fracture created a fissure vent that allows lava to escape to the surface at this location. https://photojournal.jpl.nasa.gov/catalog/PIA26522
iss070e002272 (Oct. 6, 2023) --- The Jibāl Hawlad mountain range, near the Red Sea, is pictured in the African nation of Sudan as the International Space Station orbited 258 miles above.
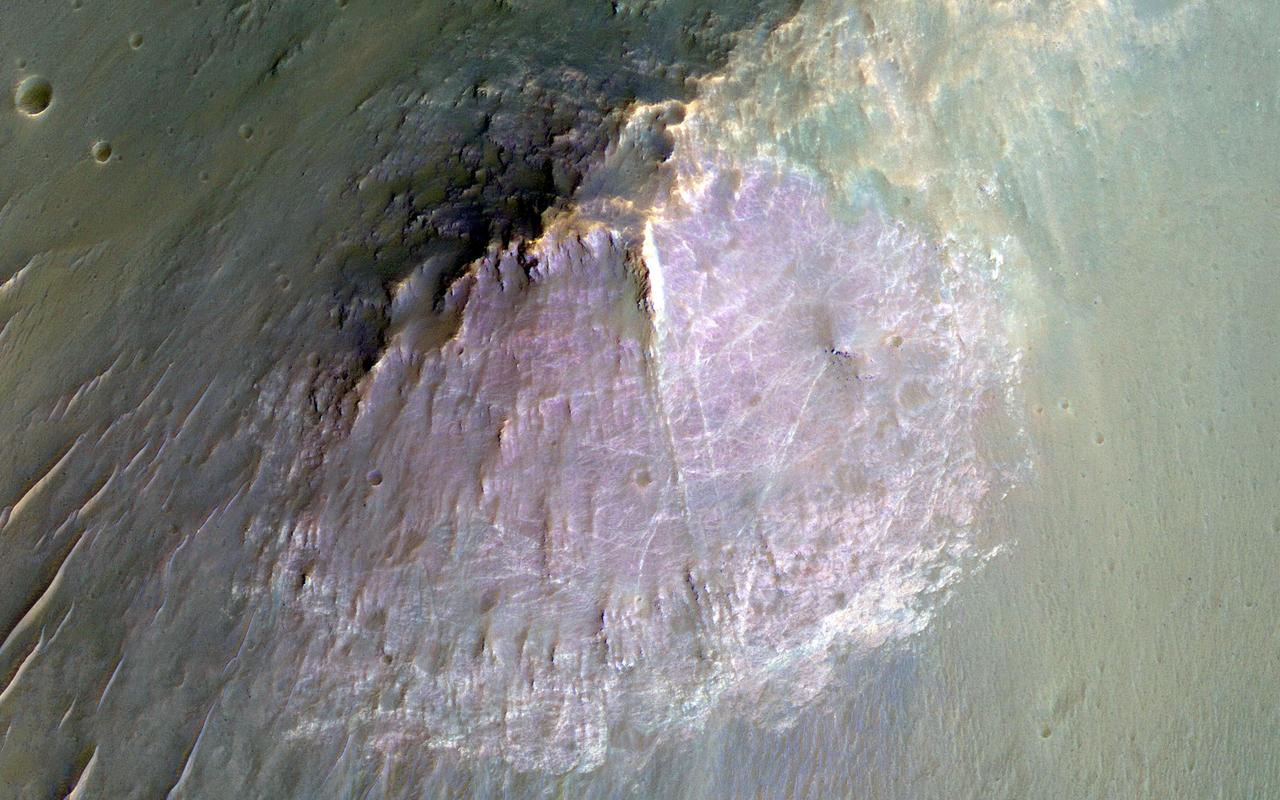
NASA Mars Reconnaissance Orbite observed this image of an isolated mountain in the Southern highlands reveals a large exposure of purplish bedrock. Since HiRISE color is shifted to longer wavelengths than visible color and given relative stretches, this really means that the bedrock is roughly dark in the broad red bandpass image compared to the blue-green and near-infrared bandpass images. In the RGB (red-green-blue) color image, which excludes the near-infrared bandpass image, the bedrock appears bluish in color. This small mountain is located near the northeastern rim of the giant Hellas impact basin, and could be impact ejecta. http://photojournal.jpl.nasa.gov/catalog/PIA19854
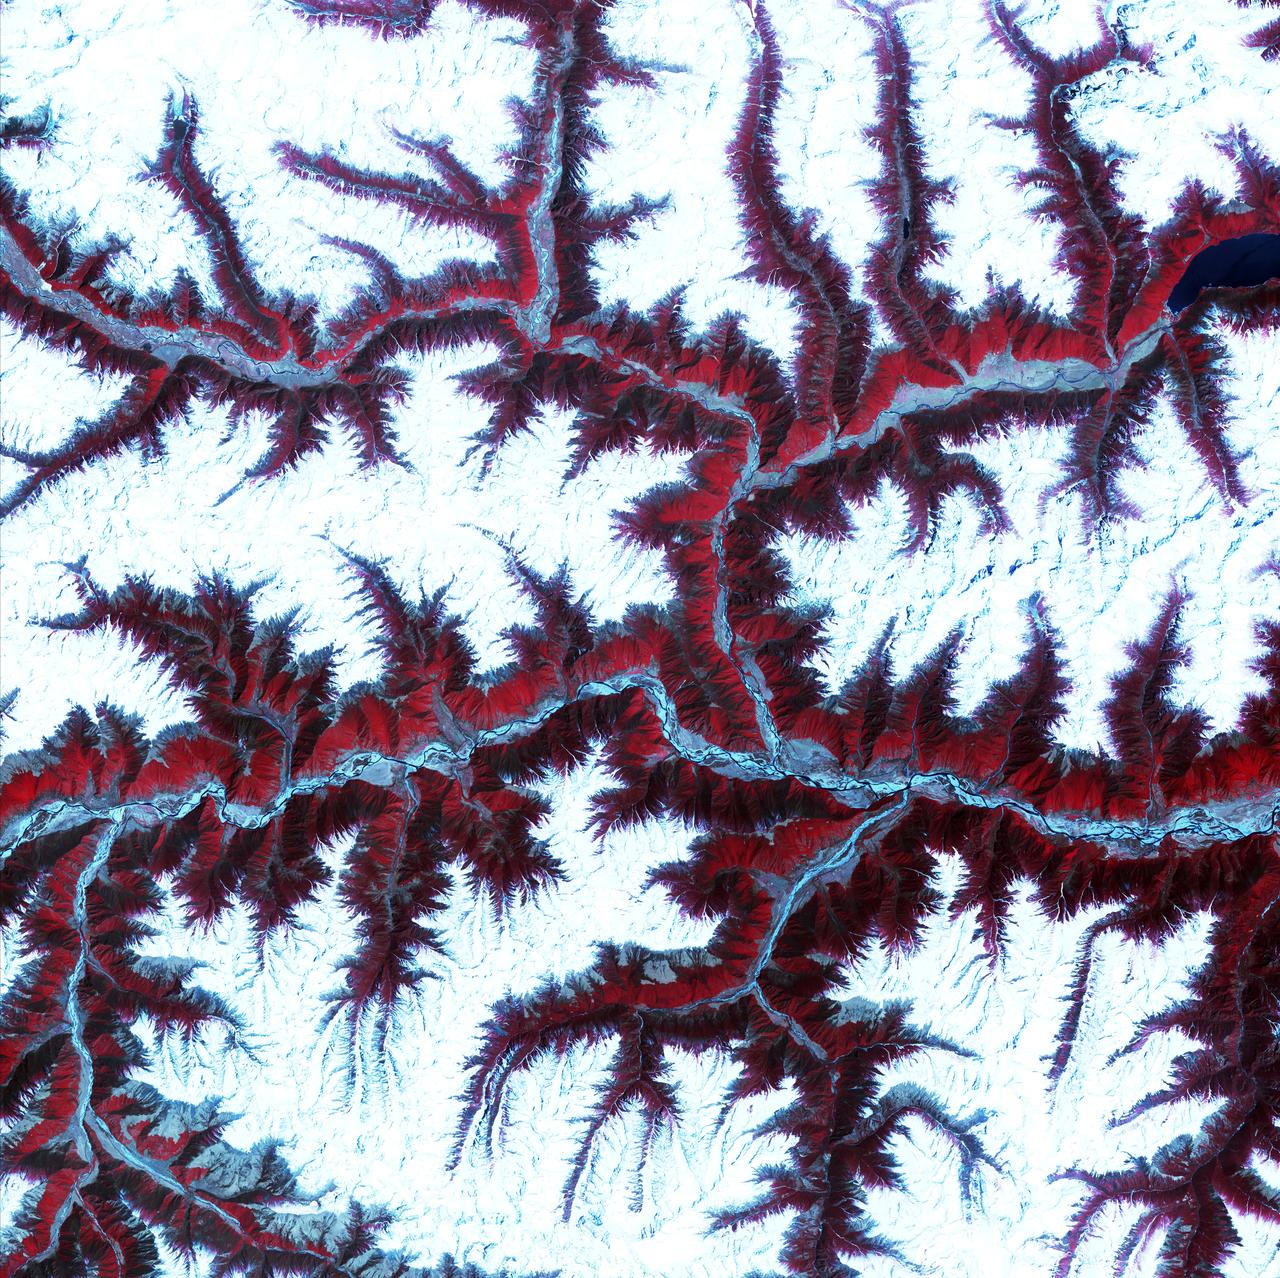
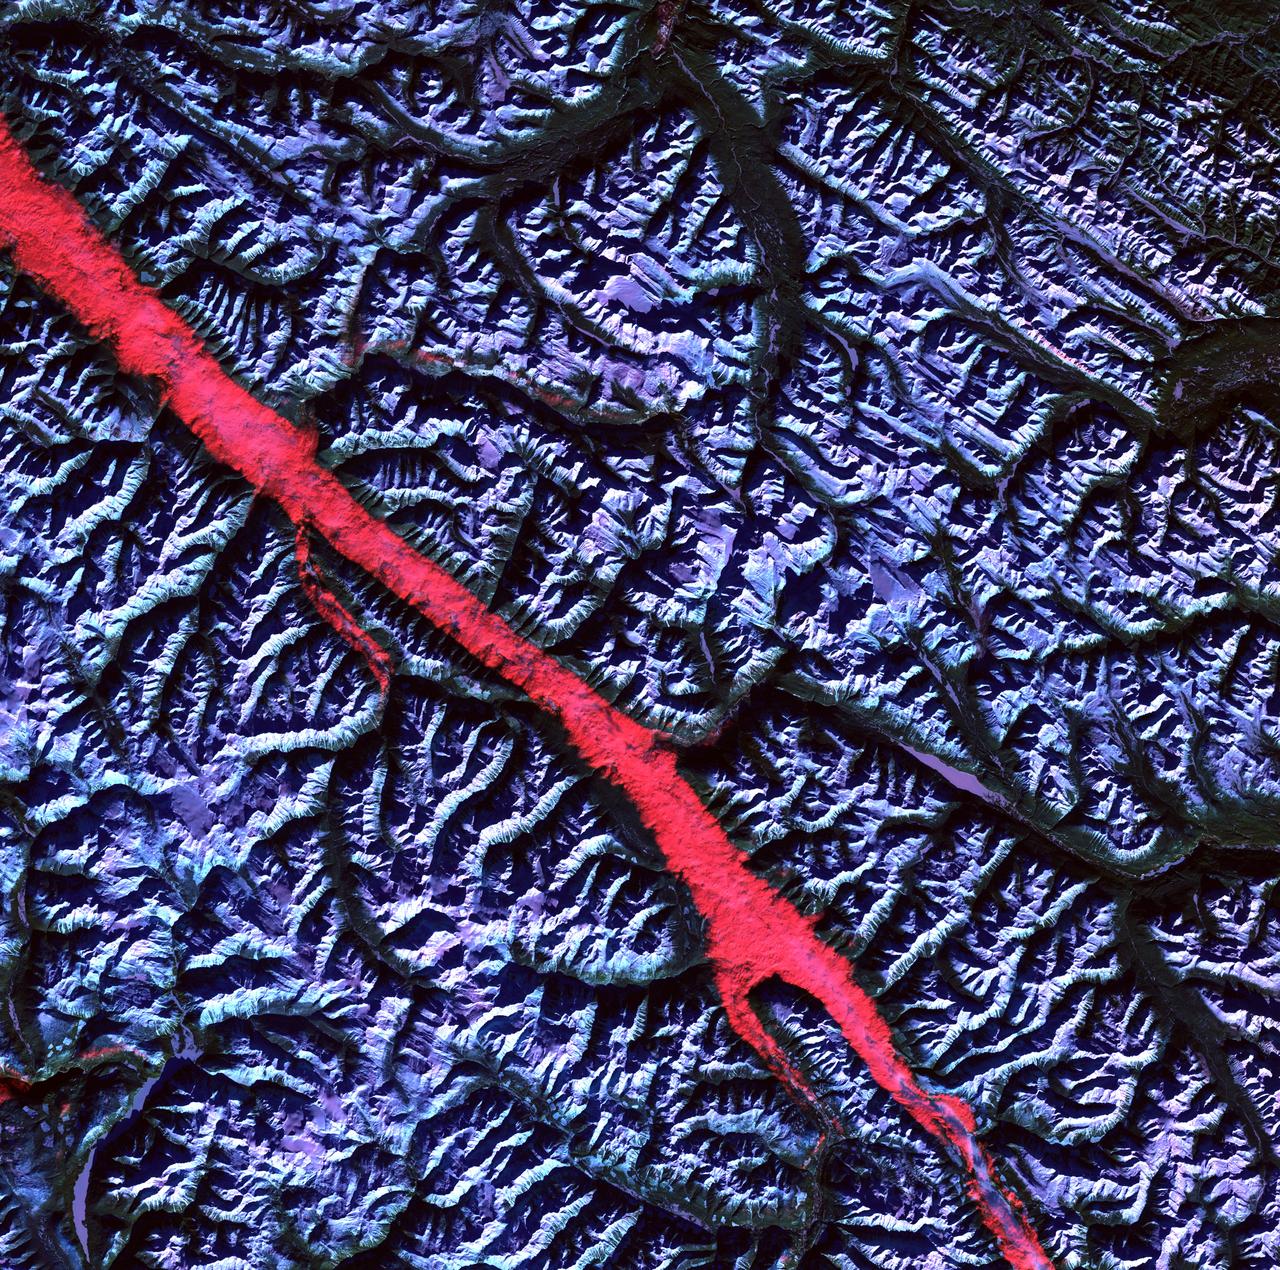
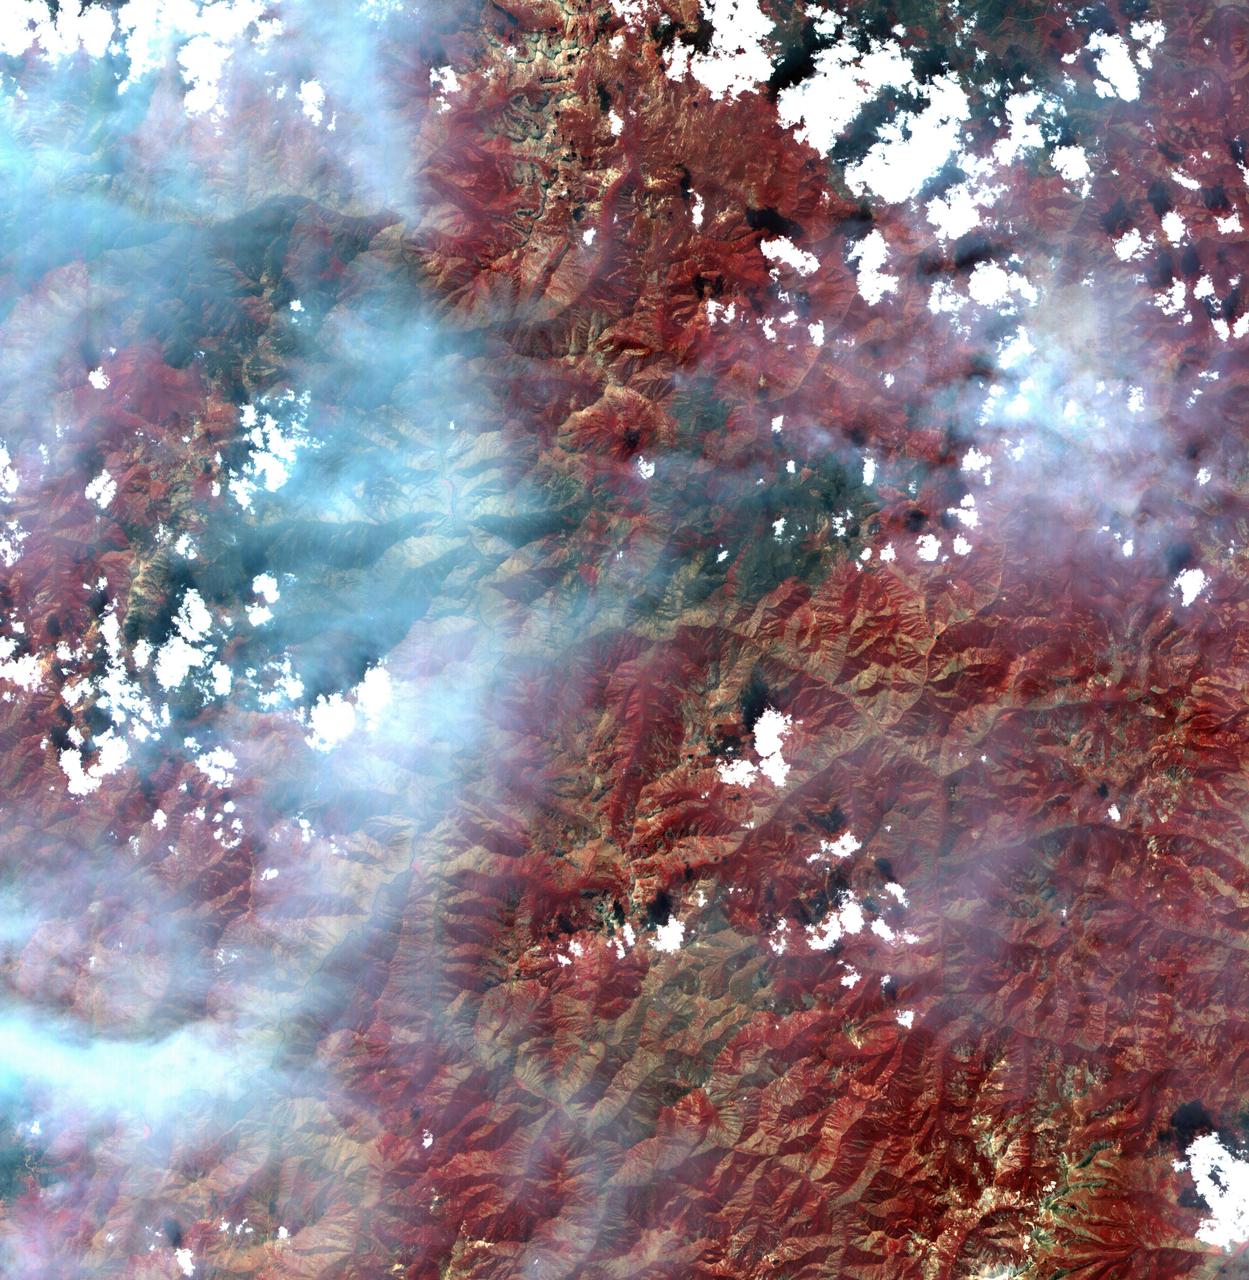
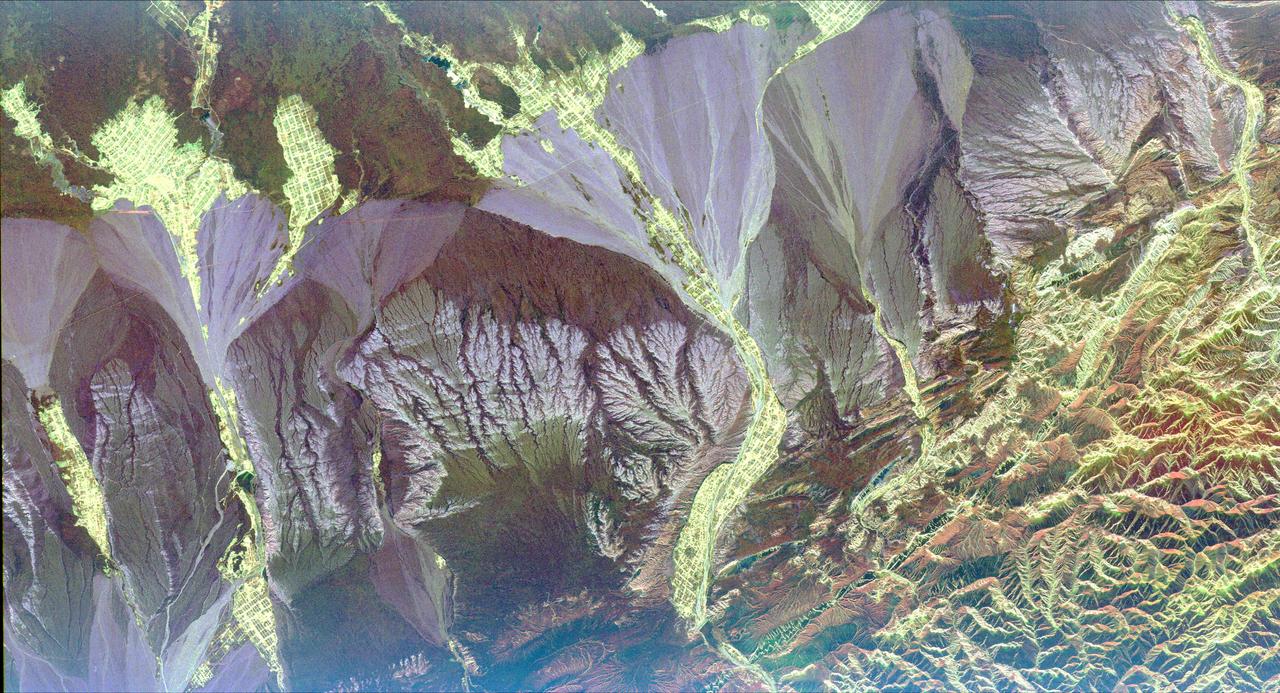
April 12th, 2001: Description: Soaring, snow-capped peaks and ridges of the eastern Himalaya Mountains create an irregular white-on-red patchwork between major rivers in southwestern China. The Himalayas are made up of three parallel mountain ranges that together extend more than 2,900 kilometers. Source: ASTER To learn more about the Landsat satellite go to: <a href="http://landsat.gsfc.nasa.gov/" rel="nofollow">landsat.gsfc.nasa.gov/</a>
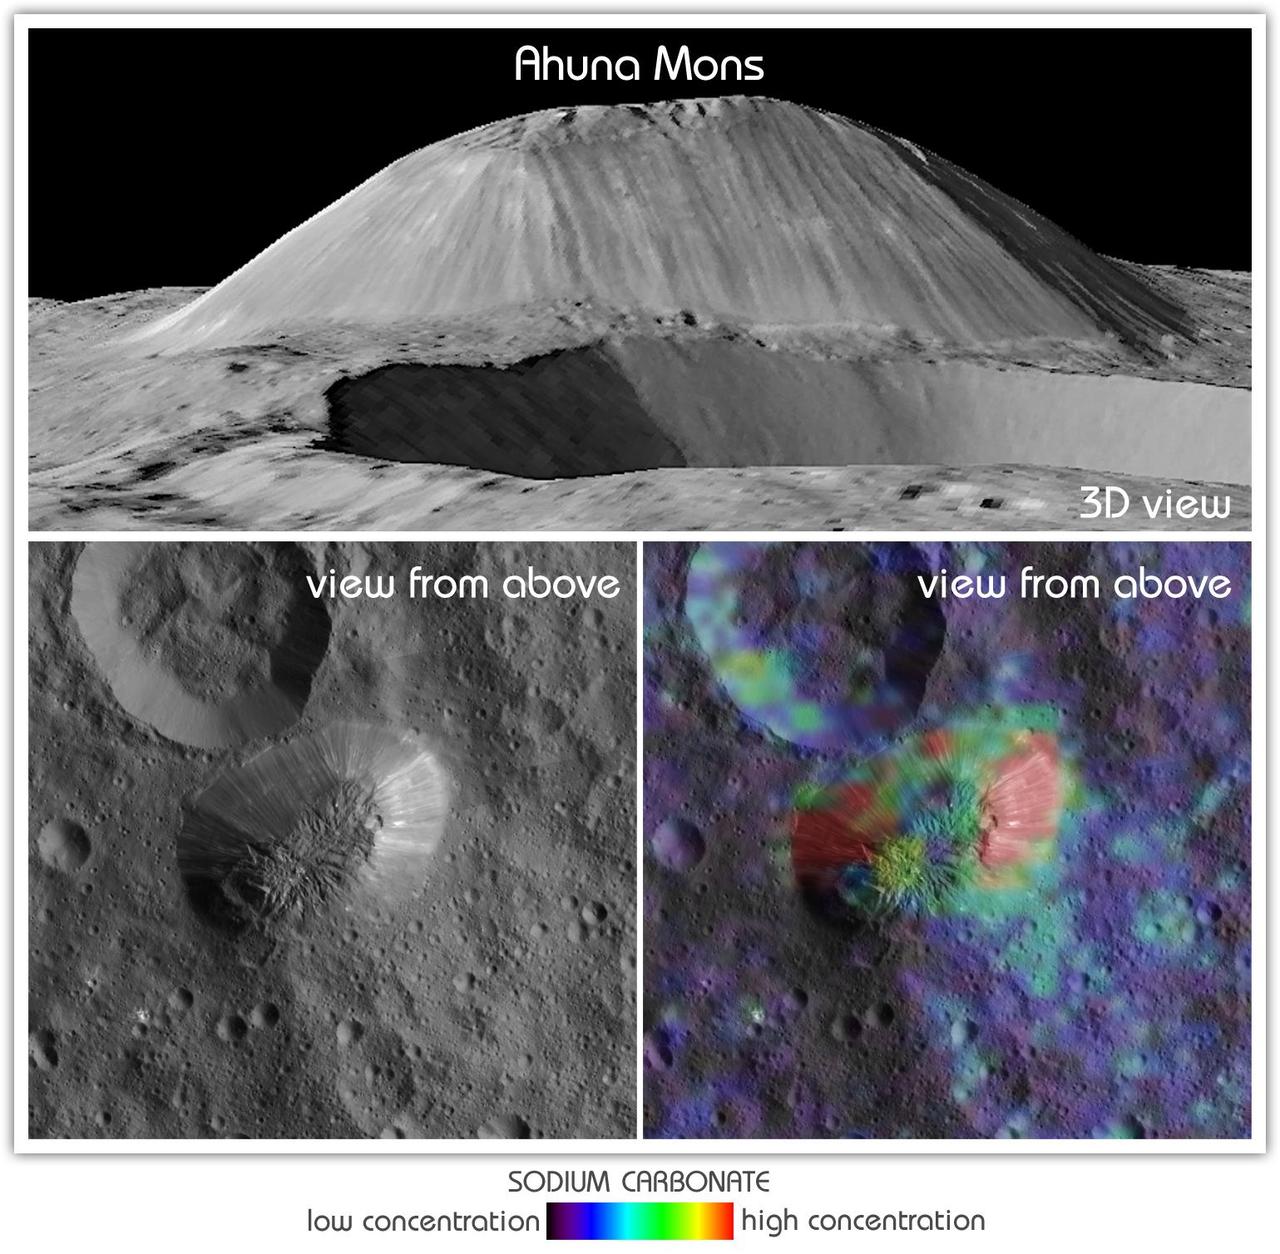
This view from NASA's Dawn mission shows Ceres' tallest mountain, Ahuna Mons, 2.5 miles (4 kilometers) high and 11 miles (17 kilometers) wide. This is one of the few sites on Ceres at which a significant amount of sodium carbonate has been found, shown in green and red colors in the lower right image. The top and lower left images were collected by Dawn's framing camera. The top image is a 3D view reconstructed with the help of topography data. A non-annotated version is available at https://photojournal.jpl.nasa.gov/catalog/PIA21919
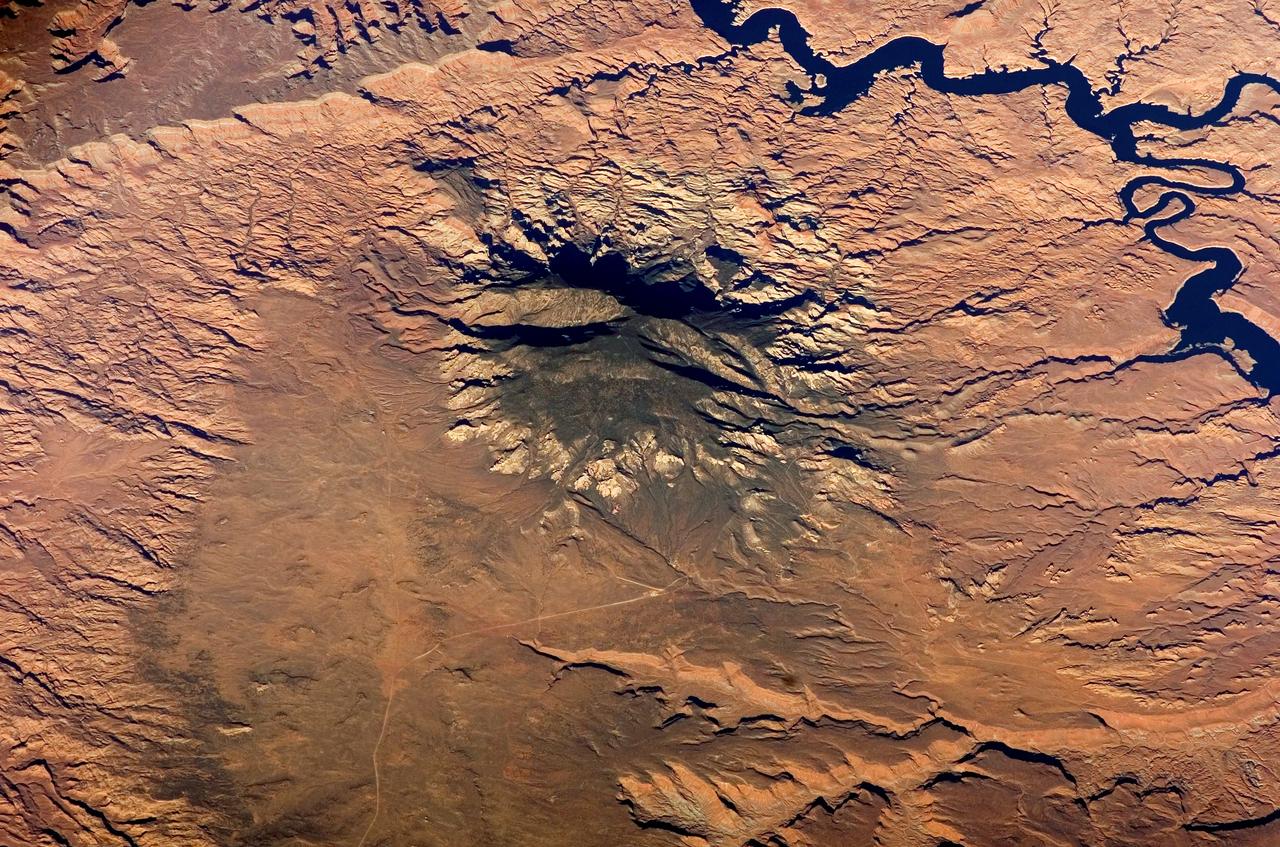
ISS012-E-05172 (14 October 2005) --- Navajo Mountain, Utah is featured in this image photographed by an Expedition 12 crewmember on the international space station. According to scientists, the Colorado Plateau of Arizona, Colorado, New Mexico, and Utah is characterized by mostly flat-lying sedimentary layers that record paleoclimate extremes ranging from oceans to widespread deserts over the last 1.8 billion years. Navajo Mountain is formed by a dome-shaped body of igneous rock (called a laccolith by geologists), one of several in southeast Utah that intrude and uplift the surrounding sedimentary layers of the Plateau. This oblique image highlights Navajo Mountain in the center of the image, surrounded by light red-brown Navajo Sandstone (also visible in canyons at bottom of image). Scientists believe the peak of Navajo Mountain, at approximately 3148 meters (10,388 feet) elevation, is comprised of uplifted Dakota Sandstone deposited during the Cretaceous Period. The establishment of Rainbow Bridge National Monument (1910), and the filling of Glen Canyon by Lake Powell in 1963 (upper right), have facilitated tourism and aesthetic appreciation of this previously remote region. Access to Navajo Mountain is still regulated by the sovereign Navajo Nation, and the process of permitting is required to hike in the region.
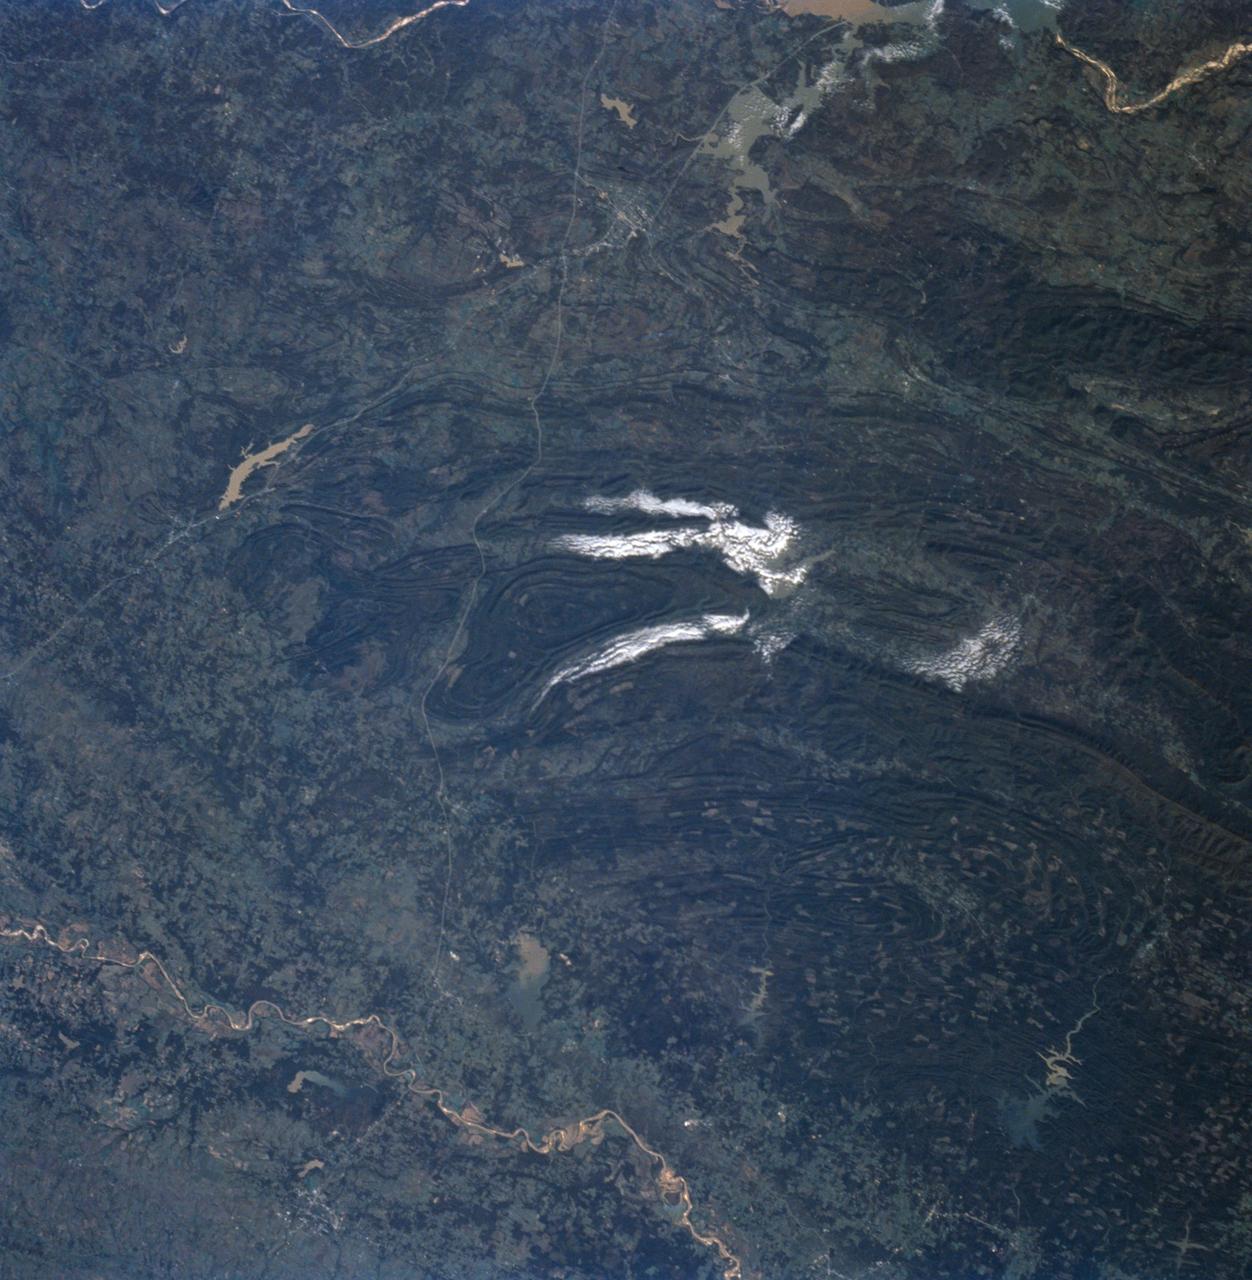
STS058-91-058 (18 Oct-1 Nov 1993) --- In this unusually clear view, the Ouachita Mountains of southeastern Oklahoma are framed on the north by Lake Eufaula on the South Canadian River, and on the south by the Red River. Sandstone, shale and chert (similar to flint) deposited in a sea several thousand feet deep were squeezed up to form the mountains about 250 million years ago. During the ensuing time, erosion of the western end of the Ouachita Mountains has emphasized linear ridges of resistant rock in the plunging anticlines and synclines, causing relief of 800 meters (2,600 feet) or more. Clouds formed by upslope winds border both the north and south sides of one of the most dramatic plunging synclines (in a syncline the rock layers dip toward the center of the structure). Toward the west, densely forested mountains give way to gently rolling, less rocky terrain and a drier climate which is better suited to farming. The mountains centered on Broken Bow, in the lower right corner of the scene, display abundant timber clearcuts that are being regenerated.

jsc2024e066518 (11/1/2023) --- Mesa Publc School students work together presenting their critical design review to their industry partners Honeywell Aerospace Technologies in their successful bid to be a finalist for the Nanoracks-National Center for Earth and Space Science Education-Surveyor-Student Spaceflight Experiments Program Mission 18 to ISS (Nanoracks-NCESSE-Surveyor-SSEP). Their experiment is The Growth and Mutation of Staphylococcus epidermidis Biofilm in Microgravity.
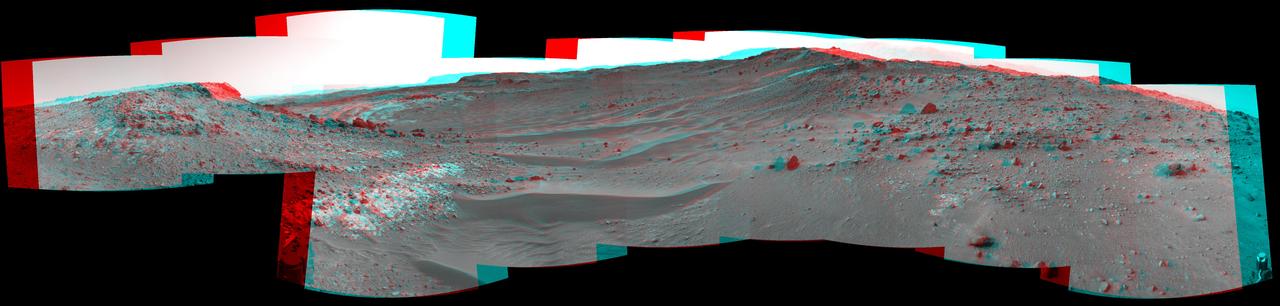
This stereo view from the Navigation Camera (Navcam) on NASA's Curiosity Mars rover shows the terrain ahead of the rover as it makes its way westward through a valley called "Artist's Drive." The image appears three-dimensional when viewed through red-blue glasses with the red lens on the left. The Navcam recorded the component images of this mosaic on April 10, 2015, during the 951st Martian Day, or sol, of Curiosity's work on Mars. The valley is on the rover's route toward a higher site on Mount Sharp than the "Pahrump Hills" area the mission investigated at the base of the layered mountain. http://photojournal.jpl.nasa.gov/catalog/PIA19165
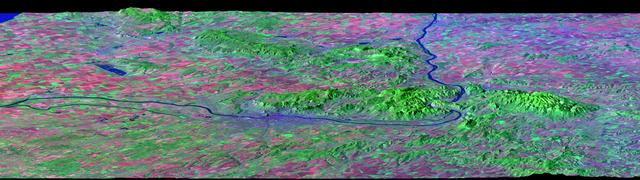
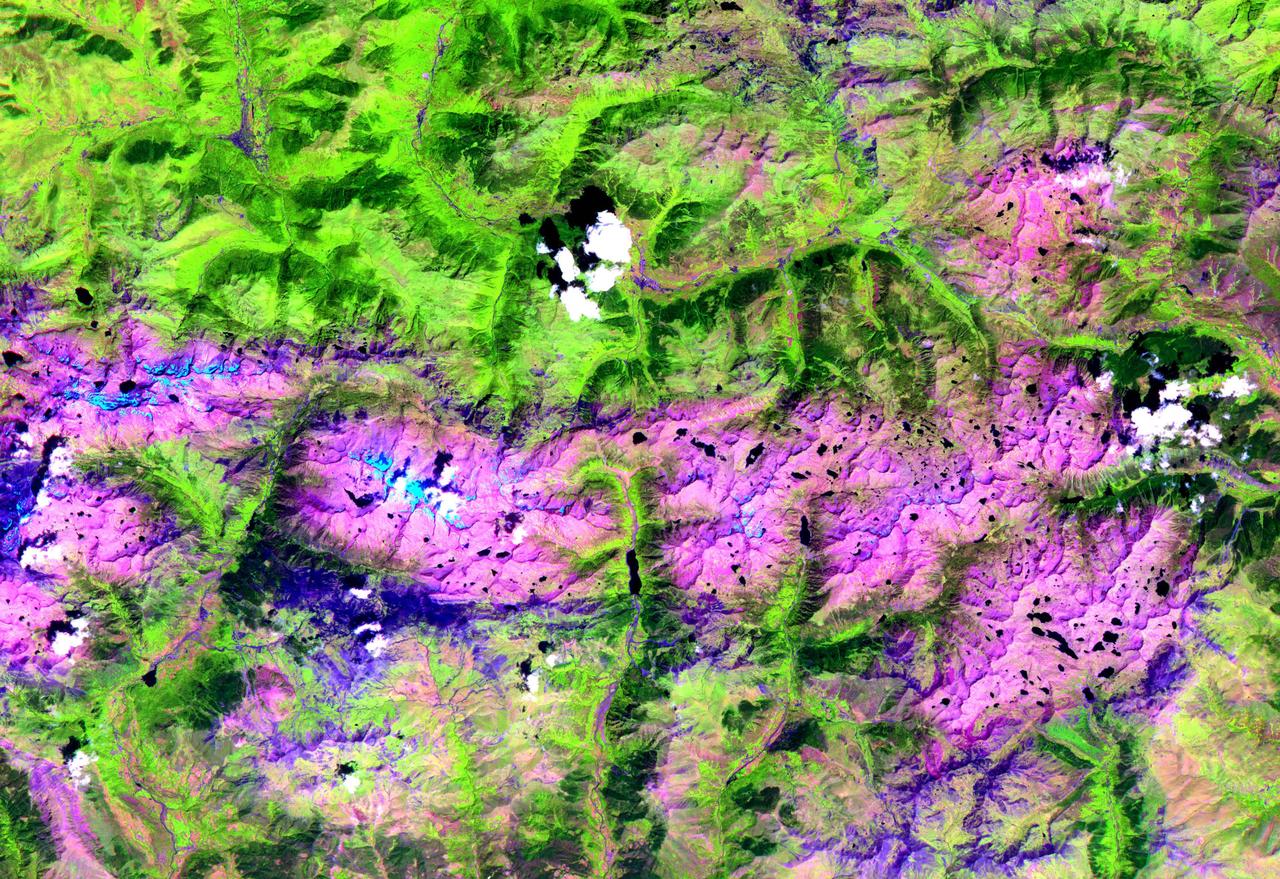
After draining the northern flank of the Alps Mountains in Germany and Austria, the Danube River flows east as it enters this west-looking scene (upper right) and forms the border between Slovakia and Hungary. The river then leaves the border as it enters Hungary and transects the Transdanubian Mountains, which trend southwest to northeast. Upon exiting the mountains, the river turns southward, flowing past Budapest (purplish blue area) and along the western margin of the Great Hungarian Plain. South and west of the Danube, the Transdanubian Mountains have at most only about 400 meters (about 1300 feet) of relief but they exhibit varied landforms, which include volcanic, tectonic, fluvial (river), and eolian (wind) features. A thick deposit of loess (dust deposits likely blown from ancient glacial outwash) covers much of this area, and winds from the northwest, funneled between the Alps and the Carpathian Mountains, are apparently responsible for a radial pattern of erosional streaks across the entire region. This image was generated from a Landsat satellite image draped over an elevation model produced by the Shuttle Radar Topography Mission (SRTM). The view uses a 3-times vertical exaggeration to enhance topographic expression. The false colors of the scene result from displaying Landsat bands 1, 4, and 7 in blue, green, and red, respectively. Band 1 is visible blue light, but bands 4 and 7 are reflected infrared light. This band combination maximizes color contrasts between the major land cover types, namely vegetation (green), bare ground (red), and water (blue). Shading of the elevation model was used to further highlight the topographic features. http://photojournal.jpl.nasa.gov/catalog/PIA04952

AS09-26A-3781A (11 March 1969) --- Colored infrared photograph of the mouth of the Colorado River in northern Baja California and Sonora, Mexico, as seen from Apollo 9 spacecraft during its 121st revolution of Earth. Photographed from an altitude of 130 nautical miles, at 16:14 GMT, on March 11, 1969. Color infrared film is designed to render healthy green foliage as tones of red, such as the red checker-board patterns in the irrigated farm lands along the Colorado River. Red hues of vegetation can be seen in the valleys and on the slopes of the San Pedro Martia and Juarez Mountains, at left. White ribbon-like salt lakes near the river mouth and the wide expanse of sand dunes in the Great Desert, at right, are evidence of the arid climate. Light colors of silt bands in the waters of the Gulf of California reflect currents and water depths. The town of San Felipe is on the Gulf coast at lower left.
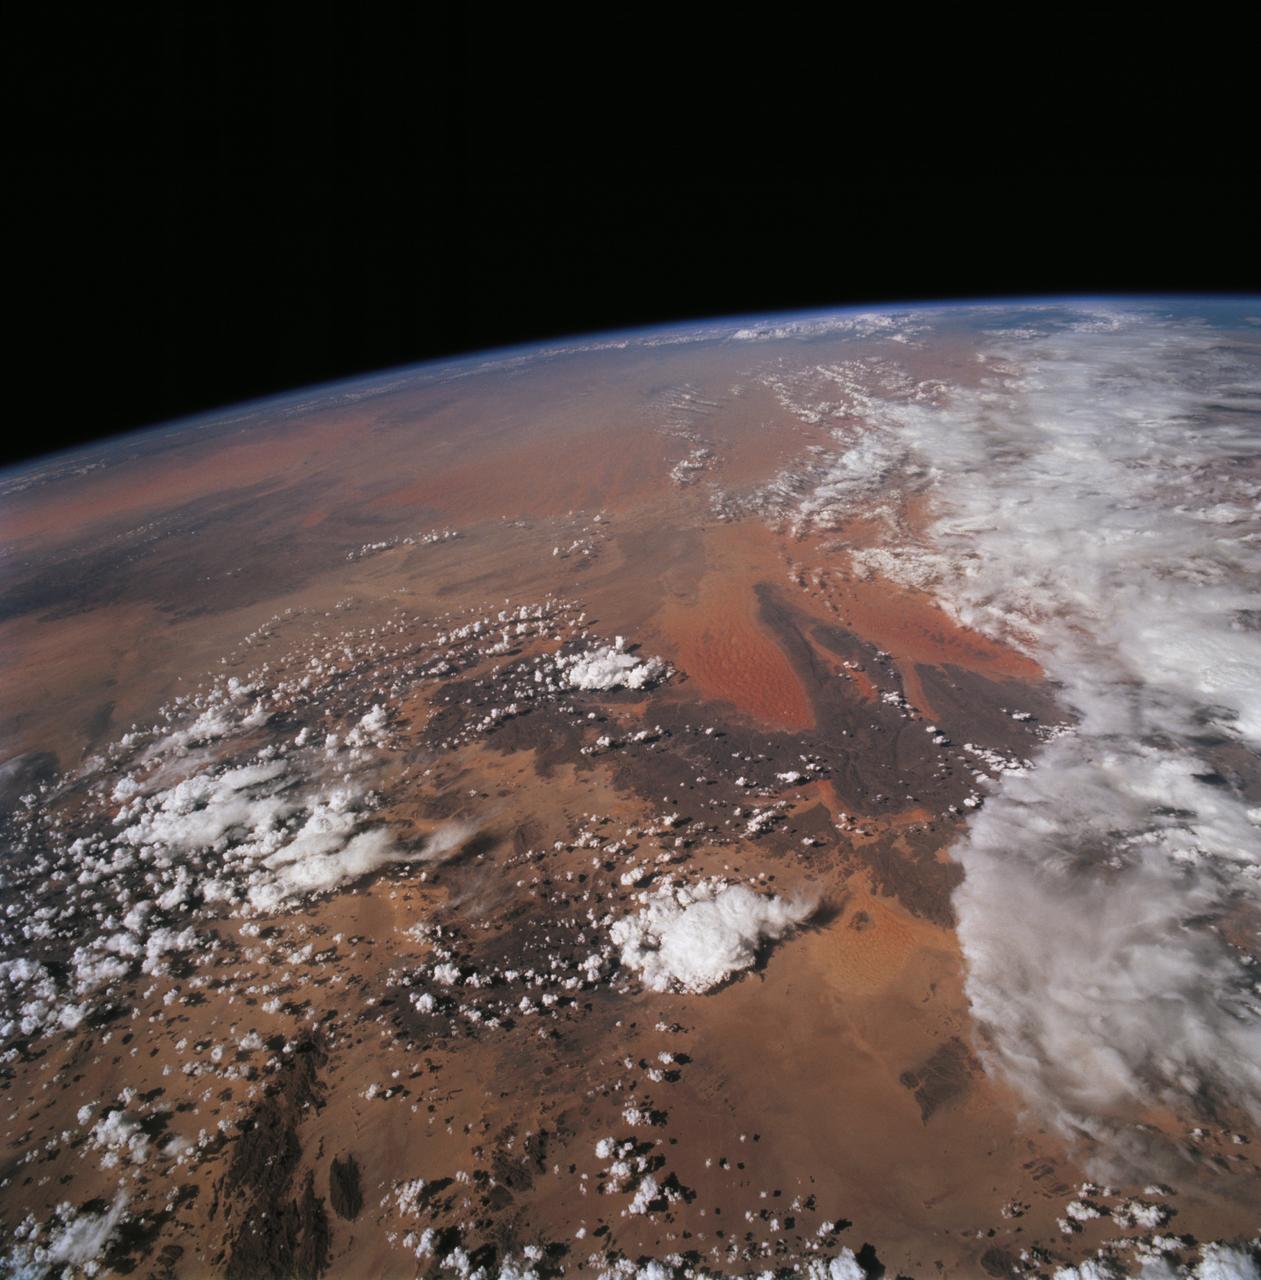
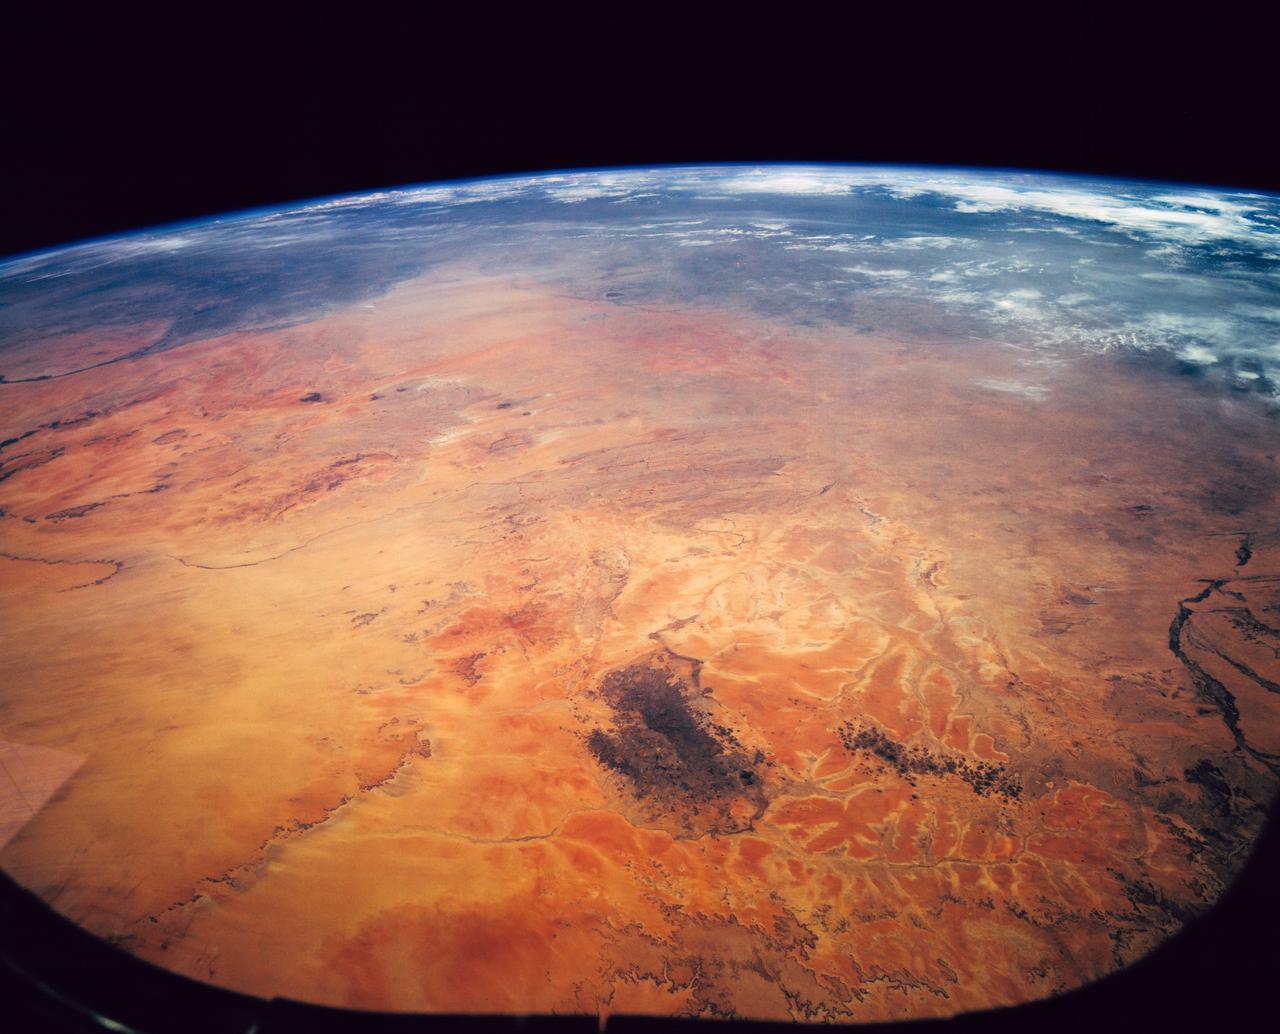
STS068-228-081 (30 September-11 October 1994) --- This northwest-looking view shows central Algeria with an unusual amount of cloud cover, responsible for one of the infrequent bouts of rain in the Sahara Desert. The lope-shaped, red sand dunes mass in the center of the view is one of the most prominent features in the Sahara as seen from the Space Shuttle Endeavour. It is known as the Tifernine Dunes. The Atlas Mountains (top) are only apparent in this view because of the clouds, which cap their summits.

This map from NASA's Dawn mission shows locations of bright material on dwarf planet Ceres. There are more than 300 bright areas, called "faculae," on Ceres. Scientists have divided them into four categories: bright areas on the floors of crater (red), on the rims or walls of craters (green), in the ejecta blankets of craters (blue), and on the flanks of the mountain Ahuna Mons (yellow). https://photojournal.jpl.nasa.gov/catalog/PIA21914

ISS011-E-13889 (30 September 2005) --- Wasatch Range, Utah is featured in this image photographed by an Expedition 11 crewmember on the international space station. The Wasatch Range forms an impressive backdrop to the Salt Lake City metropolitan area, and is a frequent destination for hikers, backpackers, and skiers. The range is considered to be the westernmost part of the Rocky Mountains, and rises to elevations of approximately 3600 meters (12,000 feet) above sea level. This photograph, taken at the end of September, captures red- (maple trees) and gold-mantled (aspen trees) hill slopes along the western mountain front to the south of Salt Lake City. Other common tree species at these elevations include pine, fir, spruce, willow, birch, and oak. A portion of Draper City is visible in the left half of the image. The elevation of Lone Peak, visible at upper right, is approximately 3410 meters (11,253 feet).
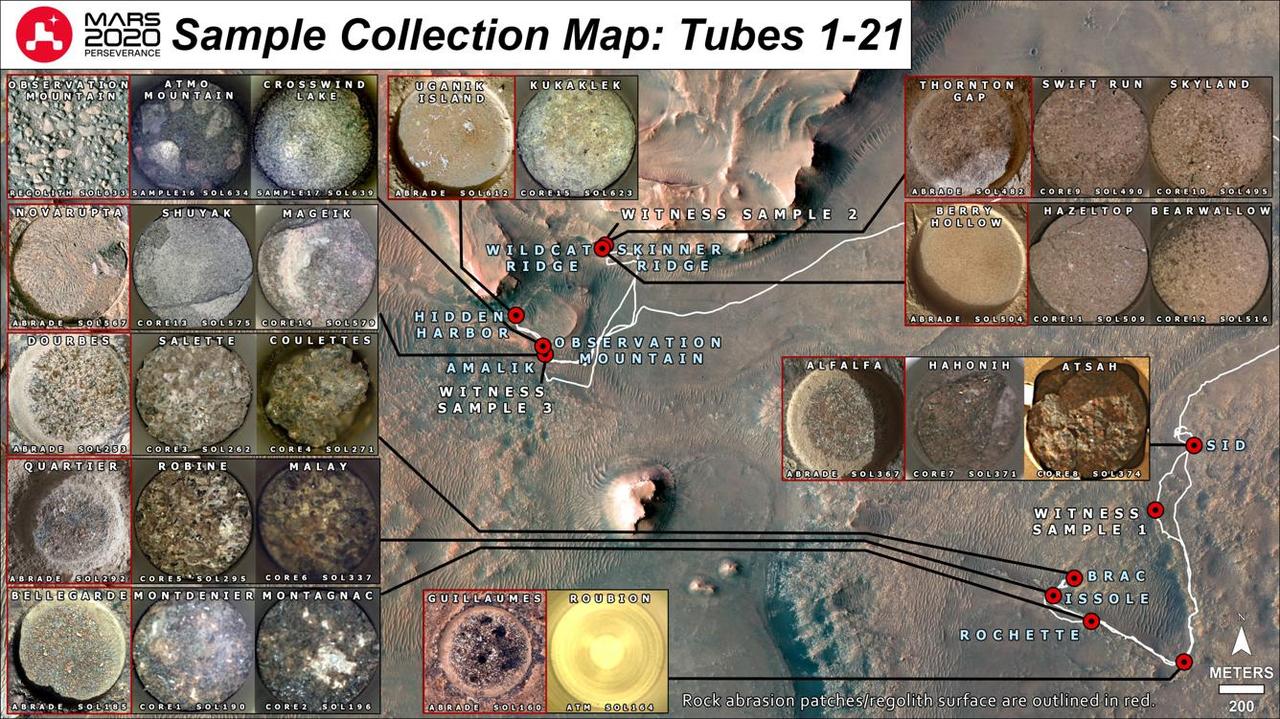
Shown here is a representation of the 21 sample tubes (containing rock, regolith, atmosphere, and witness materials) that have been sealed to date by NASA's Perseverance Mars rover. Red dots indicate the locations where each sample was collected. Squares outlined in red show the texture of an area about 2 inches (5 centimeters) across on a particular rock sample after it was worn down by the rover's abrasion tool (with the exception of "Observation Mountain," which is an image of the surface of a pile of regolith, or broken rock and dust). The one or two squares immediately to the right of each red-outlined square shows an image of the top of each sample tube after the sample was acquired. A key objective for Perseverance's mission on Mars is astrobiology, including the search for signs of ancient microbial life. The rover will characterize the planet's geology and past climate, pave the way for human exploration of the Red Planet, and be the first mission to collect and cache Martian rock and regolith (broken rock and dust). Subsequent NASA missions, in cooperation with ESA (European Space Agency), would send spacecraft to Mars to collect these sealed samples from the surface and return them to Earth for in-depth analysis. The Mars 2020 Perseverance mission is part of NASA's Moon to Mars exploration approach, which includes Artemis missions to the Moon that will help prepare for human exploration of the Red Planet. https://photojournal.jpl.nasa.gov/catalog/PIA25674
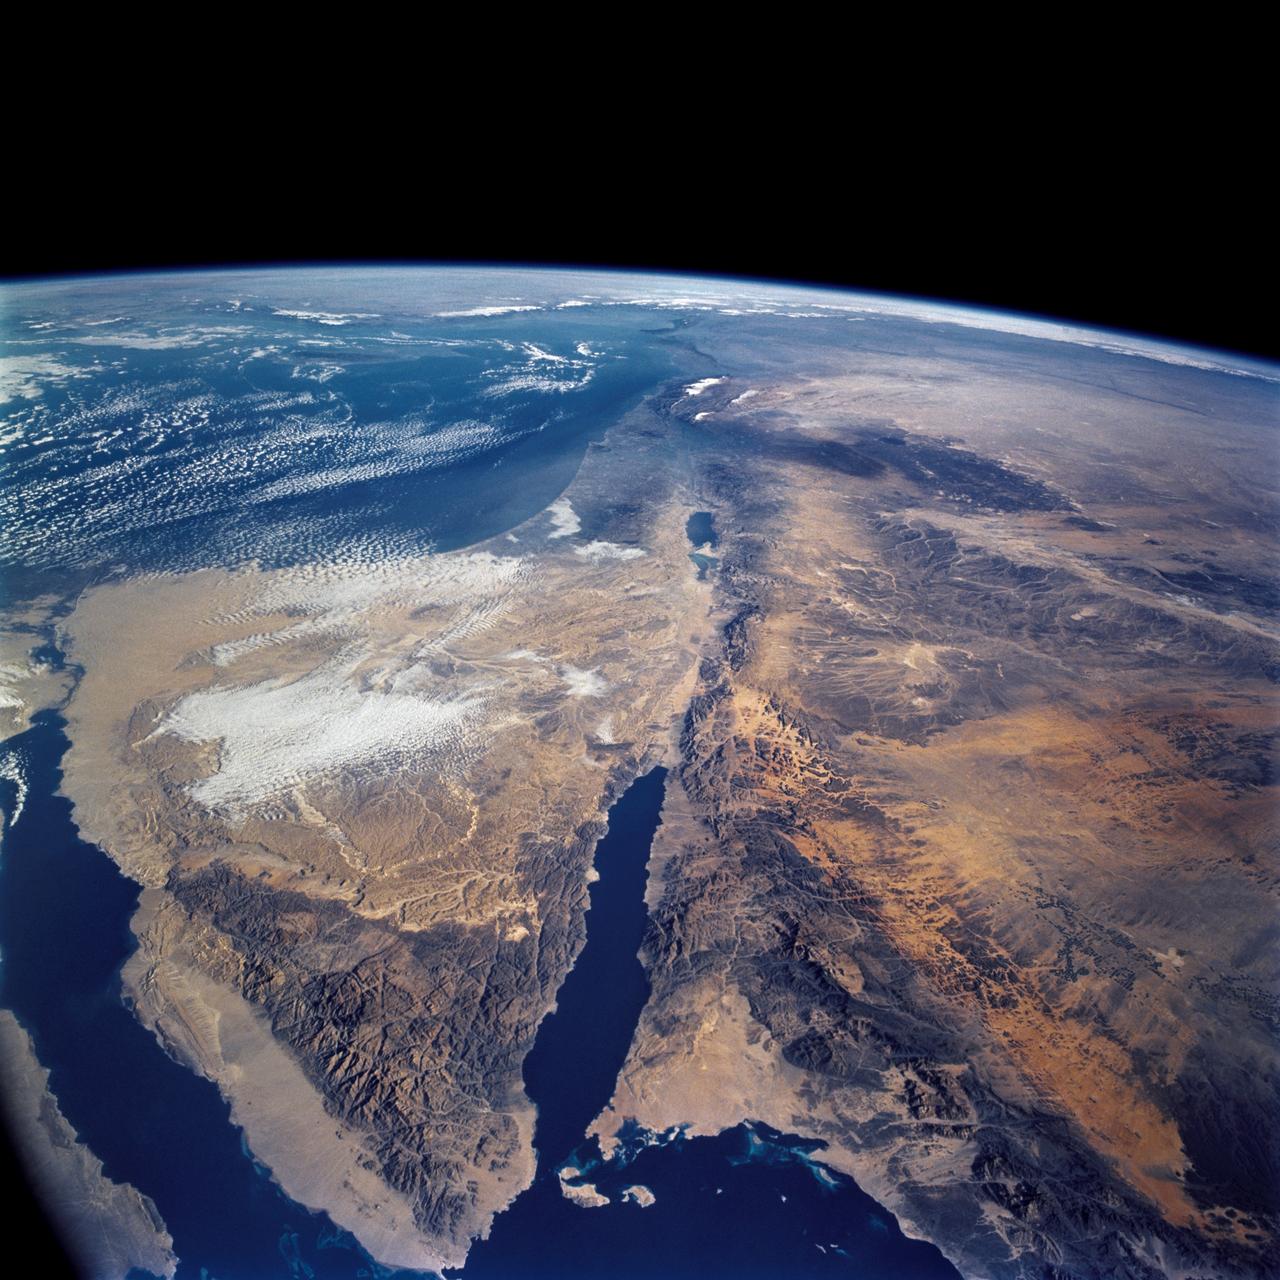
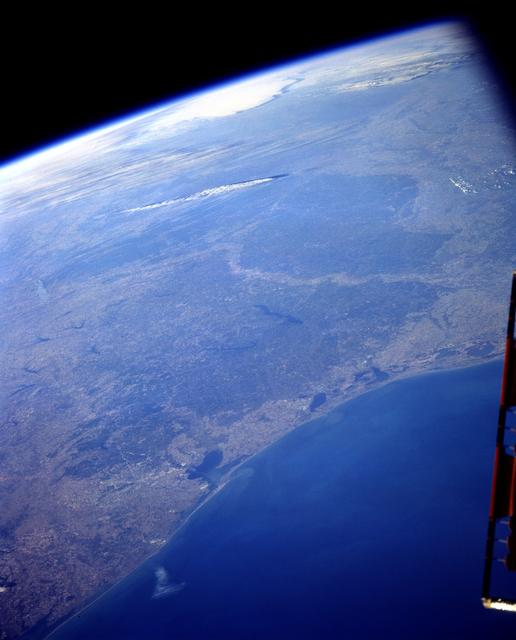
STS109-708-024 (1-12 March 2002) --- The astronauts on board the Space Shuttle Columbia took this 70mm picture featuring the Sinai Peninsula and the Dead Sea Rift. The left side of the view is dominated by the great triangle of the Sinai peninsula, which is partly obscured by an unusual cloud mass on this day. The famous Monastery of St. Catherine lies in the very remote, rugged mountains in the southern third of the peninsula (foreground). The Gulf of Aqaba is a finger of the Red Sea bottom center, pointing north to the Dead Sea, the small body of water near the center of the view. According to NASA scientists studying the STS-109 photo collection, the gulf and the Dead Sea are northerly extensions of the same geological rift that resulted in the opening of the Red Sea . The Gulf of Suez appears in the lower left corner. Northwest Saudi Arabia occupies the lower right side of the view, Jordan and Syria the right and top right, and the Eastern Mediterranean Sea the top left. Thin white lines of cloud have formed along the coastal mountains of southern Turkey and stretch across the top of the view near the Earth's limb.
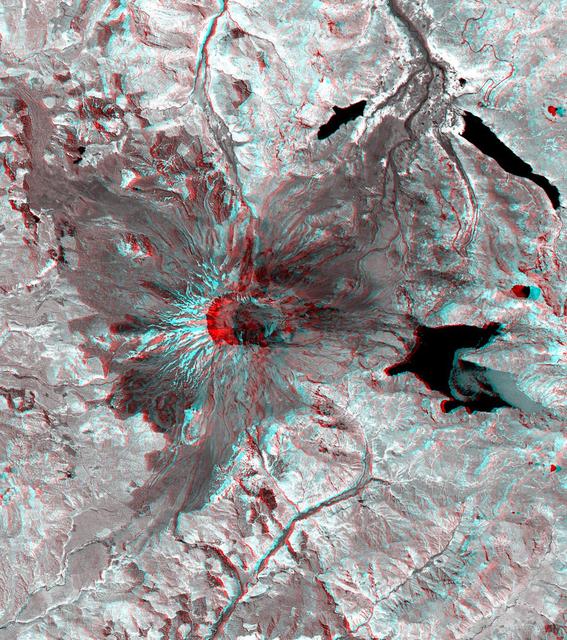
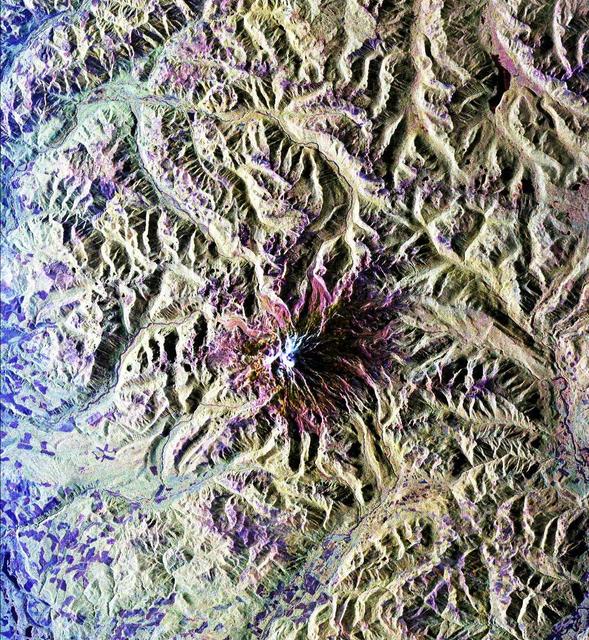
This 3-D anaglyph image of Mt. St. Helens volcano combines the nadir-looking and back-looking band 3 images of ASTER. To view the image in stereo, you will need blue-red glasses. Make sure to look through the red lens with your left eye. This ASTER image of Mt. St. Helens volcano in Washington was acquired on August 8, 2000 and covers an area of 37 by 51 km. Mount Saint Helens, a volcano in the Cascade Range of southwestern Washington that had been dormant since 1857, began to show signs of renewed activity in early 1980. On 18 May 1980, it erupted with such violence that the top of the mountain was blown off, spewing a cloud of ash and gases that rose to an altitude of 19 kilometers. The blast killed about 60 people and destroyed all life in an area of some 180 square kilometers (some 70 square miles), while a much larger area was covered with ash and debris. It continues to spit forth ash and steam intermittently. As a result of the eruption, the mountain's elevation decreased from 2,950 meters to 2,549 meters. The image is centered at 46.2 degrees north latitude, 122.2 degrees west longitude. http://photojournal.jpl.nasa.gov/catalog/PIA11160

Data from NASA's ECOSTRESS (Ecosystem Spaceborne Thermal Radiometer Experiment on Space Station) instrument aboard the International Space Station shows three wildfires burning in the mountains east and southeast of the Los Angeles area on Sept. 10, 2024. The Bridge Fire started Sept. 8 in the Angeles National Forest during an intense heat wave that blanketed the area for about a week. As of Sept. 13, the fire was only 3% contained. The Line Fire started Sept. 5 in Highland, within San Bernardino County, and spread toward the mountain communities of Running Springs and Big Bear. After more than a week of battling the blaze, firefighters had the conflagration 21% contained. The Airport Fire ignited Sept. 9 in the foothills of the Santa Ana Mountains east of the Orange County city of Irvine and spread into Riverside County. As of Sept. 13, it was 8% contained. The ECOSTRESS instrument measures the temperature of the land rather than air temperatures that most people are familiar with in weather forecasts. Bright white spots in the active fire areas in the visual above indicate a land surface temperature of over 300 degrees Fahrenheit (149 degrees Celsius). Dark red represents areas closer to 100 F (38 C). https://photojournal.jpl.nasa.gov/catalog/PIA26187
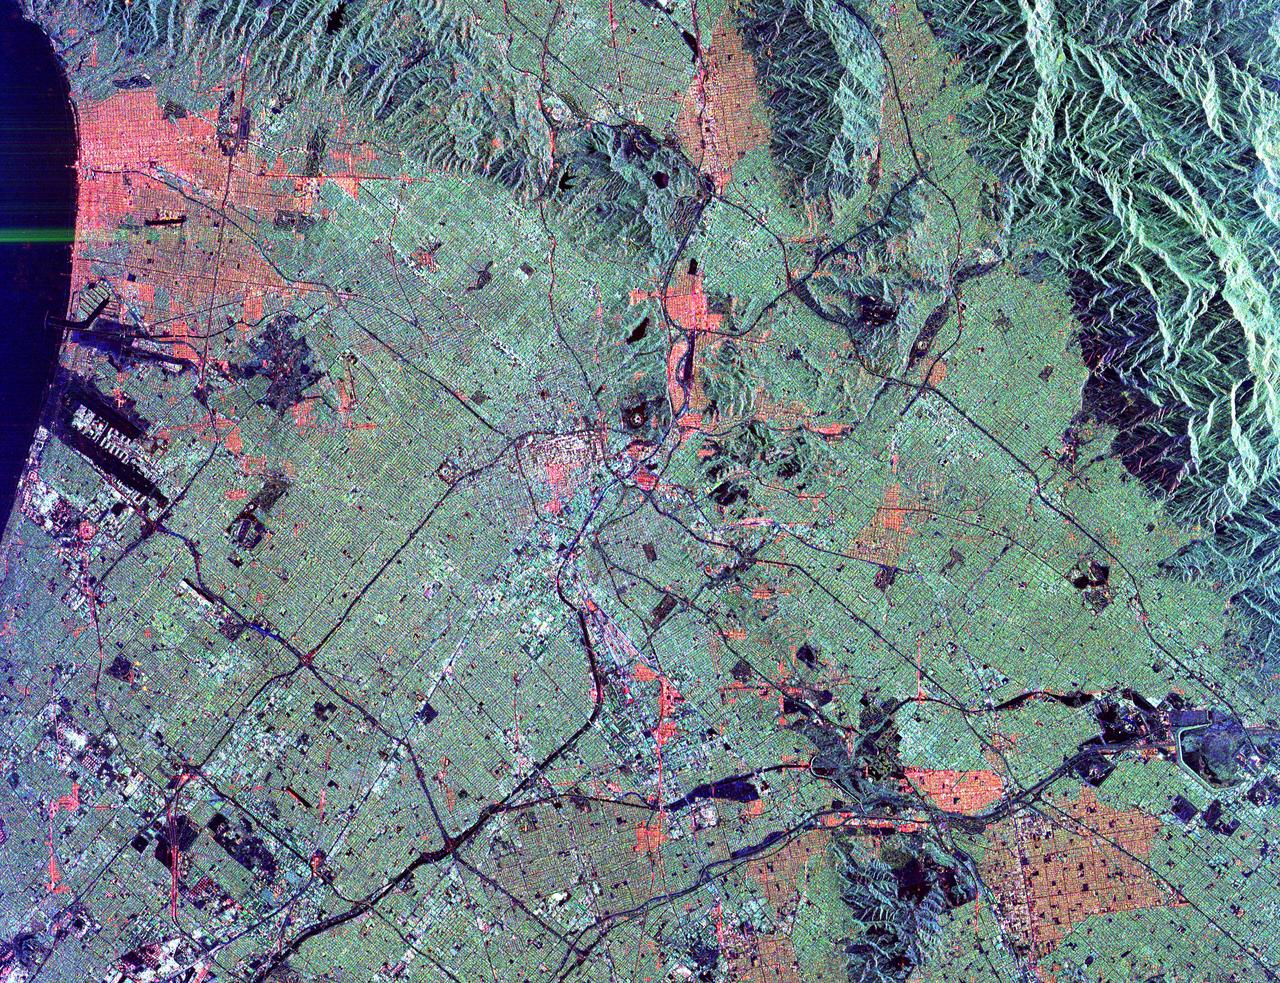
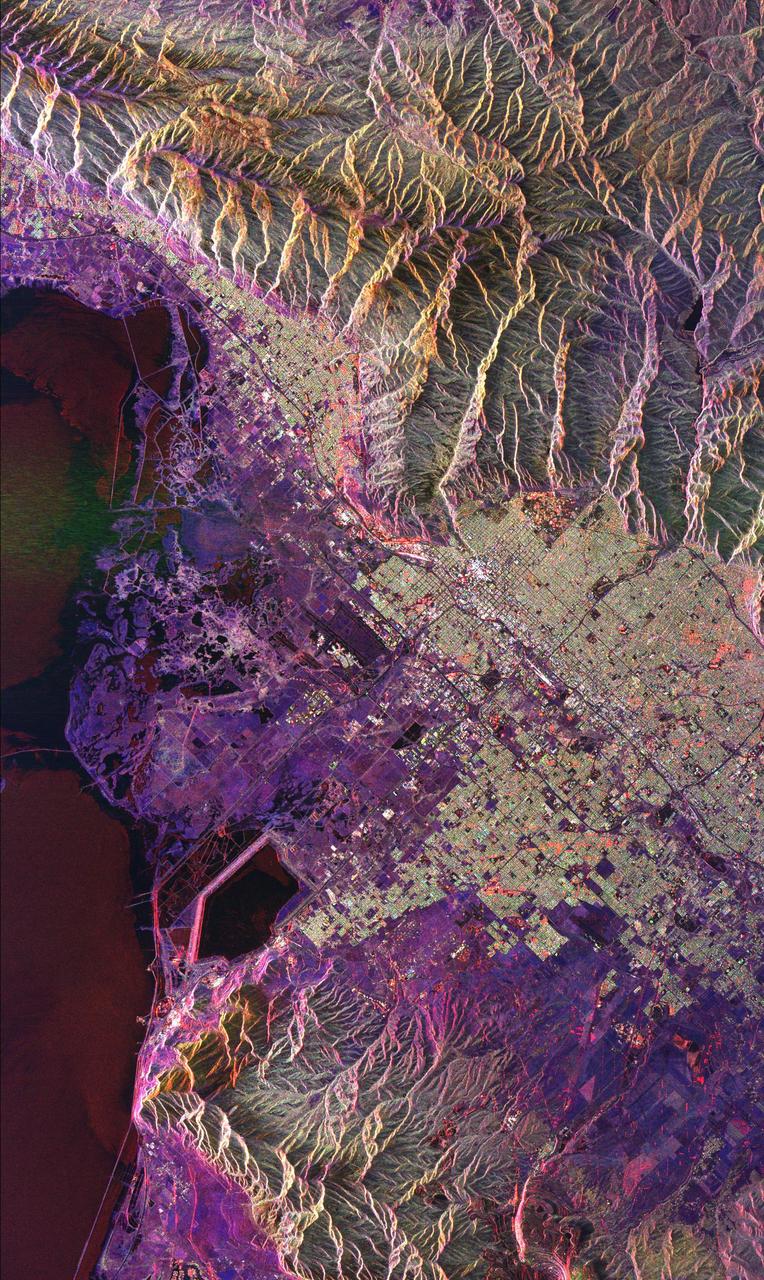
This radar image shows the massive urbanization of Los Angeles, California. The image extends from the Santa Monica Bay at the left to the San Gabriel Mountains at the right. Downtown Los Angeles is in the center of the image. The runways of the Los Angeles International Airport appear as black strips at the left center of the image. The waterways of Marina del Rey are seen just above the airport. The San Gabriel Mountains and the city of Pasadena are at the right center of the image. Black areas on the mountains on the right are fire scars from the 1993 Altadena fire. The Rose Bowl is shown as a small circle near the right center. The complex freeway system is visible as dark lines throughout the image. Some city areas, such as Santa Monica in the upper left, appear red due to the alignment of streets and buildings to the incoming radar beam. The image was acquired by the Spaceborne Imaging Radar-C/X-band Synthetic Aperture Radar (SIR-C/X-SAR) onboard the space shuttle Endeavour on October 3, 1994. SIR-C/X-SAR, a joint mission of the German, Italian and the United States space agencies, is part of NASA's Mission to Planet Earth. This image is centered at 34.04 degrees North latitude and 118.2 degrees West longitude with North pointing toward the upper right. The area shown measures 40 kilometers by 50 kilometers (25 miles by 31 miles). http://photojournal.jpl.nasa.gov/catalog/PIA01789
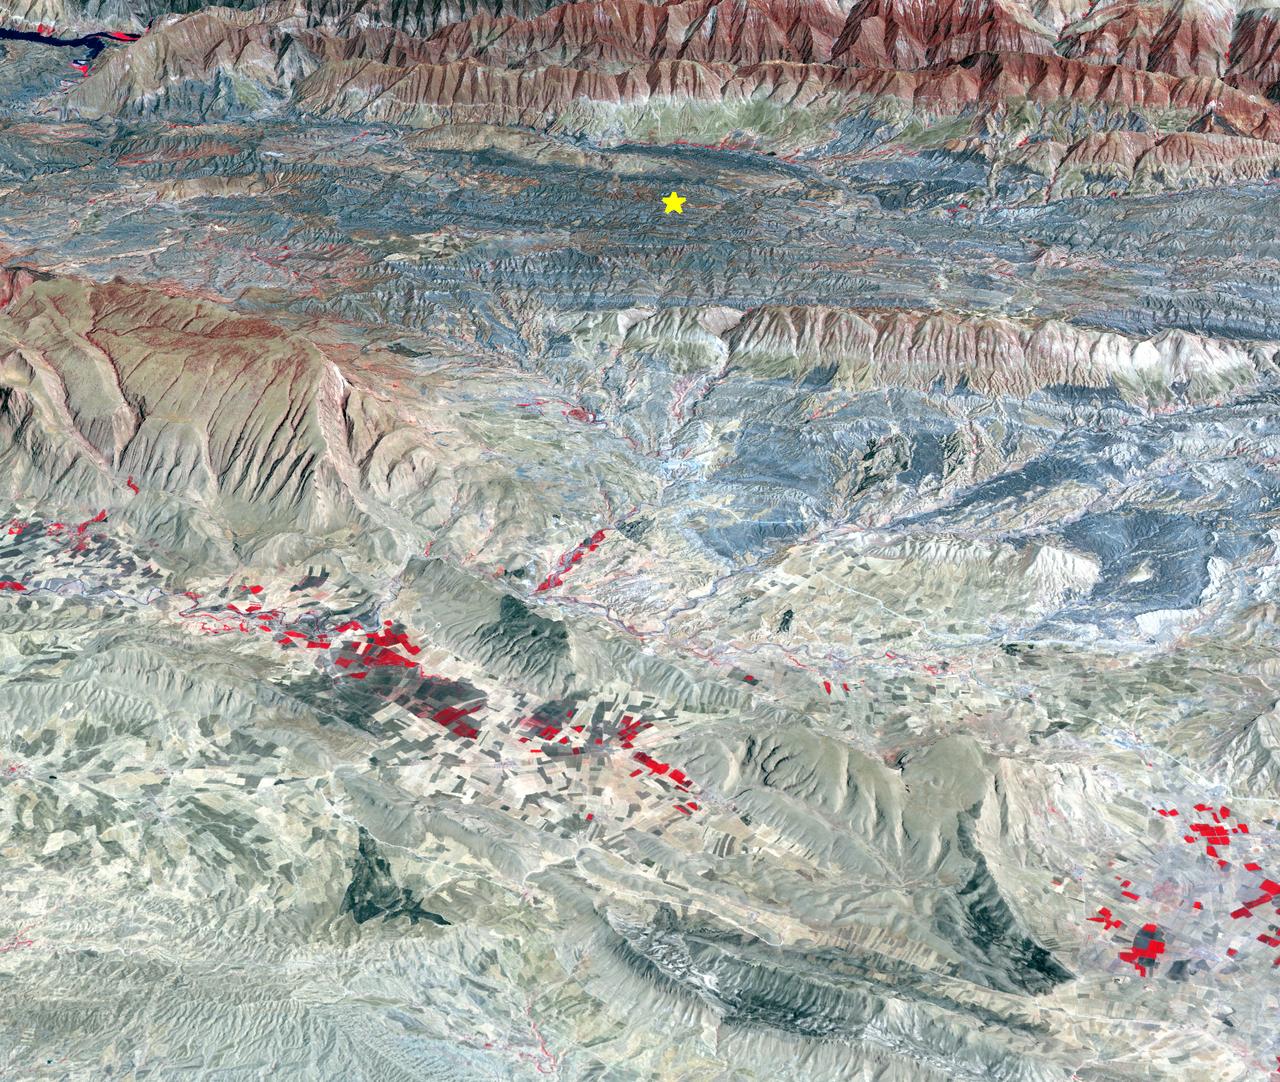
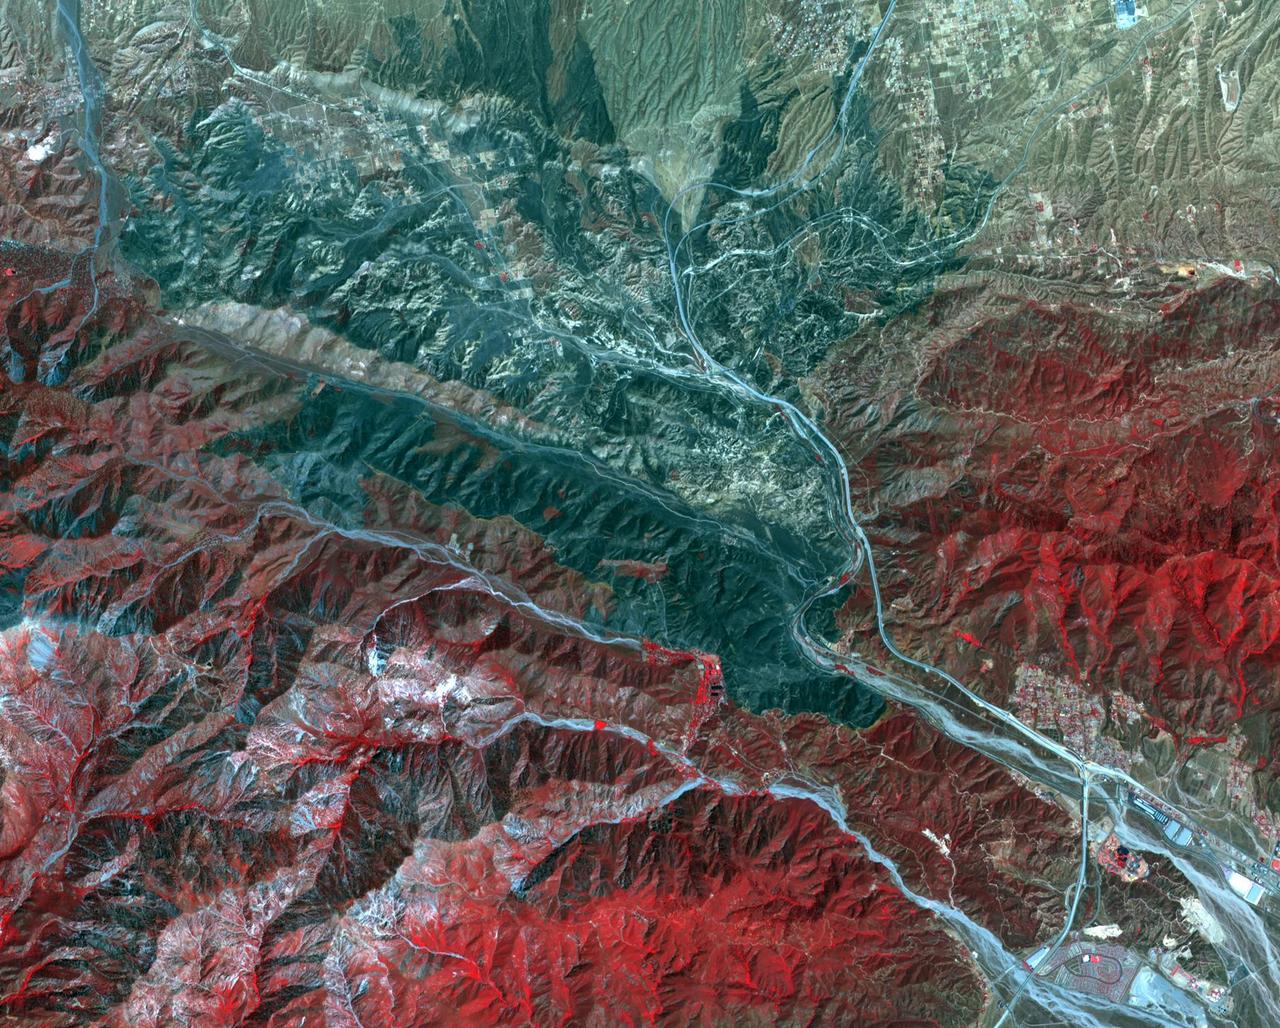
On Sunday, Nov. 12, 2017, a magnitude 7.3 earthquake struck along the Iran-Iraq border near Halabjah, Iraq. The earthquake was felt as far away as Kuwait, Qatar, Turkey, Lebanon and Israel. Extensive damage and numerous casualties were reported in the area near the epicenter (yellow star on image). The earthquake occurred along the boundary between the Arabian and Eurasian tectonic plates. This is an earthquake-prone area, and has experienced many deadly earthquakes in the past. In this perspective-view image, bright red areas are crops in fields, pale red on mountain ridges are shrubs and trees, dark gray areas are traces of earlier brush fires, and gray and tan colors are different rock types. The image was acquired Sept. 8, 2017, and the star marks the earthquake epicenter at 34.9 degrees north, 45.9 degrees east. https://photojournal.jpl.nasa.gov/catalog/PIA22112
STS103-501-104 (19-27 December 1999) --- One of the astronauts aboard the Earth-orbiting Space Shuttle Discovery used a handheld large format camera to photograph this scene which stretches from the Gulf of Mexico into Oklahoma. Parts of Louisiana and Arkansas are also visible in the frame. The Red River snakes its way through the East Texas Piney Woods (center). The river meets with the southern edge of the Ouachita folded mountains of southern Oklahoma. The white, linear feature north of the Red River is most likely a jet stream cloud, according to Earth scientists who studied the STS-103 collection at the Johnson Space Center (JSC). Jet contrails can be seen flying over the clouds. Along the Texas Gulf Coast are Galveston Bay and the greater Houston metropolitan area.
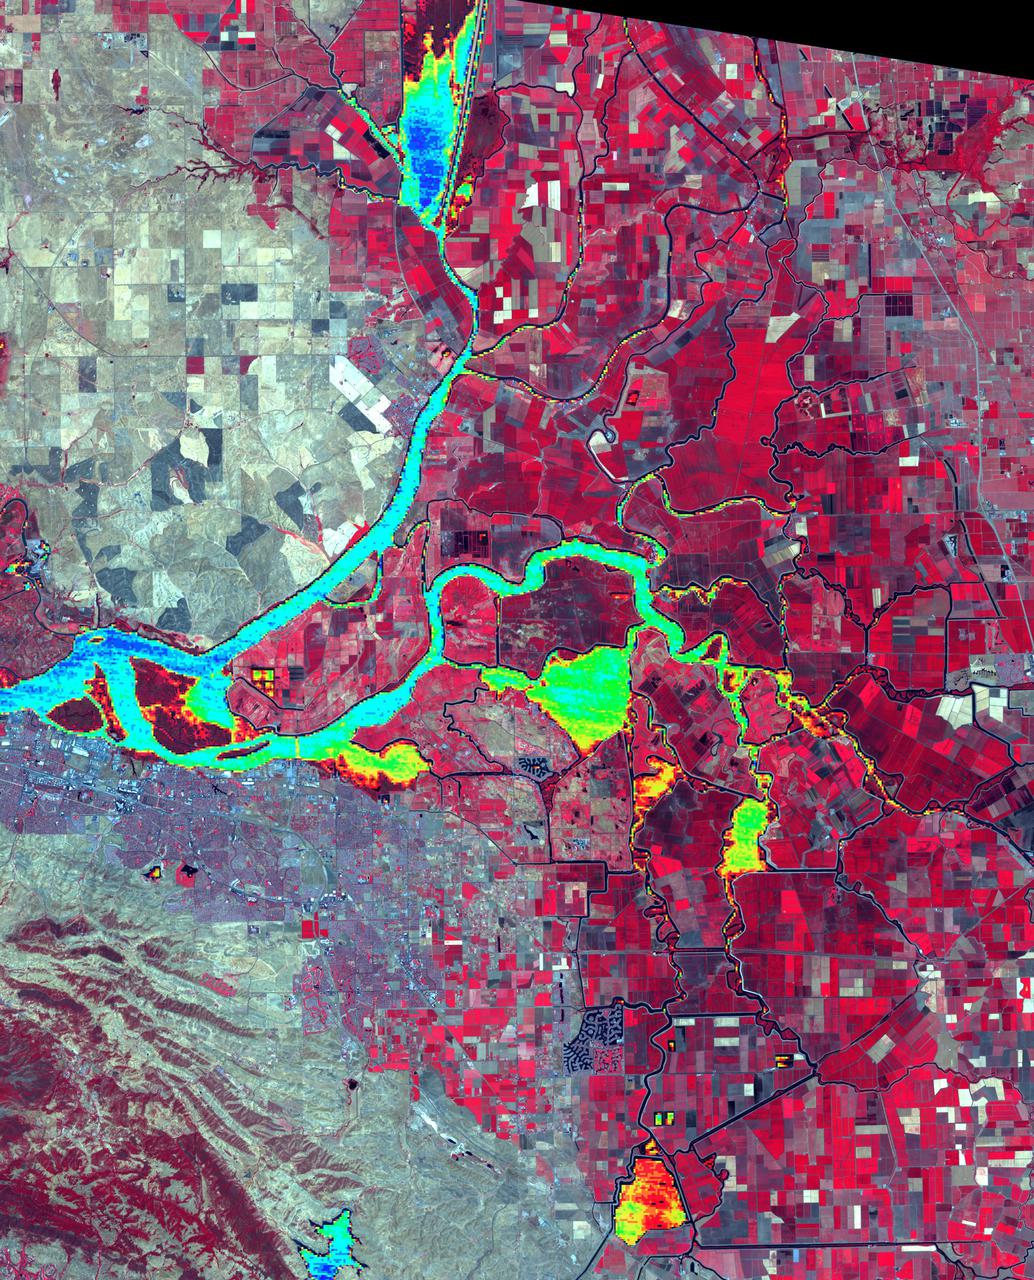
The Sacramento-San Joaquin River Delta, CA (or California Delta) has an area of about 3000 km2, and provides a large fraction of all the water used in California. The Delta drains about 50% of the water coming from the Sierra Nevada Mountains, and channels it through San Francisco's Golden Gate to the Pacific Ocean. Thousands of miles of levees now carefully control the Delta's flow, to maximize water use. The image combines a false color infrared composite (with vegetation depicted in red) with a colorized thermal infrared band to show the water temperature for the larger water bodies. Warmer temperatures are red and yellow, cooler water temperatures are blue and green. The image was acquired July 3, 2012, covers an area of 46.5 by 57.5 km, and is located at 38.1 degrees north, 121.3 degrees west. https://photojournal.jpl.nasa.gov/catalog/PIA24691
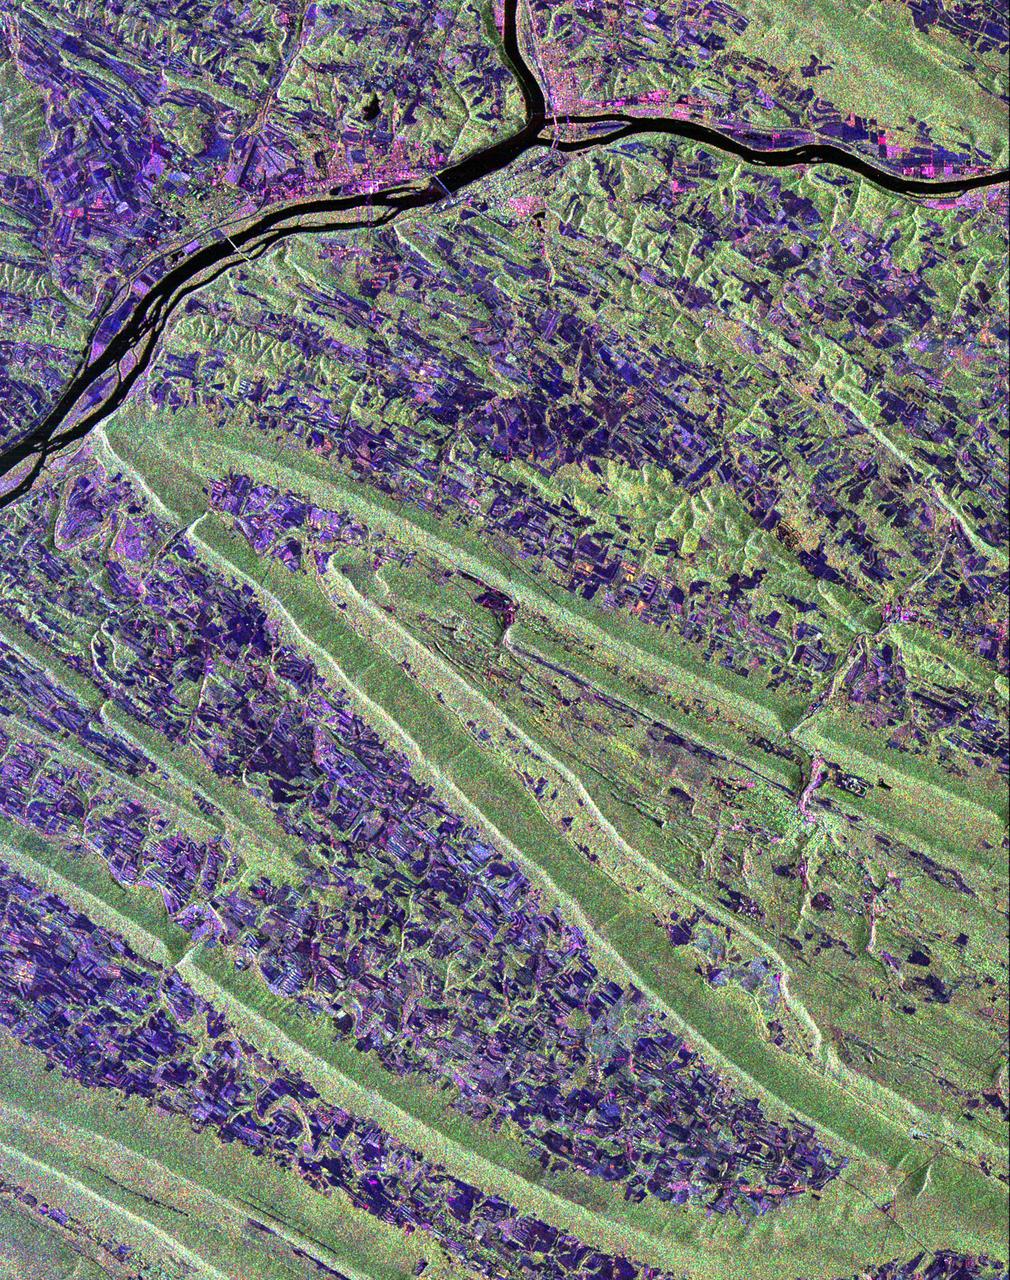
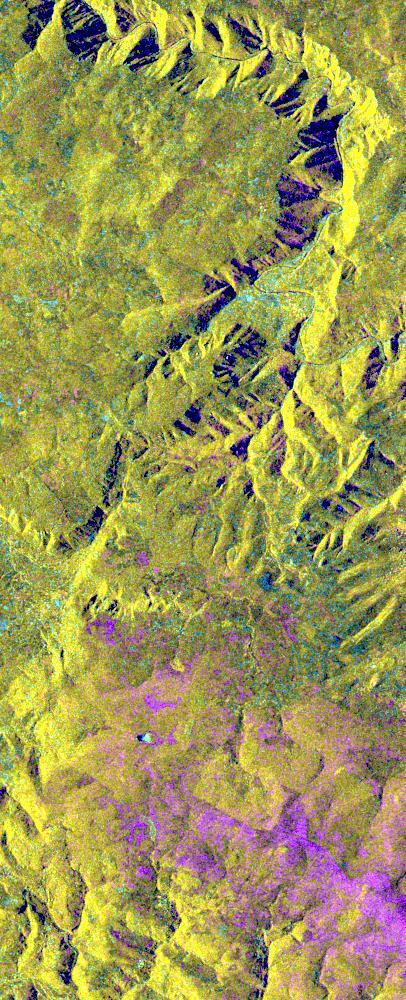
Scientists are using this radar image of the area surrounding Sunbury, Pennsylvania to study the geologic structure and land use patterns in the Appalachian Valley and Ridge province. This image was collected on October 6, 1994 by the Spaceborne Imaging Radar-C/ X-Band Synthetic Aperture Radar (SIR-C/X-SAR) on orbit 102 of the space shuttle Endeavour. The image is centered on latitude 40.85 degrees North latitude and 76.79 degrees West longitude. The area shown is approximately 30.5 km by 38 km. (19 miles by 24 miles). North is towards the upper right of the image. The Valley and Ridge province occurs in the north-central Appalachians, primarily in Pennsylvania, Maryland, and Virginia. It is an area of adjacent valleys and ridges that formed when the Appalachian mountain were created some 370 to 390 million years ago. During the continental collision that formed the Appalachians, the rocks in this area were pushed from the side and buckled much like a rug when pushed from one end. Subsequent erosion has produced the landscape we see in this image. The more resistant rocks, such as sandstone, form the tops of the ridges which appear as forested greenish areas on this image. The less resistant rocks, such as limestone, form the lower valleys which are cleared land and farm fields and are purple in this image. Smaller rivers and streams in the area flow along the valleys and in places cut across the ridges in "water gaps." In addition to defining the geography of this region, the Valley and Ridge province also provides this area with natural resources. The valleys provide fertile farmland and the folded mountains form natural traps for oil and gas accumulation; coal deposits are also found in the mountains. The colors in the image are assigned to different frequencies and polarizations of the SIR-C radar as follows: red is L-band horizontally transmitted, horizontally received; green is L-band horizontally transmitted, vertically received; blue is C-band horizontally transmitted, horizontally received. The river junction near the top of the image is where the West Branch River flows into the Susquehanna River, which then flows to the south-southwest past the state capitol of Harrisburg, 70 km (43 miles) to the south and not visible in this image. The town of Sunbury is shown along the Susquehanna on the east just to the southeast of the junction with West Branch. Three structures that cross the Susquehanna; the northern and southern of these structures are bridges and middle structure is the Shamokin Dam which confines the Susquehanna just south of the junction with West Branch. The prominent S-shaped mountain ridge in the center of the image is, from north to south, Little Mountain (the top of the S), Line Mountain (the middle of the S), and Mahantango Mountain (the bottom of the S). http://photojournal.jpl.nasa.gov/catalog/PIA01306

STS076-401-021 (27 March 1996) --- Astronauts Michael R. (Rich) Clifford (right) and Linda M. Godwin (red stripe) work together on the port side of the Space Shuttle Atlantis' aft cargo bay during a March 27, 1996, Extravehicular Activity (EVA). The Atlas Mountains can been seen near Earth's horizon in the background. The EVA of the two mission specialists marks the first EVA while Russia's Mir Space Station was docked with the Space Shuttle Atlantis. This is the third of a series of docking missions involving Mir and the Space Shuttle Atlantis.
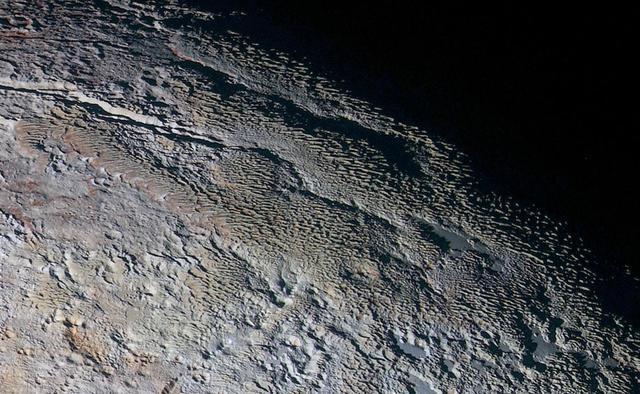
In this extended color image of Pluto taken by NASA New Horizons spacecraft, rounded and bizarrely textured mountains, informally named the Tartarus Dorsa, rise up along Pluto's day-night terminator and show intricate but puzzling patterns of blue-gray ridges and reddish material in between. This view, roughly 330 miles (530 kilometers) across, combines blue, red and infrared images taken by the Ralph/Multispectral Visual Imaging Camera (MVIC) on July 14, 2015, and resolves details and colors on scales as small as 0.8 miles (1.3 kilometers). http://photojournal.jpl.nasa.gov/catalog/PIA19957
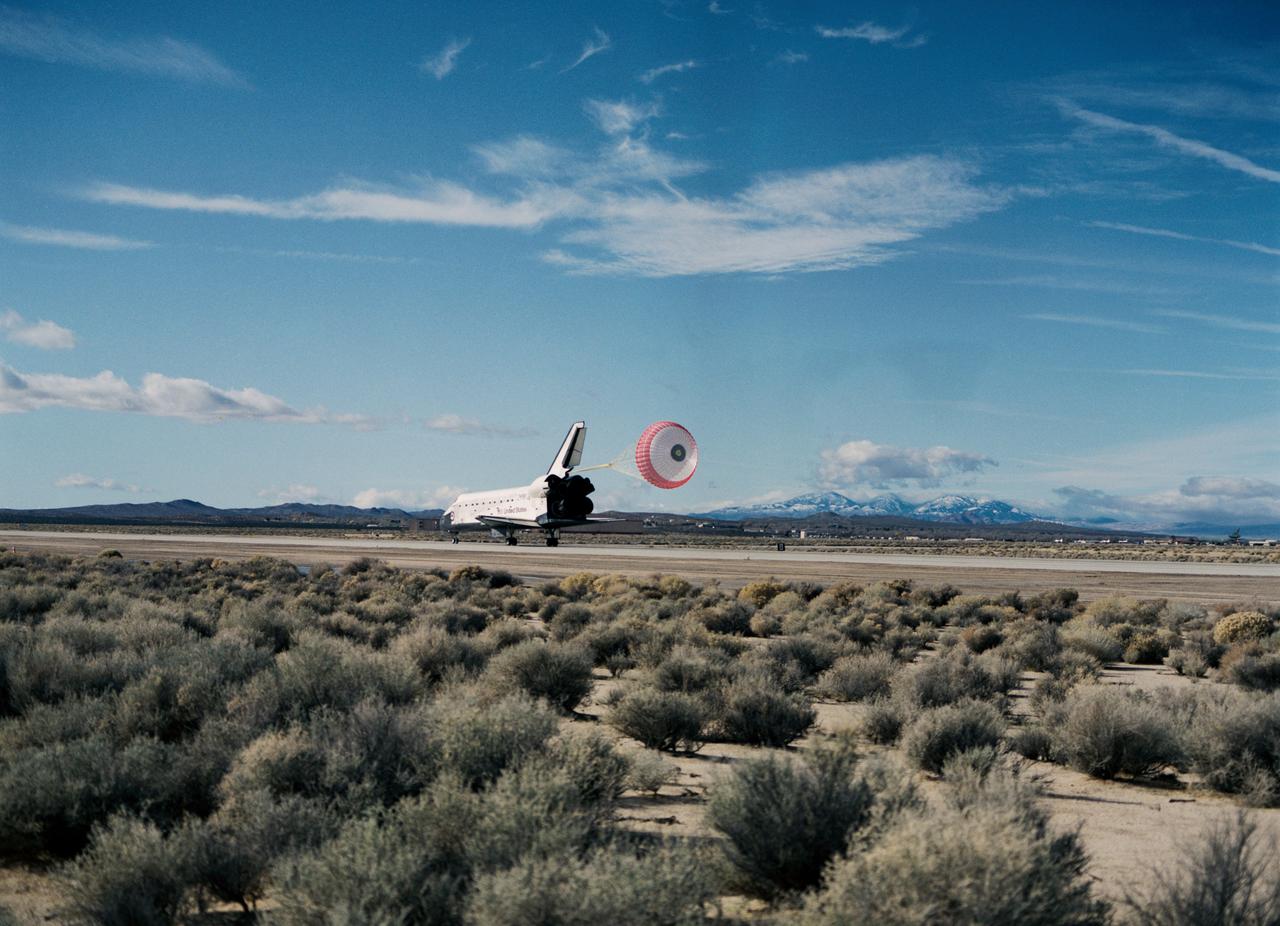
STS-53 Discovery, Orbiter Vehicle (OV) 103, is slowed by a red, white, and blue drag chute during its landing on concrete runway 22 at Edwards Air Force Base (EAFB), California. Main landing gear (MLG) touchdown occurred at 12:43:17 pm (Pacific Standard Time (PST)). This aft view of OV-103 shows the drag chute deployed from its compartment at the base of the vertical tail, the speedbrake/rudder flaps open, and the space shuttle main engines (SSMEs). Both MLG and nose landing gear (NLG) ride along the runway surface. Desert scrub brush appears in the foreground and mountains are seen in the background.
In Iran, near the southwest shore of the Caspian Sea, folded sedimentary rocks are part of the Greater Caucasus Mountain Belt. In false color infrared, the blue colored rocks are white sediments, greenish-toned rocks are redbeds. The vegetated river channel is bright red. The black line going across the image from east to west is Iran Highway 2 that starts in Teheran and ends in Tabriz. The image was acquired June 22, 2020, covers an area of 37.6 by 40.9 km, and is located at 37.1 degrees north, 47.6 degrees east. https://photojournal.jpl.nasa.gov/catalog/PIA25946
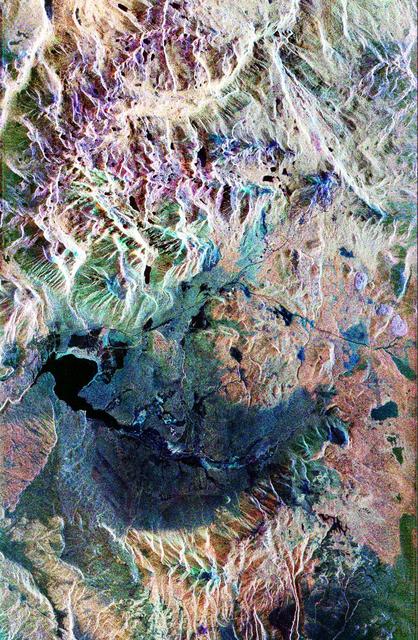
This false-color composite radar image of the Mammoth Mountain area in the Sierra Nevada Mountains, California, was acquired by the Spaceborne Imaging Radar-C and X-band Synthetic Aperture Radar aboard the space shuttle Endeavour on its 67th orbit on October 3, 1994. The image is centered at 37.6 degrees north latitude and 119.0 degrees west longitude. The area is about 39 kilometers by 51 kilometers (24 miles by 31 miles). North is toward the bottom, about 45 degrees to the right. In this image, red was created using L-band (horizontally transmitted/vertically received) polarization data; green was created using C-band (horizontally transmitted/vertically received) polarization data; and blue was created using C-band (horizontally transmitted and received) polarization data. Crawley Lake appears dark at the center left of the image, just above or south of Long Valley. The Mammoth Mountain ski area is visible at the top right of the scene. The red areas correspond to forests, the dark blue areas are bare surfaces and the green areas are short vegetation, mainly brush. The purple areas at the higher elevations in the upper part of the scene are discontinuous patches of snow cover from a September 28 storm. New, very thin snow was falling before and during the second space shuttle pass. In parallel with the operational SIR-C data processing, an experimental effort is being conducted to test SAR data processing using the Jet Propulsion Laboratory's massively parallel supercomputing facility, centered around the Cray Research T3D. These experiments will assess the abilities of large supercomputers to produce high throughput Synthetic Aperture Radar processing in preparation for upcoming data-intensive SAR missions. The image released here was produced as part of this experimental effort. http://photojournal.jpl.nasa.gov/catalog/PIA01746
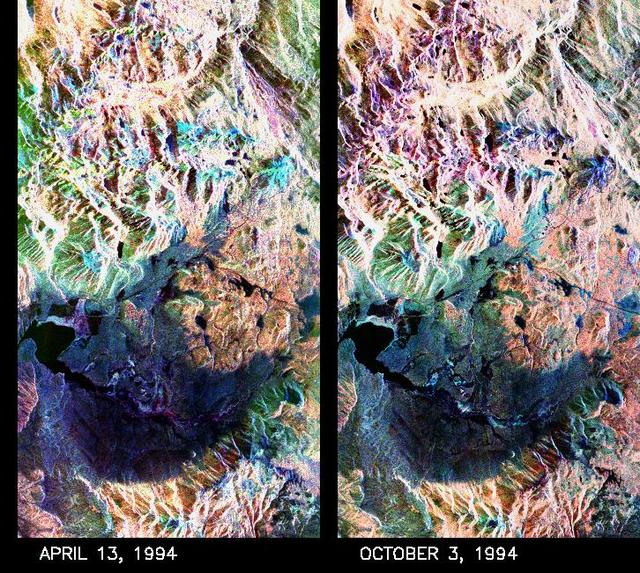
These two false-color composite images of the Mammoth Mountain area in the Sierra Nevada Mountains, Calif., show significant seasonal changes in snow cover. The image at left was acquired by the Spaceborne Imaging Radar-C and X-band Synthetic Aperture Radar aboard the space shuttle Endeavour on its 67th orbit on April 13, 1994. The image is centered at 37.6 degrees north latitude and 119 degrees west longitude. The area is about 36 kilometers by 48 kilometers (22 miles by 29 miles). In this image, red is L-band (horizontally transmitted and vertically received) polarization data; green is C-band (horizontally transmitted and vertically received) polarization data; and blue is C-band (horizontally transmitted and received) polarization data. The image at right was acquired on October 3, 1994, on the space shuttle Endeavour's 67th orbit of the second radar mission. Crowley Lake appears dark at the center left of the image, just above or south of Long Valley. The Mammoth Mountain ski area is visible at the top right of the scene. The red areas correspond to forests, the dark blue areas are bare surfaces and the green areas are short vegetation, mainly brush. The changes in color tone at the higher elevations (e.g. the Mammoth Mountain ski area) from green-blue in April to purple in September reflect changes in snow cover between the two missions. The April mission occurred immediately following a moderate snow storm. During the mission the snow evolved from a dry, fine-grained snowpack with few distinct layers to a wet, coarse-grained pack with multiple ice inclusions. Since that mission, all snow in the area has melted except for small glaciers and permanent snowfields on the Silver Divide and near the headwaters of Rock Creek. On October 3, 1994, only discontinuous patches of snow cover were present at very high elevations following the first snow storm of the season on September 28, 1994. For investigations in hydrology and land-surface climatology, seasonal snow cover and alpine glaciers are critical to the radiation and water balances. SIR-C/X-SAR is a powerful tool because it is sensitive to most snowpack conditions and is less influenced by weather conditions than other remote sensing instruments, such as Landsat. In parallel with the operational SIR-C data processing, an experimental effort is being conducted to test SAR data processing using the Jet Propulsion Laboratory's massively parallel supercomputing facility, centered around the Cray Research T3D. These experiments will assess the abilities of large supercomputers to produce high throughput SAR processing in preparation for upcoming data-intensive SAR missions. The images released here were produced as part of this experimental effort. http://photojournal.jpl.nasa.gov/catalog/PIA01753
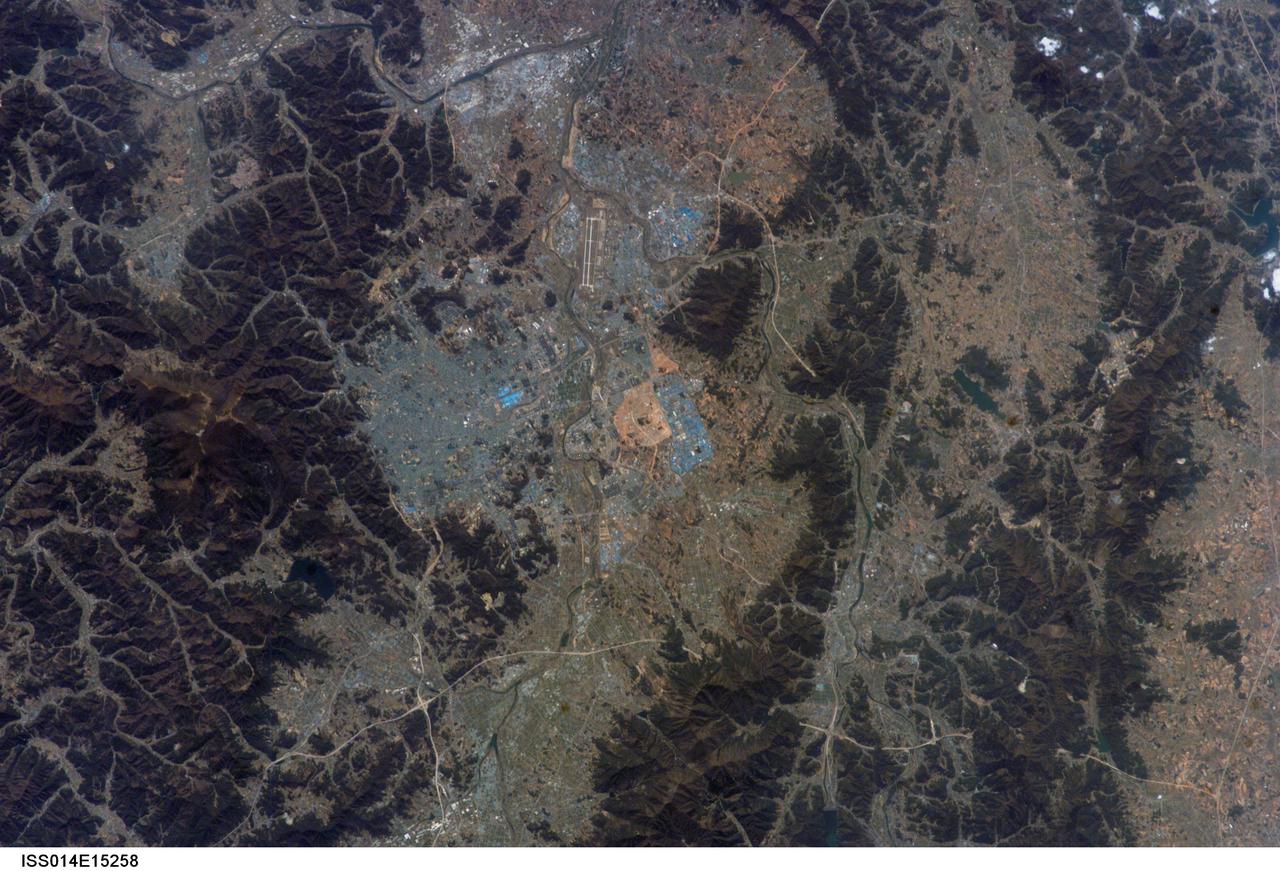
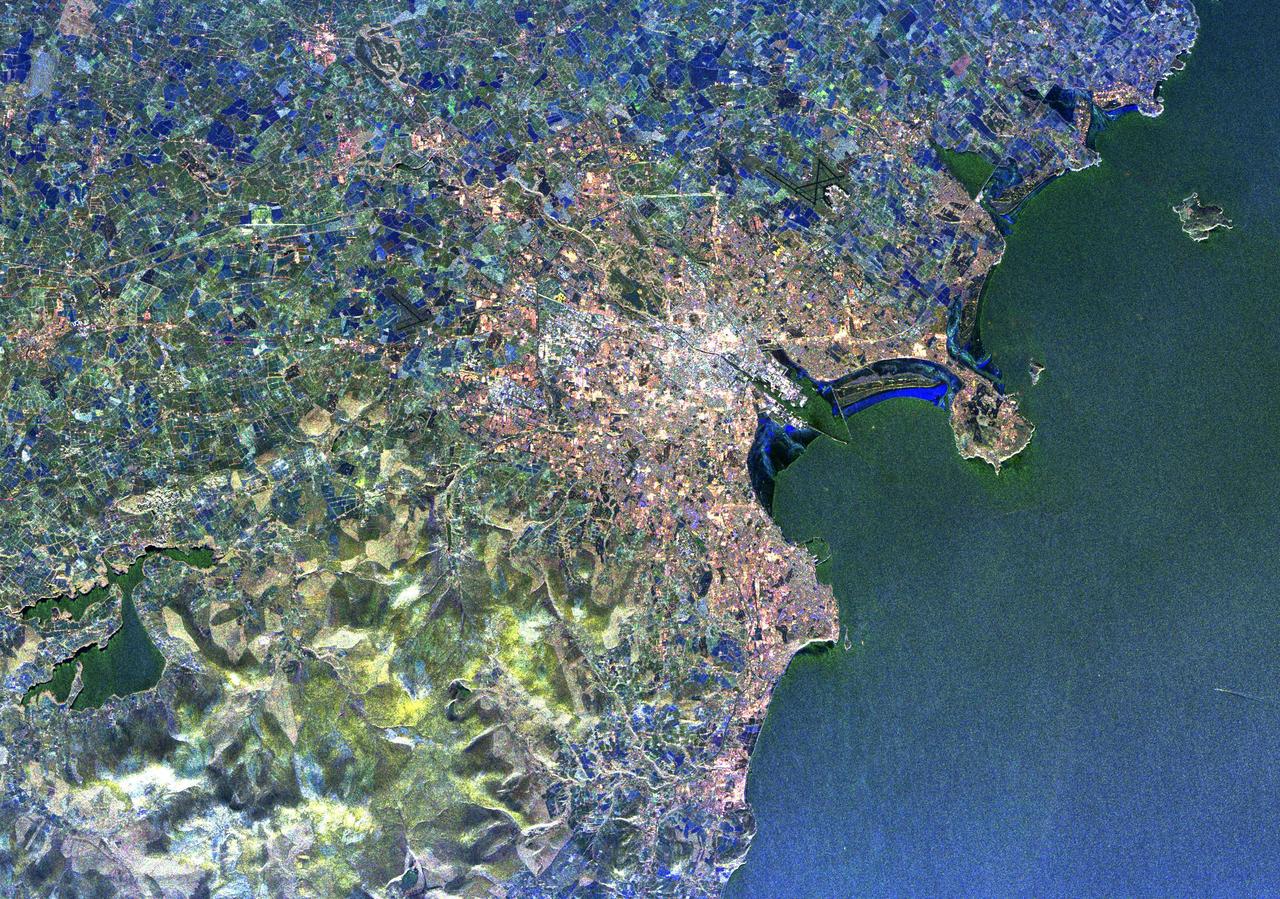
ISS014-E-15258 (26 Feb. 2007) --- Kwangju, South Korea is featured in this image photographed by an Expedition 14 crewmember on the International Space Station. The Metropolitan City of Kwangju (or Gwangju) is the fifth largest urban area in South Korea with a population of 1.4 million people. It is a major economic and cultural center for the southern portion of the country, located in a geographic basin with high mountains to the east (the mountain of Mudeungsan to the east has a peak elevation of 1,140 meters) and more open plains to the west. The city is perhaps best known to the West as the location of the Gwangju Massacre in May 1980, during which civilian demonstrators were killed by government forces. This event has led to identification of the city within South Korea as "the shrine of Korean democracy." The most notable feature in this view is an interesting blue cast to the urbanized regions. Digital photographs capture the same red, green, and blue wavelengths of reflected light that human eyes are sensitive to (known as a "true-color" image), and urban areas typically appear in tones of grey. The distinctive blue-grey color of the Kwangju metropolitan area is the result of numerous blue building rooftops, present on both small residential buildings and large industrial buildings such as those located at center and right.
SL4-93-067 (16 Nov. 1973-8 Feb. 1974) --- A spectacular winter view of the Flagstaff, Arizona area is seen in this Skylab 4 Earth Resources Experiments package S190-B (five-inch earth terrain camera) infrared photograph taken from the Skylab space station in Earth orbit. Included in the scene are the San Francisco Mountains, Oak Creek Canyon, Painted Desert and Meteor Crater. The infrared picture depicts in red living vegetation, in white the snow, and in bright blue the water. Major features identified in this photograph are Humphrey's peak, top center, Flagstaff at foot of the peak, Sunset Crater volcanic field with numerous vents and craters right of Flagstaff and Meteor Crater (right center). Within the mountainous areas several clear areas generally rectangular are visible and represent the areas where lumbering has removed the forest. The thin white line extending from left corner to Sunset Crater fields is the power transmission line cleared area. Roads are subdued and are not easily visible. Photo credit: NASA
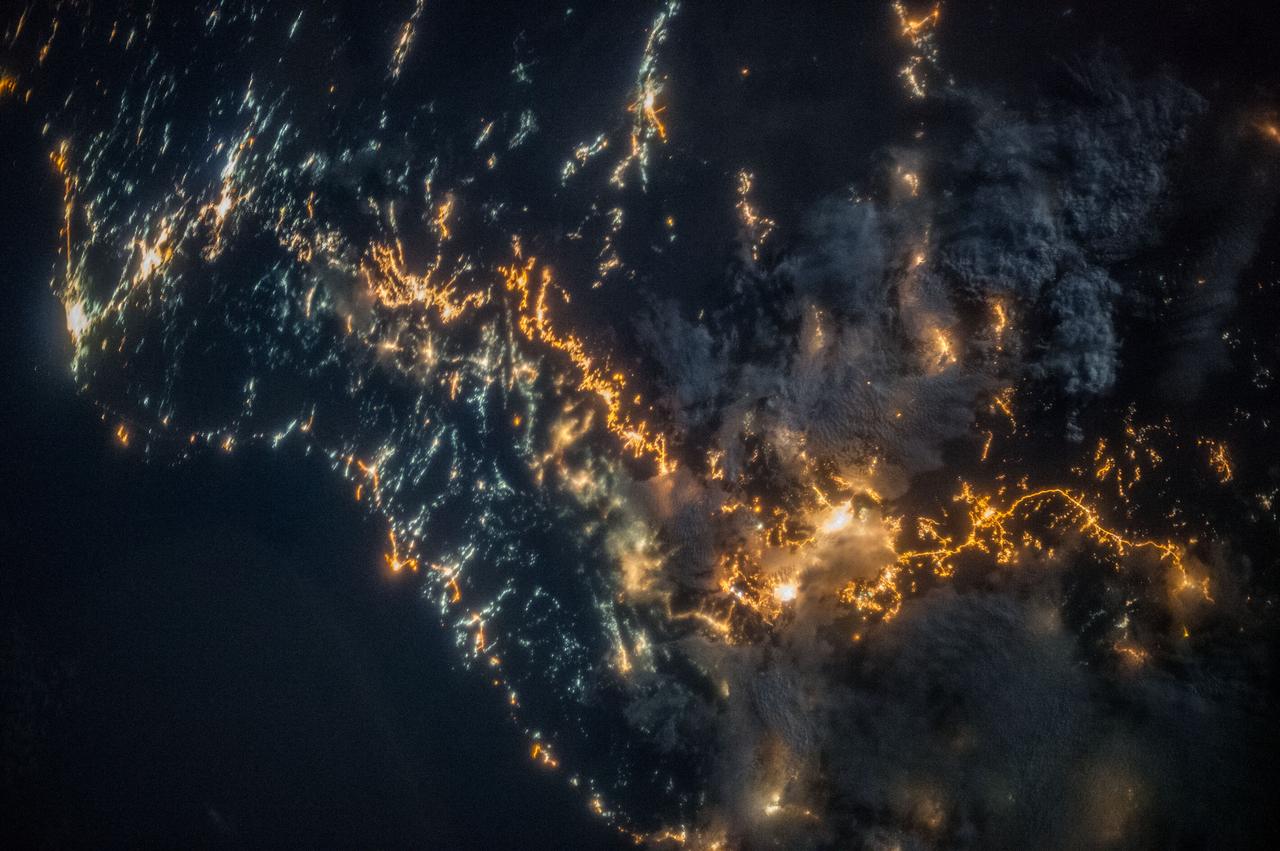
ISS036-E-025802 (26 July 2013) --- A nighttime view of southwestern Saudi Arabia is featured in this image photographed by an Expedition 36 crew member on the International Space Station. In addition to city lights, patchy cloud cover partially obscures and blurs city lights, especially in the vicinity of Khamis Mushait and Abha. While much of the country is lightly populated desert ? and relatively dark at night due to lack of city and roadway lights ? the southwestern coastal region has more moderate climate and several large cities. Three brightly lit urban centers are visible at top left; Jeddah, Mecca, and Taif. Jeddah is the gateway city for Islamic pilgrims going to nearby Mecca (a religious journey known as the hajj). Taif to the east is located on the slopes of the Sarawat Mountains, and provides a summer retreat for the Saudi government from the desert heat of the capital city of Riyadh. Bright yellow-orange lighting marks highways that parallel the trend of the Asir Mountains at center, connecting Mecca to the resort cities of Al Bahah and Abha (lower right). Smaller roadways, lit with blue lights, extend to the west to small cities along the Red Sea coastline. The bright yellow-orange glow of the city of Abha is matched by that of the city of Khamis Mushait (or Khamis Mushayt) to the northeast. The brightly lit ribbon of highway continues onward towards other large cities to the south (Jazan, not shown) and southeast (Najran, not shown).
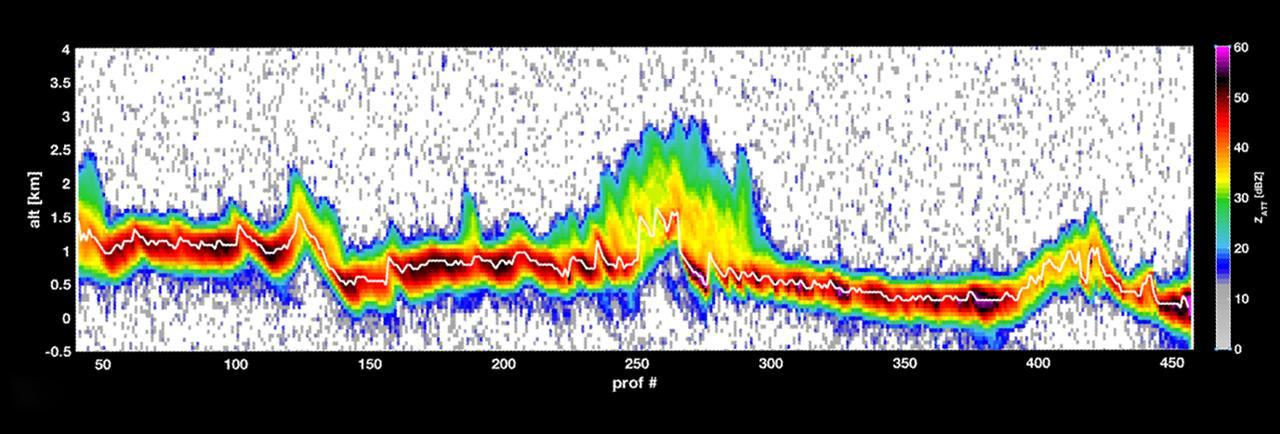
The first data from RainCube, a tiny weather satellite. RainCube is a prototype for a possible fleet of future small satellite missions that can track precipitation from space. RainCube "sees" objects by using radar, much as a bat uses sonar. The satellite's umbrella -- like antenna sends out chirps, or specialized radar signals, that bounce off raindrops, bringing back a picture of what the inside of the storm looks like. This graph shows a storm over the mountains in Mexico in late August 2018, as measured by RainCube's radar. The data shows a vertical snapshot of the storm -- the bright white line shows the ground, while the bright colors around it show the intensity of the rainfall, as well as the more reflective areas of the terrain. Brighter colors, like yellow or red, show areas of higher reflectivity, e.g. heavier rain. https://photojournal.jpl.nasa.gov/catalog/PIA22654
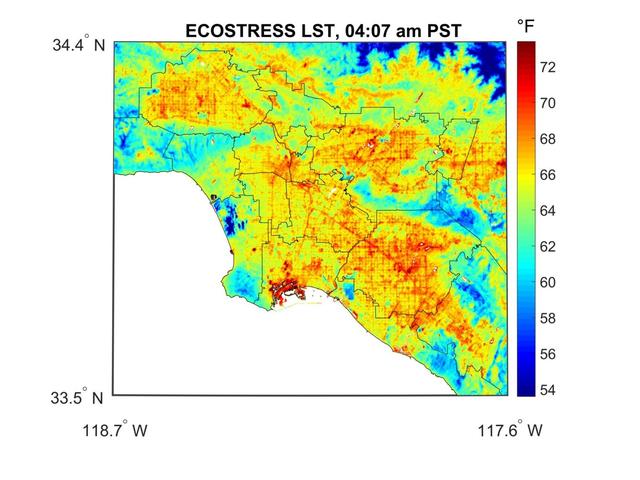
ECOSTRESS captured surface temperature variations in Los Angeles, California between July 22 and August 14 -- a period of extended heat -- at different times of day. The images show how different surfaces within the cityscape warm and cool throughout the day. They have been colored to show the hottest areas in red, warm areas in orange and yellow, and cooler areas in blue. The hottest areas are dark asphalt surfaces that have very little shade during the day and remain warm throughout the night due to their higher heat capacity. They include freeways, airports, oil refineries and parking lots. Clouds and higher-elevation mountainous areas were the coolest. More information is available at https://photojournal.jpl.nasa.gov/catalog/PIA22703

This photograph shows a modified General Dynamics AFTI/F-111A Aardvark with supercritical mission adaptive wings (MAW) installed. The four dark bands on the right wing are the locations of pressure orifices used to measure surface pressures and shock locations on the MAW. The El Paso Mountains and Red Rock Canyon State Park Califonia, about 30 miles northwest of Edwards Air Force Base, are seen directly in the background. With the phasing out of the TACT program came a renewed effort by the Air Force Flight Dynamics Laboratory to extend supercritical wing technology to a higher level of performance. In the early 1980s the supercritical wing on the F-111A aircraft was replaced with a wing built by Boeing Aircraft Company System called a “mission adaptive wing” (MAW), and a joint NASA and Air Force program called Advanced Fighter Technology Integration (AFTI) was born.
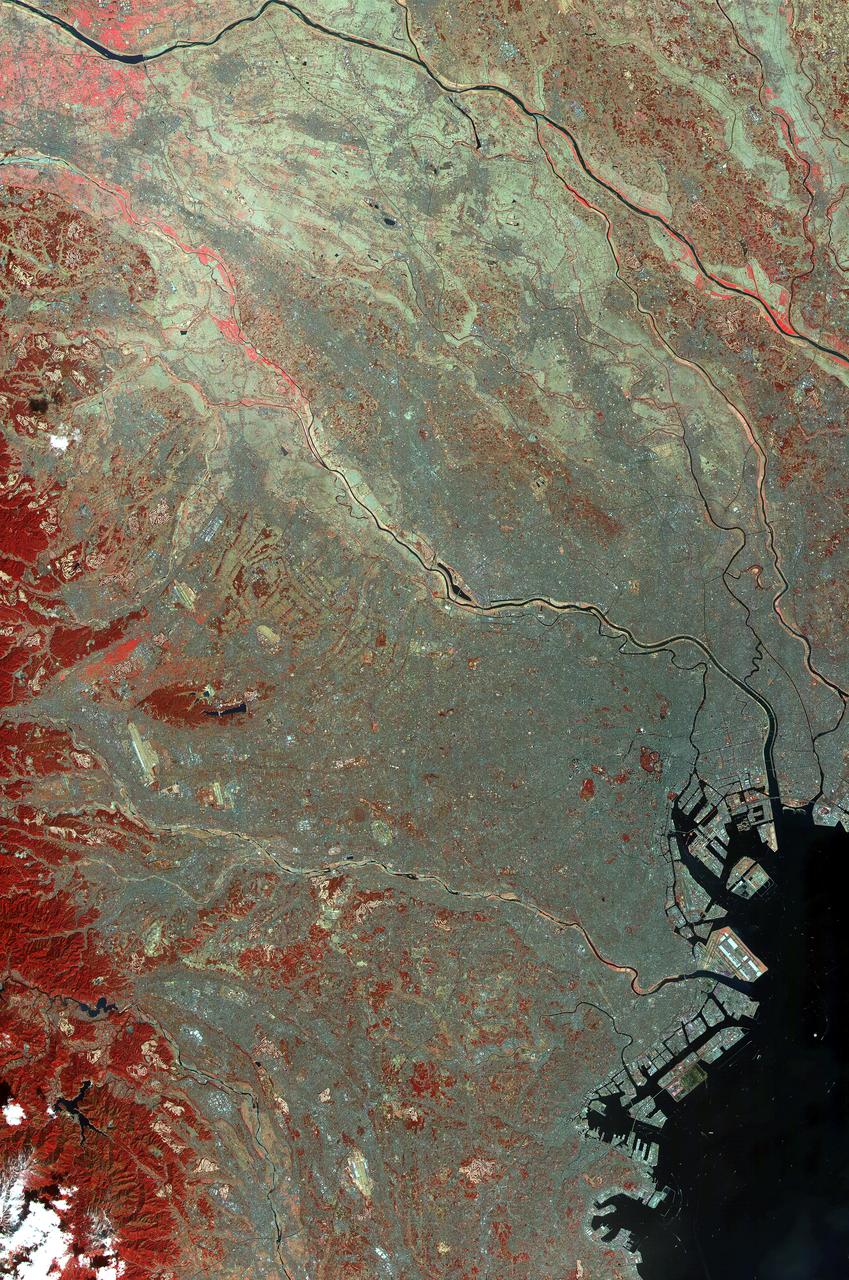
This image of the city of Tokyo was acquired on March 22, 2000 by the Advanced Spaceborne Thermal Emission and Reflection Radiometer (ASTER) on NASA's Terra satellite. With its 14 spectral bands from the visible to the thermal infrared wavelength region, and its high spatial resolution of 15 to 90 meters (about 50 to 300 feet), ASTER will image the Earth for the next 6 years to map and monitor the changing surface of our planet. This false color infrared image covers an area 60 km wide and 75 km long in three bands of the short wavelength infrared region, with a spatial resolution of 15 m. It shows part of the Tokyo metropolitan area extending south to Yokohama; included are the Ginza District, Haneda airport and the Imperial Palace. To the west, Tokyo is hemmed in by mountains, covered with forests (displayed in red); on the southeast, Tokyo Bay is one of the world's great harbors. http://photojournal.jpl.nasa.gov/catalog/PIA02607

Saturn's rings display their subtle colors in this view captured on Aug. 22, 2009, by NASA's Cassini spacecraft. The particles that make up the rings range in size from smaller than a grain of sand to as large as mountains, and are mostly made of water ice. The exact nature of the material responsible for bestowing color on the rings remains a matter of intense debate among scientists. Images taken using red, green and blue spectral filters were combined to create this natural color view. Cassini's narrow-angle camera took the images at a distance of approximately 1.27 million miles (2.05 million kilometers) from the center of the rings. The Cassini spacecraft ended its mission on Sept. 15, 2017 https://photojournal.jpl.nasa.gov/catalog/PIA22418
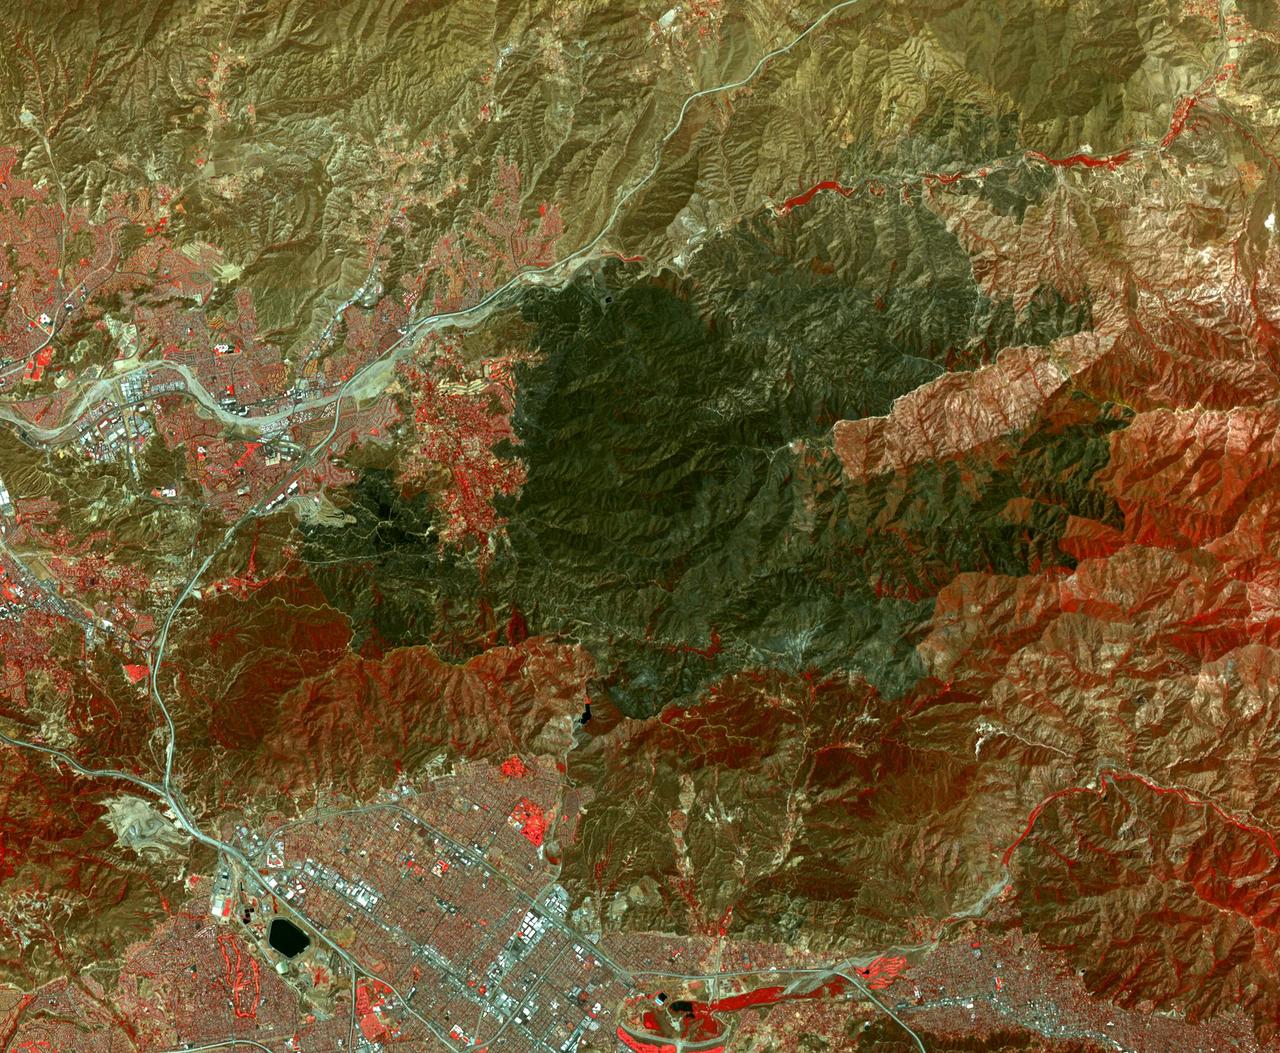
In San Bernardino County, California, the Blue Cut fire burned ferociously for one week starting Aug. 16, 2016. By the time it was contained, it had burned 36,000 acres and destroyed 105 homes. More than 80,000 people were affected by evacuation orders. Ten days after containment, the Advanced Spaceborne Thermal Emission and Reflection Radiometer (ASTER) instrument on NASA's Terra spacecraft captured this image of the region, highlighting the extent of the damage. Healthy vegetation is depicted in red, with burnt areas in the mountains and fields shown in shades of black. The image, acquired Sept. 3, covers an area of 14 by 17 miles (22 by 27 kilometers), and is located at 34.3 degrees north, 117.5 degrees west. http://photojournal.jpl.nasa.gov/catalog/PIA20899
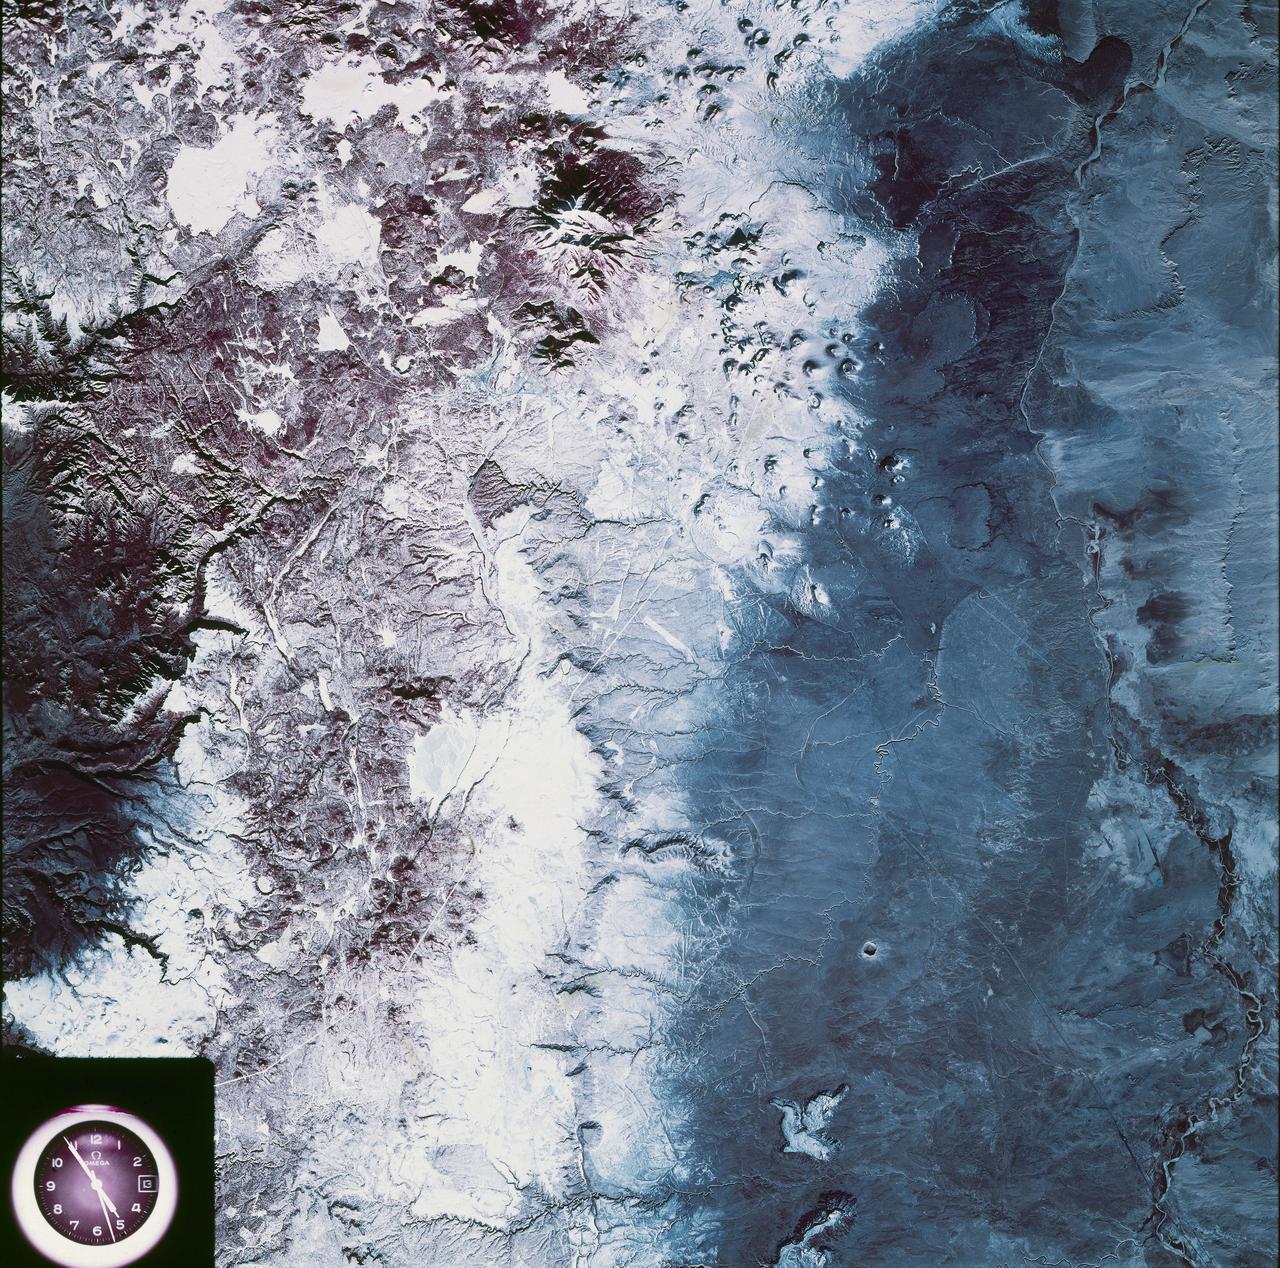
Acquisition Date: February 2004 The high reflectance of clouds compared to the surrounding land, coupled with the low sun elevation when this image was acquired, causes low clouds to appear red as they fill a portion of the Rocky Mountain Trench. Running parallel with the peaks of the Canadian Rockies and ranging from 2 to 10 miles (3 to 16 kilometers) wide and about 900 miles (1,448 kilometers) long, the Trench aligns with the Fraser River and makes its way past Mount Robson, the highest peak in the Canadian Rockies at 12,972 feet (3,954 meters). Mount Robson is near the center of this image. Credit: NASA/GSFC/Landsat/USGS To learn more about Landsat and to see the orginal high res file go to: <a href="http://landsat.usgs.gov/gallery_view.php?category=greenflag&thesort=mainTitle" rel="nofollow">landsat.usgs.gov/gallery_view.php?category=greenflag&...</a>
The Sand fire, in the mountains northwest of Los Angeles, has burned more than 39,000 acres, destroyed 18 houses, and caused one fatality. By August 1, 2016, when the Advanced Spaceborne Thermal Emission and Reflection Radiometer (ASTER) instrument on NASA's Terra spacecraft acquired this image, the fire was more than 90 percent contained. The fire began 10 days earlier in a brushy area near Highway 14. It grew explosively to thousands of acres, driven by high winds and temperatures over 100 degrees Fahrenheit. At one time, more than 20,000 residents were evacuated from their homes. In this image, vegetation is displayed in red, and the burn area is dark grey to black. The image covers an area of 16.4 by 19.4 miles (26.4 by 31.3 kilometers), and is located at 34.4 degrees north, 118.3 degrees west. http://photojournal.jpl.nasa.gov/catalog/PIA20723
This ASTER image, acquired on August 1, 2000, covers an area of 57 by 29 km and covers part of the central Pyrenees in Spain. The Pyrenees in southwestern Europe extend for about 435 kilometers (about 270 miles) from the Bay of Biscay to the Mediterranean Sea, separating the Iberian Peninsula from the rest of Europe. The Pyrenees form most of the boundary between France and Spain, and encompass the tiny principality of Andorra. Approximately two-thirds of the mountains lie in Spain. The central Pyrenees extend to the Collines du Perche and contain the highest peaks of the system, including Pico de Aneto, the highest at 3,404 meters (11,168 feet). ASTER bands 4, 3 and 2 were displayed in red, green and blue. In this combination, snow is blue, vegetation is green, bare rocks are pink and dark blue, and clouds are white. The image is located at 42.6 degrees north latitude and 0.6 degrees east longitude. http://photojournal.jpl.nasa.gov/catalog/PIA11162

ISS041-E-067595 (6 Oct. 2014) --- This moonlit panorama was shot recently with a wide-angle lens by an Expedition 41 crew member aboard the International Space Station, as they looked southwest from a point over Nebraska. The wide-angle lens shows a huge swath of country that stretches from Portland, Oregon (right) to Phoenix, Arizona (left). The largest string of lights is the Ogden-Salt Lake City-Provo area (lower center) in Utah. The Los Angeles and San Francisco metropolitan regions, and the cities of the central valley of California (Bakersfield to Redding) stretch across the horizon. The green airglow layer always appears in night images. Moonlight shows the red tinge of the space station?s solar arrays top left. Moonlight emphasizes the broader-scale geological zones. Nevada?s short, dark, parallel mountain ranges of the basin and range geological province (center) contrast with the expanses of flat terrain of the Colorado Plateau (left) in Colorado, Arizona, Utah and New Mexico. The near-full moon even reveals the vast dry lake bed known as the Bonneville Salt Flats. The black line of the Sierra Nevada marks the edge of California?s well-lit central valley (directly below the San Francisco Bay area).
This full-frame ASTER image, acquired August 30, 2000, covers an area of 60 by 60 km in the Salmon River Mountains, Idaho. In this color infrared composite, vegetation is red, clouds are white, and smoke from forest fires is blue. An enlargement (Figure 1) covers an area of 12 x 15 km. A thermal infrared band is displayed in red, a short wave infrared band is displayed in green, and a visible band is displayed in blue. In this combination, fires larger than about 50 m appear yellow because they are bright in both infrared bands. Smaller fires appear green because they are too small to be seen by the 90 m thermal pixels, but large enough to be detected in the 30 m short wave infrared pixels. We are able to see through the smoke in the infrared bands, whereas in the visible bands, the smoke obscures detection of the active fires. This image is located at 44.8 degrees north latitude and 114.8 degrees west longitude. http://photojournal.jpl.nasa.gov/catalog/PIA11088
STS062-151-182Z (4-18 March 1994) --- This east-looking view shows most of the east-west extent of the country of Sudan. The foreground shows a vegetation-less and almost uninhabited region of northwest Sudan. The rich earth colors are ancient soils (browner and redder tones), a concentrated mass of what may be volcanic cinder cones (dark brown dots - center) and dune and younger river sediments (yellows). The photo would have been difficult to locate had it not been for two recognizable features in the background: a visually well-known inselberg ("island mountain" -- top center) on a large west-bank tributary of the White Nile; and the confluence of the Blue and White Nile's, with the great cotton developments of the Gezira Scheme between them (top left). The Red Sea coast is almost obscured by a dust cloud but can be discerned running across the top of the picture. The clouds at top may be developing over the coastal ranges of Saudi Arabia beyond the Red Sea.
This radar image of Salt Lake City, Utah, illustrates the different land use patterns that are present in the Utah Valley. Salt Lake City lies between the shores of the Great Salt Lake (the dark area on the left side of the image) and the Wasatch Front Range (the mountains in the upper half of the image). The Salt Lake City area is of great interest to urban planners because of the combination of lake, valley and alpine environments that coexist in the region. Much of the southern shore of the Great Salt Lake is a waterfowl management area. The green grid pattern in the right center of the image is Salt Lake City and its surrounding communities. The Salt Lake City airport is visible as the brown rectangle near the center of the image. Interstate Highway 15 runs from the middle right edge to the upper left of the image. The bright white patch east of Interstate 15 is the downtown area, including Temple Square and the state capitol. The University of Utah campus is the yellowish area that lies at the base of the mountains, east of Temple Square. The large reservoir in the lower left center is a mine tailings pond. The semi-circular feature in the mountains at the bottom edge of the image is the Kennecott Copper Mine. The area shown is 60 kilometers by 40 kilometers (37 miles by 25 miles) and is centered at 40.6 degrees north latitude, 112.0 degrees west longitude. North is toward the upper left. This image was acquired by the Spaceborne Imaging Radar-C/X-Band Synthetic Aperture Radar (SIR-C/X-SAR) aboard the space shuttle Endeavour on April 10, 1994. The colors in this image represent the following radar channels and polarizations: red is L-band, horizontally transmitted and received; green is L-band, horizontally transmitted and vertically received; and blue is C-band, horizontally transmitted and vertically received. SIR-C/X-SAR, a joint mission of the German, Italian and United States space agencies, is part of NASA's Mission to Planet Earth program. http://photojournal.jpl.nasa.gov/catalog/PIA01798
Visualization Date 1994-04-11 This radar image of Dublin, Ireland, shows how the radar distingishes between densely populated urban areas and nearby areas that are relatively unsettled. In the center of the image is the city's natural harbor along the Irish Sea. The pinkish areas in the center are the densely populated parts of the city and the blue/green areas are the suburbs. The two ends of the Dublin Bay are Howth Point, the circular peninsula near the upper right side of the image, and Dun Laoghaire, the point to the south. The small island just north of Howth is called "Ireland's Eye," and the larger island, near the upper right corner of the image is Lambay Island. The yellow/green mountains in the lower left of the image (south) are the Wicklow Mountains. The large lake in the lower left, nestled within these mountains, is the Poulaphouca Reservoir along River Liffey. The River Liffey, the River Dodder and the Tolka River are the three rivers that flow into Dublin. The straight features west of the city are the Grand Canal and the three rivers are the faint lines above and below these structures. The dark X-shaped feature just to the north of the city is the Dublin International Airport. The image was acquired by the Spaceborne Imaging Radar-C/X-band Synthetic Aperture (SIR-C/X-SAR) when it flew aboard the space shuttle Endeavour on April 11, 1994. This area is centered at 53.3 degrees north latitude, 6.2 degrees west longitude. The area shown is approximately 55 kilometers by 42 kilometers (34 miles by 26 miles). The colors are assigned to different frequencies and polarizations of the radar as follows: Red is L-band horizontally transmitted, horizontally received; green is L-band vertically transmitted, vertically received; and blue is C-band vertically transmitted, vertically received. SIR-C/X-SAR, a joint mission of the German, Italian, and the United States space agencies, is part of NASA's Mission to Planet Earth. Credit: NASA/GSFC For more information go to: <a href="http://visibleearth.nasa.gov/view_rec.php?id=467" rel="nofollow">visibleearth.nasa.gov/view_rec.php?id=467</a>
This is a radar image of Mount Rainier in Washington state. The volcano last erupted about 150 years ago and numerous large floods and debris flows have originated on its slopes during the last century. Today the volcano is heavily mantled with glaciers and snowfields. More than 100,000 people live on young volcanic mudflows less than 10,000 years old and, consequently, are within the range of future, devastating mudslides. This image was acquired by the Spaceborne Imaging Radar-C and X-band Synthetic Aperture Radar (SIR-C/X-SAR) aboard the space shuttle Endeavour on its 20th orbit on October 1, 1994. The area shown in the image is approximately 59 kilometers by 60 kilometers (36.5 miles by 37 miles). North is toward the top left of the image, which was composed by assigning red and green colors to the L-band, horizontally transmitted and vertically, and the L-band, horizontally transmitted and vertically received. Blue indicates the C-band, horizontally transmitted and vertically received. In addition to highlighting topographic slopes facing the space shuttle, SIR-C records rugged areas as brighter and smooth areas as darker. The scene was illuminated by the shuttle's radar from the northwest so that northwest-facing slopes are brighter and southeast-facing slopes are dark. Forested regions are pale green in color; clear cuts and bare ground are bluish or purple; ice is dark green and white. The round cone at the center of the image is the 14,435-foot (4,399-meter) active volcano, Mount Rainier. On the lower slopes is a zone of rock ridges and rubble (purple to reddish) above coniferous forests (in yellow/green). The western boundary of Mount Rainier National Park is seen as a transition from protected, old-growth forest to heavily logged private land, a mosaic of recent clear cuts (bright purple/blue) and partially regrown timber plantations (pale blue). The prominent river seen curving away from the mountain at the top of the image (to the northwest) is the White River, and the river leaving the mountain at the bottom right of the image (south) is the Nisqually River, which flows out of the Nisqually glacier on the mountain. The river leaving to the left of the mountain is the Carbon River, leading west and north toward heavily populated regions near Tacoma. The dark patch at the top right of the image is Bumping Lake. Other dark areas seen to the right of ridges throughout the image are radar shadow zones. Radar images can be used to study the volcanic structure and the surrounding regions with linear rock boundaries and faults. In addition, the recovery of forested lands from natural disasters and the success of reforestation programs can also be monitored. Ultimately this data may be used to study the advance and retreat of glaciers and other forces of global change. http://photojournal.jpl.nasa.gov/catalog/PIA01727
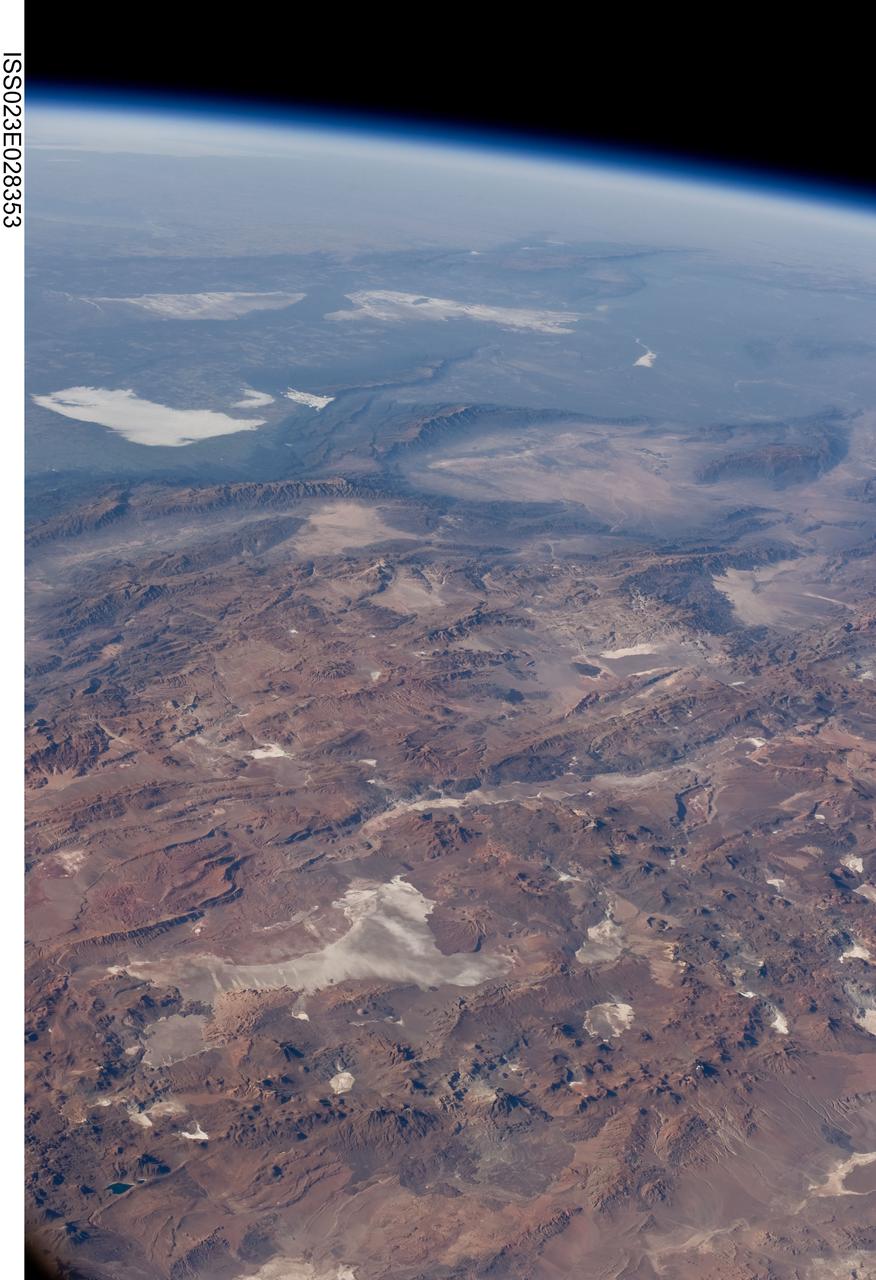
ISS023-E-028353 (26 April 2010) --- Central Andes Mountains, Salar de Arizaro, Argentina are featured in this image photographed by an Expedition 23 crew member on the International Space Station. The high plains (3,000 to greater than 5,000 meters elevation, 13,000 to 19,000 feet) of the Andes Mountains, also known as the Puna, appear in the foreground of this photograph, with a line of young volcanoes facing the much lower Atacama Desert (1,000–2,000 meters elevation). Several large dry lakes, marked by light-toned salt crusts, occupy the basins between major thrust faults in the Puna. Salar de Arizaro (foreground) is the largest of the dry lakes in this view (salar means waterless salt flat in Spanish). This panorama was taken by a station crew member looking southeast across the South American continent when the ISS was almost directly over the Atacama Desert near Chile’s Pacific coast. The Atlantic Ocean coastline (River Plate where Argentina’s capital city of Buenos Aires is located) is dimly visible at top left. A striking geological and landscape contrast is visible at center which separates two distinct geological zones, namely the Puna and the Sierras Pampeanas. The Sierras Pampeanas Mountains are lower in elevation and have few young volcanoes, in contrast to the Puna. Sharp-crested ranges are separated by wide, low valleys in this region. The Salinas Grandes—ephemeral shallow salt lakes at top left (salina means salt lake in Spanish) — occupies one of these valleys. The general color change from reds and browns in the foreground to blues and greens in the upper part of the image reflects the major climatic regions, namely the deserts of the Atacama and Puna, versus the low grassy plains of central Argentina where rainfall is sufficient to promote lush prairie grass growth—known famously as the pampas in Argentina. The Salinas Grandes mark an intermediate semiarid region. What accounts for the changes in landscape? The geology of this part of the Andes is a result of the eastward subduction of the Nazca tectonic plate underneath South America. Investigations using seismic data suggest that the Puna is underlain by a steeply dipping sector of the subducting Nazca plate. The Sierras Pampeanas zone however, is underlain by a sector of the Nazca plate that is almost horizontal, possibly due to the subduction of a submarine mountain range known as the Juan Fernandez Ridge. In the simplest terms, ridges are topographic highs that are difficult to stuff down subduction zones, with profound effects on the volcanism and structures of the upper plate.
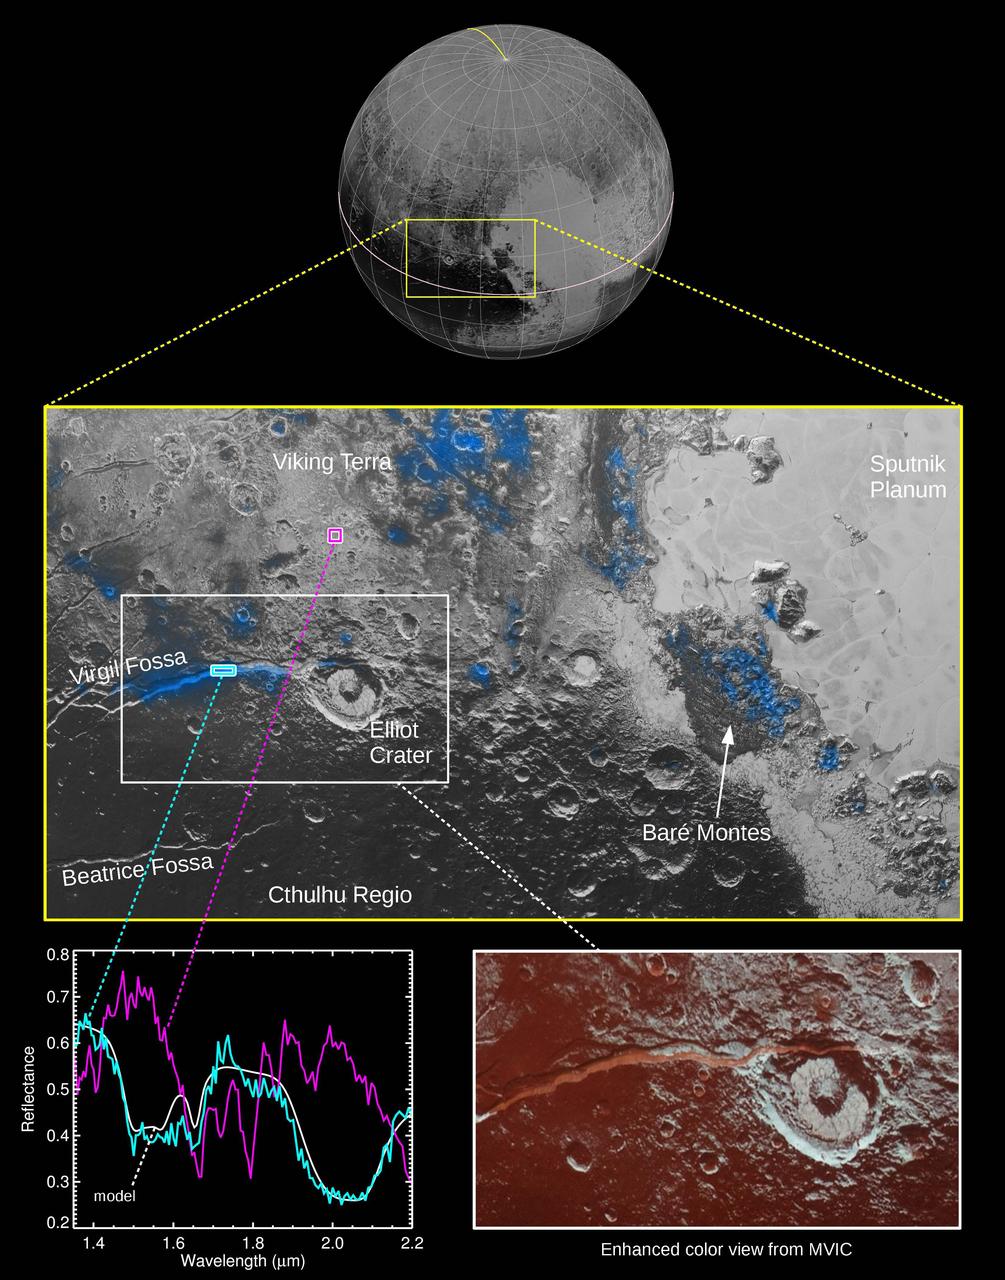
The Ralph instrument on NASA's New Horizons spacecraft detected water ice on Pluto's surface, picking up on the ice's near-infrared spectral characteristics. (See featured image from Oct. 8, 2015.) The middle panel shows a region west of Pluto's "heart" feature -- which the mission team calls Tombaugh Regio -- about 280 miles (450 kilometers) across. It combines visible imagery from Ralph's Multispectral Visible Imaging Camera (MVIC) with infrared spectroscopy from the Linear Etalon Imaging Spectral Array (LEISA). Areas with the strongest water ice spectral signature are highlighted in blue. Major outcrops of water ice occur in regions informally called Viking Terra, along Virgil Fossa west of Elliot crater, and in Baré Montes. Numerous smaller outcrops are associated with impact craters and valleys between mountains. In the lower left panel, LEISA spectra are shown for two regions indicated by cyan and magenta boxes. The white curve is a water ice model spectrum, showing similar features to the cyan spectrum. The magenta spectrum is dominated by methane ice absorptions. The lower right panel shows an MVIC enhanced color view of the region in the white box, with MVIC's blue, red and near-infrared filters displayed in blue, green and red channels, respectively. The regions showing the strongest water ice signature are associated with terrains that are actually a lighter shade of red. http://photojournal.jpl.nasa.gov/catalog/PIA20030
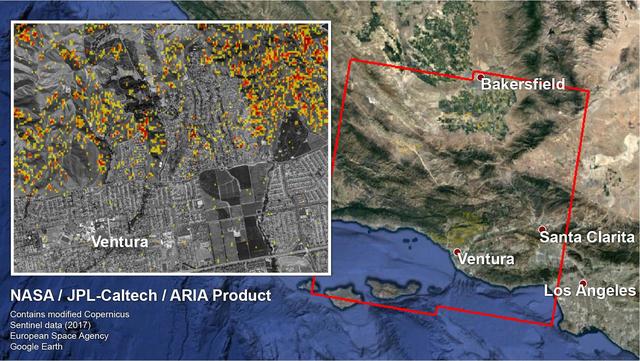
The Advanced Rapid Imaging and Analysis (ARIA) team at NASA's Jet Propulsion Laboratory in Pasadena, California, and Caltech, also in Pasadena, created a Damage Proxy Map (DPM) depicting areas in Southern California that are likely damaged (shown by red and yellow pixels) as a result of recent wildfires, including the Thomas Fire in Ventura and Santa Barbara Counties, highlighted in the attached image taken from the DPM. The map is derived from synthetic aperture radar (SAR) images from the Copernicus Sentinel-1 satellites, operated by the European Space Agency (ESA). The images were taken before (Nov. 28, 2017, 6 a.m. PST) and after (Dec. 10, 2017, 6 a.m. PST) the onset of the fires. The map covers an area of 107 by 107 miles (172 by 172 kilometers), shown by the large red polygon. Each pixel measures about 33 yards (30 meters) across. The color variation from yellow to red indicates increasingly more significant ground surface change. Preliminary validation was done by comparing the map to optical satellite imagery from DigitalGlobe. This damage proxy map should be used as guidance to identify damaged areas, and may be less reliable over vegetated areas. For example, the colored pixels seen over mountainous areas may seem a little scattered even though the reality could be that the contiguous areas were burned. Patches of farmland can also appear as signals due to plowing or irrigation. The full map is available to download from https://aria-share.jpl.nasa.gov/events/20171210-SoCal_Fire/. https://photojournal.jpl.nasa.gov/catalog/PIA22191
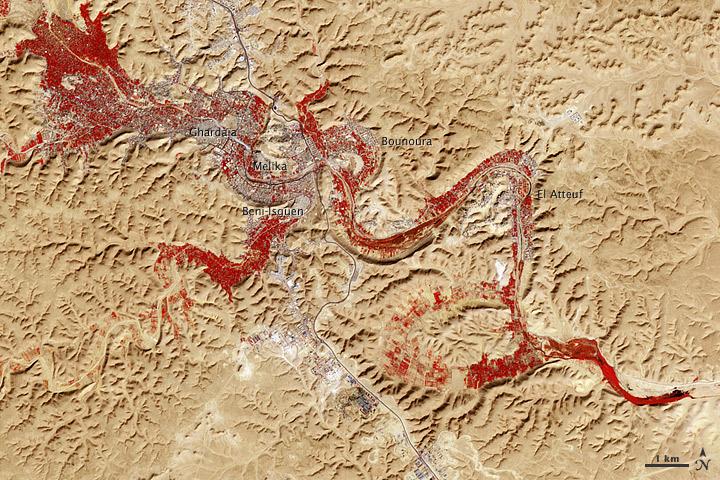
NASA image acquired Feb. 9, 2011 Less than 5 percent of Algeria’s land surface is suitable for growing crops, and most precipitation falls on the Atlas Mountains along the coast. Inland, dust-laden winds blow over rocky plains and sand seas. However, in north central Algeria—off the tip of Grand Erg Occidental and about 450 kilometers (280 miles) south of Algiers—lies a serpentine stretch of vegetation. It is the M’zab Valley, filled with palm groves and dotted with centuries-old settlements. The Advanced Spaceborne Thermal Emission and Reflection Radiometer (ASTER) on NASA’s Terra satellite captured this image of M’zab Valley on February 9, 2011. ASTER combines infrared, red, and green wavelengths of light. Bare rock ranges in color from beige to peach. Buildings and paved surfaces appear gray. Vegetation is red, and brighter shades of red indicate more robust vegetation. This oasis results from water that is otherwise in short supply in the Sahara Desert, thanks to the valley’s approximately 3,000 wells. Chemical analysis of Algerian aquifers, as well studies of topography in Algeria and Tunisia, suggest this region experienced a cooler climate in the late Pleistocene, and potentially heavy monsoon rains earlier in the Holocene. The M’zab region shows evidence of meandering rivers and pinnate drainage patterns. The vegetation lining M’zab Valley highlights this old river valley’s contours. Cool summer temperatures and monsoon rains had long since retreated from the region by eleventh century, but this valley nevertheless supported the establishment of multiple fortified settlements, or ksours. Between 1012 A.D. and 1350 A.D., locals established the ksours of El-Atteuf, Bounoura, Melika, Ghardaïa, and Beni-Isguen. Collectively these cities are now a United Nations Educational, Scientific, and Cultural Organization (UNESCO) World Heritage site. NASA Earth Observatory image by Robert Simmon and Jesse Allen, using data from the GSFC/METI/ERSDAC/JAROS, and U.S./Japan ASTER Science Team. Caption by Michon Scott. Instrument: Terra - ASTER <b>To download the full high res file go <a href="http://earthobservatory.nasa.gov/IOTD/view.php?id=51296" rel="nofollow"> here</a></b>
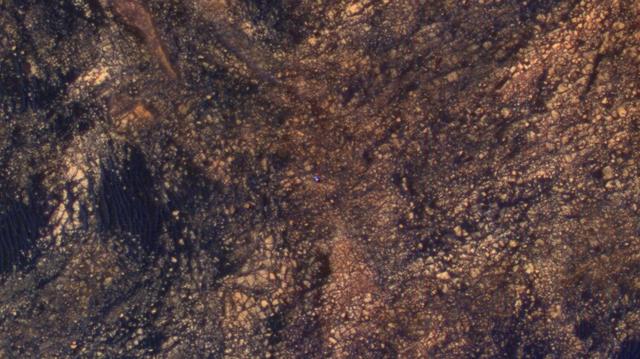
The feature that appears bright blue at the center of this scene is NASA's Curiosity Mars rover on the northwestern flank of Mount Sharp, viewed by NASA's Mars Reconnaissance Orbiter. Curiosity is approximately 10 feet long and 9 feet wide (3.0 meters by 2.8 meters). The view is a cutout from observation ESP_050897_1750 taken by the High Resolution Imaging Science Experiment (HiRISE) camera on the orbiter on June 5, 2017. HiRISE has been imaging Curiosity about every three months, to monitor the surrounding features for changes such as dune migration or erosion. When the image was taken, Curiosity was partway between its investigation of active sand dunes lower on Mount Sharp, and "Vera Rubin Ridge," a destination uphill where the rover team intends to examine outcrops where hematite has been identified from Mars orbit. The rover's surroundings include tan rocks and patches of dark sand. As in previous HiRISE color images of Curiosity since the rover was at its landing site, the rover appears bluer than it really is. HiRISE color observations are recorded in a red band, a blue-green band and an infrared band, and displayed in red, green and blue. This helps make differences in Mars surface materials apparent, but does not show natural color as seen by the human eye. Lower Mount Sharp was chosen as a destination for the Curiosity mission because the layers of the mountain offer exposures of rocks that record environmental conditions from different times in the early history of the Red Planet. Curiosity has found evidence for ancient wet environments that offered conditions favorable for microbial life, if Mars has ever hosted life. https://photojournal.jpl.nasa.gov/catalog/PIA21710

This majestic false-color image from NASA's Spitzer Space Telescope shows the "mountains" where stars are born. Dubbed "Mountains of Creation" by Spitzer scientists, these towering pillars of cool gas and dust are illuminated at their tips with light from warm embryonic stars. The new infrared picture is reminiscent of Hubble's iconic visible-light image of the Eagle Nebula, which also features a star-forming region, or nebula, that is being sculpted into pillars by radiation and winds from hot, massive stars. The pillars in the Spitzer image are part of a region called W5, in the Cassiopeia constellation 7,000 light-years away and 50 light-years across. They are more than 10 times in the size of those in the Eagle Nebula (shown to scale here). The Spitzer's view differs from Hubble's because infrared light penetrates dust, whereas visible light is blocked by it. In the Spitzer image, hundreds of forming stars (white/yellow) can seen for the first time inside the central pillar, and dozens inside the tall pillar to the left. Scientists believe these star clusters were triggered into existence by radiation and winds from an "initiator" star more than 10 times the mass of our Sun. This star is not pictured, but the finger-like pillars "point" toward its location above the image frame. The Spitzer picture also reveals stars (blue) a bit older than the ones in the pillar tips in the evacuated areas between the clouds. Scientists believe these stars were born around the same time as the massive initiator star not pictured. A third group of young stars occupies the bright area below the central pillar. It is not known whether these stars formed in a related or separate event. Some of the blue dots are foreground stars that are not members of this nebula. The red color in the Spitzer image represents organic molecules known as polycyclic aromatic hydrocarbons. These building blocks of life are often found in star-forming clouds of gas and dust. Like small dust grains, they are heated by the light from the young stars, then emit energy in infrared wavelengths. This image was taken by the infrared array camera on Spitzer. It is a 4-color composite of infrared light, showing emissions from wavelengths of 3.6 microns (blue), 4.5 microns (green), 5.8 microns (orange), and 8.0 microns (red). http://photojournal.jpl.nasa.gov/catalog/PIA03096
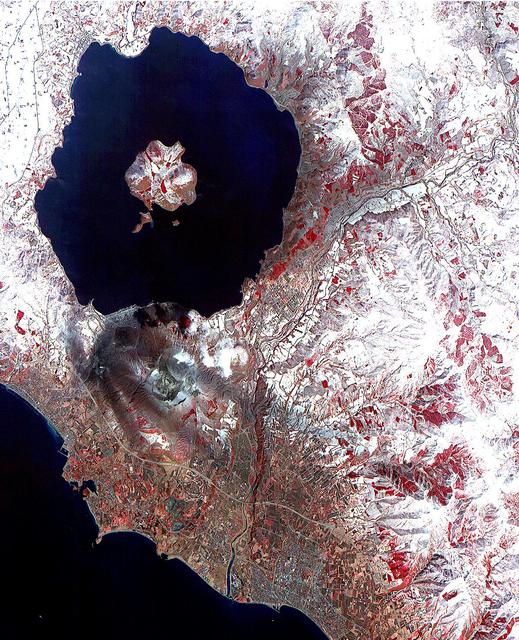
On April 3, the Advanced Spaceborne Thermal Emission and Reflection Radiometer (ASTER) on NASA's Terra Satellite captured this image of the erupting Mt. Usu volcano in Hokkaido, Japan. With its 14 spectral bands from the visible to the thermal infrared wavelength region, and its high spatial resolution of 15 to 90 meters (about 50 to 300 feet), ASTER will image the Earth for the next 6 years to map and monitor the changing surface of our planet. This false color infrared image of Mt Usu volcano is dominated by Lake Toya, an ancient volcanic caldera. On the south shore is the active Usu volcano. On Friday, March 31, more than 11,000 people were evacuated by helicopter, truck and boat from the foot of Usu, that began erupting from the northwest flank, shooting debris and plumes of smoke streaked with blue lightning thousands of feet in the air. Although no lava gushed from the mountain, rocks and ash continued to fall after the eruption. The region was shaken by thousands of tremors before the eruption. People said they could taste grit from the ash that was spewed as high as 2,700 meters (8,850 ft) into the sky and fell to coat surrounding towns with ash. "Mount Usu has had seven significant eruptions that we know of, and at no time has it ended quickly with only a small scale eruption," said Yoshio Katsui, a professor at Hokkaido University. This was the seventh major eruption of Mount Usu in the past 300 years. Fifty people died when the volcano erupted in 1822, its worst known eruption. In the image, most of the land is covered by snow. Vegetation, appearing red in the false color composite, can be seen in the agricultural fields, and forests in the mountains. Mt. Usu is crossed by three dark streaks. These are the paths of ash deposits that rained out from eruption plumes two days earlier. The prevailing wind was from the northwest, carrying the ash away from the main city of Date. Ash deposited can be traced on the image as far away as 10 kilometers (16 miles) from the volcano. http://photojournal.jpl.nasa.gov/catalog/PIA02608
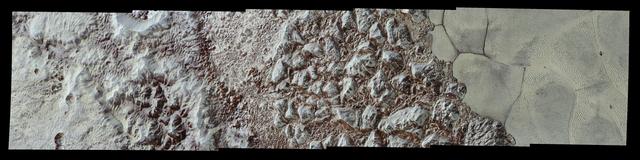
This enhanced color mosaic combines some of the sharpest views of Pluto that NASA's New Horizons spacecraft obtained during its July 14 flyby. The pictures are part of a sequence taken near New Horizons' closest approach to Pluto, with resolutions of about 250-280 feet (77-85 meters) per pixel -- revealing features smaller than half a city block on Pluto's surface. Lower resolution color data (at about 2,066 feet, or 630 meters, per pixel) were added to create this new image. The images form a strip 50 miles (80 kilometers) wide, trending (top to bottom) from the edge of "badlands" northwest of the informally named Sputnik Planum, across the al-Idrisi mountains, onto the shoreline of Pluto's "heart" feature, and just into its icy plains. They combine pictures from the telescopic Long Range Reconnaissance Imager (LORRI) taken approximately 15 minutes before New Horizons' closest approach to Pluto, with -- from a range of only 10,000 miles (17,000 kilometers) -- with color data (in near-infrared, red and blue) gathered by the Ralph/Multispectral Visible Imaging Camera (MVIC) 25 minutes before the LORRI pictures. The wide variety of cratered, mountainous and glacial terrains seen here gives scientists and the public alike a breathtaking, super-high-resolution color window into Pluto's geology. e border between the relatively smooth Sputnik Planum ice sheet and the pitted area, with a series of hills forming slightly inside this unusual "shoreline." http://photojournal.jpl.nasa.gov/catalog/PIA20213
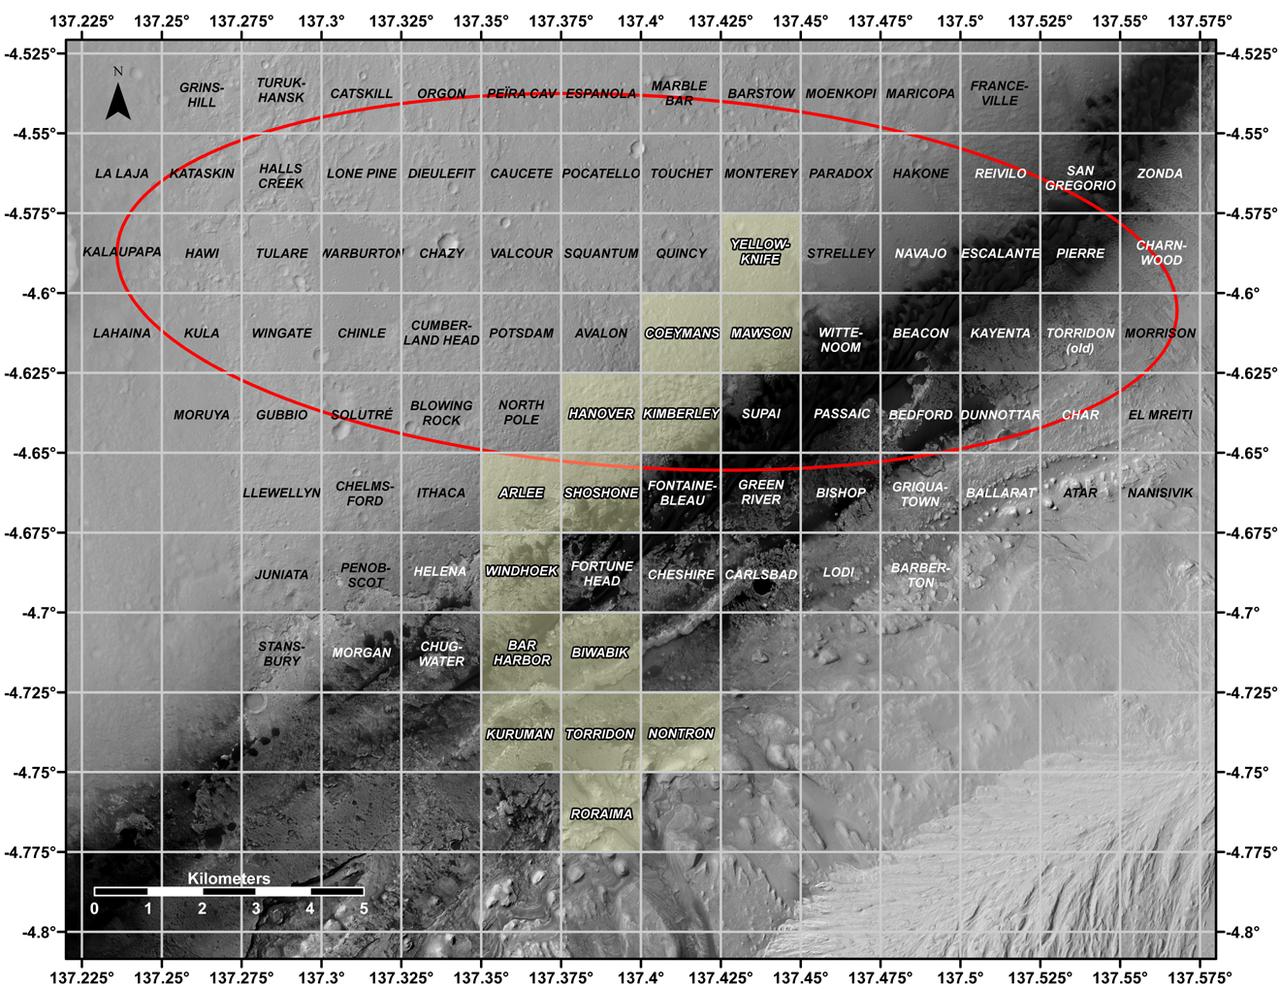
This map shows all the quadrant themes for NASA's Curiosity Mars rover, which is currently in the Roraima quadrant seen at the bottom. The red oval indicates the landing ellipse where the rover was targeted to touch down in 2012. The yellow-tinted quadrants are areas the rover has driven through since then. Themes are chosen in advance of the rover's arrival in a new quadrant; the rover's path couldn't be planned until after the team knew where it landed. Martian latitude and longitude is provided around the outside of the map. With the Curiosity mission, scientists began using quadrant themes to organize the long lists of unofficial nicknames needed to catalog its observations, whether hills, craters, boulders, rocks, and even tiny features on rock surfaces. Scientist deplete these lists of names quickly – especially with Curiosity, which has used more than 10,000 names over nearly 11 years of exploring Mars. Different science "targets" all require names – including targets for the rover's cameras, the rocks on which it places its arm instruments and drill, and the surfaces it zaps with its laser instrument. Curiosity's team chooses quadrant themes based on sites of geological interest on Earth. Its current quadrant, Roraima, is named for the northernmost state of Brazil, and for Mount Roraima, the highest peak in the Pacaraima mountains, located near the border of Venezuela, Brazil, and Guyana. The sulfate-enriched region Curiosity is currently exploring, with its flat-topped hills and steep slopes, reminded the rover team of the "table-top" mountains in the Pacaraima range. This is the first quadrant theme the team has chosen related to South America. Previously explored quadrants include Torridon, based on sites in Scotland, and Nontron, based on the French region where the town of Nontron can be found. While in the Nontron quadrant, which was located in a clay-enriched region, Curiosity drilled a rock sample that included a notable amount of nontronite – a clay mineral that was first discovered on Earth near Nontron. Each quadrant is 0.025 degrees of latitude and longitude, or approximately 0.7 miles (1.2 kilometers) on each side. https://photojournal.jpl.nasa.gov/catalog/PIA25914
STS059-S-084 (17 April 1994) --- This is a three-dimensional perspective of Mammoth Mountain, California. This view was constructed by overlaying a SIR-C radar image on a U.S. Geological Survey digital elevation map. Vertical exaggeration is 2x. The image is centered at 37.6 degrees north, 119.0 degrees west. It was acquired from the Spaceborne Imaging Radar-C and X-Band Synthetic Aperture Radar (SIR-C/X-SAR) onboard the Space Shuttle Endeavour on its 67th orbit, April 13, 1994. In this color representation, red is C-Band HV-polarization, green is C-Band VV-polarization and blue is the ratio of C-Band VV to C-Band HV. Blue areas are smooth and yellow areas are rock outcrops with varying amounts of snow and vegetation. Crowley Lake is in the foreground and Highway 395 crosses in the middle of the image. Mammoth Mountain is shown in the upper right. SIR-C/X-SAR is part of NASA's Mission to Planet Earth (MTPE). SIR-C/X-SAR radars illuminate Earth with microwaves allowing detailed observations at any time, regardless of weather or sunlight conditions. SIR-C/X-SAR uses three microwave wavelengths: L-Band (24 cm), C-Band (6 cm), and X-Band (3 cm). The multi-frequency data will be used by the international scientific community to better understand the global environment and how it is changing. The SIR-C/X-SAR data, complemented by aircraft and ground studies, will give scientists clearer insights into those environmental changes which are caused by nature and those changes which are induced by human activity. SIR-C was developed by NASA's Jet Propulsion Laboratory (JPL). X-SAR was developed by the Dornire and Alenia Spazio Companies for the German Space Agency, Deutsche Agentur fuer Raumfahrtangelegenheiten (DARA), and the Italian Space Agency, Agenzia Spaziale Italiana (ASI). JPL Photo ID: P-43933
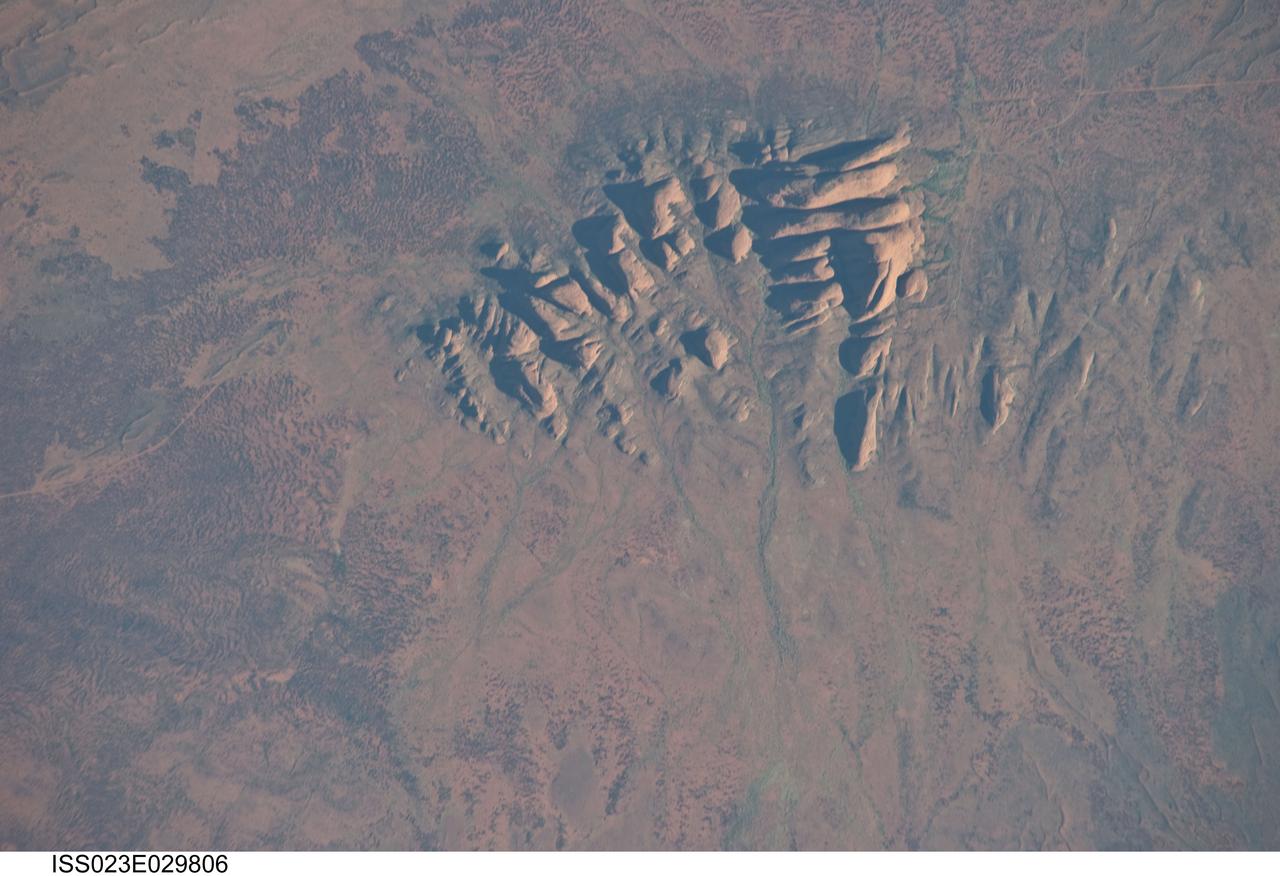
ISS023-E-029806 (30 April 2010) --- Kata Tjuta, Australia is featured in this image photographed by an Expedition 23 crew member on the International Space Station. Located in the Northern Territory of Australia, Uluru – Kata Tjuta National Park hosts some of the world’s most spectacular examples of inselbergs, or isolated mountains. The most famous of these inselbergs is Uluru (also known as Ayers Rock). An equally massive inselberg located approximately 30 kilometers to the northwest is known as Kata Tjuta– like Uluru, this is a sacred site to the native Anangu or Aboriginal people. Explorers named the highest peak Mount Olga, with the entire grouping of rocks informally known as “the Olgas”. Mount Olga has a peak elevation of 1,069 meters above sea level, making it 206 meters higher than Uluru. Kata Tjuta is comprised of gently dipping Mount Currie Conglomerate, a sedimentary rock that includes abundant rounded fragments of other rock types (here, primarily granite with less abundant basalt and rhyolite) in a coarse sandy matrix. Geologists interpret the Mount Currie Conglomerate as a remnant of a large fan of material rapidly eroded from mountains uplifted approximately 550 million years ago. Subsequent burial under younger sediments consolidated the eroded materials to form the conglomerate exposed at the surface today. In this photograph, afternoon sunlight highlights the rounded summits of Kata Tjuta against the surrounding sandy plains. Sand dunes are visible at upper right; while in other areas (image top and image left) sediments washed from the rocks have been anchored by a variety of grasses and bushes adapted to the arid climate. Green vegetation in the ephemeral stream channels that drain Kata Tjuta (bottom center) provides colorful contrast with the red rocks and surrounding soils. Large gaps in the rocks (highlighted by shadows) are thought to be fractures that have been enlarged due to erosion.
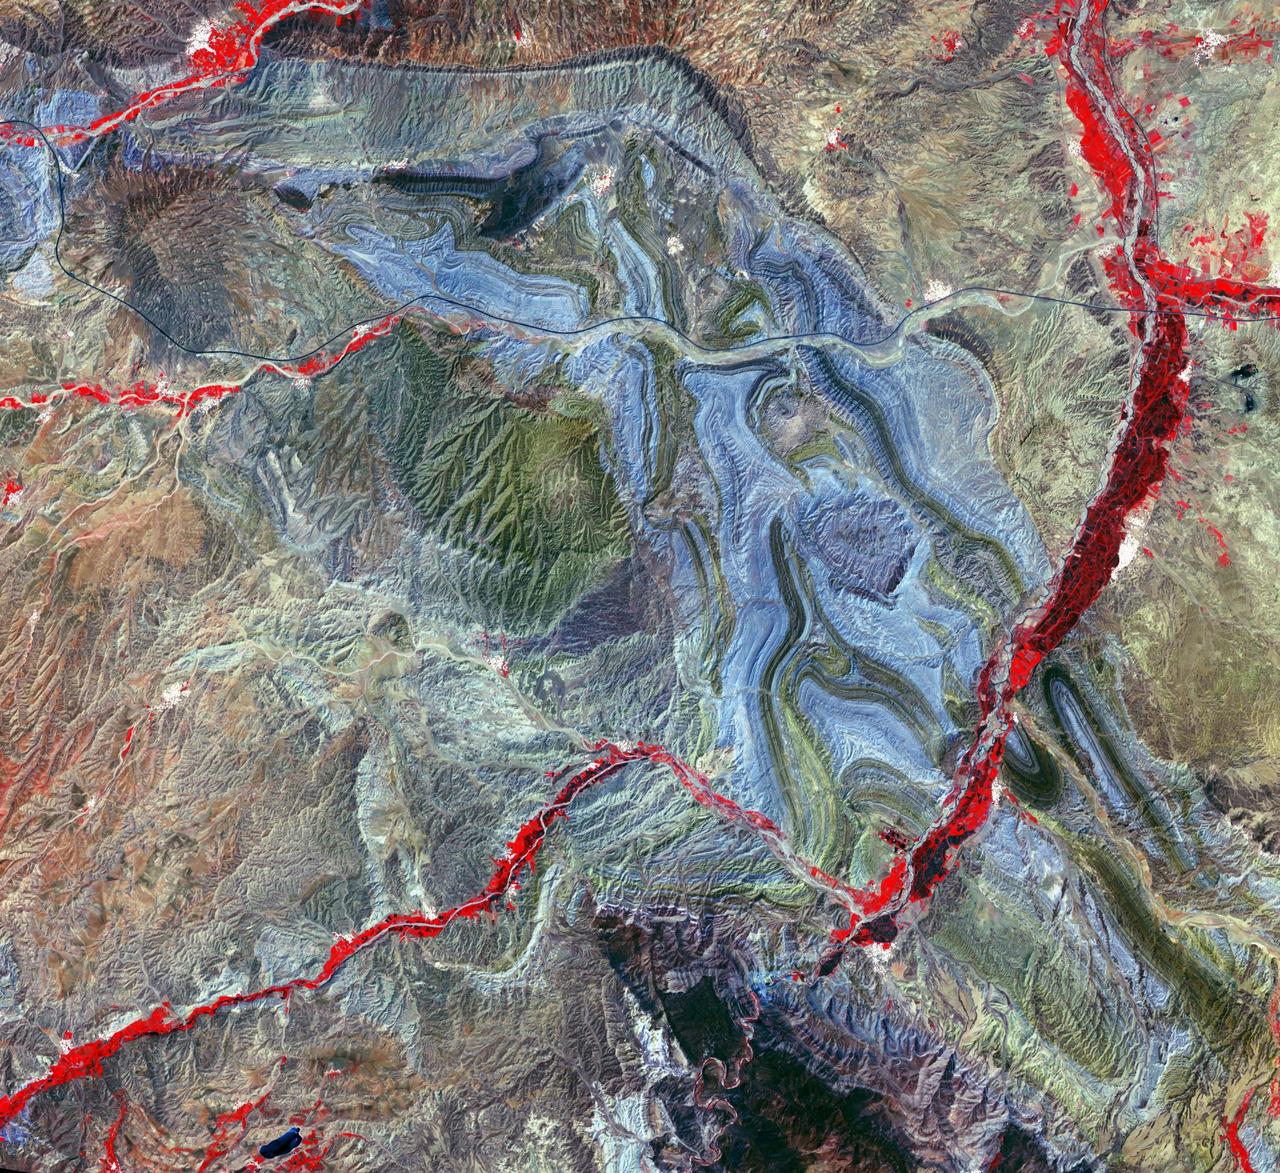
This radar image is centered near the small town of Pishan in northwest China, about 280 km (174 miles) southeast of the city of Kashgar along the ancient Silk Route in the Taklamakan desert of the Xinjiang Province. Geologists are using this radar image as a map to study past climate changes and tectonics of the area. The irregular lavender branching patterns in the center of the image are the remains of ancient alluvial fans, gravel deposits that have accumulated at the base of the mountains during times of wetter climate. The subtle striped pattern cutting across the ancient fans are caused by thrusting of the Kun Lun Mountains north. This motion is caused by the continuing plate-tectonic collision of India with Asia. Modern fans show up as large lavender triangles above the ancient fan deposits. Yellow areas on the modern fans are vegetated oases. The gridded pattern results from the alignment of poplar trees that have been planted as wind breaks. The reservoir at the top of the image is part of a sophisticated irrigation system that supplies water to the oases. This image was acquired by the Spaceborne Imaging Radar-C/X-band Synthetic Aperture Radar (SIR-C/X-SAR) aboard the space shuttle Endeavour in April 1994. This image is centered at 37.4 degrees north latitude, 78.3 degrees east longitude and shows an area approximately 50 km by 100 km (31 miles by 62 miles). The colors are assigned to different frequencies and polarizations of the radar as follows: Red is L-band horizontally transmitted, horizontally received; green is L-band horizontally transmitted, vertically received; and blue is C-band horizontally transmitted and vertically received. SIR-C/X-SAR, a joint mission of the German, Italian, and the United States space agencies, is part of NASA's Mission to Planet Earth. http://photojournal.jpl.nasa.gov/catalog/PIA01796
This is an X-band seasonal image of the central part of Lozere Departement situated south of the Massif Central in France. The image is 10 kilometers by 25 kilometers (6 miles by 15.5 miles) and is centered at approximately 44.3 degrees north latitude and 3 degrees east longitude. This image was acquired by the Spaceborne Imaging Radar-C/X-band Synthetic Aperture Radar aboard the space shuttle Endeavour on April 15, 1994 and on October 6, 1994. The image channels have the following color assignments: red was acquired in April; green was acquired in October; and blue is the ratio of the two data sets combined. Seasonal differences in the vegetation are visible in pink, which are heaths growing in the spring. This research area features two large limestone plateaus cut by the famous Gorges du Tarn, standing in parallel with the granite mountain range known as the Cevennes Mountains nearby. Land-use consists mainly of grasslands, heaths and forests. Forest types seen in the images are Austrian pines,Scots pines, spruce, fir and beech trees. Most forests were planted at the end of the 19th century through a national reforestation program aimed at reducing the strong erosion risks in these areas. This program was so successful that today the forests are exploited for forest pulpwood and sawlogs, but also remain protected as conservation regions. The study being performed in this area will assess the potential of spaceborne radar remote sensing for temperate forest type mapping and forest resource monitoring. The combination of X-band SAR data with lower frequency data (such as the SIR-C L-band data) allows scientists to distinguish forest tree species and biomass, or areas of ground vegetation. The lessons learned from the radar images of these controlled forest regions can be applied to larger areas and naturally grown forests to help ecologists protect and maintain them. The SIR-C/X-SAR images will be investigated by scientists from the remote sensing laboratory Cemagref in Montpellier and the National Forestry Board in Mende, France. http://photojournal.jpl.nasa.gov/catalog/PIA01755
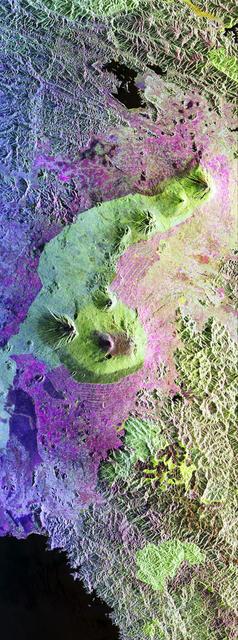
This is a false-color radar image of Central Africa, showing the Virunga Volcano chain along the borders of Rwanda, Zaire and Uganda. This area is home to the endangered mountain gorillas. This C-band L-band image was acquired on April 12, 1994, on orbit 58 of space shuttle Endeavour by the Spaceborne Imaging Radar-C/X-band Synthetic Aperture Radar (SIR-C/X-SAR). The area is centered at about 1.75 degrees south latitude and 29.5 degrees east longitude. The image covers an area 58 kilometers by 178 kilometers (48 miles by 178 miles). The false-color composite is created by displaying the L-band HH return in red, the L-band HV return in green and the C-band HH return in blue. The dark area in the bottom of the image is Lake Kivu, which forms the border between Zaire (to the left) and Rwanda (to the right). The airport at Goma, Zaire is shown as a dark line just above the lake in the bottom left corner of the image. Volcanic flows from the 1977 eruption of Mt. Nyiragongo are shown just north of the airport. Mt. Nyiragongo is not visible in this image because it is located just to the left of the image swath. Very fluid lava flows from the 1977 eruption killed 70 people. http://photojournal.jpl.nasa.gov/catalog/PIA01724
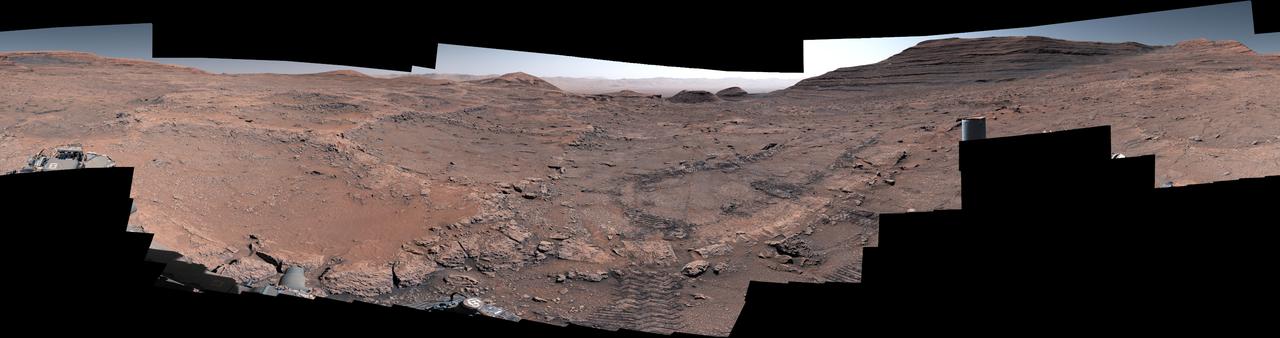
NASA's Curiosity Mars rover captured this 360-degree view after arriving at a region crisscrossed by hardened low ridges called boxwork patterns. The panorama is stitched together from 291 individual images the rover's Mast Camera, or Mastcam, captured between May 15 and May 18, 2025 (the 4,451st Martian day, or sol, of the mission and the 4,454th sol). The color in these images has been adjusted to match the lighting conditions as the human eye would see them on Earth. When viewed from space, the boxwork patterns look a bit like spiderwebs. They have fascinated scientists since before Curiosity's 2012 landing on the Red Planet and are believed to have formed from groundwater trickling through rock cracks billions of years ago. Minerals left behind by the water hardened like cement within the rock; after eons of sandblasting by wind, the rock was carved away, revealing networks of resistant ridges within. Curiosity's tracks can be seen in the middle of the image. In the distance to the right is a butte nicknamed "Texoli." Far in the distance at the top center of the image is the rim of Gale Crater. Since 2014, Curiosity has been exploring the foothills of Mount Sharp, a 3-mile-tall (5-kilometer-tall) mountain within the crater. https://photojournal.jpl.nasa.gov/catalog/PIA26559
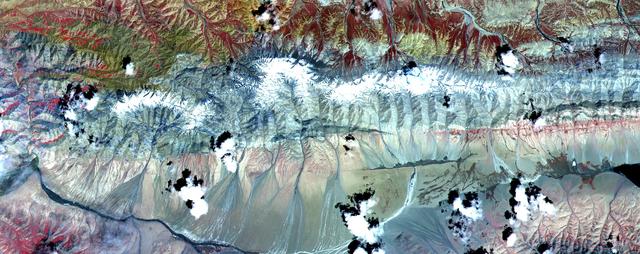
The Kunlun fault is one of the gigantic strike-slip faults that bound the north side of Tibet. Left-lateral motion along the 1,500-kilometer (932-mile) length of the Kunlun has occurred uniformly for the last 40,000 years at a rate of 1.1 centimeter per year, creating a cumulative offset of more than 400 meters (1300 feet). In this image, two splays of the fault are clearly seen crossing from east to west. The northern fault juxtaposes sedimentary rocks of the mountains against alluvial fans. Its trace is also marked by lines of vegetation, which appear red in the image. The southern, younger fault cuts through the alluvium. A dark linear area in the center of the image is wet ground where groundwater has pounded against the fault. Measurements from the image of displacements of young streams that cross the fault show 15 to 75 meters (16 to 82 yards) of left-lateral offset. This image of Tibet covers an area 40 kilometers (25 miles) wide and 15 kilometers (10 miles) long in three bands of the reflected visible and infrared wavelength region. ASTER acquired the scene on July 20, 2000. The image is located at 35.8 degrees north latitude and 93.6 degrees east longitude. http://photojournal.jpl.nasa.gov/catalog/PIA02658

On a test flight in Death Valley, California, an Airbus helicopter carried an engineering model of the Lander Vision System (LVS) that will help guide NASA's next Mars mission to a safe touchdown on the Red Planet. During the flight — one in a series — the helicopter (which is not part of the mission and was used just for testing) and its two-person crew flew a pre-planned sequence of maneuvers while LVS collected and analyzed imagery of the barren, mountainous terrain below. LVS is an integral part of a guidance system called Terrain-Relative Navigation (TRN) that will steer NASA's Mars 2020 rover away from hazardous areas during its final descent to Jezero Crater on Feb. 18, 2021. Mars 2020 will be the first spacecraft in the history of planetary exploration with the ability to accurately retarget its point of touchdown during the landing sequence. Also among the firsts of the mission, the 2020 rover carries a sample-caching system that will collect samples of Martian rock and soil and store them on the surface of the planet for retrieval and return to Earth by subsequent missions. Mars 2020 will launch from Cape Canaveral Air Force Station in Florida in July of 2020. https://photojournal.jpl.nasa.gov/catalog/PIA23265
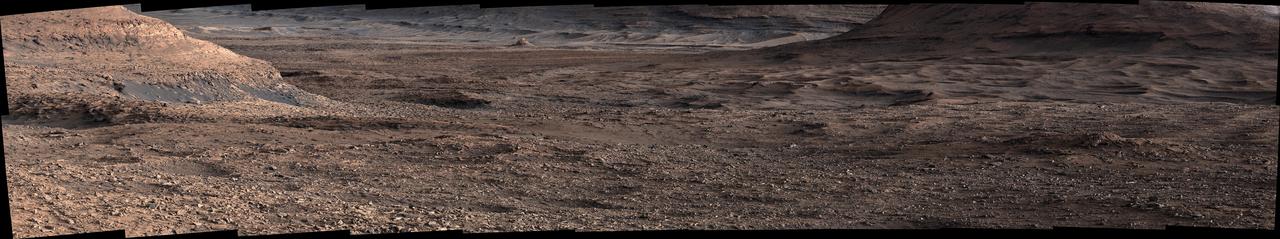
NASA's Curiosity Mars rover viewed this expanse while looking out across a region filled with low ridges known as boxwork patterns. The panorama is stitched together from 23 individual images the rover's Mast Camera, or Mastcam, captured on May 22, 2025 (the 4,536th day, or sol, of the mission). The color in these images has been adjusted to match the lighting conditions as the human eye would see them on Earth. When viewed from space, the boxwork patterns look a bit like spiderwebs. They have fascinated scientists since before Curiosity's 2012 landing on the Red Planet and are believed to have formed from groundwater trickling through rock cracks billions of years ago. Minerals left behind by the water hardened like cement within the rock; after eons of sandblasting by wind, the rock was carved away, revealing networks of resistant ridges within. Curiosity's images provide the first up-close views of the boxwork region, which is located in the foothills of Mount Sharp, a 3-mile-tall (5-kilometer-tall) mountain the rover has been ascending since 2014. Video available at https://photojournal.jpl.nasa.gov/catalog/PIA26560
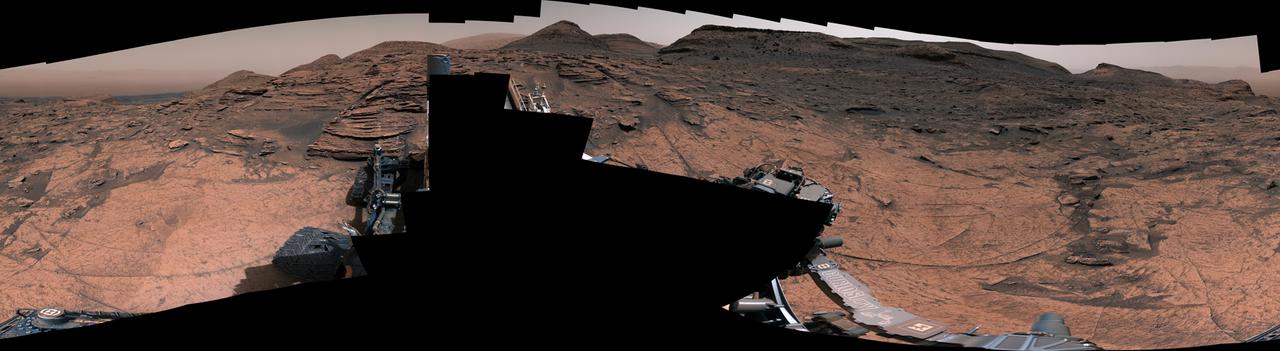
NASA's Curiosity Mars rover used its Mast Camera, or Mastcam, to take this 360-degree panorama of at the "Avanavero" drill site. The panorama is made up of 127 individual images taken on June 20, 2022, the 3,509th Martian day, or sol, of the mission, and stitched together back on Earth. The color has been adjusted to match the lighting conditions as the human eye would perceive them on Earth. At this location, Curiosity used the drill on its robotic arm to collect a rock sample for analysis by laboratory instruments inside the vehicle. It has collected more than three dozen such samples in its decade on the Red Planet. In the center of the panorama is a gap between two hills – nicknamed "Paraitepuy Pass" – that Curiosity is currently driving through; beyond it is a layered sulfate-bearing region, which represents a drier, saltier era in the history of Mount Sharp, the 3-mile-tall (5-kilometer-tall) mountain the rover has been ascending since 2014. https://photojournal.jpl.nasa.gov/catalog/PIA25407
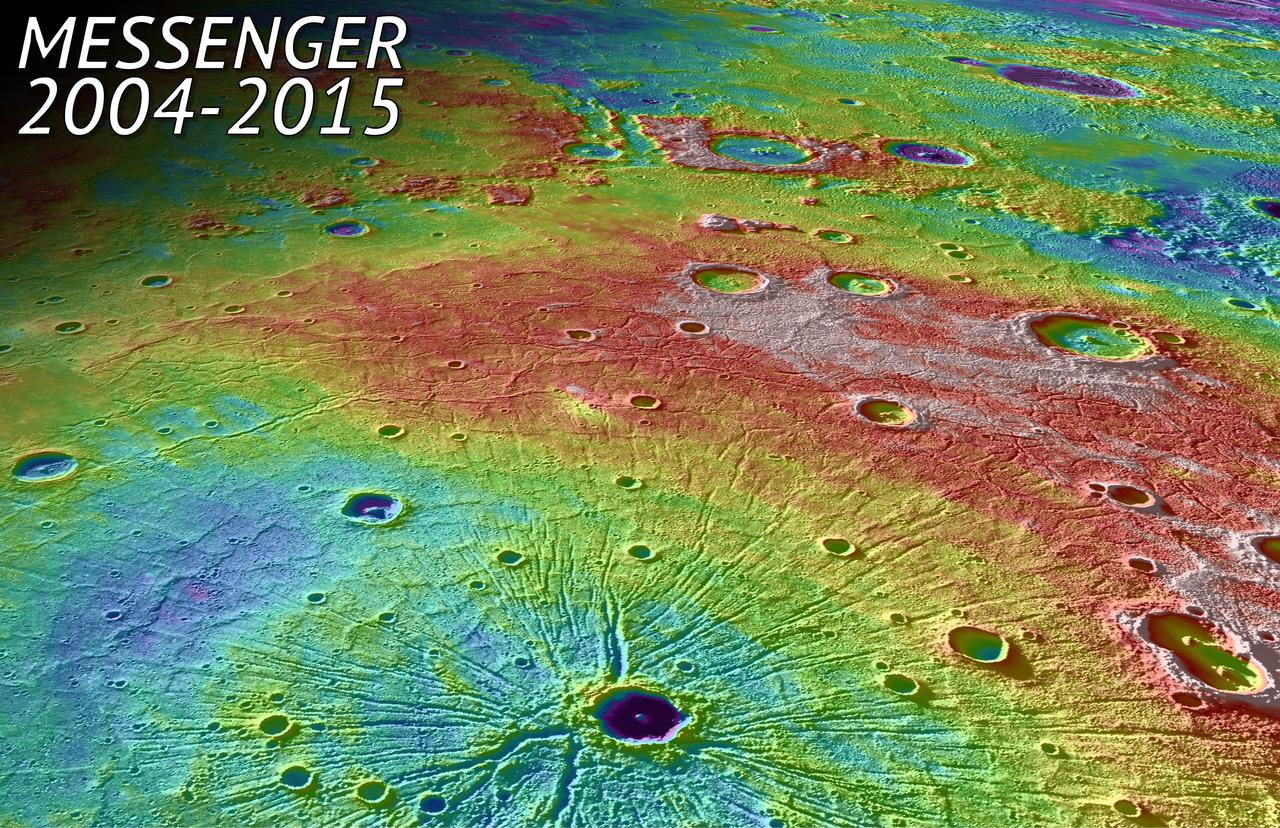
In this perspective view, NASA MESSENGER spacecraft looked northwest over the Caloris Basin, a depression about 1500 km in diameter formed several billion years ago by the impact of a large projectile into the surface of Mercury. The mountain range at the edge of the basin can be seen as an arc in the background. In the foreground, we see a set of tectonic troughs, known as Pantheon Fossae, radiating from the center of the basin outward toward the edge of the basin interior. A 41-km-diameter impact crater, Apollodorus, is superposed just slightly off from the center of Pantheon Fossae. White and red are high topography, and greens and blues are low topography, with a total height differences of roughly 4 km. The MESSENGER spacecraft was launched in 2004 and ended it's orbital operations yesterday, April 30, 2015, by impacting Mercury's surface. Background image texture is provided by the Mercury Dual Imaging System (MDIS) instrument while color corresponds to surface elevation data obtained from the Mercury Laser Altimeter (MLA) experiment, with both draped over a digital elevation model derived from MLA altimetric data. Instrument: Mercury Dual Imaging System (MDIS) and Mercury Laser Altimeter (MLA) Approximate Center Latitude: 33.7° N Approximate Center Longitude: 158.7° E Scale: Apollodorus crater is approximately 41 km (25 miles) in diameter http://photojournal.jpl.nasa.gov/catalog/PIA19450
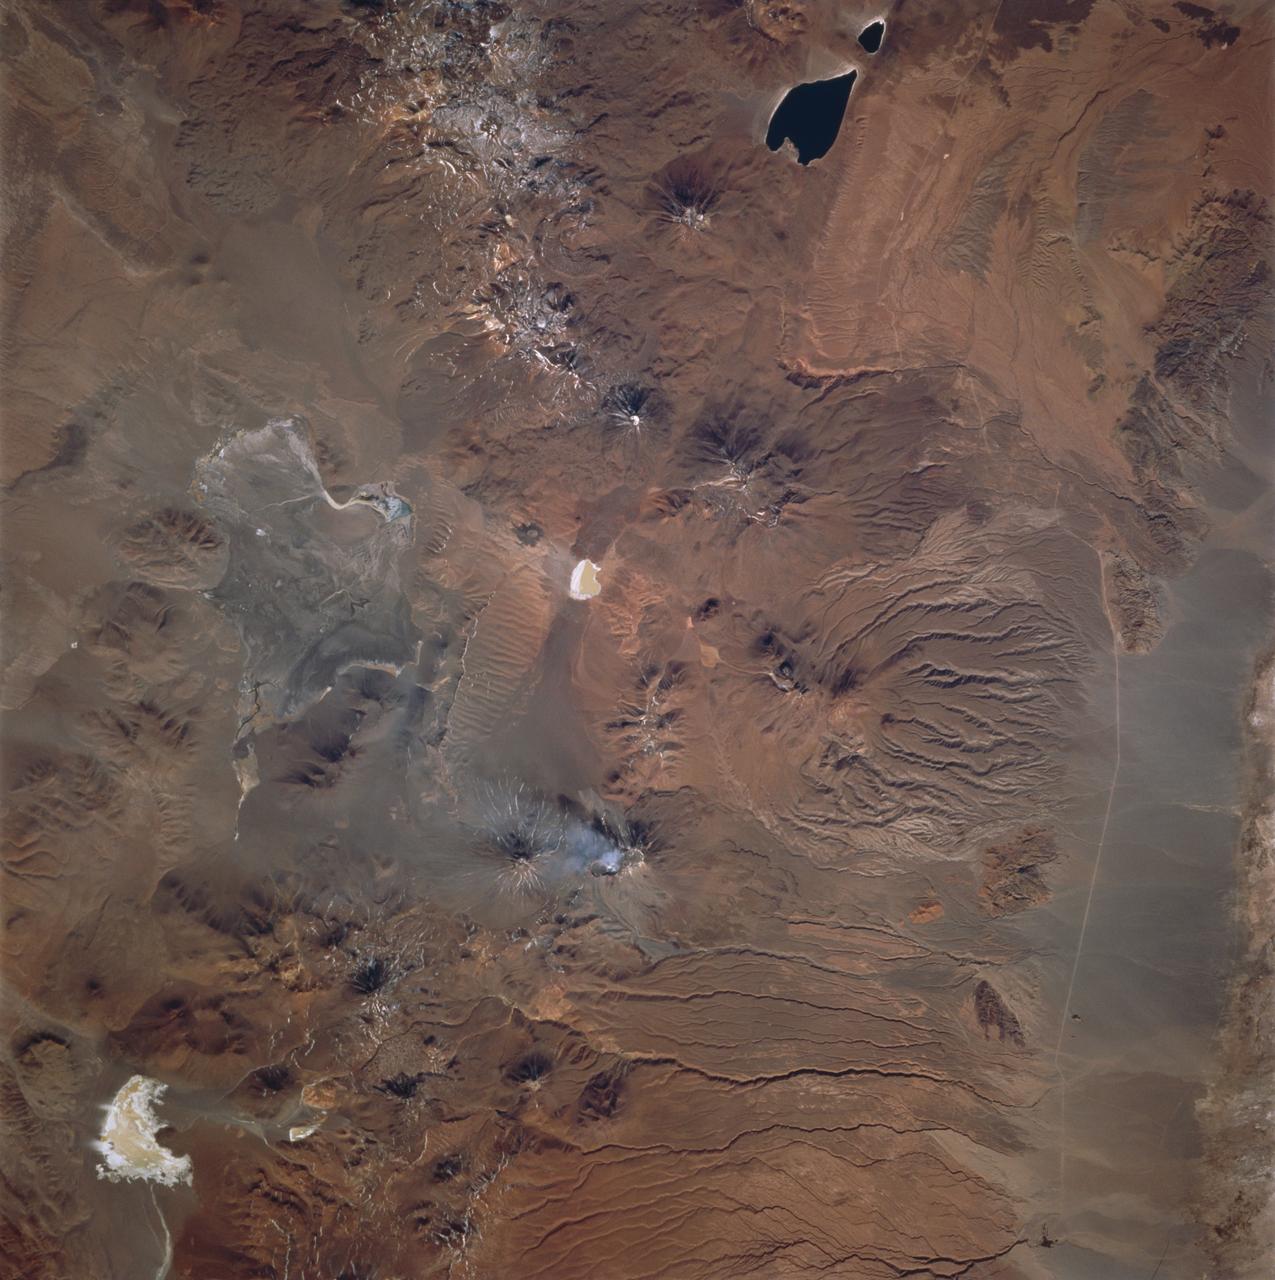
STS077-740-029 (19-29 May 1996) --- In recent years, the most active peak in the High Altiplano of the central Andes Mountains has been Lascar, in northern Chile - featured in this 70mm frame. North is to the left in this picture. Lascar?s largest recent eruption was in April, 1993. The STS-55 crew photographed large dust plumes carrying the newly-deposited ash about one week after the eruption. Since then, astronauts have been closely monitoring Lascar, which remains active. This crew noticed and photographed Lascar?s plume, which is shown here as a steam plume rising from Lascar?s central summit crater. This level of activity is typical. This view also shows the extent of weathering as determined by the surface color of the 1993 flow from the crater. The flow traveled down the valley which is to the left (north) and then down (west) from the summit of this image. In earlier views the flow was a light gray, almost white feature in the valley. Today, the flow is close to the red-brown color of the surrounding rock.
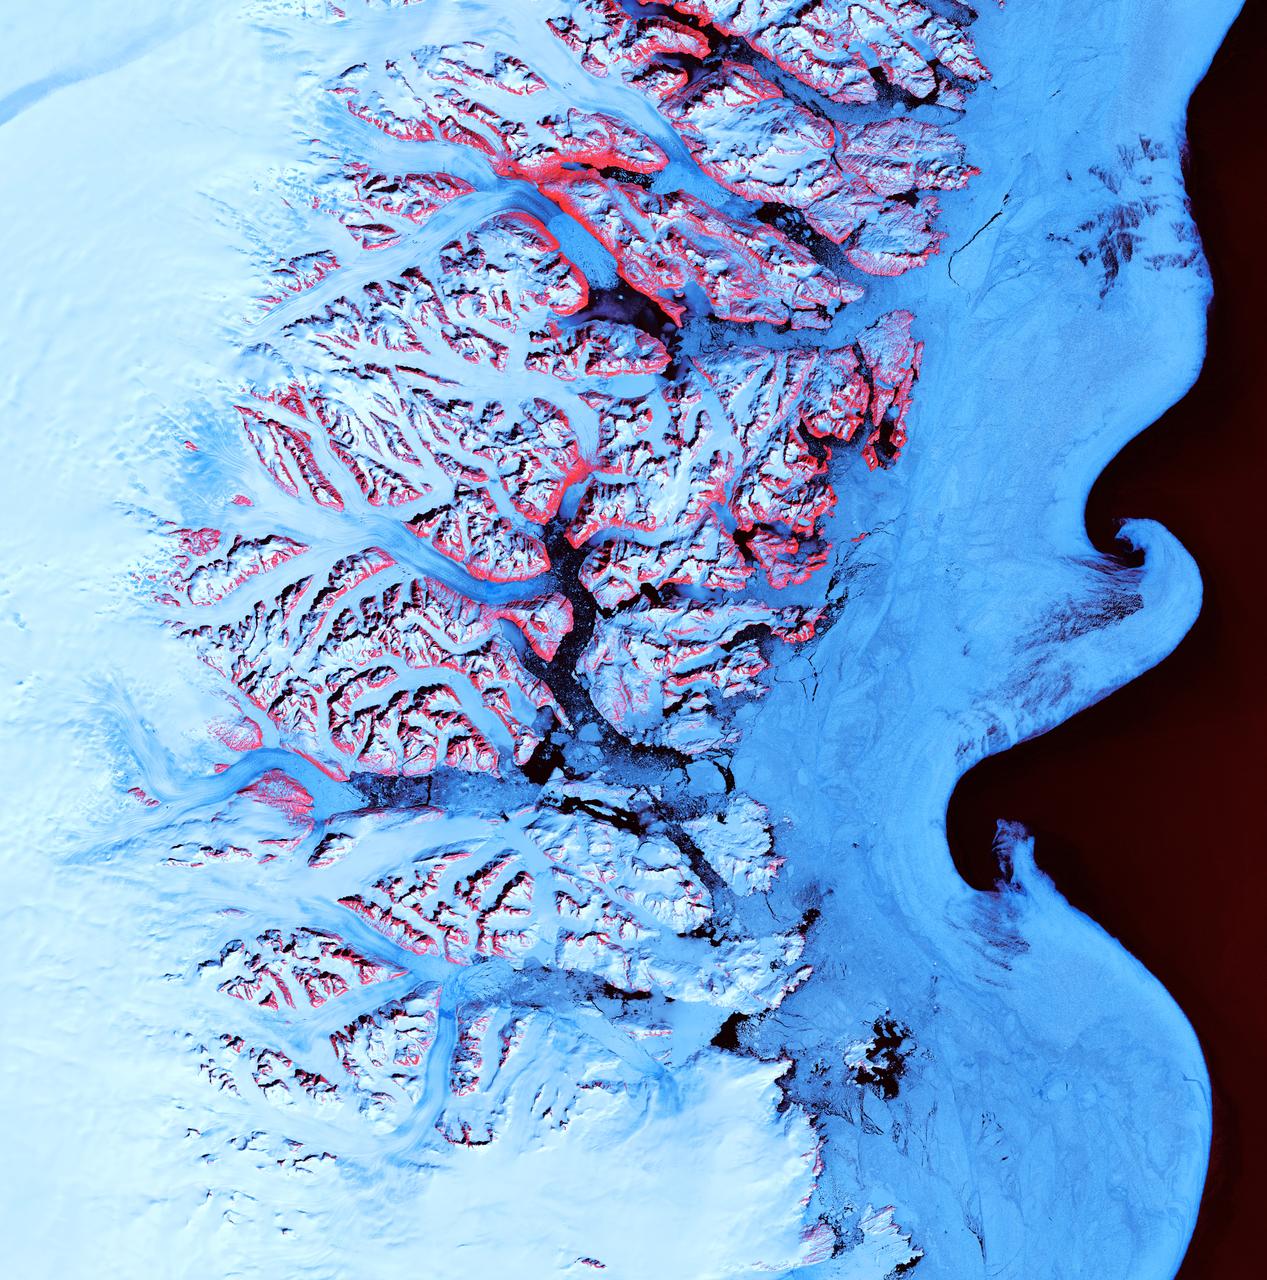
Ice Waves - May 21st, 2001 Description: Along the southeastern coast of Greenland, an intricate network of fjords funnels glacial ice to the Atlantic Ocean. During the summer melting season, newly calved icebergs join slabs of sea ice and older, weathered bergs in an offshore slurry that the southward-flowing East Greenland Current sometimes swirls into stunning shapes. Exposed rock of mountain peaks, tinted red in this image, hints at a hidden landscape. Credit: USGS/NASA/Landsat 7 To learn more about the Landsat satellite go to: <a href="http://landsat.gsfc.nasa.gov/" rel="nofollow">landsat.gsfc.nasa.gov/</a> <b><a href="http://www.nasa.gov/centers/goddard/home/index.html" rel="nofollow">NASA Goddard Space Flight Center</a></b> enables NASA’s mission through four scientific endeavors: Earth Science, Heliophysics, Solar System Exploration, and Astrophysics. Goddard plays a leading role in NASA’s accomplishments by contributing compelling scientific knowledge to advance the Agency’s mission. <b>Follow us on <a href="http://twitter.com/NASA_GoddardPix" rel="nofollow">Twitter</a></b> <b>Join us on <a href="http://www.facebook.com/pages/Greenbelt-MD/NASA-Goddard/395013845897?ref=tsd" rel="nofollow">Facebook</a></b>

NASA image acquired July 27, 2001 In southwestern Jordan lies an unusual landscape. Mountains of granite and sandstone rise next to valleys filled with red sand. Some of the mountains reach a height of about 1,700 meters (5,600 feet) above sea level, and many have near-vertical slopes. So alien is this landscape, it’s nicknamed “Valley of the Moon,” and it has served as the film set for a movie about Mars. Yet nomadic people have lived here for thousands of years. Declared a protected area in 1998, this unearthly landscape is Wadi Rum. The Advanced Land Imager (ALI) on NASA’s Earth Observing-1 (EO-1) satellite captured this natural-color image on July 27, 2001. The scene includes part of Wadi Rum and an adjacent area to the east. East of the protected area, fields with center-pivot irrigation make circles of green and brown (image upper right). As the earth tones throughout the image attest, the area is naturally arid, receiving little annual precipitation and supporting only sparse vegetation. Between rocky peaks, the sandy valleys range in color from beige to brick. Ancient granite rocks dating from the Precambrian underlie younger rocks, and some of these basement rocks have eroded into rugged, steep-sloped mountains. The granite mountains have risen thanks partly to crisscrossing fault lines under the park. Overlying the granite are sandstones from the Cambrian and Ordovician Periods, as well as loose sands. Lawrence of Arabia, who fought in the Arab Revolt of 1917–1918, made frequent references to Wadi Rum in his book The Seven Pillars of Wisdom. Likewise, a prominent feature of the protected area is named after the book. Several popular sites in Wadi Rum bear Lawrence of Arabia’s name, but whether he actually visited those sites is uncertain. To download the full high res go to: <a href="http://earthobservatory.nasa.gov/IOTD/view.php?id=49945" rel="nofollow">earthobservatory.nasa.gov/IOTD/view.php?id=49945</a> NASA Earth Observatory image created by Jesse Allen and Robert Simmon, using EO-1 ALI data provided courtesy of the NASA EO-1 team and the United States Geological Survey. Caption by Michon Scott. Instrument: EO-1 - ALI Credit: <b><a href="http://www.earthobservatory.nasa.gov/" rel="nofollow"> NASA Earth Observatory</a></b> <b><a href="http://www.nasa.gov/centers/goddard/home/index.html" rel="nofollow">NASA Goddard Space Flight Center</a></b> enables NASA’s mission through four scientific endeavors: Earth Science, Heliophysics, Solar System Exploration, and Astrophysics. Goddard plays a leading role in NASA’s accomplishments by contributing compelling scientific knowledge to advance the Agency’s mission. <b>Follow us on <a href="http://twitter.com/NASA_GoddardPix" rel="nofollow">Twitter</a></b> <b>Join us on <a href="http://www.facebook.com/pages/Greenbelt-MD/NASA-Goddard/395013845897?ref=tsd" rel="nofollow">Facebook</a></b>
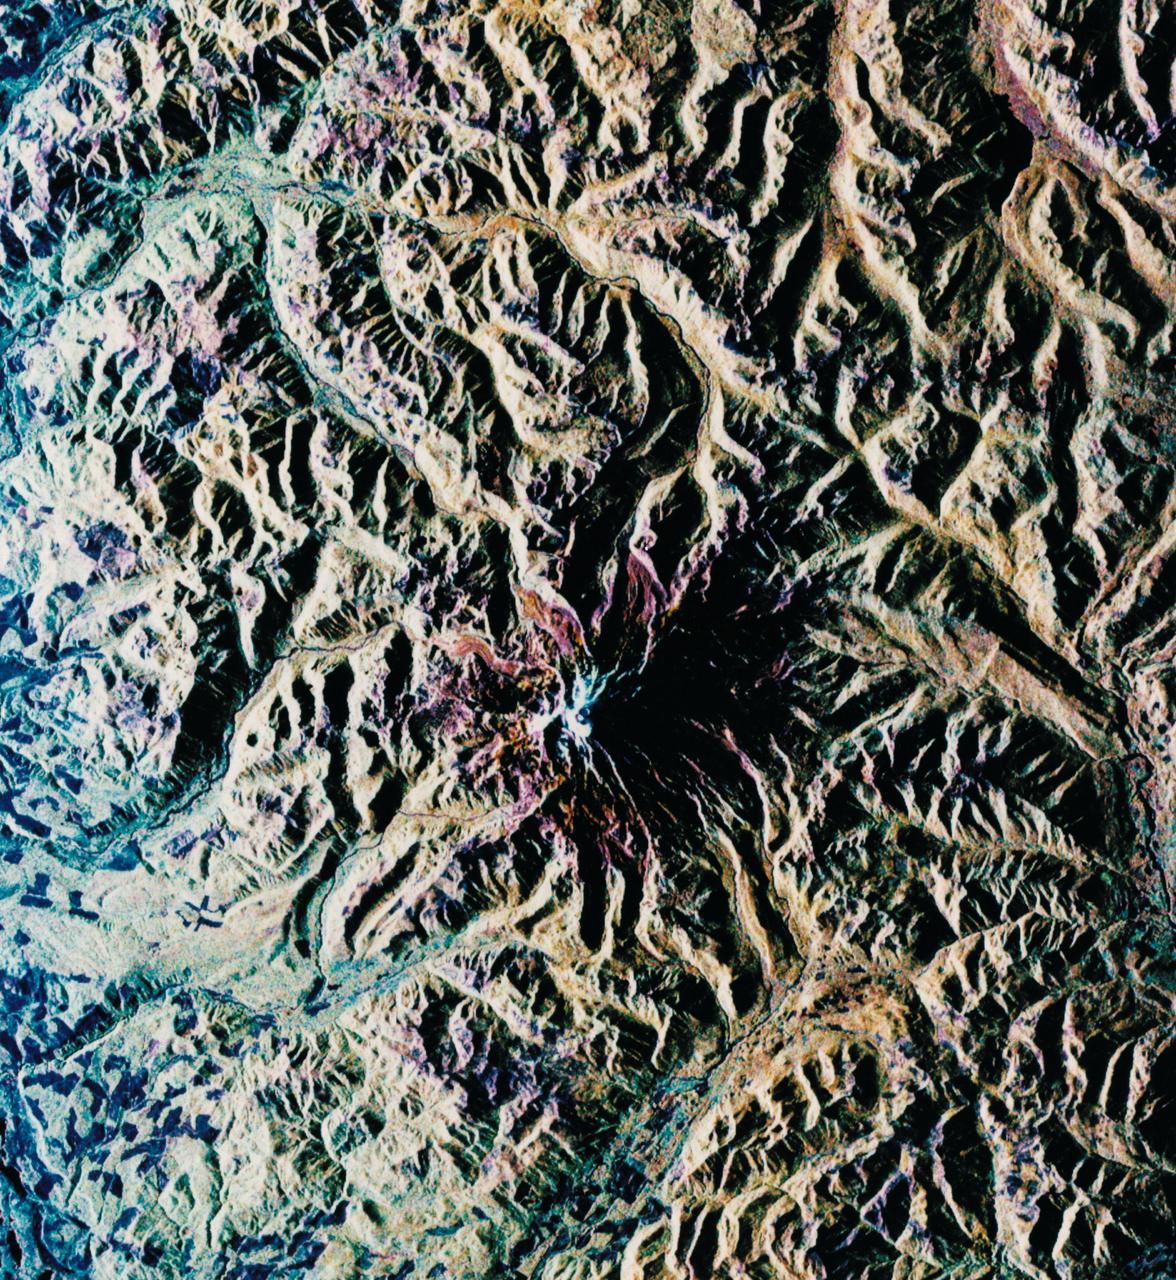
STS068-S-052 (3 October 1994) --- This is a radar image of Mount Rainier in Washington state. The volcano last erupted about 150 years ago and numerous large floods and debris flows have originated on its slopes during the last century. Today the volcano is heavily mantled with glaciers and snow fields. More than 100,000 people live on young volcanic mud flows less than 10,000 years old and, are within the range of future, devastating mud slides. This image was acquired by the Spaceborne Imaging Radar-C/X-Band Synthetic Aperture Radar (SIR-C/X-SAR) aboard the Space Shuttle Endeavour on its 20th orbit on October 1, 1994. The area shown in the image is approximately 59 by 60 kilometers (36.5 by 37 miles). North is toward the top left of the image, which was composed by assigning red and green colors to the L-Band, horizontally transmitted and vertically, and the L-Band, horizontally transmitted and vertically received. Blue indicates the C-Band, horizontally transmitted and vertically received. In addition to highlighting topographic slopes facing the Space Shuttle, SIR-C records rugged areas as brighter and smooth areas as darker. The scene was illuminated by the Shuttle's radar from the northwest so that northwest-facing slopes are brighter and southeast-facing slopes are dark. Forested regions are pale green in color, clear cuts and bare ground are bluish or purple; ice is dark green and white. The round cone at the center of the image is the 14,435 feet (4,399 meters) active volcano, Mount Rainier. On the lower slopes is a zone of rock ridges and rubble (purple to reddish) above coniferous forests (in yellow/green). The western boundary of Mount Rainier National Park is seen as a transition from protected, old-growth forest to heavily logged private land, a mosaic of recent clear cuts (bright purple/blue) and partially re-grown timber plantations (pale blue). The prominent river seen curving away from the mountain at the top of the image (to the northwest) is the White River, and the river leaving the mountain at the bottom right of the image (south) is the Nisqually River, which flows out of the Nisqually glacier on the mountain. The river leaving to the left of the mountain is the Carbon River, leading west and north toward heavily populated regions near Tacoma. The dark patch at the top right of the image is Bumping Lake. Other dark areas seen to the right of ridges throughout the image are radar shadow zones. Radar images can be used to study the volcanic structure and the surrounding regions with linear rock boundaries and faults. In addition, the recovery of forested lands from natural disasters and the success of re-forestation programs can also be monitored. Ultimately this data may be used to study the advance and retreat of glaciers and other forces of global change. Spaceborne Imaging Radar-C/X-Band Synthetic Aperture Radar (SIR-C/X-SAR) is part of NASA's Mission to Planet Earth. (P-44703)
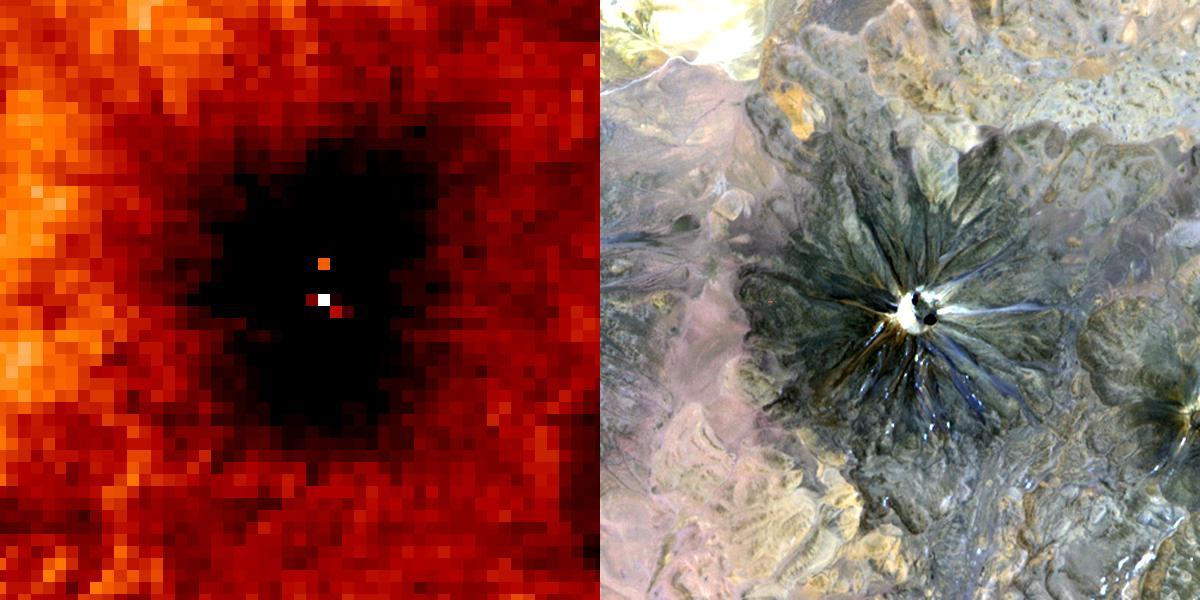
A January 6, 2002 ASTER nighttime thermal infrared image of Chiliques volcano in Chile shows a hot spot in the summit crater and several others along the upper flanks of the edifice, indicating new volcanic activity. Examination of an earlier nighttime thermal infrared image from May 24, 2000 showed no thermal anomaly. Chiliques volcano was previously thought to be dormant. Rising to an elevation of 5778 m, Chiliques is a simple stratovolcano with a 500-m-diameter circular summit crater. This mountain is one of the most important high altitude ceremonial centers of the Incas. It is rarely visited due to its difficult accessibility. Climbing to the summit along Inca trails, numerous ruins are encountered; at the summit there are a series of constructions used for rituals. There is a beautiful lagoon in the crater that is almost always frozen. The daytime image was acquired on November 19, 2000 and was created by displaying ASTER bands 1,2 and 3 in blue, green and red. The nighttime image was acquired January 6, 2002, and is a color-coded display of a single thermal infrared band. The hottest areas are white, and colder areas are darker shades of red. Both images cover an area of 7.5 x 7.5 km, and are centered at 23.6 degrees south latitude, 67.6 degrees west longitude. Both images cover an area of 7.5 x 7.5 km, and are centered at 23.6 degrees south latitude, 67.6 degrees west longitude. http://photojournal.jpl.nasa.gov/catalog/PIA03493
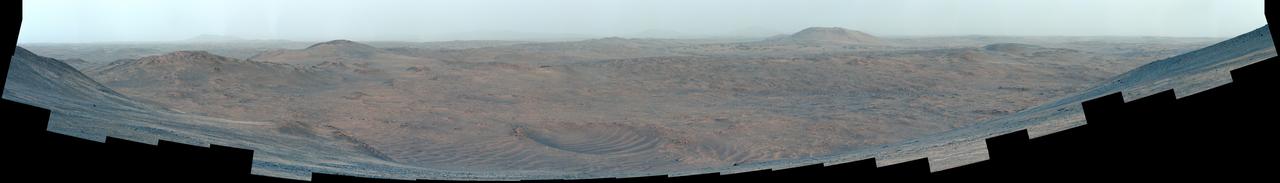
This enhanced-color mosaic showing the Martian surface outside of Jezero Crater was taken by NASA's Perseverance from the crater rim at a location where the rover collected a sample dubbed "Silver Mountain." The 83 frames used to generate the mosaic were acquired by the rover's Mastcam-Z instrument on Dec. 25, 2024, the 1,368th Martian day, or sol, of Perseverance's mission. Enhanced-color images have their color bands processed to improve visual contrast and accentuate color differences. Arizona State University leads the operations of the Mastcam-Z instrument, working in collaboration with Malin Space Science Systems in San Diego, on the design, fabrication, testing, and operation of the cameras, and in collaboration with the Niels Bohr Institute of the University of Copenhagen on the design, fabrication, and testing of the calibration targets. A key objective for Perseverance's mission on Mars is astrobiology, including the search for signs of ancient microbial life. The rover will characterize the planet's geology and past climate, pave the way for human exploration of the Red Planet, and be the first mission to collect and cache Martian rock and regolith (broken rock and dust). Subsequent NASA missions, in cooperation with ESA (European Space Agency), would send spacecraft to Mars to collect these sealed samples from the surface and return them to Earth for in-depth analysis. The Mars 2020 Perseverance mission is part of NASA's Mars Exploration Program (MEP) portfolio and the agency's Moon to Mars exploration approach, which includes Artemis missions to the Moon that will help prepare for human exploration of the Red Planet. https://photojournal.jpl.nasa.gov/catalog/PIA26530
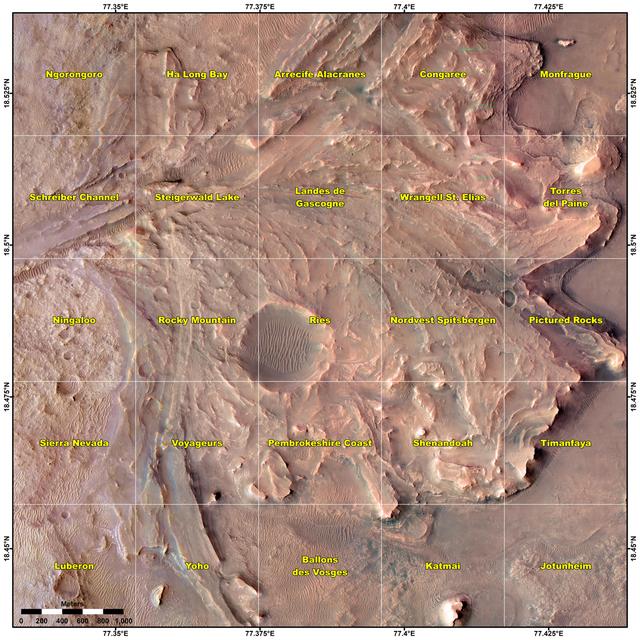
This map shows various quadrant themes in the vicinity of NASA's Perseverance Mars rover, which is currently in the Rocky Mountain quadrant within the much broader Jezero Crater. Each quadrant is 0.7 miles (1.2 kilometers) on each side. The Perseverance team chose quadrant themes related to various national parks across Earth, from Shenandoah National Park in Virginia to Jotunheimen National Park in Norway. The themes help organize the unofficial nicknames that are given by rover team members to different surface features they want to study, such as hills, craters, boulders, and even specific rock surfaces. The first sedimentary rock core sample the rover took was from a rock nicknamed "Skinner Ridge" for a ridge in Shenandoah National Park when Perseverance was in that quadrant. Many hundreds of names are compiled into a list based on each theme and are applied as the rover explores that quadrant. Rovers can sometimes end up exploring a quadrant for months, exhausting the list of names and prompting a new list to be drawn up. A key objective for Perseverance's mission on Mars is astrobiology, including the search for signs of ancient microbial life. The rover will characterize the planet's geology and past climate, pave the way for human exploration of the Red Planet, and be the first mission to collect and cache Martian rock and regolith (broken rock and dust). Subsequent NASA missions, in cooperation with ESA (European Space Agency), would send spacecraft to Mars to collect these sealed samples from the surface and return them to Earth for in-depth analysis. The Mars 2020 Perseverance mission is part of NASA's Moon to Mars exploration approach, which includes Artemis missions to the Moon that will help prepare for human exploration of the Red Planet. https://photojournal.jpl.nasa.gov/catalog/PIA25913
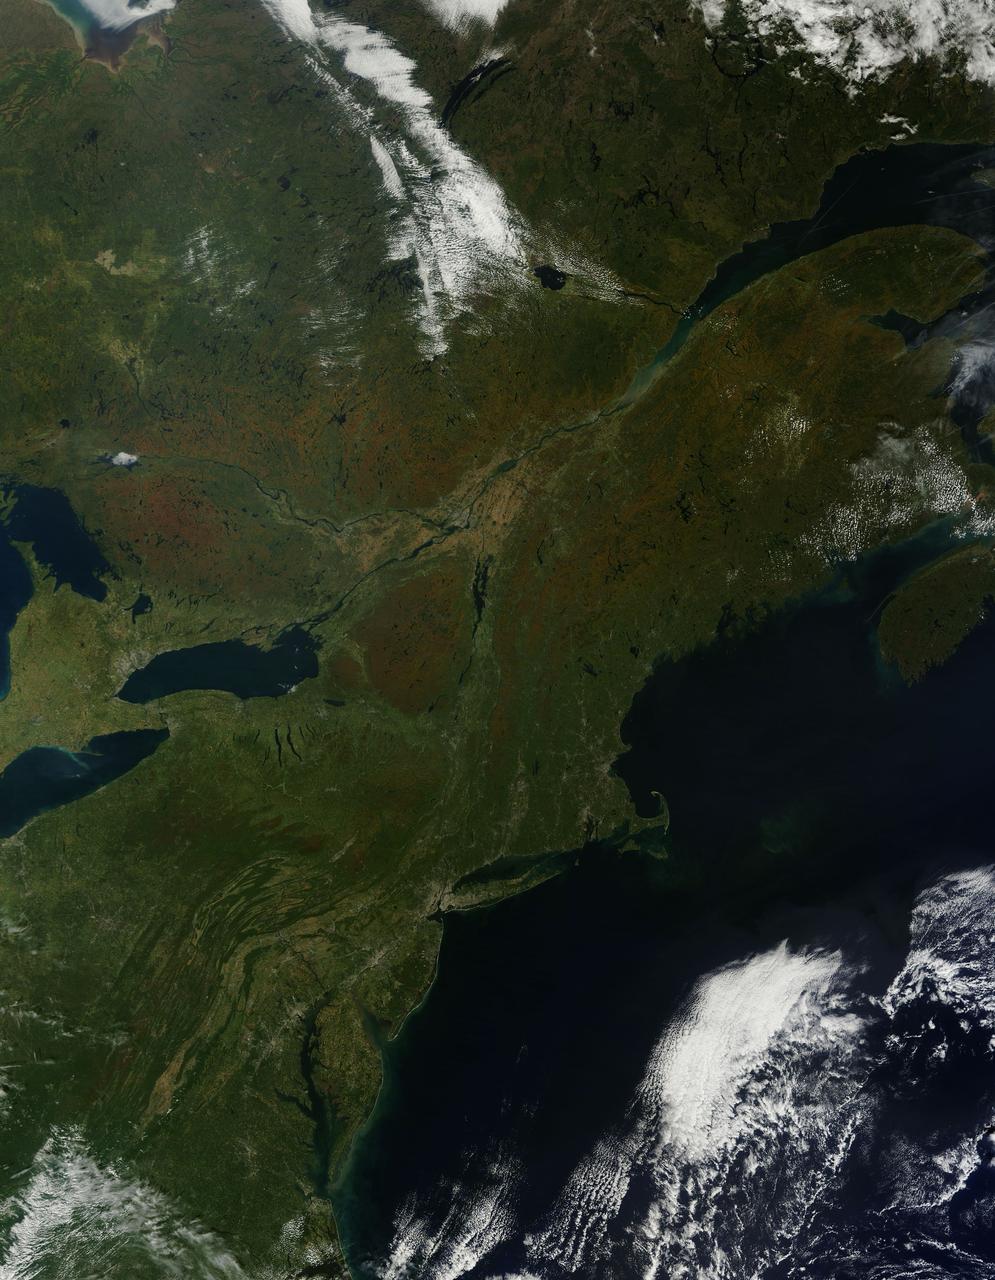
As temperatures dropped and daylight began to shorten, autumn colors began to wash over the deciduous forests of North America. The Moderate Resolution Imaging Spectroradiometer (MODIS) aboard NASA’s Terra satellite captured this true-color image of the northeastern United States and Canada on September 27, 2014. Washes of orange, brown and yellow are brightest in the Upper Peninsula of Michigan, upstate New York, New Hampshire, Vermont, Maine, and southern Quebec and Ontario. Also, faint traces of phytoplankton blooms can be seen in the offshore waters of the Atlantic Ocean. The transition of autumn leaves from green, to glowing with colors, to browning and dropping to the ground, involve several complex interactions and reactions. However, length of sunlight and the temperature changes are dominant factors. Topography also plays a role, as does latitude. Temperature tends to drop faster at higher elevations and at higher latitudes, and day length shortens more quickly at higher latitudes. Color change tends to begin in the north and sweep southward, and change begins at mountain tops then moves into valleys. As explained by the U.S. Forest Service, certain species of trees produce certain colors. Oaks generally turn red, brown, or russet; hickories become golden bronze; aspen and yellow-poplar turn golden. Maples differ by species. Red maple turns brilliant scarlet; sugar maple, orange-red; and black maple, yellow. Leaves of some trees, such as elms, simply become brown. Credit: NASA/GSFC/Jeff Schmaltz/MODIS Land Rapid Response Team <b><a href="http://www.nasa.gov/audience/formedia/features/MP_Photo_Guidelines.html" rel="nofollow">NASA image use policy.</a></b> <b><a href="http://www.nasa.gov/centers/goddard/home/index.html" rel="nofollow">NASA Goddard Space Flight Center</a></b> enables NASA’s mission through four scientific endeavors: Earth Science, Heliophysics, Solar System Exploration, and Astrophysics. Goddard plays a leading role in NASA’s accomplishments by contributing compelling scientific knowledge to advance the Agency’s mission. <b>Follow us on <a href="http://twitter.com/NASAGoddardPix" rel="nofollow">Twitter</a></b> <b>Like us on <a href="http://www.facebook.com/pages/Greenbelt-MD/NASA-Goddard/395013845897?ref=tsd" rel="nofollow">Facebook</a></b> <b>Find us on <a href="http://instagram.com/nasagoddard?vm=grid" rel="nofollow">Instagram</a></b>
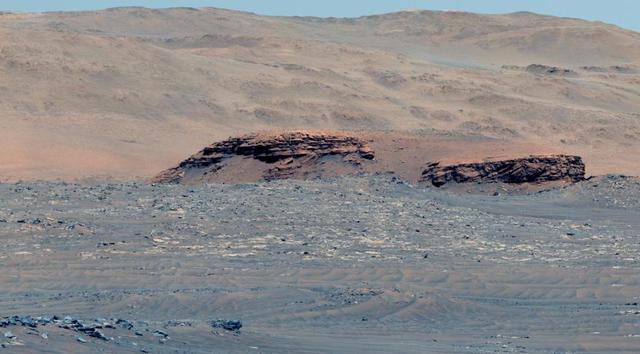
This 60-second video pans across an enhanced-color composite image, or mosaic, of the delta at Jezero Crater on Mars. The delta formed billions of years ago from sediment that an ancient river carried to the mouth of the lake that once existed in the crater. Taken by the Mastcam-Z instrument aboard NASA's Perseverance rover, the video begins looking almost due west of the rover, and sweeps to the right until it faces almost due north. Fourteen images compose the mosaic that provides the base image for this video (included as an additional figure); they were acquired on Nov. 28, 2021 (the 275th sol, or Martian day, of Perseverance's mission) as the rover sat at the highest vantage point in the "South Séítah" geological unit, allowing a perspective that included boulders and other features atop the delta as well as farther west and northwest across its surface. The mountains in the background are the rim of Jezero Crater. The view also shows brown hills in the middle distance that are part of an ancient delta, where a river hit a lake in the crater. The rover has spent the last several months exploring the sandy and rocky terrain in the foreground. The color bands of the image have been processed to improve visual contrast and accentuate color differences. The sky would not actually look blue to a human explorer on the Red Planet. The Mastcam-Z investigation is led and operated by Arizona State University in Tempe, working in collaboration with Malin Space Science Systems in San Diego, California, on the design, fabrication, testing, and operation of the cameras, and in collaboration with the Neils Bohr Institute of the University of Copenhagen on the design, fabrication, and testing of the calibration targets. A key objective for Perseverance's mission on Mars is astrobiology, including the search for signs of ancient microbial life. The rover will characterize the planet's geology and past climate, pave the way for human exploration of the Red Planet, and be the first mission to collect and cache Martian rock and regolith (broken rock and dust). Subsequent NASA missions, in cooperation with ESA (European Space Agency), would send spacecraft to Mars to collect these sealed samples from the surface and return them to Earth for in-depth analysis. The Mars 2020 Perseverance mission is part of NASA's Moon to Mars exploration approach, which includes Artemis missions to the Moon that will help prepare for human exploration of the Red Planet. Movie available at https://photojournal.jpl.nasa.gov/catalog/PIA25022
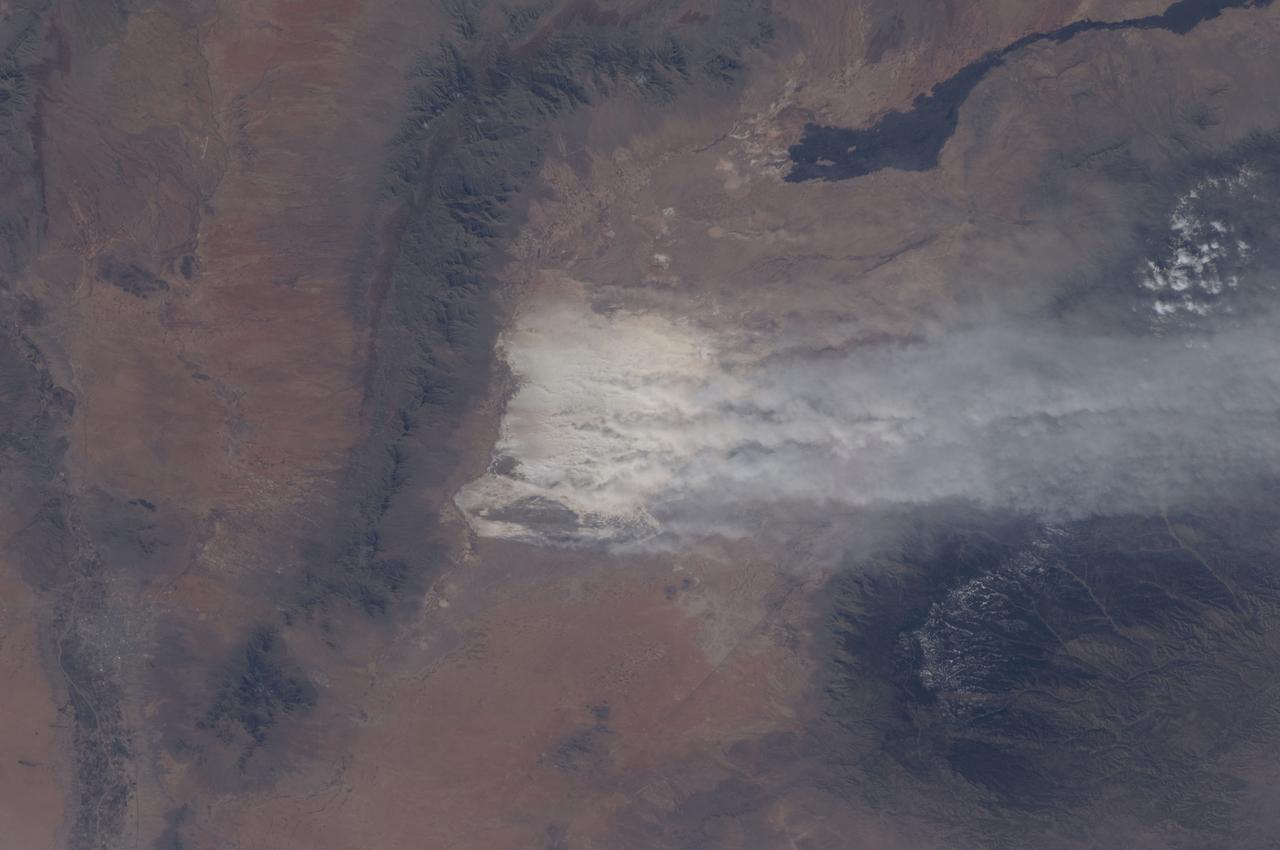
ISS030-E-174652 (28 Feb. 2012) --- A dust storm near the White Sands National Monument, New Mexico, USA is featured in this image photographed by an Expedition 30 crew member on the International Space Station. Driven by winter winds from the southwest, white dust from the White Sands dune field (center) in New Mexico rises thousands of feet from the valley floor, up and over the snowy peaks of the Sacramento Mts. downwind (right). White Sands National Monument lies in the 50 kilometers-wide Tularosa valley, between the dark rocks and forested slopes of the Sacramento Mts. and the San Andres Mts. (left center). The lower and warmer ridge line of the San Andres was without snow on this day. The striking black lava flows of the Carrizozo lava field also occupy the valley floor (top right). The darker tones of agriculture in the Rio Grande floodplain can be seen along the left margin of the image. The length of the dust plumes in this photograph is more than 120 kilometers. The vigor of the winds on this day can be judged also from the fact that they are lifting the dust particles from the valley floor more than 1,200 meters over the mountains. Winds channel the dust through a low point on the Sacramento Mts., some 800 meters below the ridge crests to north and south (right). The Moderate Resolution Imaging Spectroradiometer (MODIS) on the NASA Aqua satellite also captured a wider regional view of the extent of the plumes on the same day. In most parts of the world blowing dust is some shade of light brown or red. It is interesting to observe two colors of dust that contribute to this dust plume: redder dust from the local hillsides north of White Sands (seen by the small brown zone along the northern margin of the dust mass), and the white dust from the dune field. The sand dunes of the Monument are white since they are composed of the mineral gypsum, a relatively rare dune-forming mineral. The gypsum is deposited during evaporation of mineral-rich waters in an ephemeral lake located in the western part of the Monument. Erosion of the deposits, together with wind transport, provides the granular material for the dunes. The dunes? brilliance, especially contrasted against the nearby dark mountain slopes, makes the dunes easily identifiable at great distances by orbiting astronauts. The white speck of the dunes is even visible in images taken looking back at Earth by crews on the way to the moon.

Composed of 18 images, this natural-color mosaic shows a boulder field on "Mount Washburn" (named after a mountain in Wyoming) in Mars' Jezero Crater. The Perseverance science team nicknamed the light-toned boulder with dark speckles near the center of the mosaic "Atoko Point" (after a feature in the eastern Grand Canyon). The images were acquired by NASA's Perseverance Mars rover on May 27, 2024, the 1,162nd Martian day, or sol, of the mission. Analysis by the rover's SuperCam and Mastcam-Z instruments indicate Atoko Point is composed of the mineral pyroxene, similar to some boulders the rover has encountered elsewhere in Jezero Crater. In terms of the size, shape, and arrangement of its mineral grains and crystals – and potentially its chemical composition – Atoko Point is different from any of the rocks the rover has encountered before. Some Perseverance scientists speculate the minerals that make up Atoko Point were produced in a subsurface body of magma that is possibly exposed now on the crater rim. Others on the team wonder if the boulder, which stands about 18 inches (45 centimeters) wide and 14 inches (35 centimeters) tall, had been created far beyond the walls of Jezero and transported there by swift Martian waters eons ago. Arizona State University leads the operations of the Mastcam-Z instrument, working in collaboration with Malin Space Science Systems in San Diego, on the design, fabrication, testing, and operation of the cameras, and in collaboration with the Niels Bohr Institute of the University of Copenhagen on the design, fabrication, and testing of the calibration targets. A key objective for Perseverance's mission on Mars is astrobiology, including the search for signs of ancient microbial life. The rover will characterize the planet's geology and past climate, pave the way for human exploration of the Red Planet, and be the first mission to collect and cache Martian rock and regolith (broken rock and dust). Subsequent NASA missions, in cooperation with ESA (European Space Agency), would send spacecraft to Mars to collect these sealed samples from the surface and return them to Earth for in-depth analysis. The Mars 2020 Perseverance mission is part of NASA's Moon to Mars exploration approach, which includes Artemis missions to the Moon that will help prepare for human exploration of the Red Planet. https://photojournal.jpl.nasa.gov/catalog/PIA26333
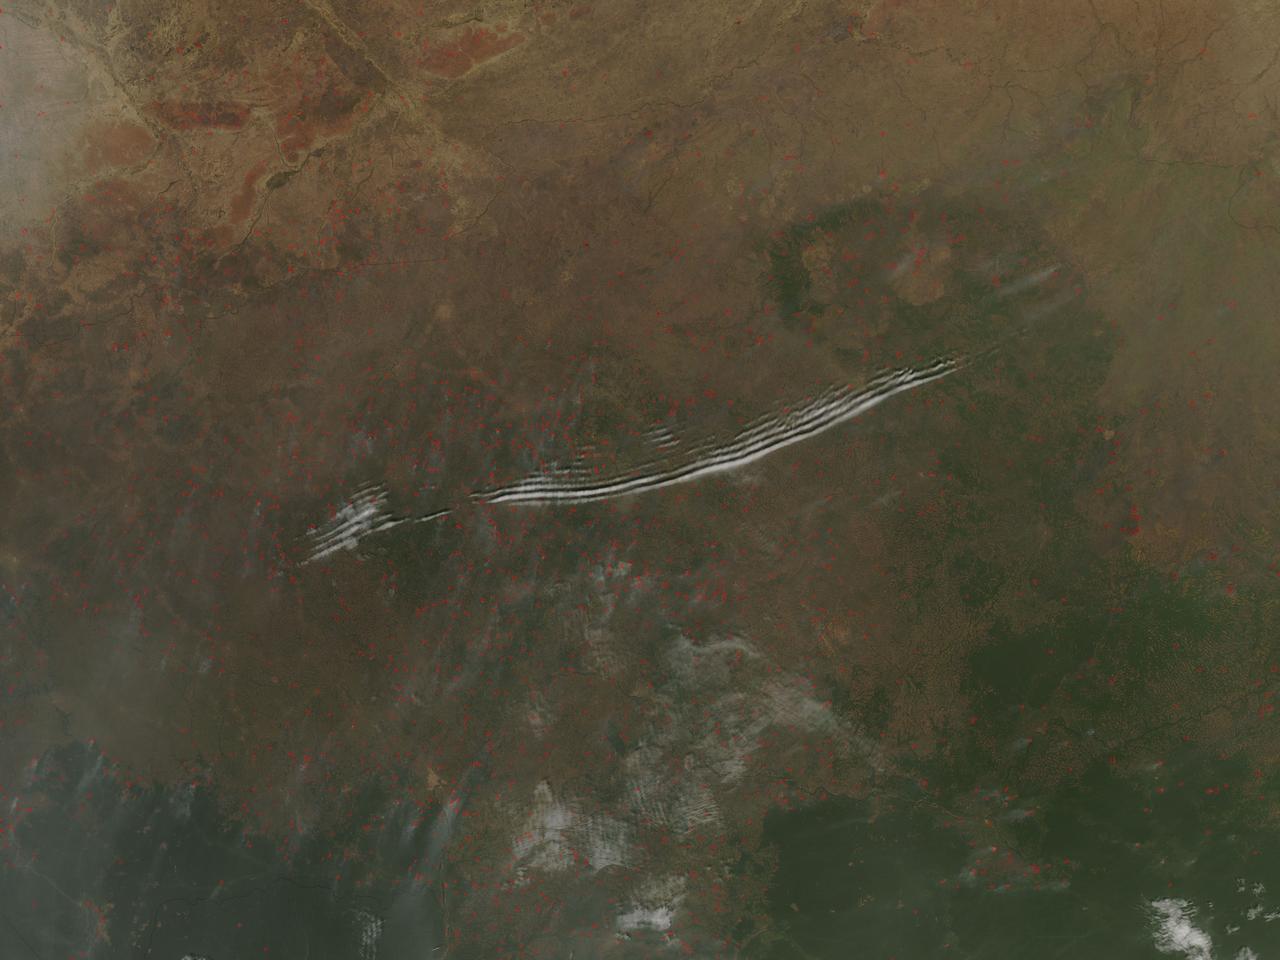
On January 27, 2016, the Moderate Resolution Imaging Spectroradiometer (MODIS) aboard NASA’s Aqua satellite passed over the Central African Republic and captured a true-color image of wave clouds rippling over a fire-speckled landscape. Wave clouds typically form when a mountain, island, or even another mass of air forces an air mass to rise, then fall again, in a wave pattern. The air cools as it rises, and if there is moisture in the air, the water condenses into clouds at the top of the wave. As the air begins to sink, the air warms and the cloud dissipates. The result is a line of clouds marking the crests of the wave separated by clear areas in the troughs of the wave. In addition to the long lines of clouds stretching across the central section of the country, clouds appear to line up in parallel rows near the border of the Democratic Republic of the Congo. In this area, small sets of grayish cloud appear to be lined up with the prevailing wind, judging by the plumes of smoke rising from red hotspots near each set of clouds. Clouds like this, that line in parallel rows parallel with the prevailing wind, are known as “cloud streets”. Each red “hotspot” marks an area where the thermal sensors on the MODIS instrument detected high temperatures. When accompanied by typical smoke, such hotspots are diagnostic for actively burning fires. Given the time of the year, the widespread nature, and the location of the fires, they are almost certainly agricultural fires that have been deliberately set to manage land. Image Credit: Jeff Schmaltz, MODIS Land Rapid Response Team, NASA GSFC <b><a href="http://www.nasa.gov/audience/formedia/features/MP_Photo_Guidelines.html" rel="nofollow">NASA image use policy.</a></b> <b><a href="http://www.nasa.gov/centers/goddard/home/index.html" rel="nofollow">NASA Goddard Space Flight Center</a></b> enables NASA’s mission through four scientific endeavors: Earth Science, Heliophysics, Solar System Exploration, and Astrophysics. Goddard plays a leading role in NASA’s accomplishments by contributing compelling scientific knowledge to advance the Agency’s mission. <b>Follow us on <a href="http://twitter.com/NASAGoddardPix" rel="nofollow">Twitter</a></b> <b>Like us on <a href="http://www.facebook.com/pages/Greenbelt-MD/NASA-Goddard/395013845897?ref=tsd" rel="nofollow">Facebook</a></b> <b>Find us on <a href="http://instagrid.me/nasagoddard/?vm=grid" rel="nofollow">Instagram</a></b>
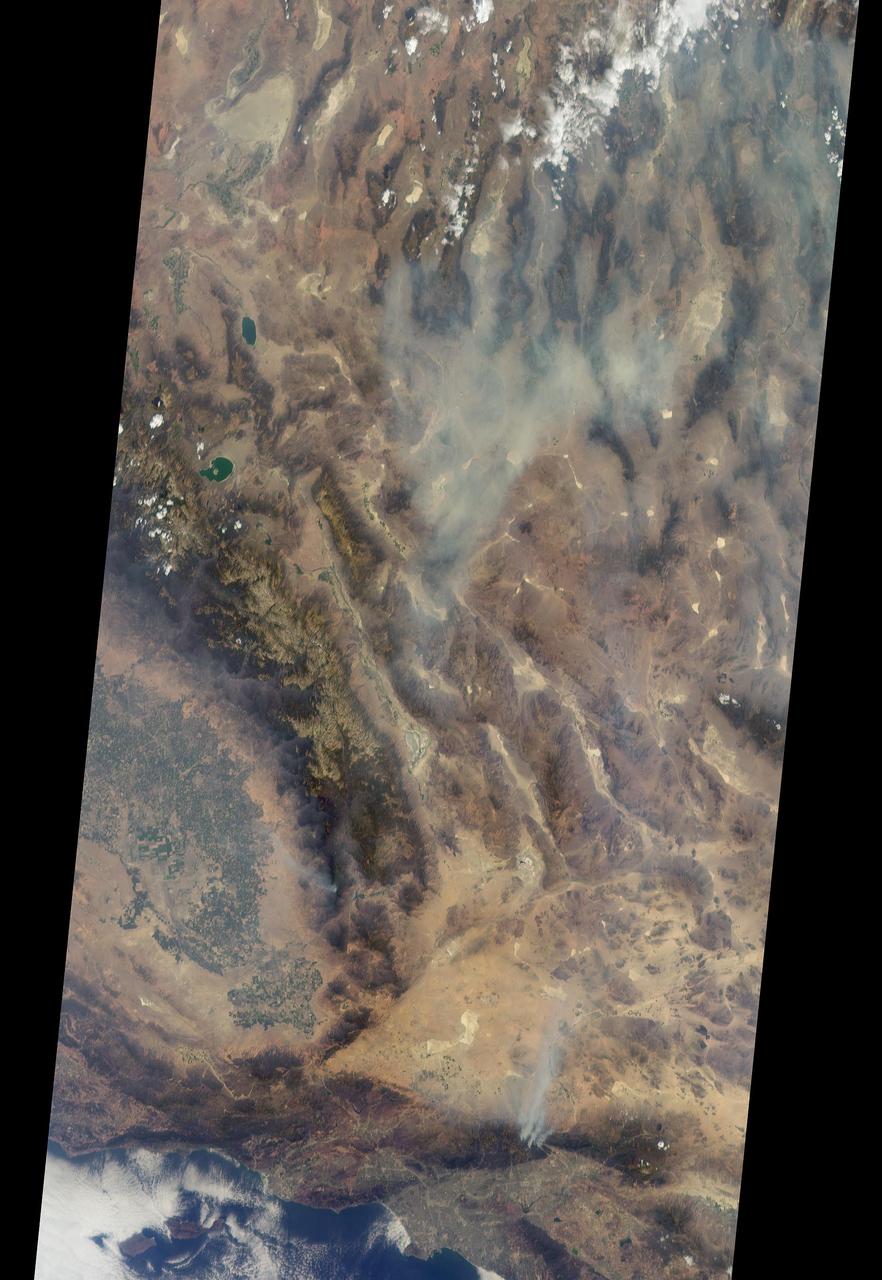
On Aug. 16, 2016, at around 10:30 a.m., a brush fire ignited in the Cajon Pass east of Los Angeles, just to the west of Interstate 15. Within a matter of hours, extreme temperatures, high winds and low humidity allowed the fire to spread rapidly, burning through brush left tinder-dry by years of drought. Firefighters quickly responded, ordering the evacuation of about 83,000 people in and around the Cajon Pass, Wrightwood, Lytle Creek, Oak Hills and surrounding areas. An as-yet uncounted number of homes and structures have burned, and Interstate 15 remains closed to downed power lines and barrier damage. By Aug. 17, the fire had expanded to more than 30,000 acres and remains zero percent contained as some 1,300 firefighters continue to battle to save homes and evacuate residents. The Multi-angle Imaging SpectroRadiometer (MISR) instrument aboard NASA's Terra satellite passed over the region on Aug. 17 around 11:50 a.m. PDT and captured this natural-color image from MISR's 70-degree forward-viewing camera, which covers an areas about 257 miles (414 kilometers) wide. The oblique view angle makes the smoke more apparent than it would be in a more conventional vertical view. The Los Angeles metropolitan area is the large gray area on the coast in the center of the image. Three plumes from the Blue Cut Fire are clearly visible in the mountains to the north. This oblique view also shows an enormous cloud of smoke spreading northeastward over a significant portion of eastern California and Nevada. This smoke probably originated from the fire as it consumed almost 20,000 acres on the evening of the 16th and traveled north overnight. Also visible from this oblique view is considerable haziness filling California's Central Valley, to the northwest of the Blue Cut Fire. This haziness is most likely due to smoke from several other fires burning in California, including the Soberanes Fire near Monterey, the Clayton Fire that has destroyed 175 structures north of San Francisco, the Chimney Fire and the Cedar Fire, which is visible in the image in the southern Sierra Nevada. The total number of acres burned in California this year has tripled in just the past week. The 3D stereo anaglyph is made by combining data from MISR's 60-degree and 70-degree forward-viewing cameras. You will need red-blue glasses to view the 3D effect (ensure the red lens is over your left eye). In order to enable stereo viewing, the image has been rotated so north is to the left. These data were acquired during Terra orbit 88648. http://photojournal.jpl.nasa.gov/catalog/PIA20888
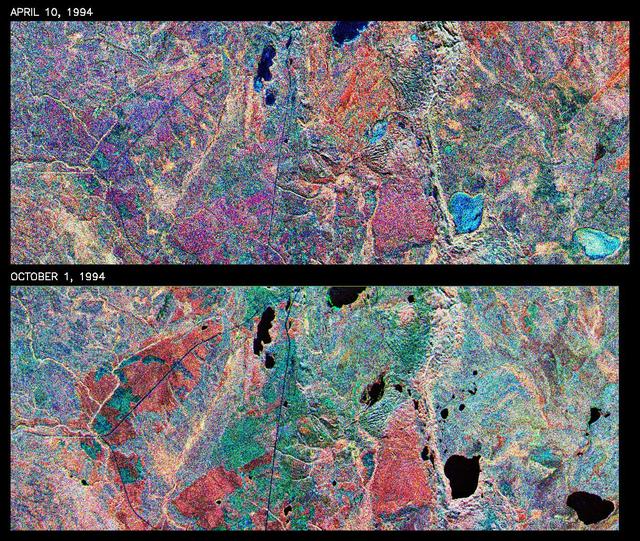
This is a comparison of images over Prince Albert, produced by NASA Spaceborne Imaging Radar-C and X-band Synthetic Aperture Radar aboard the space shuttle Endeavour on its 20th orbit on April 10, 1994. The area is centered at 53.91 degrees north latitude and 104.69 degrees west longitude and is located 40 kilometers (25 miles) north and 30 kilometers (18.5 miles) east of the town of Prince Albert in the Saskatchewan province of Canada. The image covers the area east of Candle Lake, between the gravel highway of 120 and west of highway 106. The area imaged is near the southern limit of the boreal forest. The boreal forest of North America is a continuous vegetation belt at high latitudes stretching across the continent from the Atlantic shoreline of central Labrador and then westward across Canada to the interior mountains and central coastal plains of Alaska. The forest is also part of a larger northern hemisphere circumpolar boreal forest belt. Coniferous trees dominate the entire forest but deciduous trees are also present. During the month of April, the forest experiences seasonal changes from a frozen condition to a thawed condition. The trees are completely frozen over the winter season and the forest floor is covered by snow. As the average temperature rises in the spring, the trees are thawed and the snow melts. This transition has an impact on the rate of moisture evaporation and release of carbon dioxide into the atmosphere. In late September and early October, the boreal forest experiences a relatively different seasonal change. At this time, the leaves on deciduous trees start changing color and dropping off. The soil and trees are quite often moist due to frequent rainfall and cloud cover. The evaporation of moisture and carbon dioxide into the atmosphere also diminishes at this time. SIR-C/X-SAR is sensitive to the moisture of soil and vegetation and can sense this freeze-thaw cycle and the summer-fall seasonal transition over forested areas in particular. Optical sensors, by contrast, are blind to these regions, which are perpetually obscured by thick cloud cover. These changes were detected by comparing the April and October color composite images of L-band data in red, C-band data in green and X-band (vertically received and transmitted) in blue. The changes in intensity of each color over lakes, various forest stands and clear cuts in the two images is striking. Lakes such as Lake Heiberg, Crabtree Lake and Williams Lake, in the right middle part of the image, are frozen in April (appearing in bright blue) and melted (appearing in black) in October. The higher intensity of blue over lakes in April is due to low penetration of the X-band (vertically received and transmitted) and the radar's high sensitivity to surface features. Forest stands also exhibit major changes between the two images. The red areas in the October image are old jack pine canopies that cause higher return at L-band because of their moist condition in late summer compared to their partially frozen condition in April (in purple). Similarly, in the areas near the middle of the image, where black spruce and mixed aspen and jack pine trees dominate, the contrast between blue in October and red and green in April is an indication that the top of the canopy (needles and branches) were frozen in April and moist in October. The changes due to deforestation by logging companies or natural fires can also be detected by comparing the images. For example, the small blue area near the intersection of Harding Road and Highway 120 is the result of logging which occurred after the April data was acquired. The surface area of clear cut is approximately 4 hectares, which is calculated from the high-resolution capability of the radar images and verified by scientists participating in field work during the mission. http://photojournal.jpl.nasa.gov/catalog/PIA01732
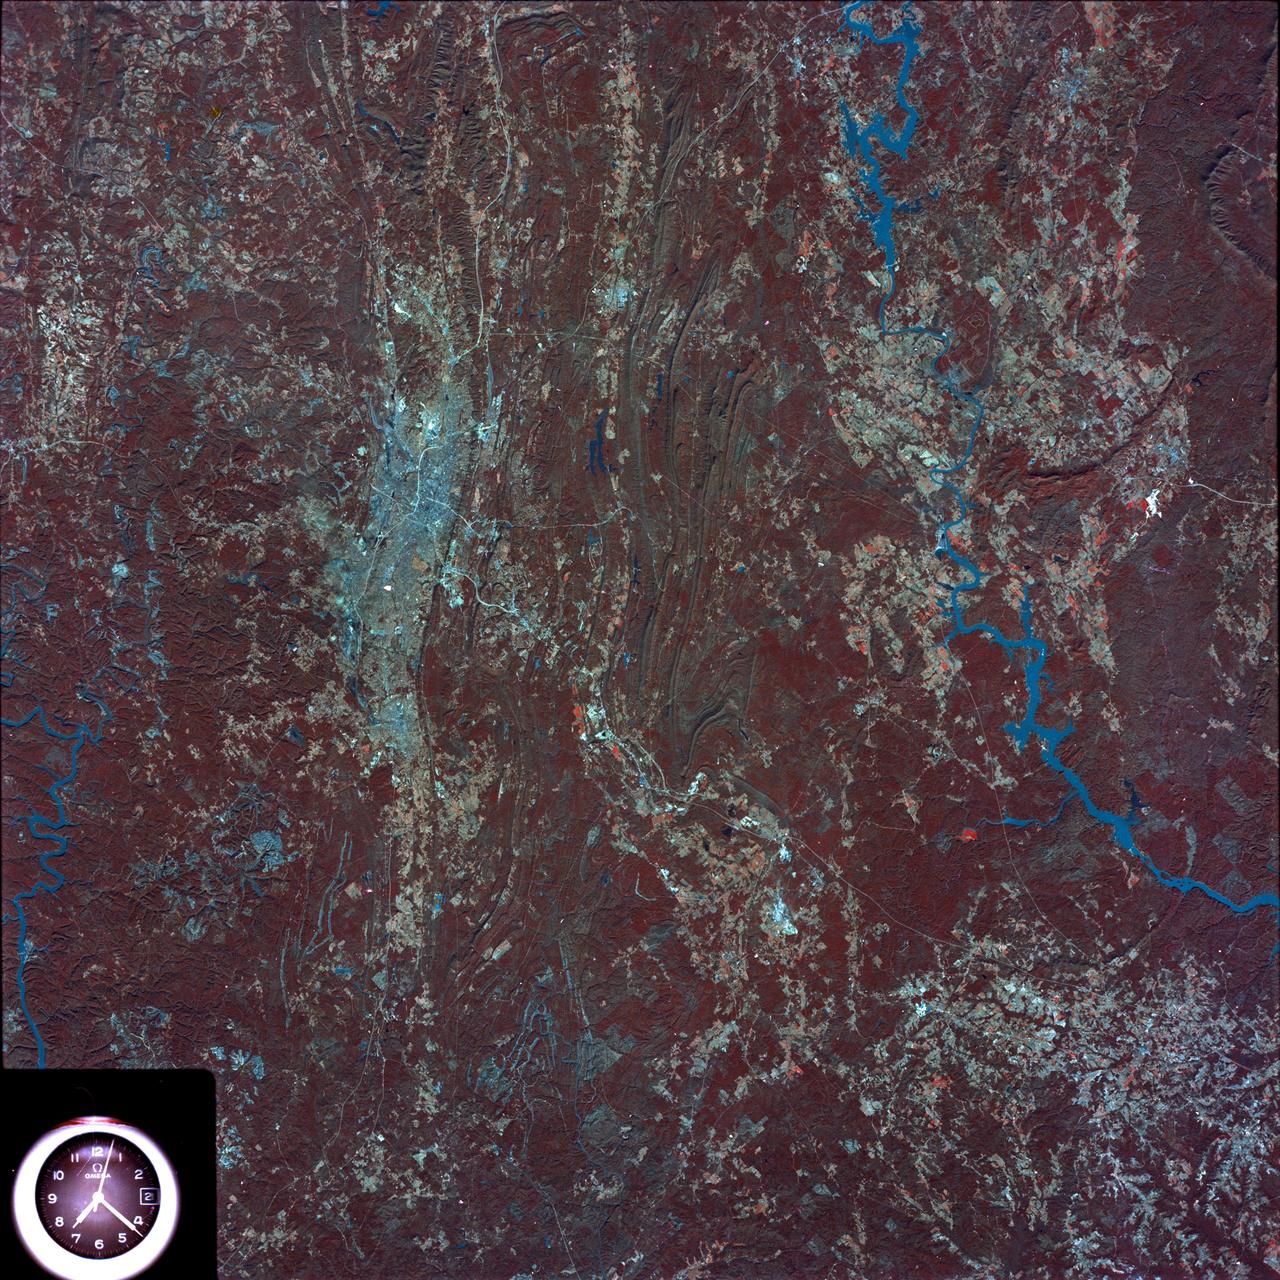
SL4-93-153 (February 1974) --- A vertical view of the Birmingham and central Alabama area is seen in this Skylab 4 Earth Resources Experiments Package S190-B (five-inch earth terrain camera) infrared photographed taken from the Skylab space station in Earth orbit. Illustrated here is the utility of color infrared film in depicting distribution of living vegetation in the 3,600 square mile Birmingham region. The Birmingham industrial complex, with a population of nearly 850,000, is the light gray area nestled in the valley between the northeast-trending ridges that are prominent topographic features in the southern Appalachian Mountains. The narrow ridges and adjacent valleys reflect folded and faulted sedimentary rocks, indicating the complex geological history of the region. Two major rivers and several reservoirs are easily distinguished in this photograph. Bankhand Lake, formed by a dam on the Black Warrior River, appears as bright blue west of Birmingham. Two lakes are formed by dams on the Goosa River east of Birmingham. Federal and state highways appear as thin white lines and are easily identified. Interstate 65 to Montgomery is the prominent white line extending southward from Birmingham. Power line clearings are visible in the center of the picture along the Goosa River, and can be traced northwestward to northern parts of Birmingham. The predominant deep red color of the picture is due to the reflections from living vegetation. In contrast are the light tan areas that commonly occur as rectangular patterns in the east part of the photograph and represent mature agricultural crops or grazing lands. Analysis of the photographic data from the earth terrain camera will be conducted by Dr. H. Jayroe of the Marshall Space Flight Center in developing analytical techniques. All EREP photography is available to the public through the Department of Interior's Earth Resources Observations Systems Data Center, Sioux Falls, South Dakota, 57198. Photo credit: NASA
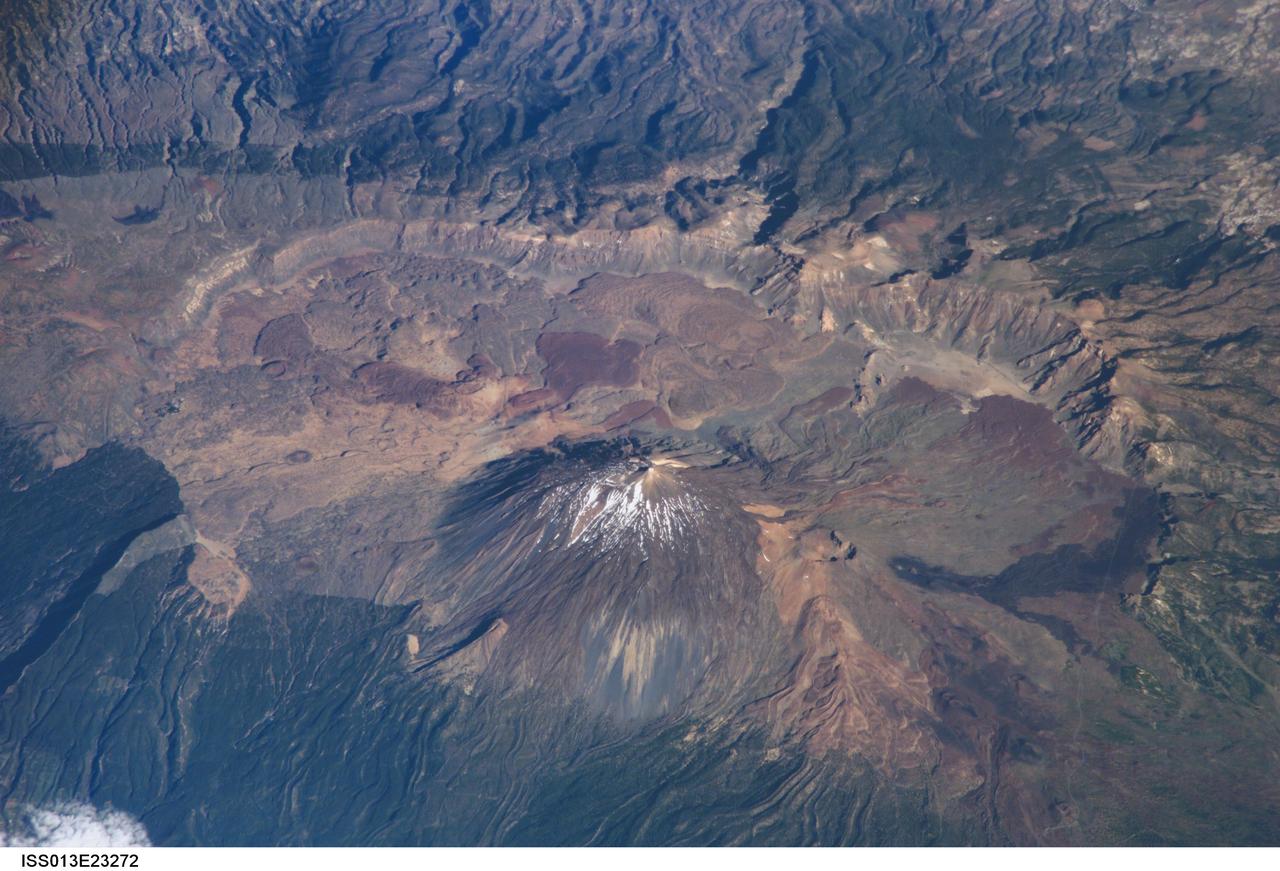
ISS013-E-23272 (8 June 2006) --- Tenerife Island, Spain is featured in this image photographed by an Expedition 13 crewmember on the International Space Station. Tenerife is the largest of the Canary Islands, a Spanish possession located off the northwestern coast of Africa. According to scientists, the islands in the chain could have been produced by eruptions of basaltic shield volcanoes as the African tectonic plate moved over a stationary "hot spot" much like the formation of the Hawaiian Islands. A different hypothesis relates the Canary Islands to magma rise along underwater faults during the uplift of the Atlas Mountains in northern Africa. The island of Tenerife exhibits many excellent volcanic features. The central feature of this image is the elliptical depression of the Las Ca?adas caldera that measures 170 square kilometers in area. A caldera is typically formed when the magma chamber underneath a volcano is completely emptied (usually following a massive eruptive event), and the overlying materials collapse into the newly formed void beneath the surface. A large landslide may have also contributed to (or been the primary cause of) formation of the caldera structure. In this model, part of the original shield volcano forming the bedrock of the island collapsed onto the adjacent sea floor, forming the large depression of the caldera. According to scientists, following formation of the caldera approximately 0.17 million years ago, the composite volcanoes of Mount Teide and Pico Viejo formed. Teide is the highest peak in the Atlantic Ocean with a summit elevation of 3,715 meters. This type of volcano is formed by alternating layers of dense lava flows and more fragmented explosive eruption products, and can build high cones. Many linear flow levees are visible along the flanks of Teide volcano extending from the summit to the base, while a large circular explosion crater marks the summit of Pico Viejo. The floor of the Las Ca?adas caldera is covered with tan, red-brown, and black irregularly-lobed lava flows, the eruptions of which have been observed by settlers and seamen since 1402. The most recent eruption occurred in 1909. The island of Tenerife is actively monitored for further activity.

ISS020-E-009011 (12 June 2009) --- Pohang, South Korea is featured in this image photographed by an Expedition 20 crew member on the International Space Station. The port city of Pohang is located on the eastern coastline of South Korea and provides access to the East Sea and Sea of Japan. While the Pohang area has been occupied by small fishing villages since approximately 1500 BC, development of an urban area only began in 1930 when harbor facilities were constructed. The Pohang Iron and Steel Company, or POSCO began construction of a large steel mill and associated facilities in 1968, with production of steel products commencing in 1972. The steel industry is still a major component of the city?s economic base, but recent efforts to lessen dependence on heavy industry has fostered new interest in environmentalism and culture within Pohang. The urban fabric of Pohang is strikingly divided by the Hyeongsan River. To the west of the river, residential and commercial development is characterized by small footprint, gray and white-roofed buildings connected by a dense road network. The eastern side of the river is dominated by industrial development associated with the POSCO steelyard. This development is characterized by large rectilinear factory and storage buildings with striking light blue and light red rooftops at center. Green vegetated hills and mountains border the urban area to the east, west, and south, with several vegetated hills located with the industrial development area. Numerous boat wakes are also visible to the east-northeast of the POSCO steelyard docks.
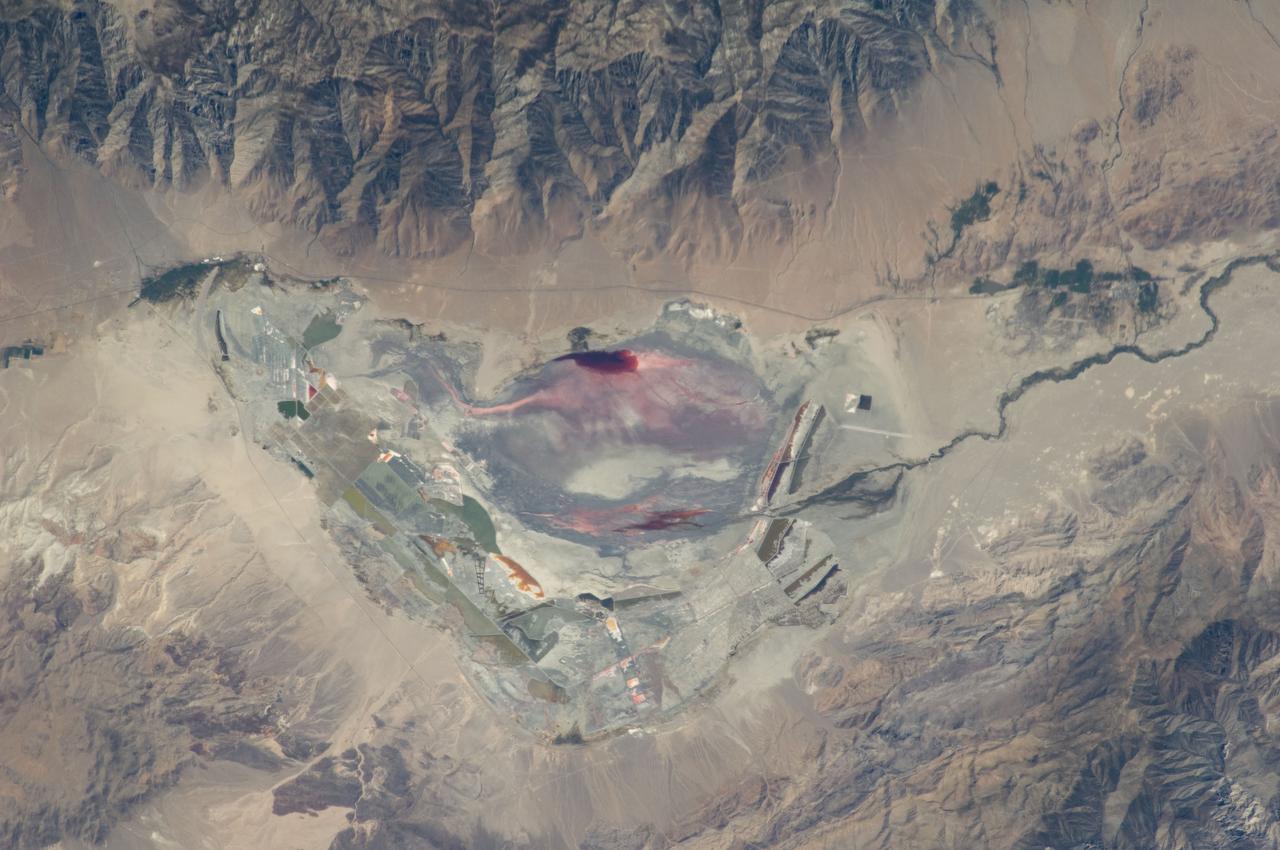
ISS028-E-035137 (30 Aug. 2011) --- Owens Lake in California is featured in this image photographed by an Expedition 28 crew member on the International Space Station. This photograph highlights the mostly dry bed of Owens Lake, located in the Owens River Valley between the Inyo Mountains and the Sierra Nevada. Shallow groundwater, springs, and seeps support minor wetlands and a central brine pool. Two bright red areas along the margins of the brine pool indicate the presence of halophilic, or salt-loving organisms known as Achaeans. Grey and white materials within the lake bed are exposed lakebed sediments and salt crusts. The towns of Olancha and Lone Pine are delineated by the presence of green vegetation indicating a more constant availability of water. According to scientists, the present-day Owens Lake was part of a much larger lake and river system that existed during the Pleistocene Epoch (approximately 3 million to approximately 12,000 years ago) along the current northeastern border of California with Nevada. Meltwater from alpine glaciers in the Sierra Nevada filled the regional valleys of the Basin and Range to form several glacial lakes that were ancestral to the now-dry lakebeds (or playas) of Owens, Searles Lake, and China Lake. While Searles and China Lakes dried out due to regional changes to a hotter and drier climate over thousands of years, Owens Lake became desiccated largely due to the diversion of Owens River water in the early 20th century to serve the needs of the City of Los Angeles, CA located 266 kilometers to the south. Following complete desiccation of the lakebed in 1926, significant amounts of windblown dust were produced ? indeed, the term ?Keeler fog? was coined by residents of the now largely abandoned town on the eastern side of Owens Lake due to the dust. In addition to adverse health effects on local residents, dust from Owens Lake has been linked to visibility reduction in nearby national parks, forests, and wilderness areas. Recently, efforts to control dust evolution from the lakebed have been undertaken by the City of Los Angeles.
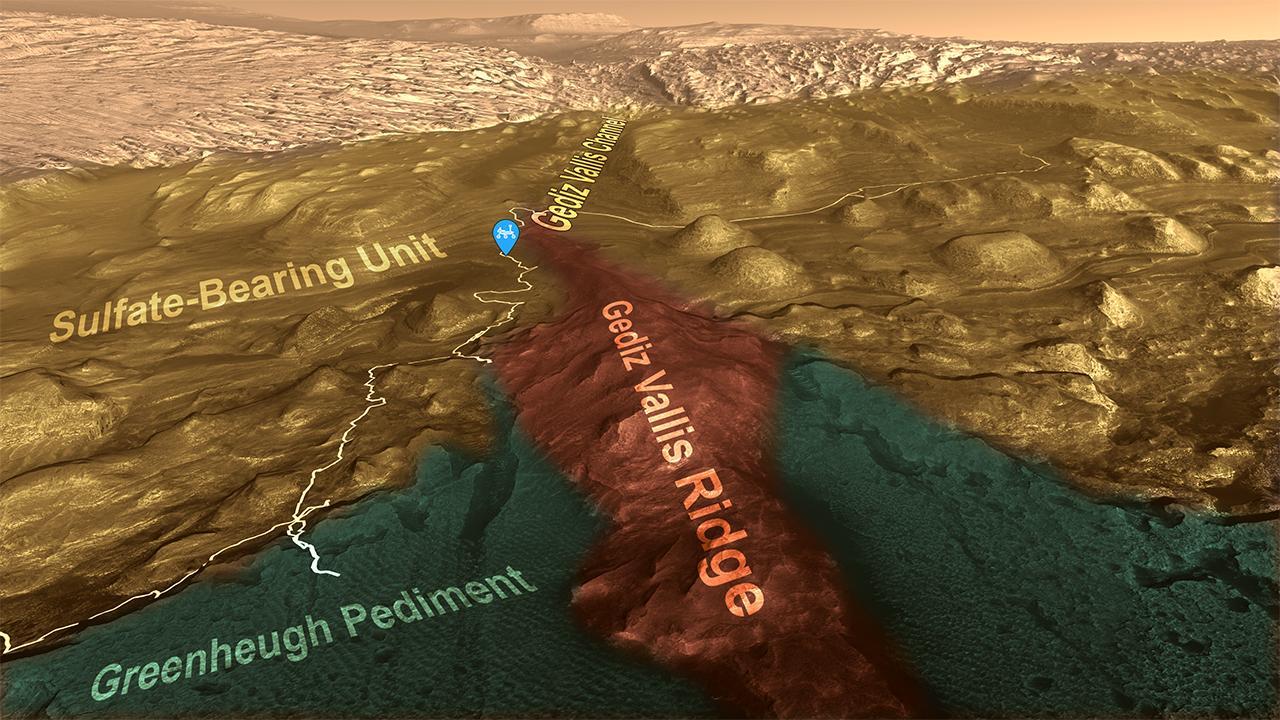
This animation shows the route NASA's Curiosity Mars rover has taken while driving up the lower part of 3-mile-tall (5-kilometer-tall) Mount Sharp. In August 2023, Curiosity was near the top end of Gediz Vallis Ridge (shown in red.) The rover's past and future path is illustrated by the pale line through the landscape. Different layers of Mount Sharp represent different eras of Martian history. As Curiosity ascends, scientists learn more about how the landscape changed over time. The rover is currently in the sulfate-bearing unit (colored gold in this animation), which may be the highest elevation layer it will ever visit. Sulfates are salty minerals that form as water is drying up, and the sulfate-bearing layer is believed to represent a transition to a drier climate 3 billion years ago on ancient Mars. (The green-colored area, the Greenheugh Pediment, is a separate layer that cuts across the sulfate-bearing unit and the clay-bearing unit, which the rover explored from 2019 until entering the sulfate-bearing unit last year.) Near the top of this animation is Gediz Vallis Channel, a snake-like path reminiscent of river channels on Earth. Further down, the channel is buried by debris flows that carried mud and boulders farther down the mountain. That material – most of it from the upper layers of Mount Sharp – is believed to have spread into a debris fan that was later eroded by wind into the towering Gediz Vallis Ridge. The ridge is thus a rare opportunity to study material from higher-elevation layers Curiosity will never reach. Curiosity sought to visit the ridge several times in the past, including when it tried to drive across the Greenheugh Pediment. The rover was forced to turn back (as seen in the lower left of the animation) because of knife-sharp "gator-back" rocks that would have damaged its wheels. Other attempts to reach the ridge proved too steep. Finally, after one of the most difficult climbs the mission has faced, Curiosity arrived Aug. 14, 2023, at an area where it could study the long-sought ridge with its 7-foot (2-meter) robotic arm. Movie available at https://photojournal.jpl.nasa.gov/catalog/PIA26042
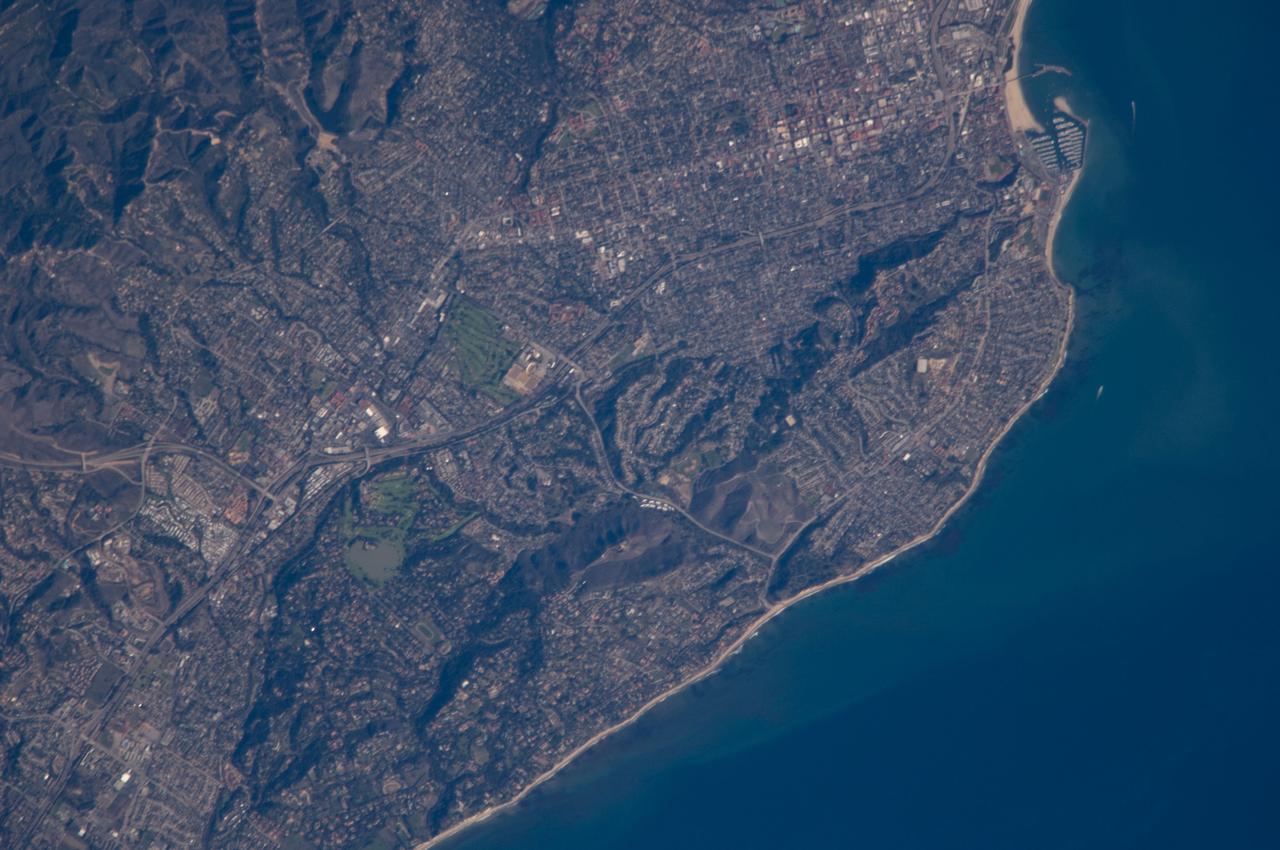
ISS018-E-011096 (6 Dec. 2008) --- Santa Barbara, CA metropolitan area, also known as the ?American Riviera?, is featured in this image photographed by an Expedition 18 crewmember on the International Space Station. The geographic setting of the city - between the Santa Barbara Channel to the south and the steep Santa Ynez Mountains to the north. The city was officially founded as a Spanish mission in 1786, and was incorporated into the United States from Mexico in 1848 following the Mexican-American War. The dramatic landscape of the city is the result of tectonic forces ? the Santa Barbara Channel is part of the boundary between the Pacific oceanic and North American continental crustal plates. Movement along the San Andreas Fault ? the actual zone of contact between the two plates ? over geologic time both raised the Santa Ynez range and lowered the seafloor, forming the deep Santa Barbara Channel. The city has experienced two earthquakes, one in 1812 and another in 1925 that caused significant damage. The urban street grid is defined by white and red rooftops at top center; to the southeast lie beaches and the boat slips of a large marina (top right). Two large golf courses, characterized by expanses of green grass, are visible at center. Low east-west trending hills that parallel the coastline are almost completely covered by residential and commercial development, lending a speckled appearance to the hillsides. Immediately offshore, giant kelp beds are the focus of the Santa Barbara Coastal Long Term Ecological Research site, part of the National Science Foundation?s Long Term Ecological Research Network.
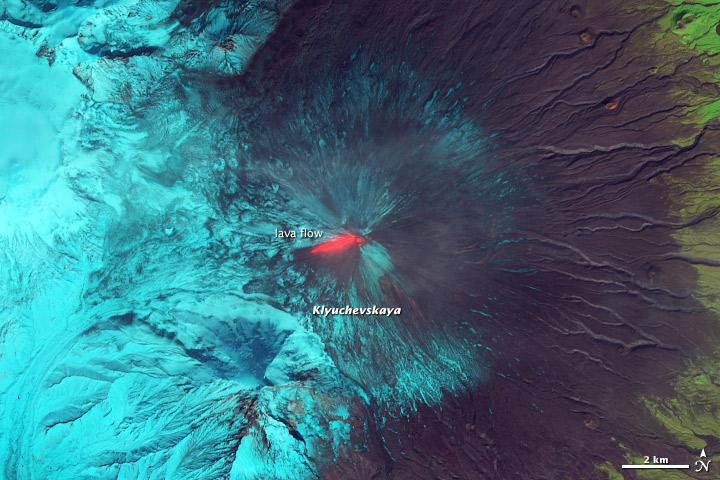
This false-color (shortwave infrared, near infrared, green) satellite image reveals an active lava flow on the western slopes of Klyuchevskaya Volcano. Klyuchevskaya is one of several active volcanoes on the Kamchatka Peninsula in far eastern Russia. The lava flow itself is bright red. Snow on Klyuchevskaya and nearby mountains is cyan, while bare ground and volcanic debris is gray or brown. Vegetation is green. The image was collected by Landsat 8 on September 9, 2013. NASA Earth Observatory image by Jesse Allen and Robert Simmon, using Instrument: Landsat 8 - OLI More info: <a href="http://1.usa.gov/1evspH7" rel="nofollow">1.usa.gov/1evspH7</a> <b><a href="http://www.nasa.gov/audience/formedia/features/MP_Photo_Guidelines.html" rel="nofollow">NASA image use policy.</a></b> <b><a href="http://www.nasa.gov/centers/goddard/home/index.html" rel="nofollow">NASA Goddard Space Flight Center</a></b> enables NASA’s mission through four scientific endeavors: Earth Science, Heliophysics, Solar System Exploration, and Astrophysics. Goddard plays a leading role in NASA’s accomplishments by contributing compelling scientific knowledge to advance the Agency’s mission. <b>Follow us on <a href="http://twitter.com/NASA_GoddardPix" rel="nofollow">Twitter</a></b> <b>Like us on <a href="http://www.facebook.com/pages/Greenbelt-MD/NASA-Goddard/395013845897?ref=tsd" rel="nofollow">Facebook</a></b> <b>Find us on <a href="http://instagram.com/nasagoddard?vm=grid" rel="nofollow">Instagram</a></b>
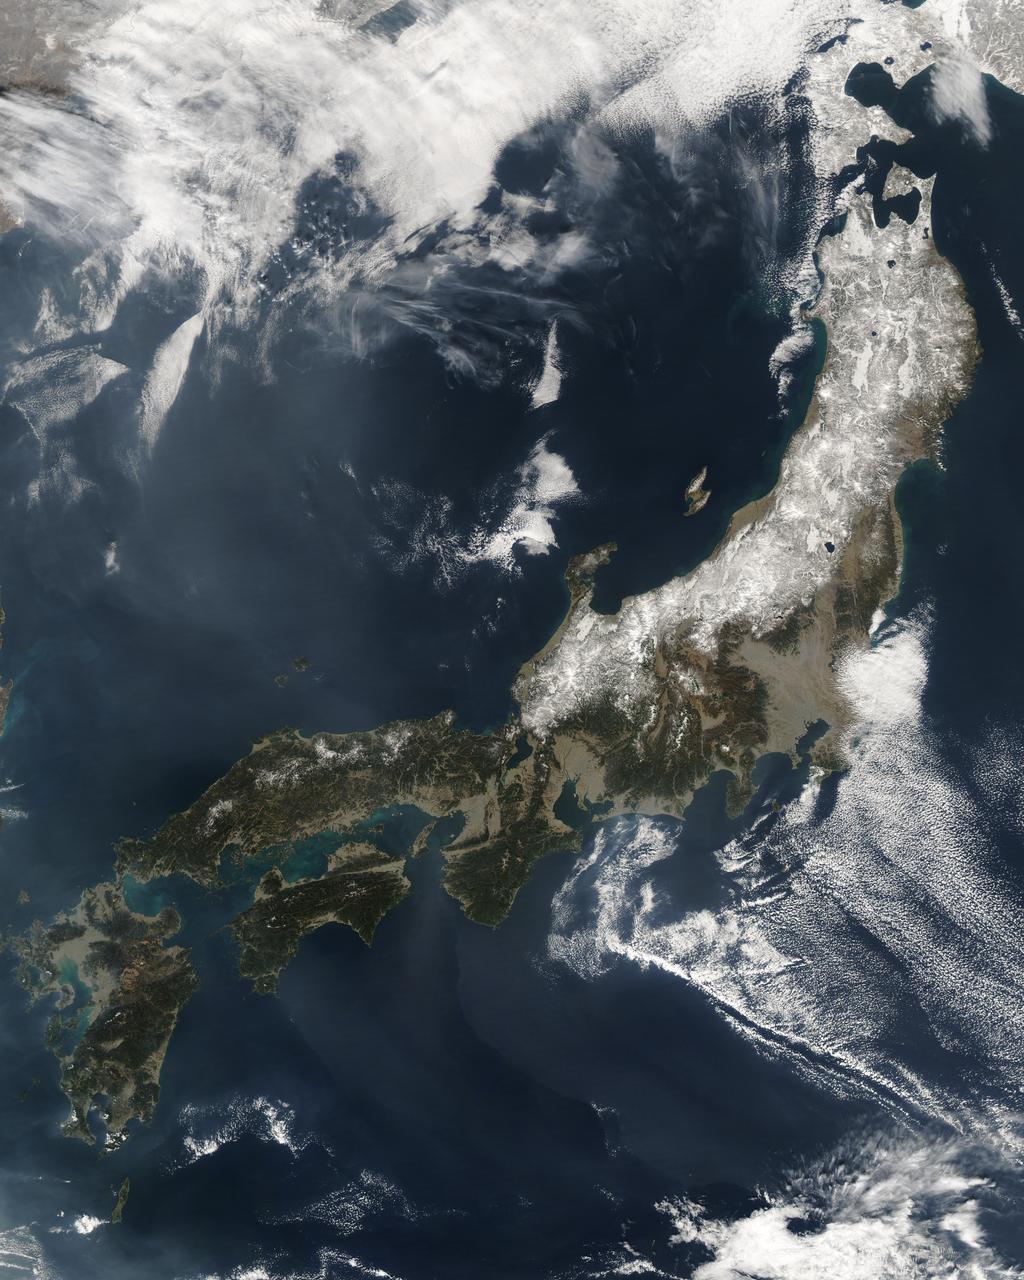
The Moderate Resolution Imaging Spectroradiometer (MODIS) on the Aqua satellite captured this stunning view of Japan’ four largest islands on February 20, 2004. The snow-covered southern arm of Hokkaido extends into the upper left corner. Honshu, Japan’s largest island, curves across the center of the image. Shikoku, right, and Kyushu, left, form the southern tip of the group. Japan is mostly mountainous, and, as the dusting of snow in this image shows, is cold in the north and more tropical in the south. A single red dot marks the location of an active fire. Credit: Jeff Schmaltz, MODIS Rapid Response Team, NASA/GSFC <b><a href="http://www.nasa.gov/audience/formedia/features/MP_Photo_Guidelines.html" rel="nofollow">NASA image use policy.</a></b> <b><a href="http://www.nasa.gov/centers/goddard/home/index.html" rel="nofollow">NASA Goddard Space Flight Center</a></b> enables NASA’s mission through four scientific endeavors: Earth Science, Heliophysics, Solar System Exploration, and Astrophysics. Goddard plays a leading role in NASA’s accomplishments by contributing compelling scientific knowledge to advance the Agency’s mission. <b>Follow us on <a href="http://twitter.com/NASAGoddardPix" rel="nofollow">Twitter</a></b> <b>Like us on <a href="http://www.facebook.com/pages/Greenbelt-MD/NASA-Goddard/395013845897?ref=tsd" rel="nofollow">Facebook</a></b> <b>Find us on <a href="http://instagram.com/nasagoddard?vm=grid" rel="nofollow">Instagram</a></b>
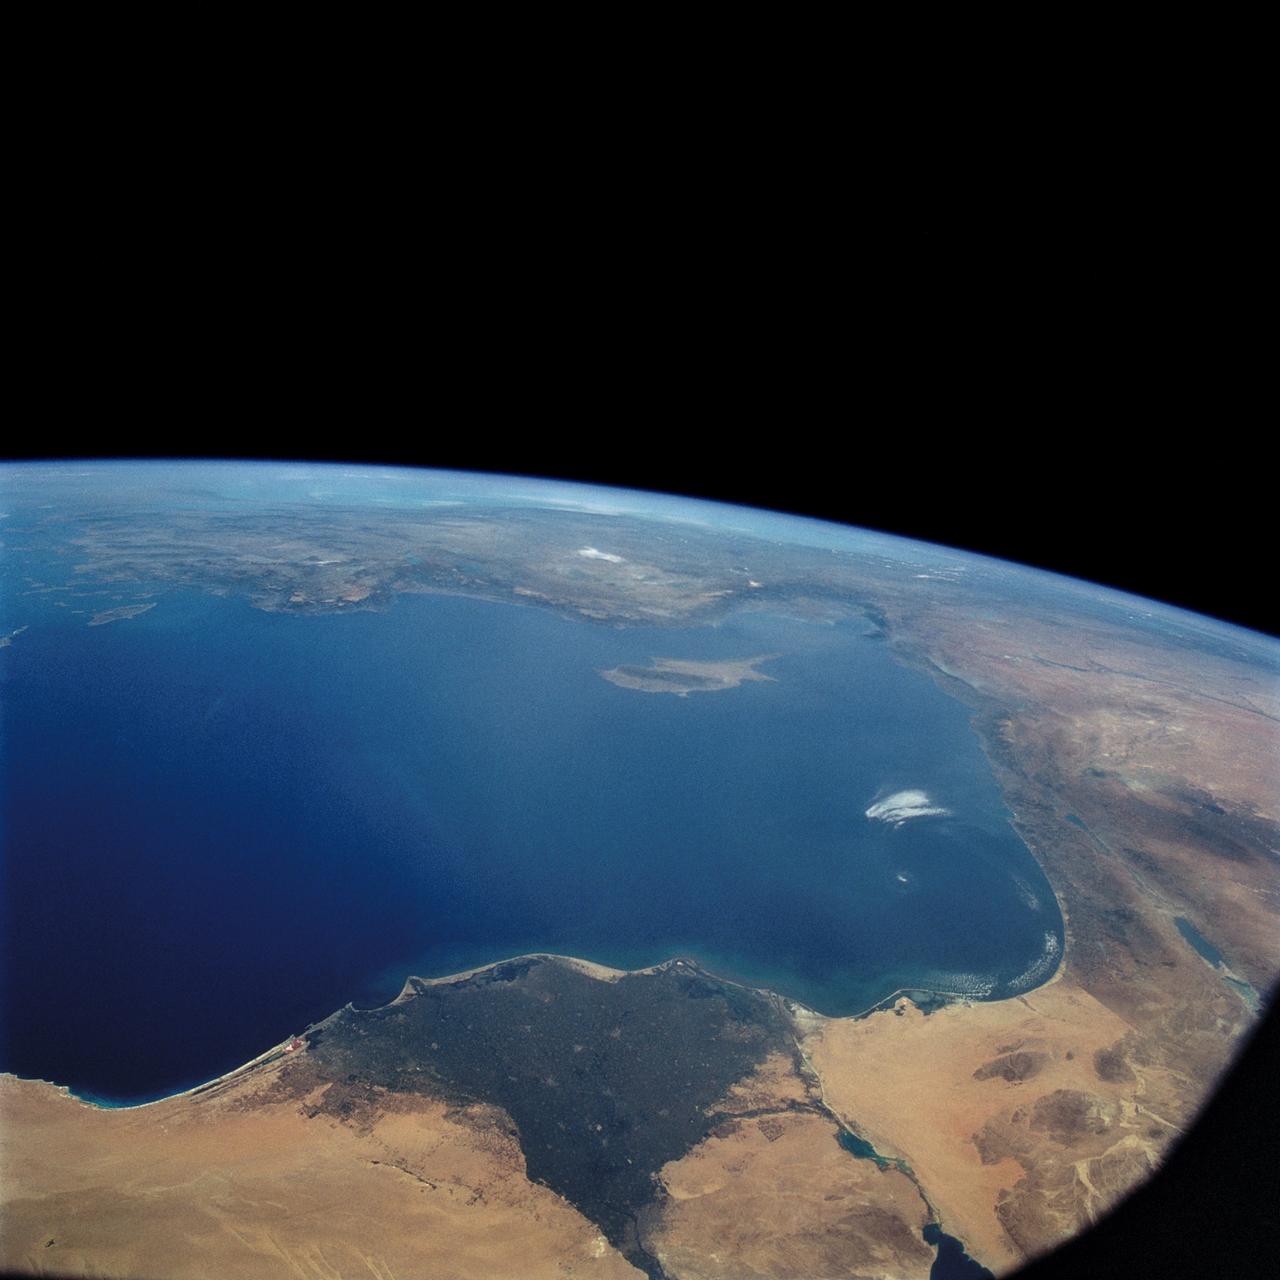
STS057-73-075 (21 June-1 July 1993) --- Eastern Mediterranean from an unusually high vantage point over the Nile River, this north-looking view shows not only the eastern Mediterranean but also the entire landmass of Asia Minor, with the Black Sea dimly visible at the horizon. Many of the Greek islands can be seen in the Aegean Sea (top left), off the coast of Asia Minor. Cyprus is visible under atmospheric dust in the northeast corner of the Mediterranean. The dust cloud covers the east end of the Mediterranean, its western edge demarcated by a line that cuts the center of the Nile Delta. This dust cloud originated far to the west, in Algeria, and moved northeast over Sicily, southern Italy, and Greece. Part of the cloud then moved on over the Black Sea, but another part swerved southward back towards Egypt. A gyre of clouds in the southeast corner of the Mediterranean indicates a complementary counterclockwise (cyclonic) circulation of air. The Euphrates River appears as a thin green line (upper right) in the yellow Syrian Desert just south of the blue-green mountains of Turkey. The Dead Sea (lower right) lies in a rift valley which extends north into Turkey and south thousands of miles down the Gulf of Aqaba, the Red Sea, and on through East Africa. The straight international boundary between Israel and Egypt (where the coastline angles) is particularly clear in this view, marked by the thicker vegetation on the Israeli side of the border. The green delta of the Nile River appears in the foreground, with the great conurbation of Cairo seen as a gray area at the apex of the triangle. Most of Egypt's 52 million inhabitants live in the delta. On the east side of the delta, the Suez Canal is visible. On the western corner of the delta lies the ancient city of Alexandria, beside the orange and white salt pans. The World War II battlesite El Alamein lies on the coast.
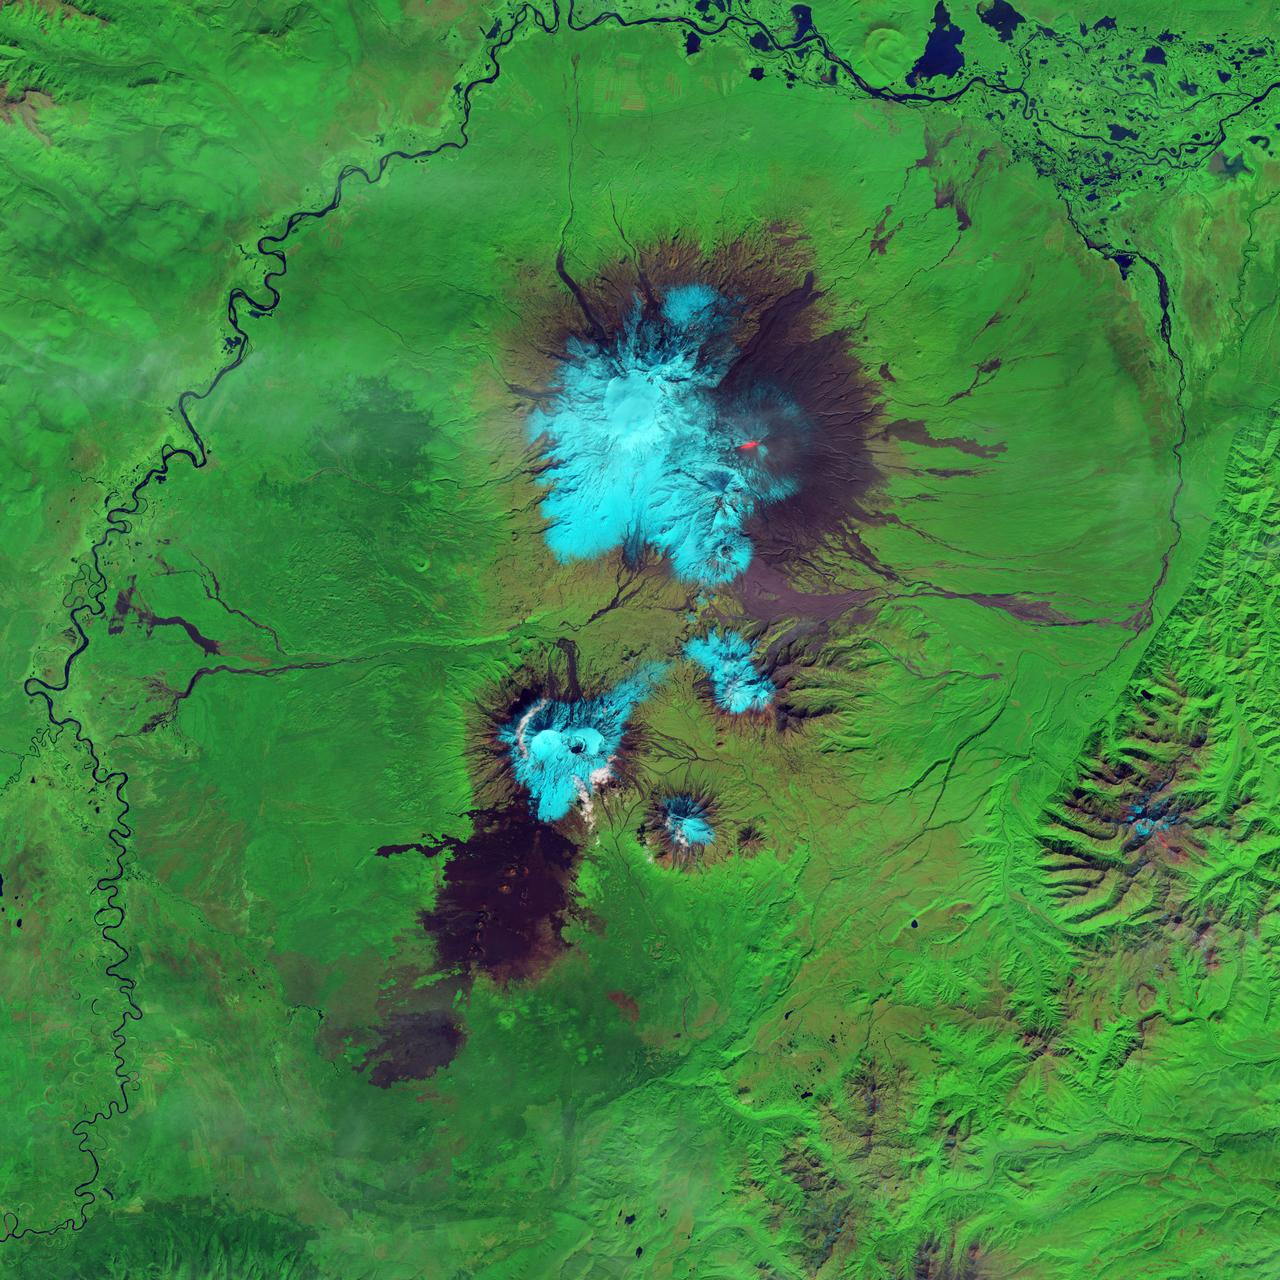
IDL TIFF file This false-color (shortwave infrared, near infrared, green) satellite image reveals an active lava flow on the western slopes of Klyuchevskaya Volcano. Klyuchevskaya is one of several active volcanoes on the Kamchatka Peninsula in far eastern Russia. The lava flow itself is bright red. Snow on Klyuchevskaya and nearby mountains is cyan, while bare ground and volcanic debris is gray or brown. Vegetation is green. The image was collected by Landsat 8 on September 9, 2013. NASA Earth Observatory image by Jesse Allen and Robert Simmon, using Instrument: Landsat 8 - OLI More info: <a href="http://1.usa.gov/1evspH7" rel="nofollow">1.usa.gov/1evspH7</a> <b><a href="http://www.nasa.gov/audience/formedia/features/MP_Photo_Guidelines.html" rel="nofollow">NASA image use policy.</a></b> <b><a href="http://www.nasa.gov/centers/goddard/home/index.html" rel="nofollow">NASA Goddard Space Flight Center</a></b> enables NASA’s mission through four scientific endeavors: Earth Science, Heliophysics, Solar System Exploration, and Astrophysics. Goddard plays a leading role in NASA’s accomplishments by contributing compelling scientific knowledge to advance the Agency’s mission. <b>Follow us on <a href="http://twitter.com/NASA_GoddardPix" rel="nofollow">Twitter</a></b> <b>Like us on <a href="http://www.facebook.com/pages/Greenbelt-MD/NASA-Goddard/395013845897?ref=tsd" rel="nofollow">Facebook</a></b> <b>Find us on <a href="http://instagram.com/nasagoddard?vm=grid" rel="nofollow">Instagram</a></b>

JOHNSON SPACE CENTER, Houston - STS129-S-001 -- For STS-129 the sun shines brightly on the International Space Station (ISS) above and the United States below representing the bright future of U.S. human spaceflight. The contiguous U.S., Rocky Mountains, and Great Desert Southwest are clearly visible on the earth below encompassing all the NASA centers and the homes of the many dedicated people that work to make our Space Program possible. The integrated shapes of the patch signifying the two Express Logistics Carriers that will be delivered by STS-129 providing valuable equipment ensuring the longevity of the ISS. The Space Shuttle is vividly silhouetted by the sun highlighting how brightly the Orbiters have performed as a workhorse for the U.S. Space Program over the past 3 decades. The Space Shuttle ascends on the Astronaut symbol portrayed by the Red, White and Blue swoosh bounded by the gold halo. This symbol is worn with pride by this U.S. crew representing their country on STS-129. The names of the crew members are denoted on the outer band of the patch. As STS-129 launches, the Space Shuttle is in its twilight years. This fact is juxtaposed by the 13 stars on the patch which are symbolic of our children who are the future. The Moon and Mars feature predominantly to represent just how close humankind is to reaching further exploration of those heavenly bodies and how the current Space Shuttle and ISS missions are laying the essential ground work for those future endeavors. The NASA insignia for design for Shuttle flights is reserved for use by the astronauts and for other official use as the NASA Administrator may authorize. Public availability has been approved only in the form of illustrations by the various news media. When and if there is any change in this policy which is not anticipated, it will be publicly announced. (Note: the description is provided by the crew members).
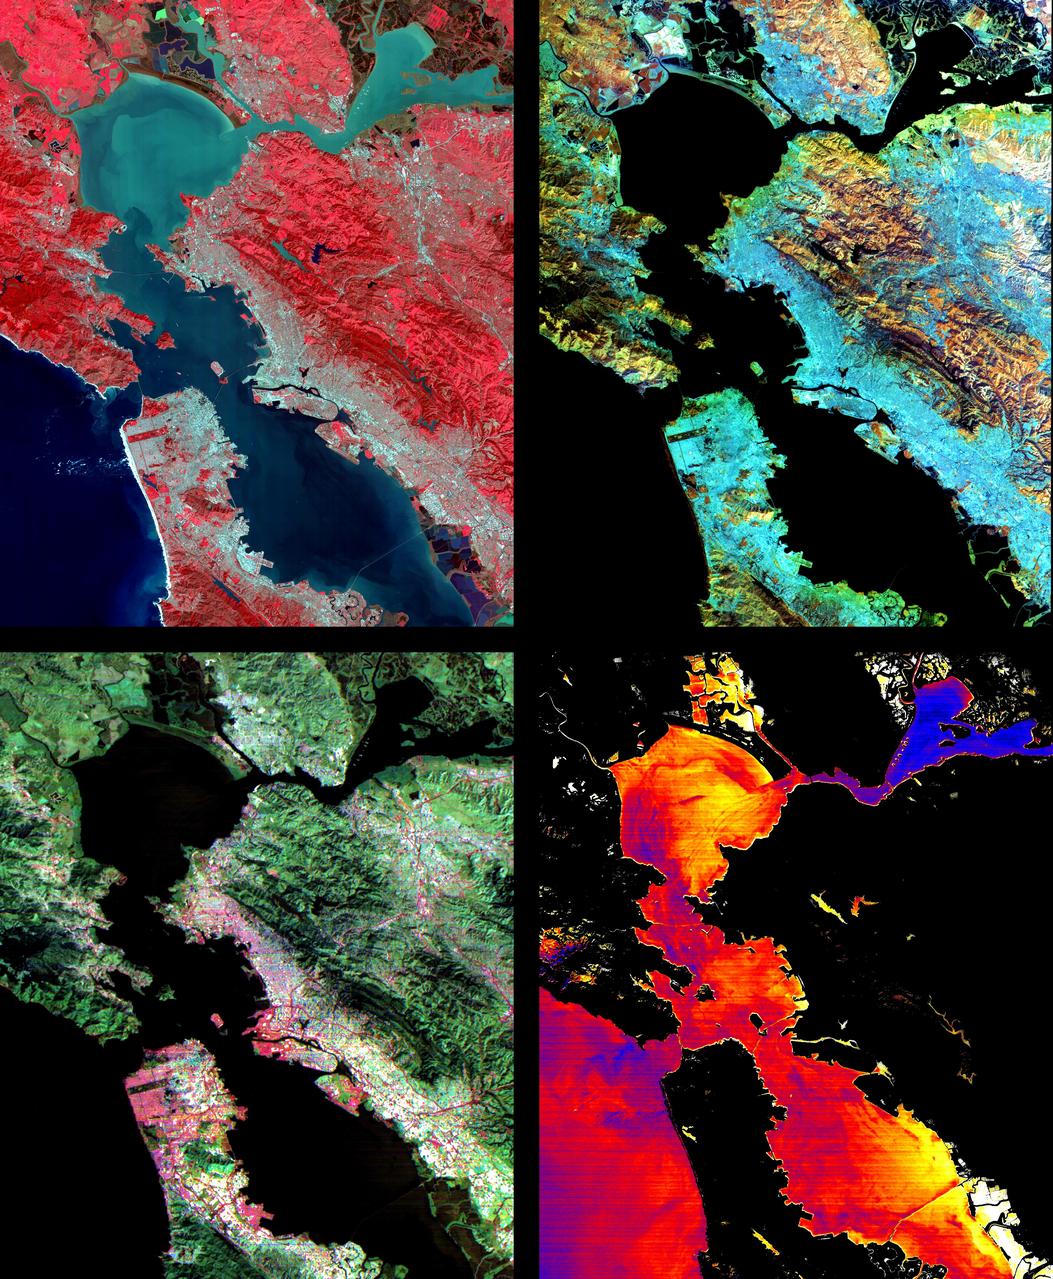
These images of the San Francisco Bay region were acquired on March 3, 2000 by the Advanced Spaceborne Thermal Emission and Reflection Radiometer (ASTER) on NASA's Terra satellite. Each covers an area 60 kilometers (37 miles) wide and 75 kilometers (47 miles) long. With its 14 spectral bands from the visible to the thermal infrared wavelength region, and its high spatial resolution of 15 to 90 meters (about 50 to 300 feet), ASTER will image the Earth for the next 6 years to map and monitor the changing surface of our planet. Upper Left: The color infrared composite uses bands in the visible and reflected infrared. Vegetation is red, urban areas are gray; sediment in the bays shows up as lighter shades of blue. Thanks to the 15 meter (50-foot) spatial resolution, shadows of the towers along the Bay Bridge can be seen. Upper right: A composite of bands in the short wave infrared displays differences in soils and rocks in the mountainous areas. Even though these regions appear entirely vegetated in the visible, enough surface shows through openings in the vegetation to allow the ground to be imaged. Lower left: This composite of multispectral thermal bands shows differences in urban materials in varying colors. Separation of materials is due to differences in thermal emission properties, analogous to colors in the visible. Lower right: This is a color coded temperature image of water temperature, derived from the thermal bands. Warm waters are in white and yellow, colder waters are blue. Suisun Bay in the upper right is fed directly from the cold Sacramento River. As the water flows through San Pablo and San Francisco Bays on the way to the Pacific, the waters warm up. http://photojournal.jpl.nasa.gov/catalog/PIA02605
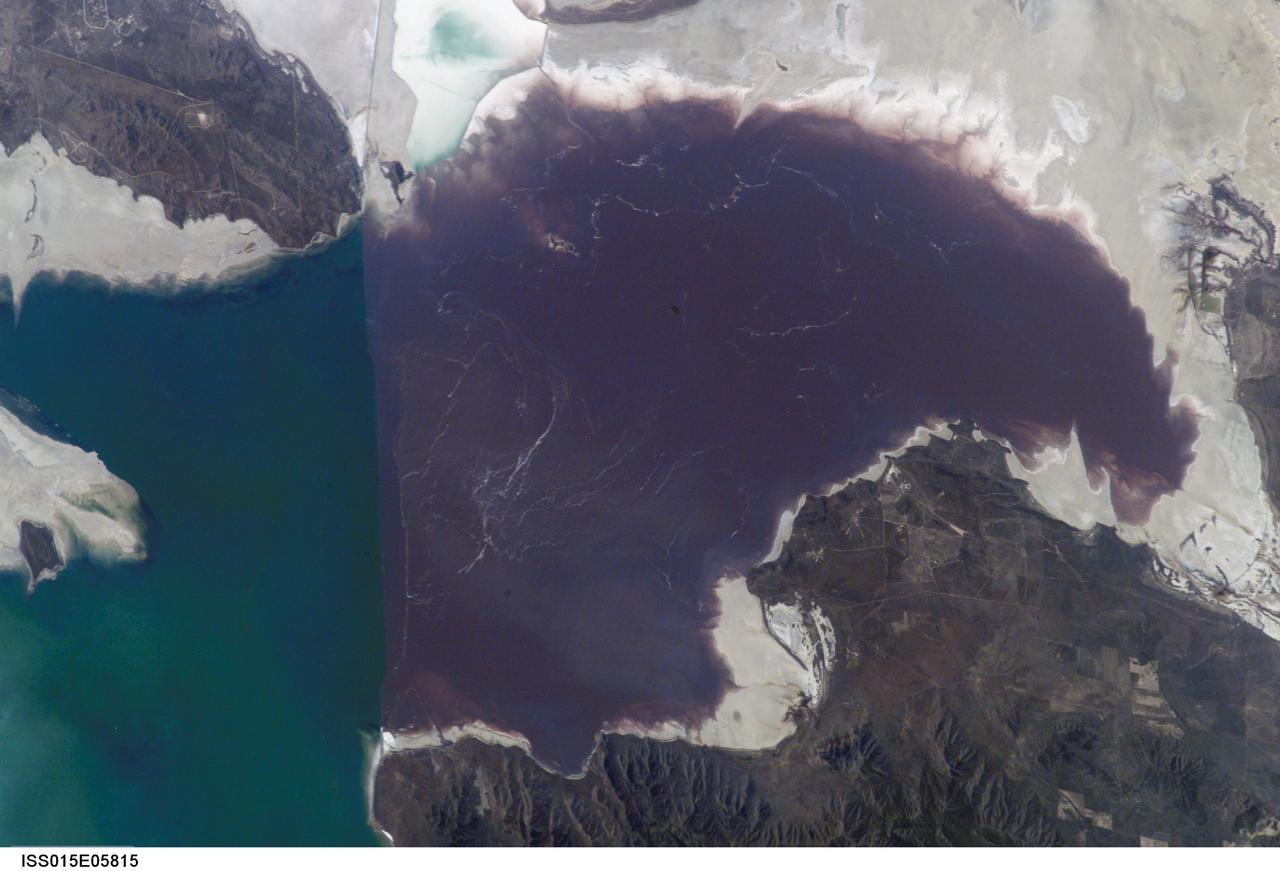
ISS015-E-05815 (30 April 2007) --- Algae in Great Salt Lake, Utah is featured in this image photographed by an Expedition 15 crewmember on the International Space Station. According to scientists, the Great Salt Lake of northern Utah is a remnant of glacial Lake Bonneville that extended over much of present-day western Utah, and into the neighboring states of Nevada and Idaho, approximately 32,000 to 14,000 years ago. During this time, the peaks of adjacent ranges such as the Promontory and Lakeside Mountains were most likely islands. As climate warmed and precipitation decreased in the region, glaciers that fed melt-water to Lake Bonneville disappeared, and the lake began to dry up. The present-day Great Salt Lake is a terminal lake in that water does not flow out of the lake basin. Water loss through the year is due primarily to evaporation, and when this loss exceeds input of water from rivers, streams, precipitation, and groundwater the lake level decreases. This is particularly evident during droughts. This process of evaporation, together with the relatively shallow water levels (maximum lake depth is around 33 feet), has led to increased salinity (dissolved salt content) of the lake waters. The north arm of the Lake, displayed in this image, typically has twice the salinity of the rest of the lake due to impoundment of water by a railroad causeway that crosses the lake from east to west. This restriction of water flow has led to a striking division in the types of algae and bacteria found in the north and south arms of the lake. In the northern arm (north of the causeway), the red algae Dunaliella Salina and the bacterial species Halo bacterium produce a pronounced reddish cast to the water, whereas the south arm (south of the causeway) is dominated by green algae such as Dunaliella viridis. The Great Salt Lake also supports brine shrimp and brine flies; and is a major stopover point for migratory birds including avocets, stilts, and plovers.
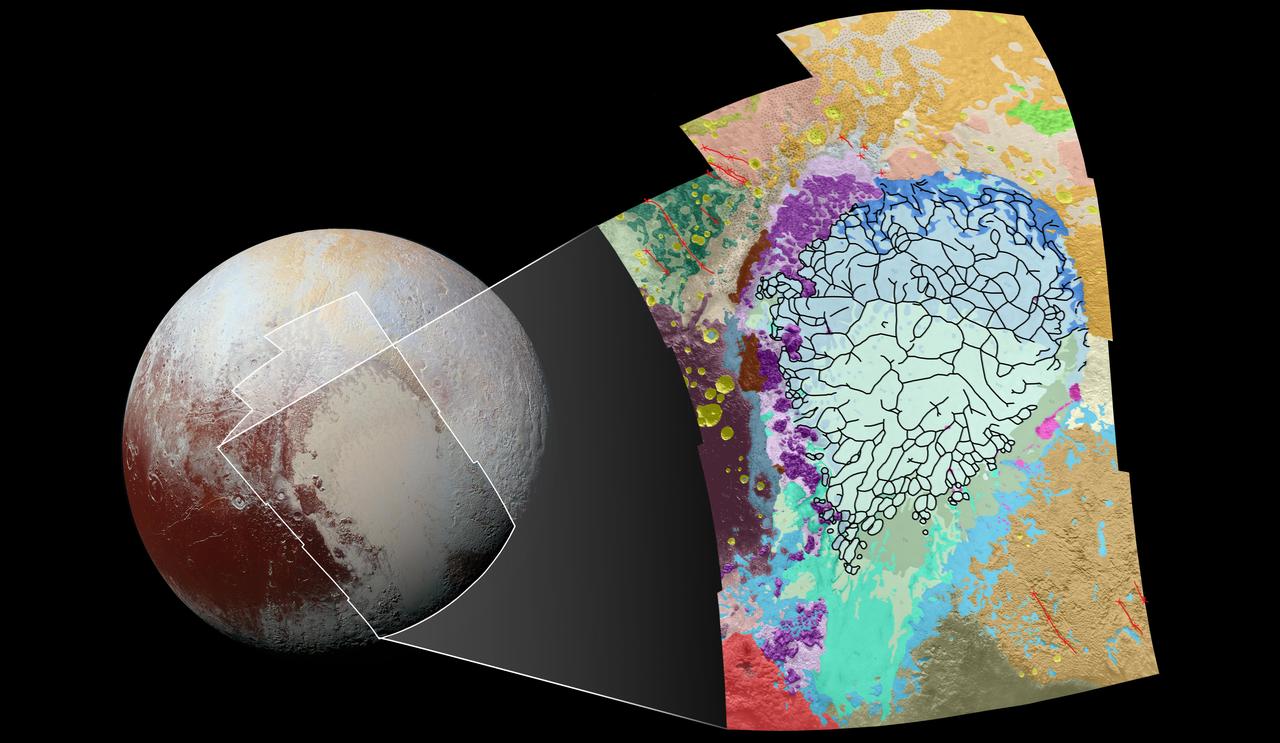
This geological map covers a portion of Pluto's surface that measures 1,290 miles (2,070 kilometers) from top to bottom, and includes the vast nitrogen-ice plain informally named Sputnik Planum and surrounding terrain. The map is overlain with colors that represent different geological terrains. Each terrain, or unit, is defined by its texture and morphology -- smooth, pitted, craggy, hummocky or ridged, for example. How well a unit can be defined depends on the resolution of the images that cover it. All of the terrain in this map has been imaged at a resolution of approximately 1,050 feet (320 meters) per pixel or better, meaning scientists can map units with relative confidence. The various blue and greenish units that fill the center of the map represent different textures seen across Sputnik Planum, from the cellular terrain in the center and north, to the smooth and pitted plains in the south. The black lines represent the troughs that mark the boundaries of cellular regions in the nitrogen ice. The purple unit represents the chaotic, blocky mountain ranges that line Sputnik's western border, and the pink unit represents the scattered, floating hills at its eastern edge. The possible cryovolcanic feature informally named Wright Mons is mapped in red in the southern corner of the map. The rugged highlands of the informally named Cthulhu Regio is mapped in dark brown along the western edge, and is pockmarked by many large impact craters, mapped in yellow. The base map for this geologic map is a mosaic of 12 images obtained by the Long Range Reconnaissance Imager (LORRI) at a resolution of 1,280 feet (about 390 meters) per pixel. The mosaic was obtained at a range of approximately 48,000 miles (77,300 kilometers) from Pluto, about an hour and 40 minutes before New Horizons' closest approach on July 14, 2015. http://photojournal.jpl.nasa.gov/catalog/PIA20465