
A self-portrait of NASA's Curiosity rover taken on Sol 2082 (June 15, 2018). A Martian dust storm has reduced sunlight and visibility at the rover's location in Gale Crater. Self-portraits are created using images taken by Curiosity's Mars Hands Lens Imager (MAHLI). https://photojournal.jpl.nasa.gov/catalog/PIA22486
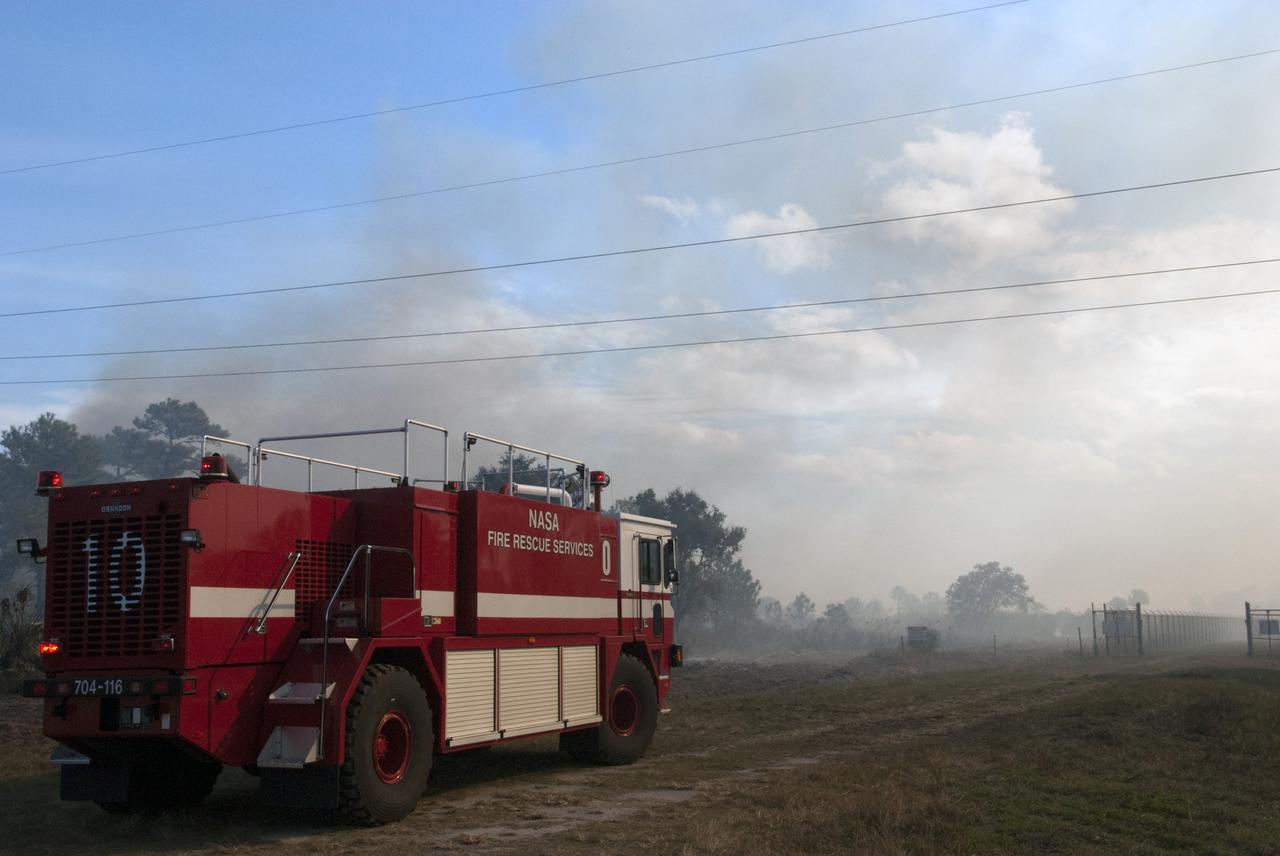
CAPE CANAVERAL, Fla. -- NASA Fire Rescue Services are on the scene to support a controlled burn in the vicinity of the Industrial Area at NASA's Kennedy Space Center in Florida. The burn, managed by the U.S. Fish and Wildlife Service, targeted 2,174 acres near Kennedy's administrative complex. Shifting winds caused the fire to flare up in places to dramatic effect. Limited visibility caused by the smoke required NASA Security to close some roadways. The burn, which began during the 8 o'clock hour this morning, is expected to be extinguished this evening. Controlled burns are commonplace on the center to reduce the likelihood of an unplanned brush fire during Central Florida's dry season. Photo Credit: NASA/Jim Grossmann
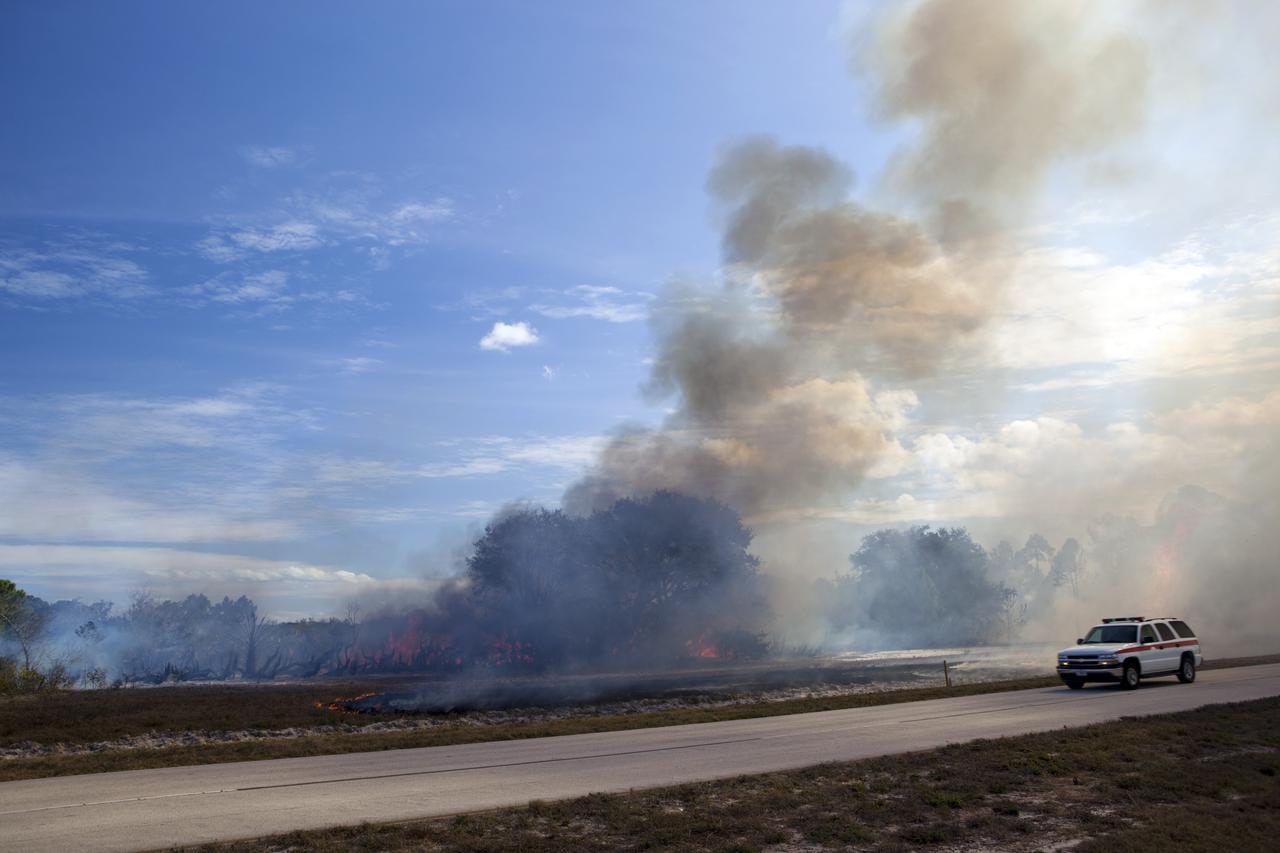
CAPE CANAVERAL, Fla. -- A controlled burn in the vicinity of the Industrial Area at NASA's Kennedy Space Center in Florida sends billow of smoke over nearby roadways. The burn, managed by the U.S. Fish and Wildlife Service, targeted 2,174 acres near Kennedy's administrative complex. Shifting winds caused the fire to flare up in places to dramatic effect. Limited visibility caused by the smoke required NASA Security to close some roadways. The burn, which began during the 8 o'clock hour this morning, is expected to be extinguished this evening. Controlled burns are commonplace on the center to reduce the likelihood of an unplanned brush fire during Central Florida's dry season. Photo Credit: NASA/Dimitri Gerondidakis
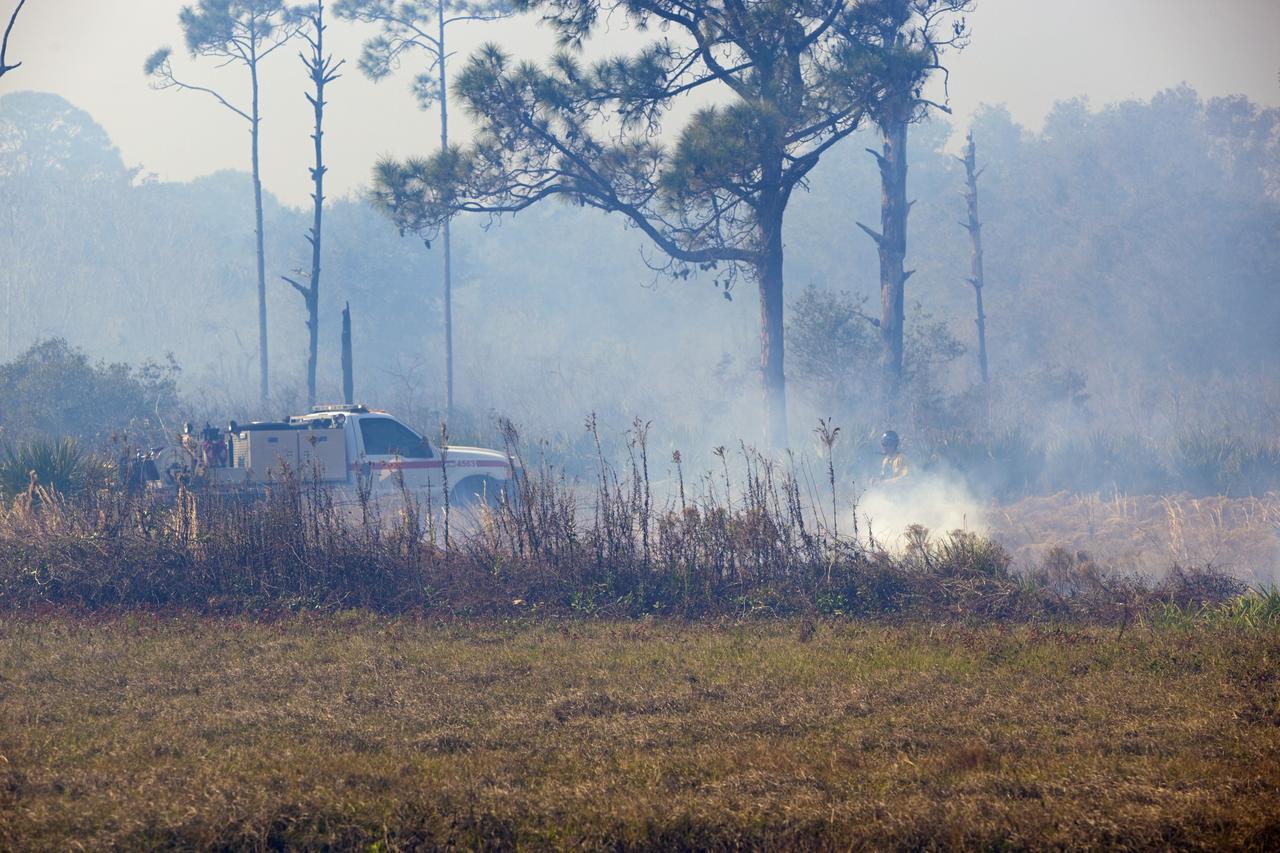
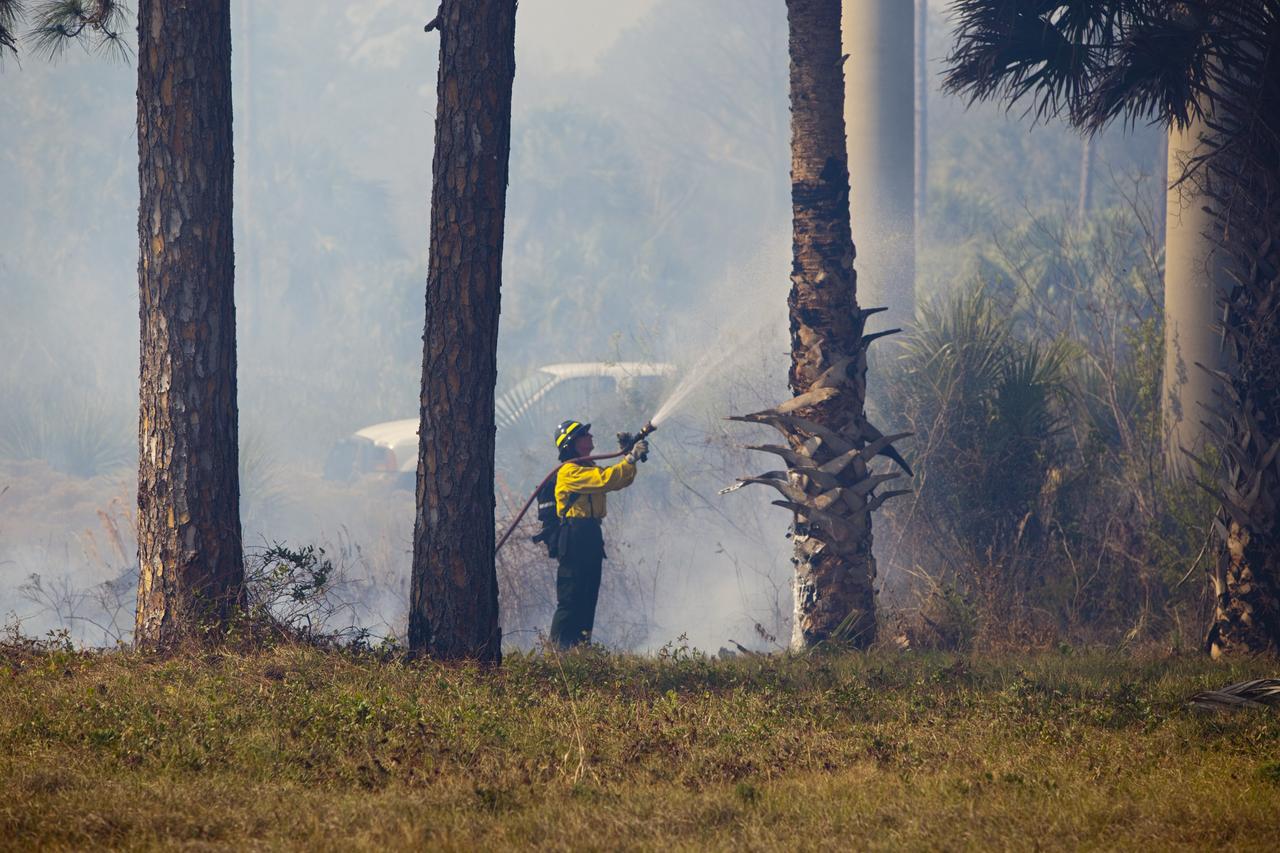
CAPE CANAVERAL, Fla. -- A firefighter mans his post at the edge of a controlled burn in the vicinity of the Industrial Area at NASA's Kennedy Space Center in Florida. The burn, managed by the U.S. Fish and Wildlife Service, targeted 2,174 acres near Kennedy's administrative complex. Shifting winds caused the fire to flare up in places to dramatic effect. Limited visibility caused by the smoke required NASA Security to close some roadways. The burn, which began during the 8 o'clock hour this morning, is expected to be extinguished this evening. Controlled burns are commonplace on the center to reduce the likelihood of an unplanned brush fire during Central Florida's dry season. Photo Credit: NASA/Dimitri Gerondidakis
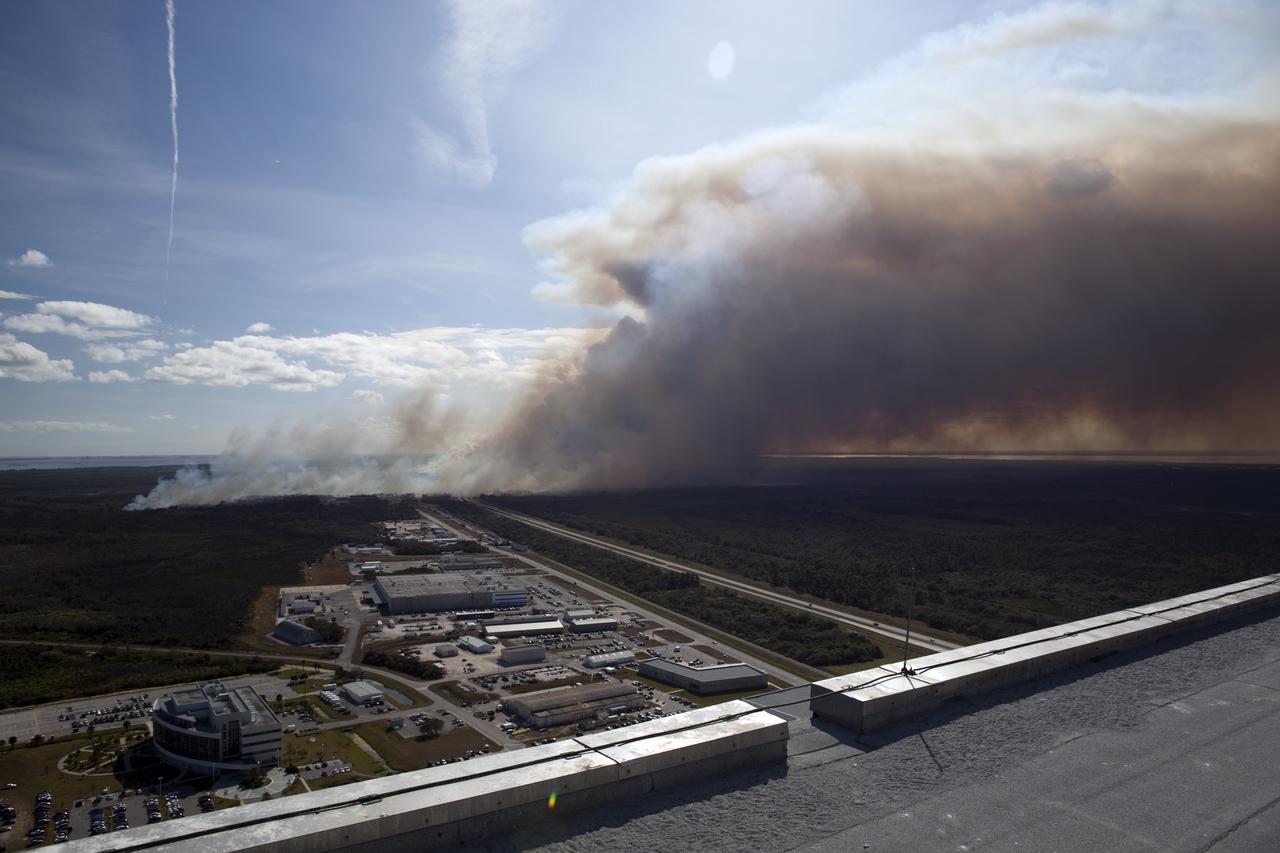
CAPE CANAVERAL, Fla. -- A controlled burn consumes the brush in the vicinity of the Industrial Area at NASA's Kennedy Space Center in Florida. The burn, managed by the U.S. Fish and Wildlife Service, targeted 2,174 acres near Kennedy's administrative complex. Shifting winds caused the fire to flare up in places to dramatic effect. Limited visibility caused by the smoke required NASA Security to close some roadways. The burn, which began during the 8 o'clock hour this morning, is expected to be extinguished this evening. Controlled burns are commonplace on the center to reduce the likelihood of an unplanned brush fire during Central Florida's dry season. Photo Credit: NASA/Dimitri Gerondidakis
CAPE CANAVERAL, Fla. -- A firefighter manages the progress of a controlled burn in the vicinity of the Industrial Area at NASA's Kennedy Space Center in Florida. The burn, managed by the U.S. Fish and Wildlife Service, targeted 2,174 acres near Kennedy's administrative complex. Shifting winds caused the fire to flare up in places to dramatic effect. Limited visibility caused by the smoke required NASA Security to close some roadways. The burn, which began during the 8 o'clock hour this morning, is expected to be extinguished this evening. Controlled burns are commonplace on the center to reduce the likelihood of an unplanned brush fire during Central Florida's dry season. Photo Credit: NASA/Dimitri Gerondidakis
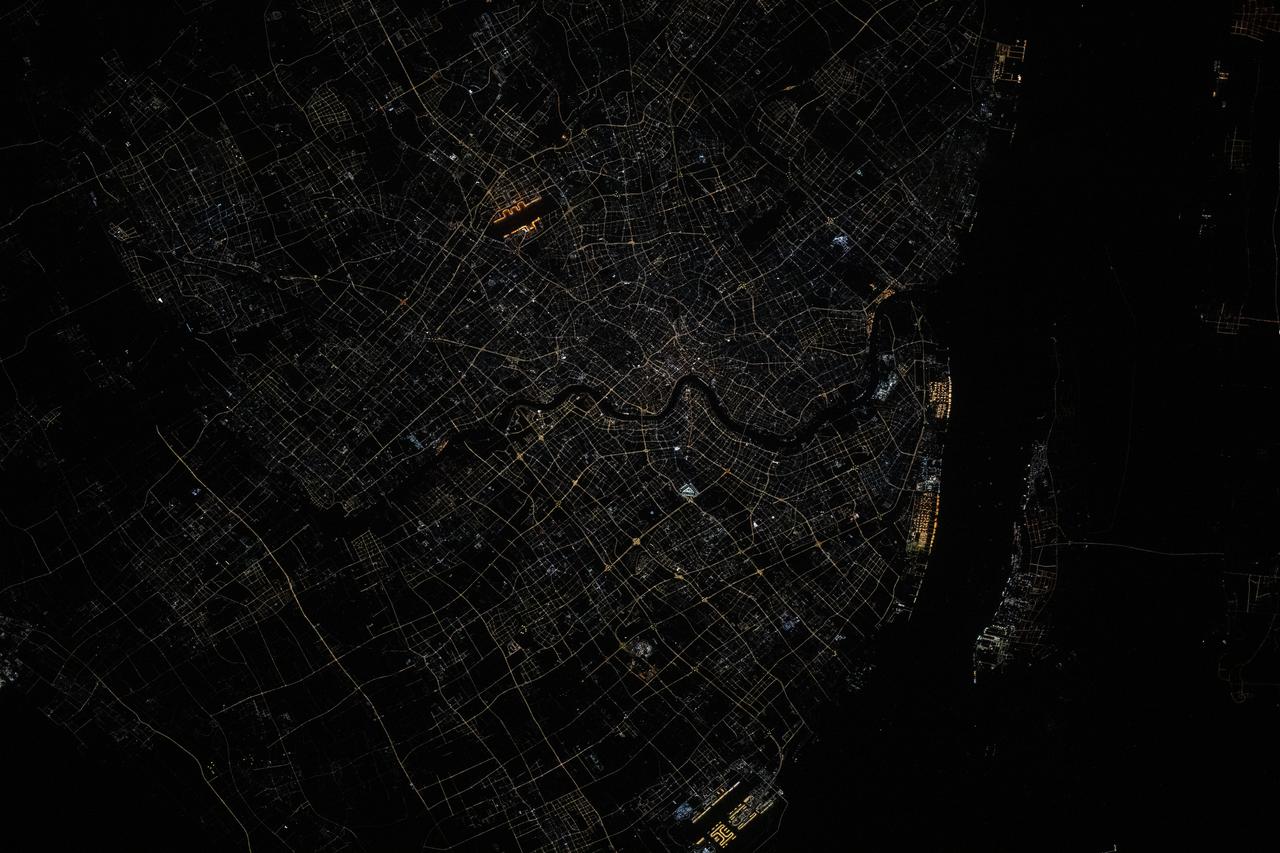
iss073e0515603 (Aug. 24, 2025) --- Shanghai, China, situated on the Yangtze River where it meets the East China Sea, is pictured at approximately 1:32 a.m. local time from the International Space Station as it orbited 261 miles above the nation's eastern coastline. Visible landmarks include Shanghai Hongqiao International Airport near the top of the frame and Shanghai Pudong International Airport at the bottom. The city's lights appear dimmer from orbit due to the widespread use of modern, downward-facing, energy-efficient lighting that reduces light pollution. Credit: JAXA (Japan Aerospace Exploration Agency)
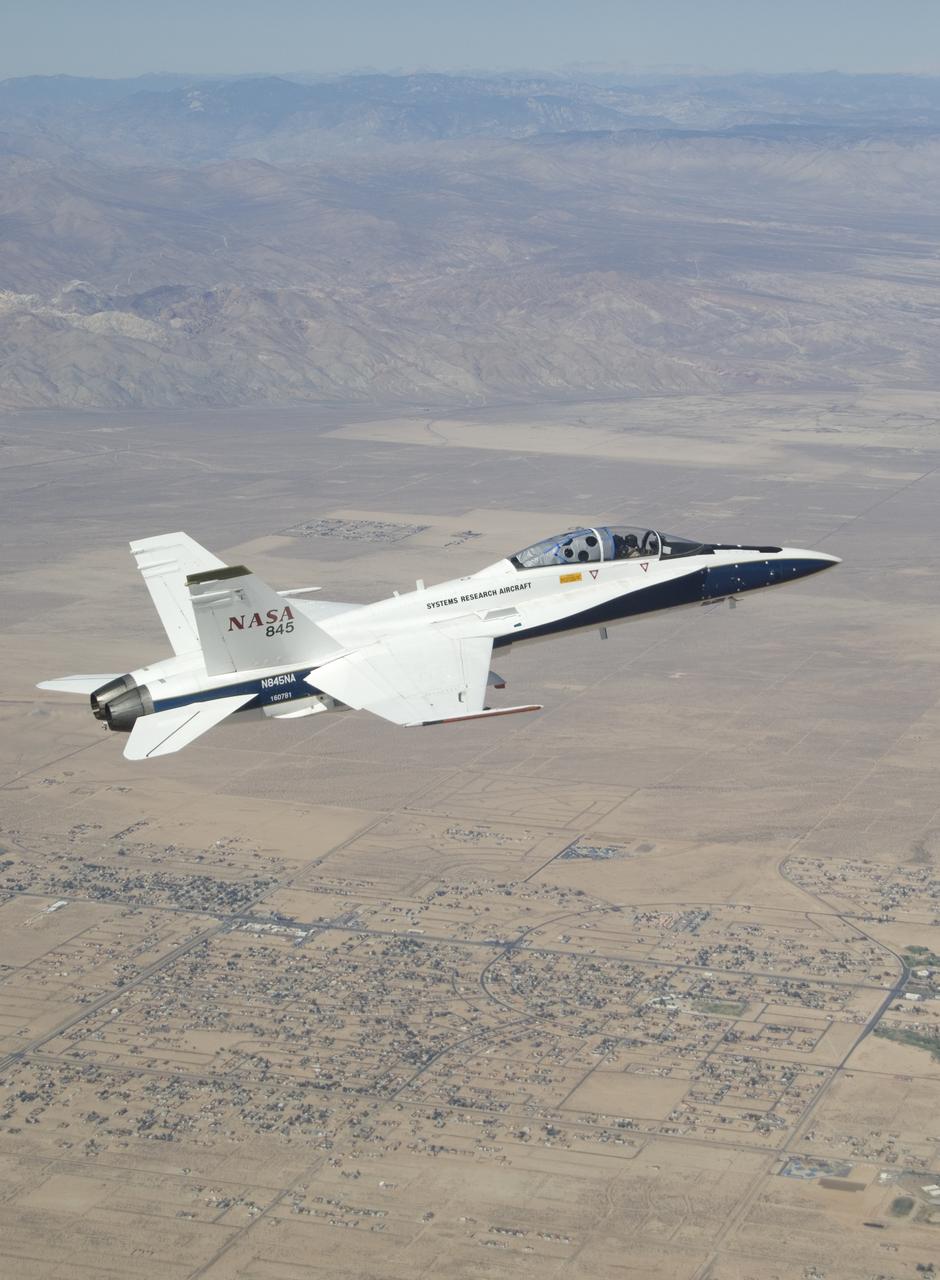
NASA Dryden Flight Research Center's F-18B Systems Research Aircraft on an External Vision System project flight.
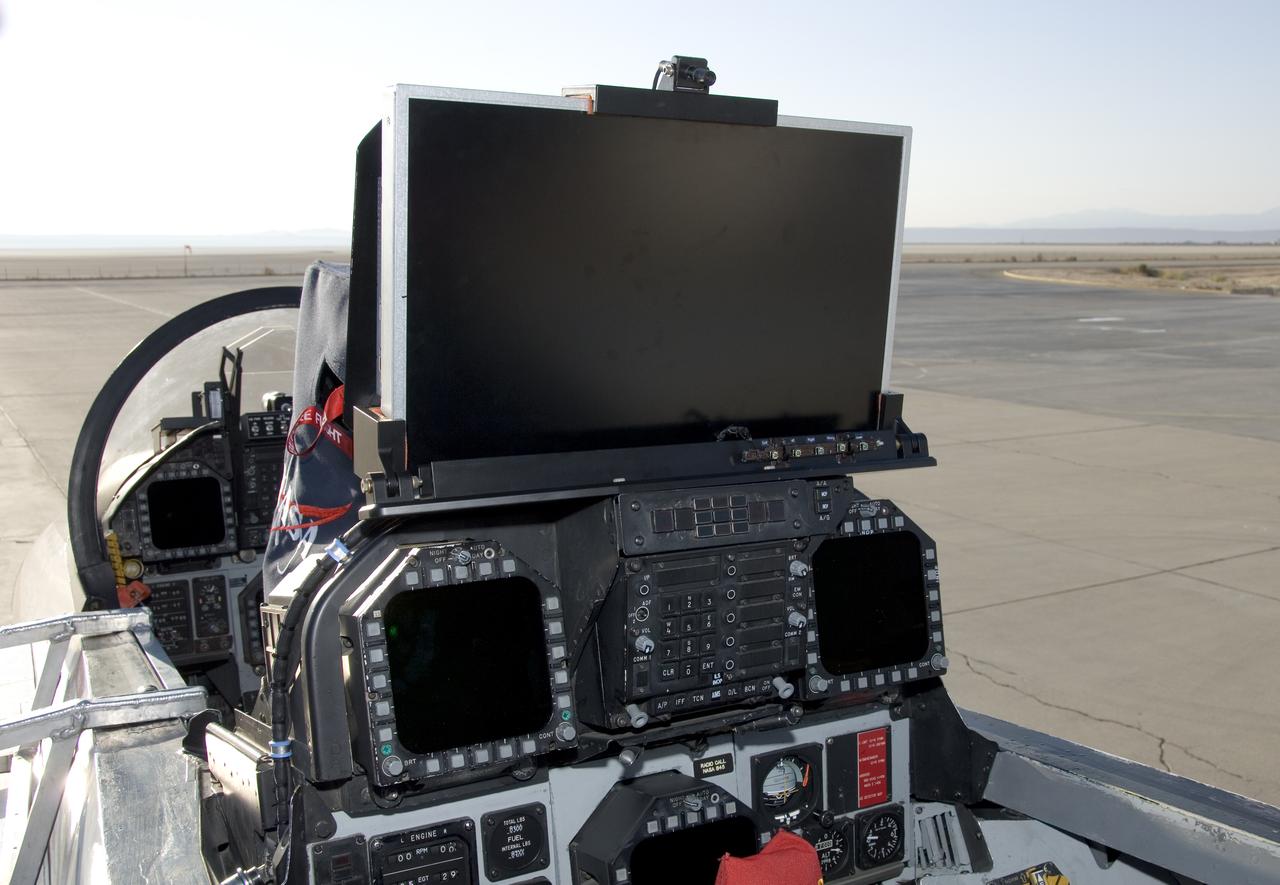
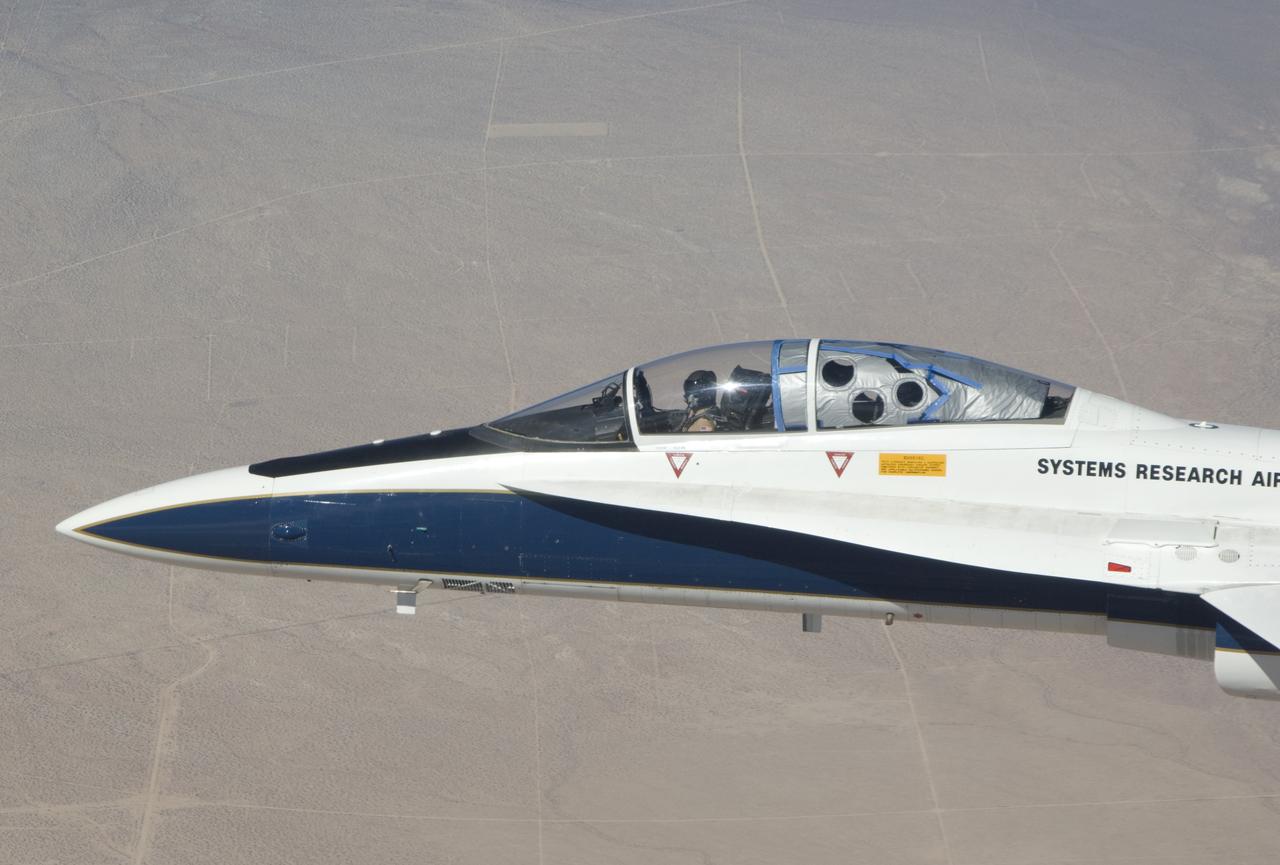
An HD display is mounted on top of the rear instrument panel in NASA's F-18 SRA aircraft, as NASA is partnering with Gulfstream on the External Vision System project.

NASA is partnering with Gulfstream on the External Vision System project to demonstrate the use of an HD video system on the F-18B Systems Research Aircraft.

NASA Dryden Flight Research Center's F-18B Systems Research Aircraft on an External Vision System project flight.
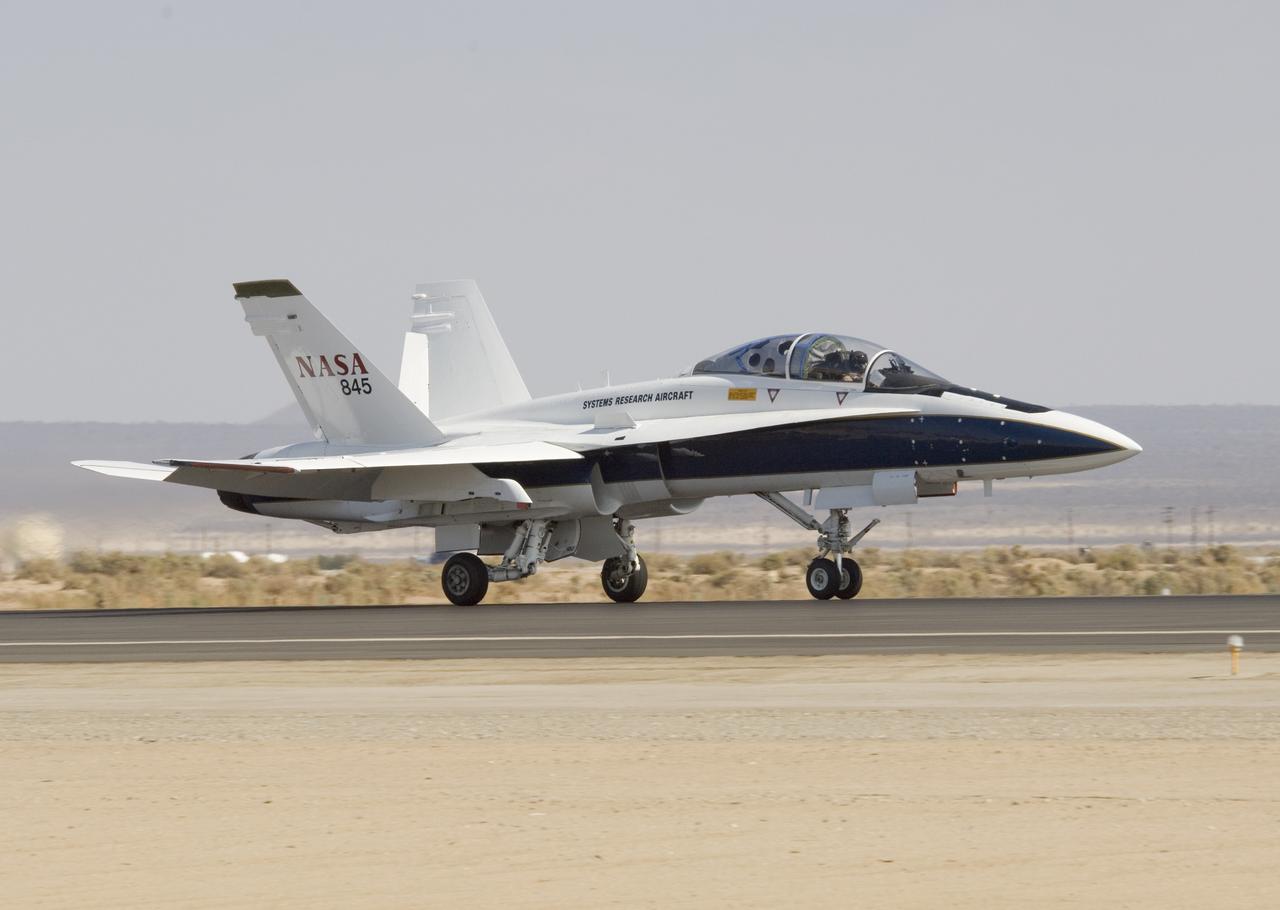
NASA research pilot Jim Smolka prepares to take off in NASA's F-18 Systems Research Aircraft for an External Vision System project flight.
NASA Dryden Flight Research Center's F-18B Systems Research Aircraft on an External Vision System project flight.

Gulfstream project pilot Tom Horne readies to fly an External Vision System project flight from the backseat of NASA's F-18 Systems Research Aircraft.

An HD camera is mounted behind the head-up display of NASA's F-18 SRA aircraft. NASA is partnering with Gulfstream on the External Vision System project.
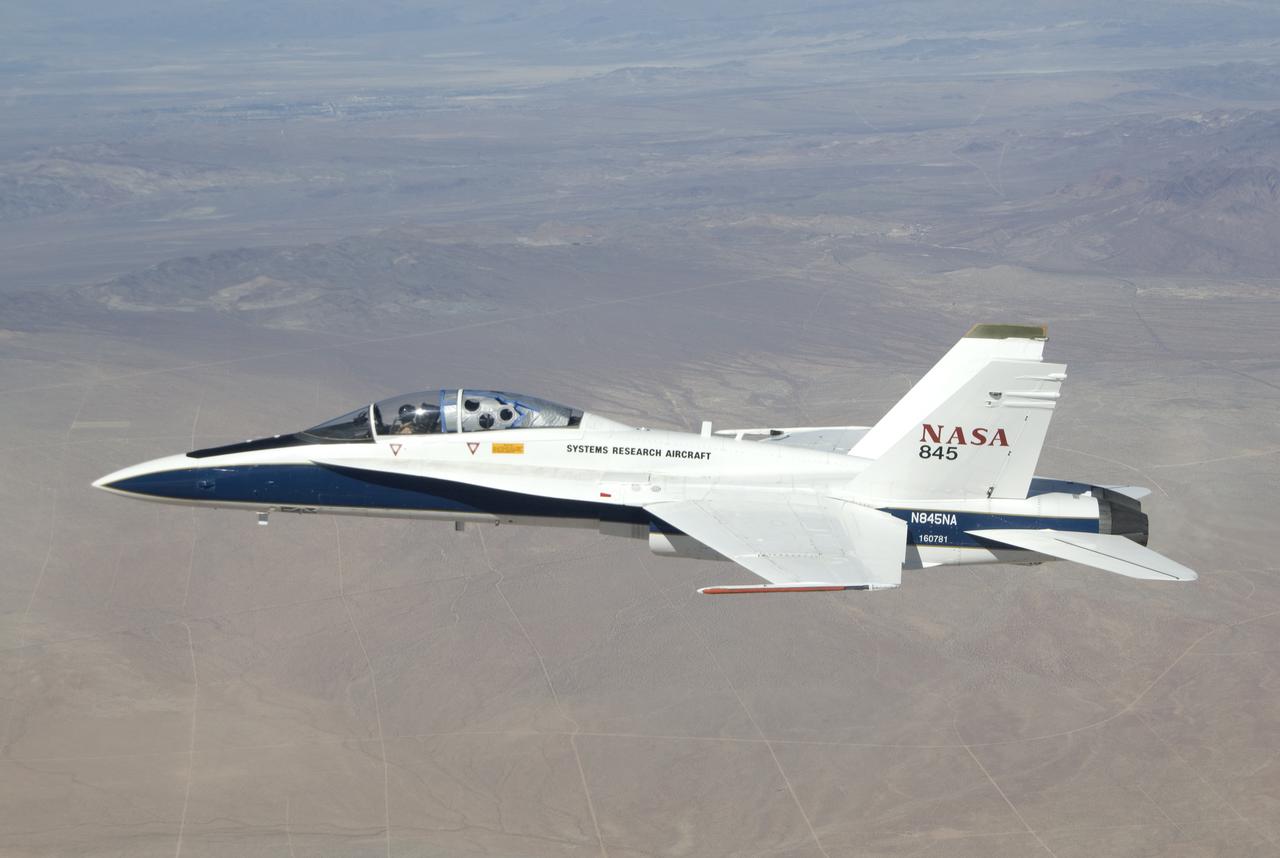
NASA Dryden Flight Research Center's F-18B Systems Research Aircraft on an External Vision System project flight.
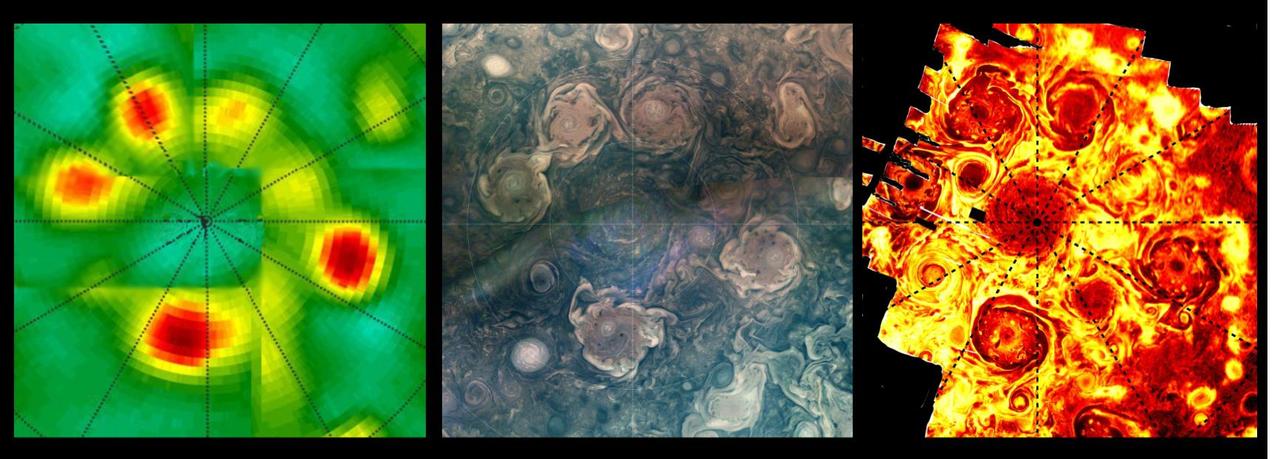
This composite shows views of Jupiter's northern polar cyclones in three different wavelengths of light – microwave, visible, and ultraviolet – as captured by NASA's Juno mission. These differing perspectives allowed Juno scientists to deduce that all Jovian polar cyclones are not created equal. The infrared image, on the far right, was derived from data collected by the spacecraft's Jovian Infrared Auroral Mapper (JIRAM) instrument. The composite image at center was collected by the JunoCam visible-light imager. Though taken with separate instruments that record different wavelengths of light, both images depict Jupiter's northern polar storms as well defined and of similar size. The data on the left, collected by Juno's Microwave Radiometer (MWR), shows the polar storms in another light. MWR enables Juno to see deep into Jupiter by recording the planet's microwave emissions. In the MWR graphic, the polar storms at the 4 and 6 o'clock positions have bright microwave signatures, indicating they extend well beneath the cloud tops, at least 62 miles (100 kilometers) below. The size of those two storms is comparable to what's found in the visible light and infrared light images, but the other storms, as seen through MWR, have a notably reduced emissions intensity. Another disparity in the MWR graphic versus visible light and infrared can be seen in how the central cyclone is depicted by the data. In the infrared and visible light images, the central cyclone is evident; with MWR data, it all but disappears. This disparity indicates that the central cyclone's subsurface structure must be very different from the surrounding storms. JIRAM "sees" in infrared light not visible to the human eye. It captures the infrared glow from the heat of Jupiter's upper atmosphere, probing the top of the weather layer, and gaps in the clouds allow glimpses as deep as 30 to 45 miles (50 to 70 kilometers) below Jupiter's cloud tops. JunoCam's visible light images catch reflected sunlight, with a view that is very similar to what a human eye would see if a person could ride along with Juno. JunoCam's raw images are available for the public to peruse and process into image products at https://missionjuno.swri.edu/junocam/processing. Like JIRAM, the MWR instrument records the glow of Jupiter's atmosphere, but the brightness results from the temperature at depths below anything achievable with previous spacecraft or Earth-based observations. The MWR's six radio channels peer progressively deeper below the visible cloud tops, with a range from the top of the clouds (for the highest frequency channel) to 200 miles (320 kilometers) or more below (for the lowest frequency channel). https://photojournal.jpl.nasa.gov/catalog/PIA26295
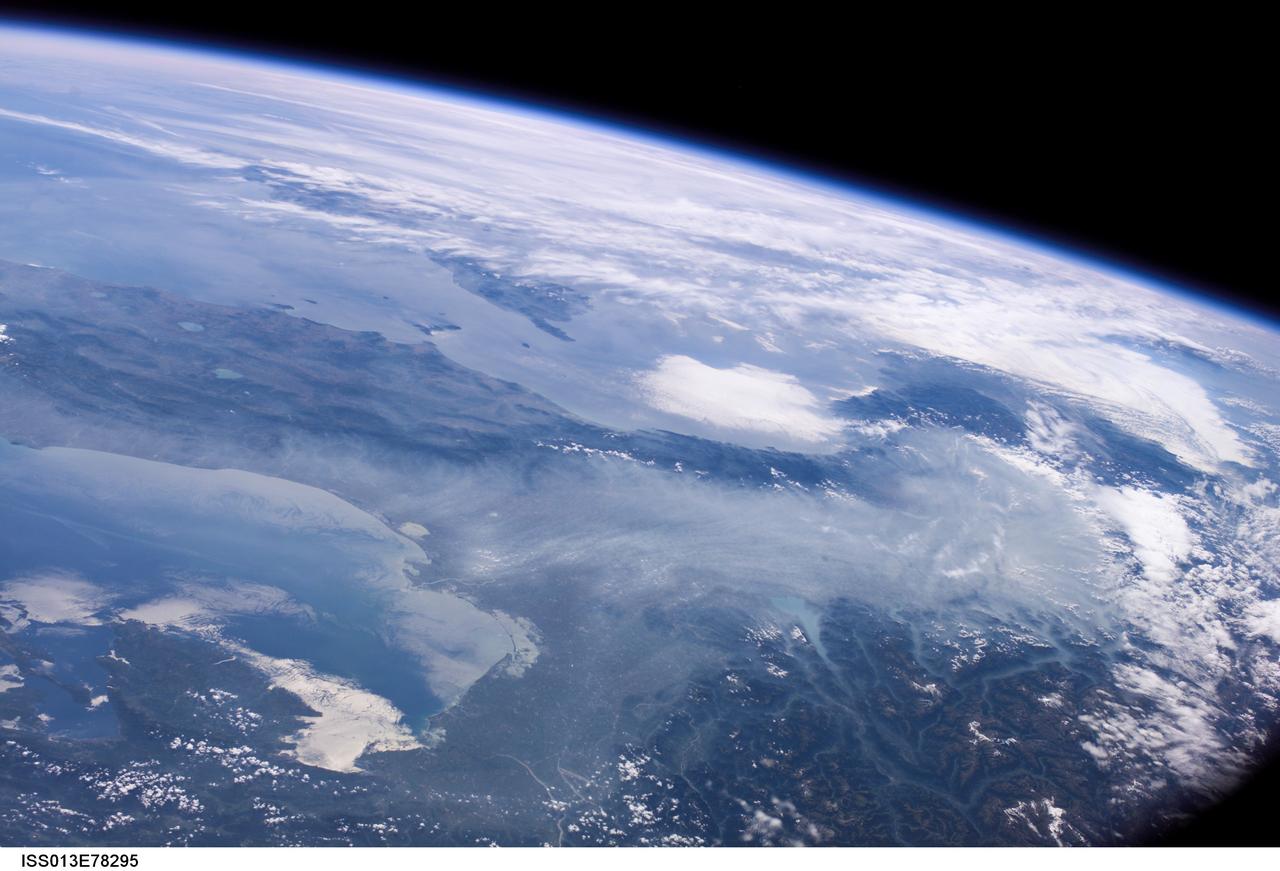
ISS013-E-78295 (6 Sept. 2006) --- Haze in the Po River Valley of Italy is featured in this image photographed by an Expedition 13 crewmember onboard the International Space Station. The valley is visible across the horizontal center of the frame, with the floor obscured by what NASA scientists refer to as frequent atmospheric haze, a mixture of industrial pollutants, dust and smoke. The visual texture of such haze is perceptibly different from that of bright white clouds which stretch across the top of the scene and cover part of the Alps. The Po River Valley is Italy's industrial heartland and one of the most industrialized regions on Earth, according to scientists. Northern Italy is in the foreground of this southwesterly view. The partially cloud-covered Alps are at lower right; the Adriatic Sea at lower left. Corsica is under partial cloud cover at center; and Sardinia, almost totally obscured, is to its south. The island of Elba is visible just to the west of Italy. By contrast with haze accumulation along the axis of the valley, the Alps and the Apennines are clearly visible, and Lake Garda can be seen in the foothills of the Alps. Other visible geographic features are the lagoon at Venice north of the Po River delta, and three small lakes north of Rome. The winds on the day this image was taken are mainly from the north, as shown by the flow lines in the haze near Venice. The haze typically flows south down the Adriatic Sea. Visibility in the Mediterranean basin is often reduced by hazes such as these, deriving from different sources in industrialized Europe.
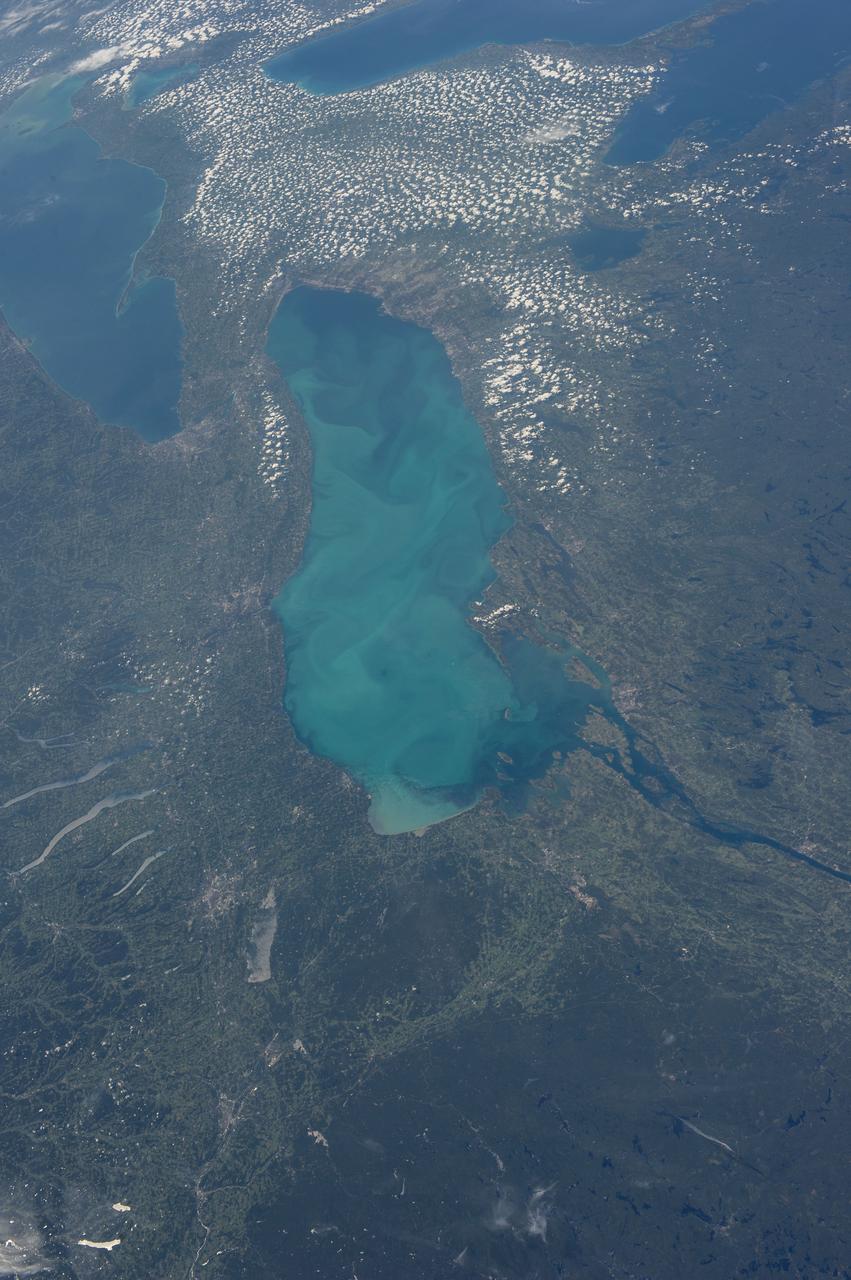
ISS036-E-035635 (24 Aug. 2013) --- Plankton bloom and Lake Ontario are featured in this image photographed by an Expedition 36 crew member on the International Space Station. This photograph highlights a late summer plankton bloom visible throughout much of Lake Ontario (one of the Great Lakes, together with Michigan, Superior, Erie, and Huron). Cyanobacteria, or blue-green algae, can reach such large concentrations that they color the water to such an extent that the change is visible from orbit. Harmful algal blooms, or HABs, have been observed in all of the Great Lakes – particularly Lake Erie - and are associated with a variety of causative factors including changes in precipitation; drought; invasive species (quagga, zebra mussels, Asian carp); nutrient loading from runoff and sewage (nitrogen and phosphorus); and warmer average temperatures. In addition to reduced water quality and human health concerns, algal blooms can also lead to hypoxia (reduction of oxygen in the bottom waters) that kills large numbers of fish and other aquatic life. Lake Ontario, like the other Great Lakes Erie, Huron, and Superior is roughly divided between the USA and Canada. The USA side of Lake Ontario has its shoreline along the state of New York, while its Canadian shoreline lies within the province of Ontario. The city of Kingston, Ontario, is visible near the Saint Lawrence River outflow from the lake. Several other landscape features of New York State are visible in the image, including the Finger Lakes region to the west of Syracuse, NY (upper left). To the northeast of Syracuse, the dark wooded slopes of the Adirondack Mountains are visible at lower right. Patchy white cloud cover obscures much of the land surface to the west of Lake Ontario.
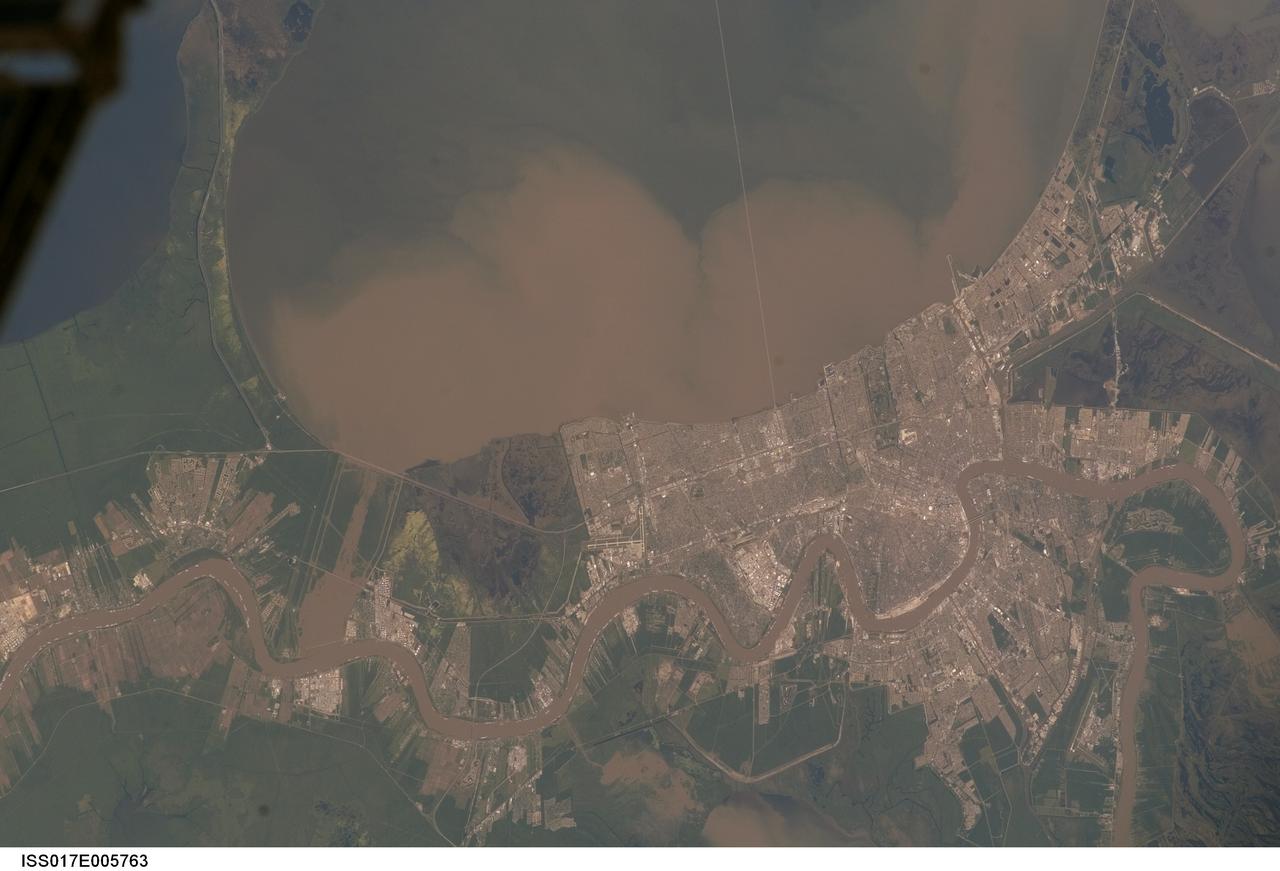
ISS017-E-005763 (29 April 2008) --- Lake Pontchartrain and the Bonnet Carre Spillway, Louisiana, are featured in this image photographed by an Expedition 17 crewmember on the International Space Station. Lake Pontchartrain, a big body of water immediately north of New Orleans, occupies the upper part of this view, with the winding course of the muddy Mississippi River snaking across the bottom of the image (flow is east, from left to right). The city of New Orleans is sandwiched between the lake and river. Heavy rain in March and April 2008 in the Mississippi's catchment area raised water levels in the river sufficiently to make the Army Corps of Engineers take action. To reduce the volume of the river where it passes through New Orleans, the Corps opened the Bonnet Carre Spillway (lower left), a major engineering structure 18 kilometers upriver from New Orleans. The spillway, a 1.6 kilometer-wide gap in the developments along the Mississippi levees, is an integral part of the river and canal system that allows Mississippi river water to flow into Lake Pontchartrain. The spillway control structure itself is visible as a thin, discontinuous, white line along the river's edge in this image. The spillway has only been opened eight times since 1937. News of the opening in April 2008 was transmitted to crewmembers aboard the International Space Station who managed to capture the immediate effect of muddy water flowing down the spillway and into Lake Pontchartrain, where it forms great brown lobes in the otherwise green water. These lobes moved slowly east along the New Orleans shoreline, where the line of the Lake Pontchartrain Causeway, the longest bridge in the U.S., can be seen, top right. Opening the spillway protects New Orleans in various ways. First, it reduces pressure on the levees, which famously collapsed at some points during the onslaught of Hurricane Katrina in 2005. Keeping water levels below critical high levels also helps the river channel to accommodate the discharge of water, and reduces both the speed of flow and cross currents in the river which can interfere with vessels navigating the river -- or even cause collisions with levees.
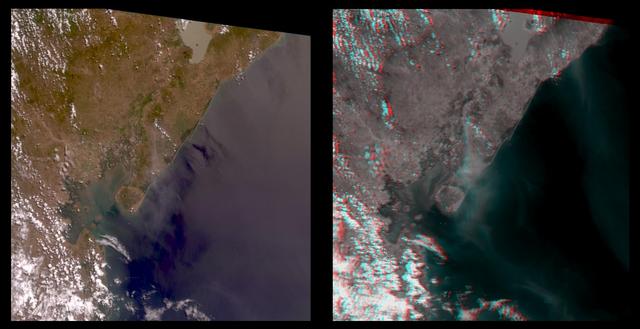
The true-color image at left is a downward-looking (nadir) view of the area around the San Cristobal volcano, which erupted the previous day. This image is oriented with east at the top and north at the left. The right image is a stereo anaglyph of the same area, created from red band multi-angle data taken by the 45.6-degree aftward and 70.5-degree aftward cameras on the Multi-angle Imaging SpectroRadiometer (MISR) instrument on NASA's Terra satellite. View this image through red/blue 3D glasses, with the red filter over the left eye. A plume from San Cristobal (approximately at image center) is much easier to see in the anaglyph, due to 3 effects: the long viewing path through the atmosphere at the oblique angles, the reduced reflection from the underlying water, and the 3D stereoscopic height separation. In this image, the plume floats between the surface and the overlying cumulus clouds. A second plume is also visible in the upper right (southeast of San Cristobal). This very thin plume may originate from the Masaya volcano, which is continually degassing at as low rate. The spatial resolution is 275 meters (300 yards). http://photojournal.jpl.nasa.gov/catalog/PIA02600
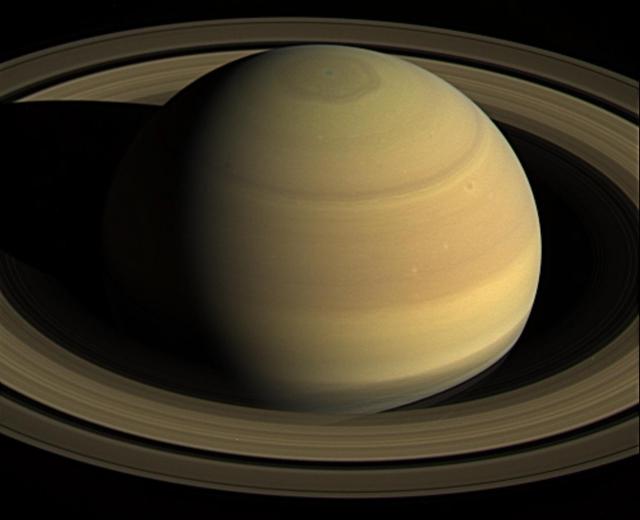
NASA's Cassini spacecraft stared at Saturn for nearly 44 hours on April 25 to 27, 2016, to obtain this movie showing just over four Saturn days. With Cassini's orbit being moved closer to the planet in preparation for the mission's 2017 finale, scientists took this final opportunity to capture a long movie in which the planet's full disk fit into a single wide-angle camera frame. Visible at top is the giant hexagon-shaped jet stream that surrounds the planet's north pole. Each side of this huge shape is slightly wider than Earth. The resolution of the 250 natural color wide-angle camera frames comprising this movie is 512x512 pixels, rather than the camera's full resolution of 1024x1024 pixels. Cassini's imaging cameras have the ability to take reduced-size images like these in order to decrease the amount of data storage space required for an observation. The spacecraft began acquiring this sequence of images just after it obtained the images to make a three-panel color mosaic. When it began taking images for this movie sequence, Cassini was 1,847,000 miles (2,973,000 kilometers) from Saturn, with an image scale of 355 kilometers per pixel. When it finished gathering the images, the spacecraft had moved 171,000 miles (275,000 kilometers) closer to the planet, with an image scale of 200 miles (322 kilometers) per pixel. A movie is available at http://photojournal.jpl.nasa.gov/catalog/PIA21047
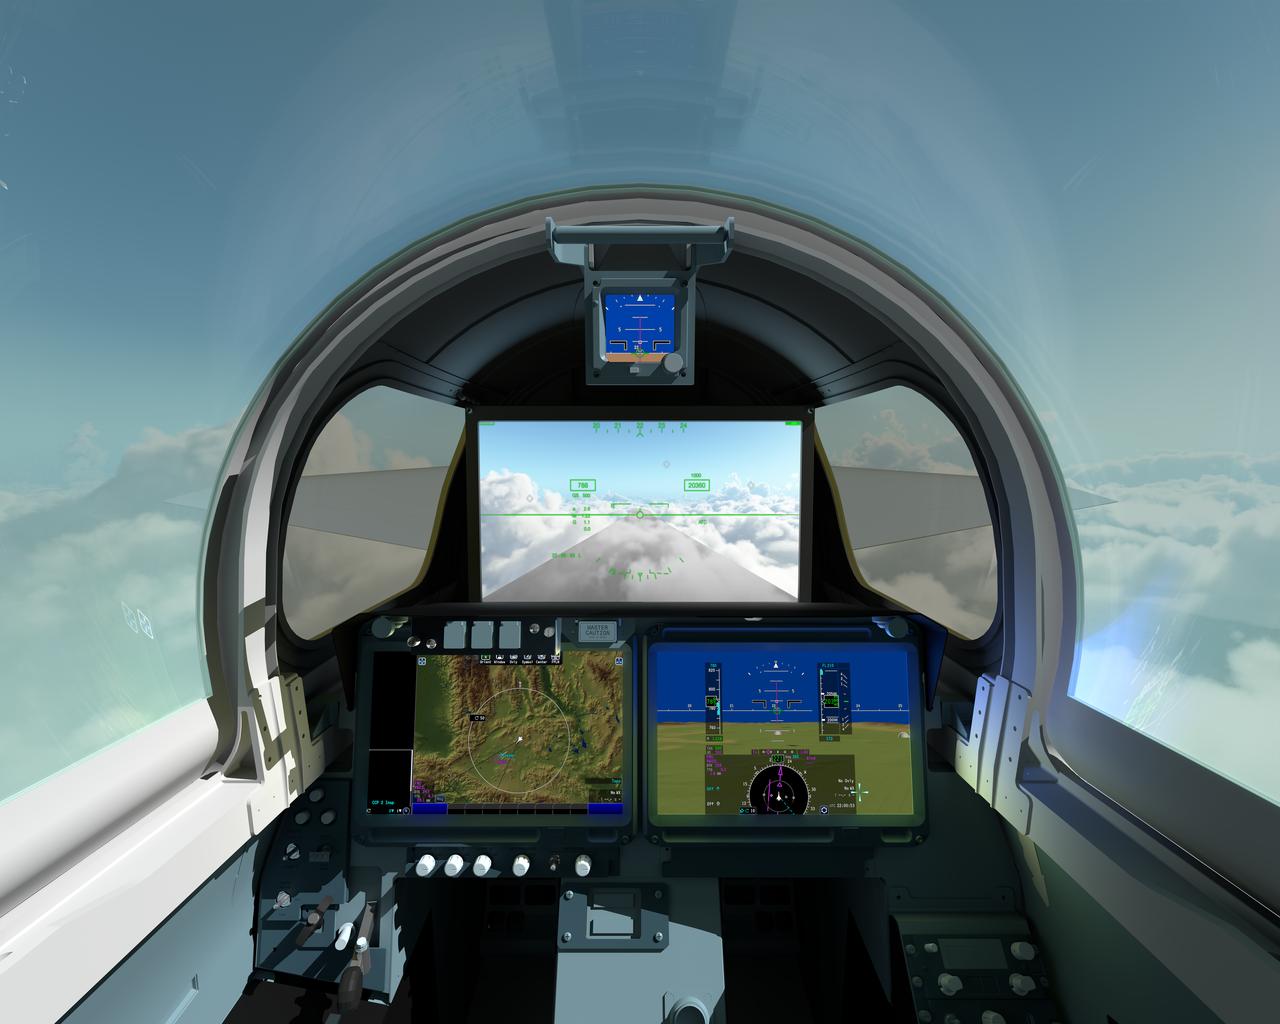
The pilot of NASAÕs X-59 Quiet SuperSonic Technology, or QueSST, aircraft will navigate the skies in a cockpit unlike any other. There wonÕt be a forward-facing window. ThatÕs right; itÕs actually a 4K monitor that serves as the central window and allows the pilot to safely see traffic in his or her flight path, and provides additional visual aids for airport approaches, landings and takeoffs. The 4K monitor, which is part of the aircraftÕs eXternal Visibility System, or XVS, displays stitched images from two cameras outside the aircraft combined with terrain data from an advanced computing system. The two portals and traditional canopy are real windows however, and help the pilot see the horizon. The displays below the XVS will provide a variety of aircraft systems and trajectory data for the pilot to safely fly. The XVS is one of several innovative solutions to help ensure the X-59Õs design shape reduces a sonic boom to a gentle thump heard by people on the ground. Though not intended to ever carry passengers, the X-59 boom-suppressing technology and community response data could help lift current bans on supersonic flight over land and enable a new generation of quiet supersonic commercial aircraft.
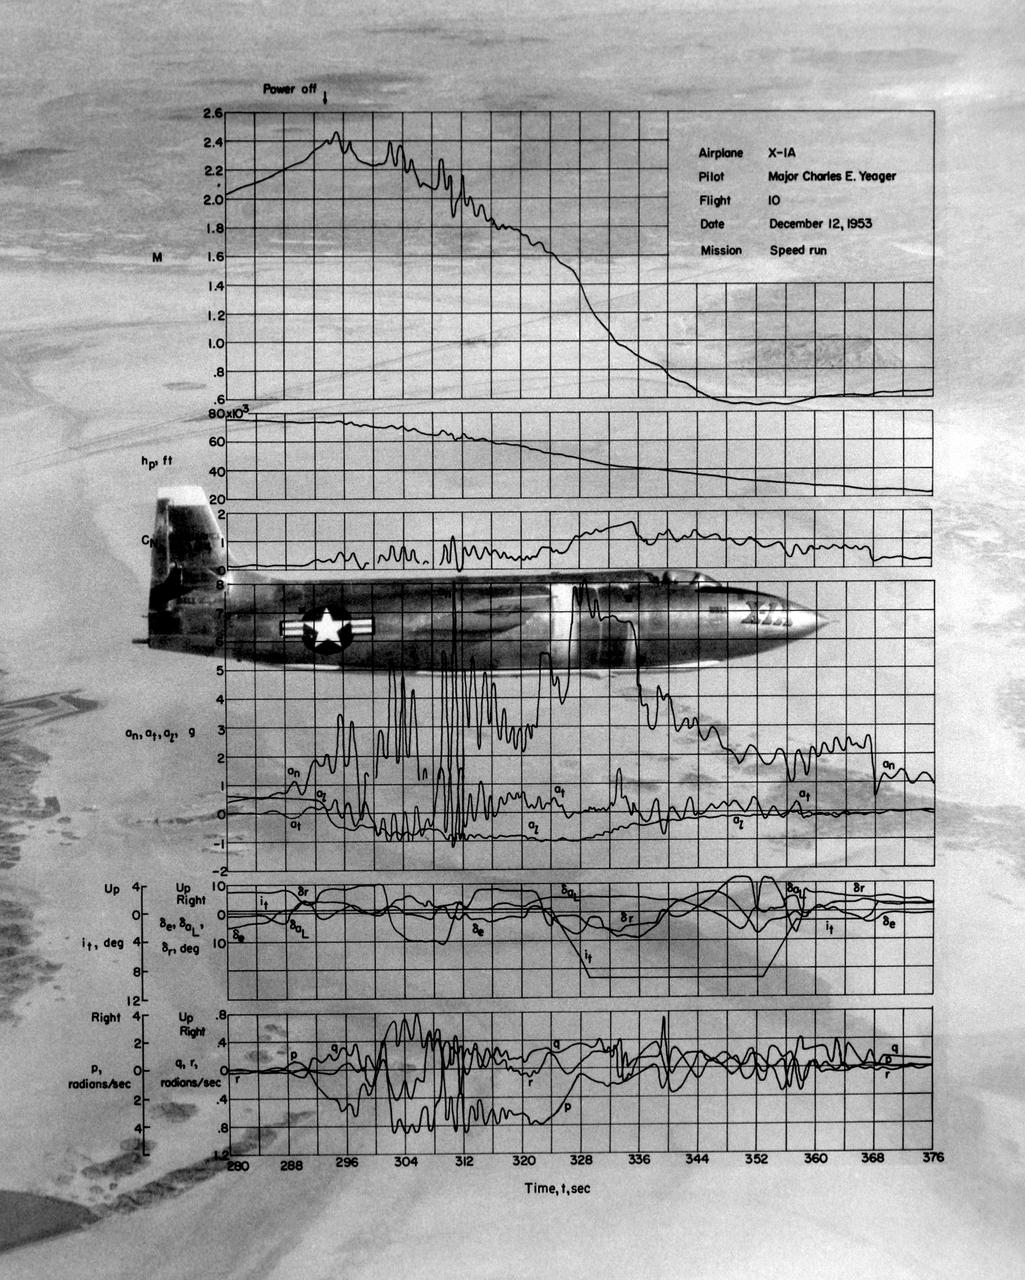
This photo of the X-1A includes graphs of the flight data from Maj. Charles E. Yeager's Mach 2.44 flight on December 12, 1953. (This was only a few days short of the 50th anniversary of the Wright brothers' first powered flight.) After reaching Mach 2.44, then the highest speed ever reached by a piloted aircraft, the X-1A tumbled completely out of control. The motions were so violent that Yeager cracked the plastic canopy with his helmet. He finally recovered from a inverted spin and landed on Rogers Dry Lakebed. Among the data shown are Mach number and altitude (the two top graphs). The speed and altitude changes due to the tumble are visible as jagged lines. The third graph from the bottom shows the G-forces on the airplane. During the tumble, these twice reached 8 Gs or 8 times the normal pull of gravity at sea level. (At these G forces, a 200-pound human would, in effect, weigh 1,600 pounds if a scale were placed under him in the direction of the force vector.) Producing these graphs was a slow, difficult process. The raw data from on-board instrumentation recorded on oscillograph film. Human computers then reduced the data and recorded it on data sheets, correcting for such factors as temperature and instrument errors. They used adding machines or slide rules for their calculations, pocket calculators being 20 years in the future.

ISS040E112662 (08/30/2014) ---- Cancún, Mexico. A long lens was used by astronauts aboard the International Space Station to take this image, and it highlights many natural and built features. The street pattern of Mexico’s tourist mecca, Cancún, contrasts with the waterways of the marinas that open into the bay and the lagoons. Brilliant blue water over coral reefs contrast with the dark waters of inland lagoons. The reefs are the second largest reef system on Earth, and draw tourists from all over the world. The wide, well developed beach on the gulf coast (image upper right) is the result of vigorous wave energy; the white sand makes the beach easily visible from space. But wave energy is reduced along Cancún’s protected shoreline (image center) and the beaches are thin or non-existant. Fair-weather cumulus clouds are scattered across the image top left. To shoot crisp mages with long lenses, astronaut photographers must learn to brace themselves against the ISS bulkhead to prevent any slight shaking that would blur or “smear” the picture. Counterintuitively, they then need to move the camera carefully retaining the target at the same point in the viewfinder (the landscape moves across the viewfinder quickly with long lenses). This is called tracking the target and requires good coordination by the photographer—again, to prevent blurring. Shorter lenses do not require this skill because the image appears to pass more slowly across the viewfinder.
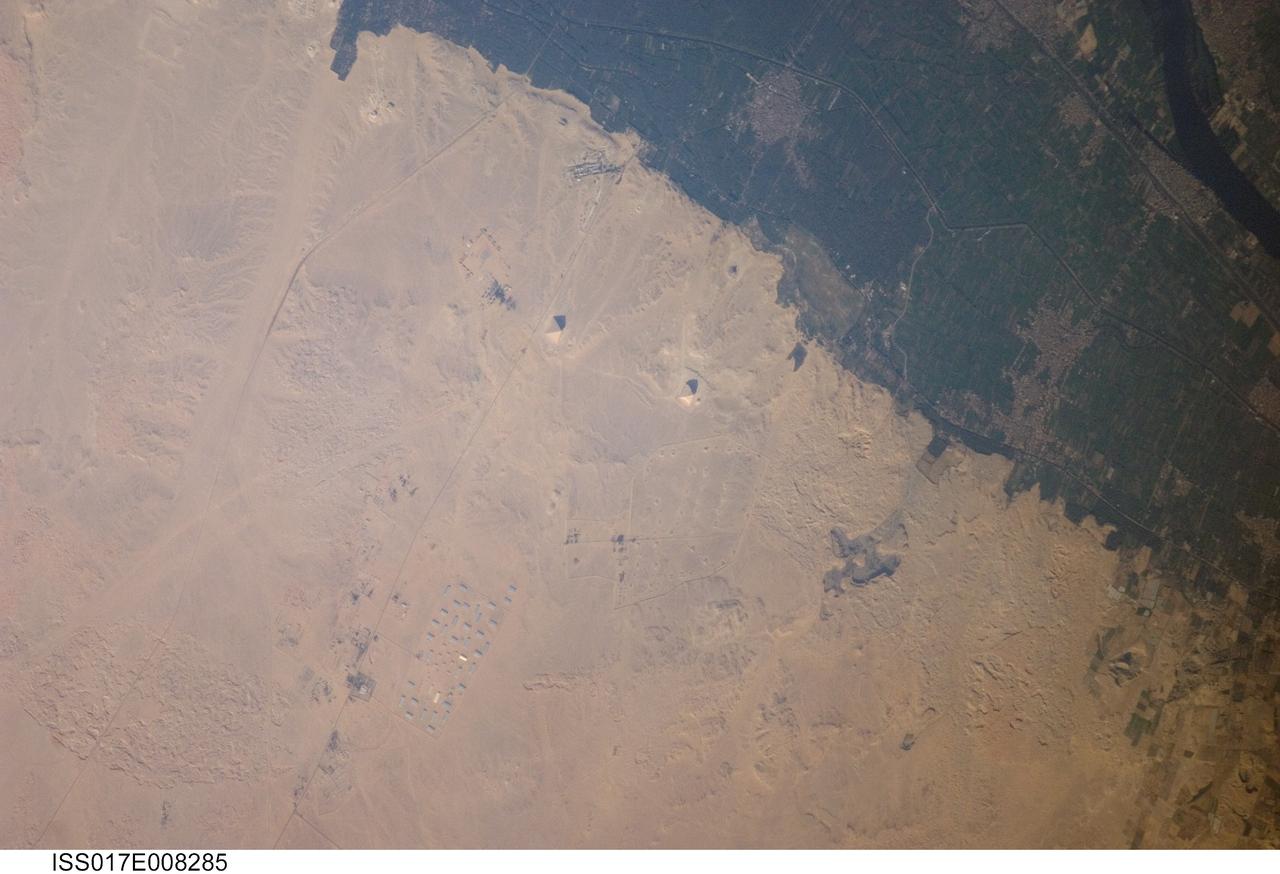
ISS017-E-008285 (30 May 2008) --- Pyramids of Dashur, Egypt are featured in this image photographed by an Expedition 17 crewmember on the International Space Station. While the pyramids of Giza are perhaps the most famous, there are several other ancient Egyptian royal necropolis ("city of the dead") sites situated along the Nile River and its delta. One of these sites is located near the village of Dashur (upper right). The gray-brown built area of Dashur is surrounded by green agricultural land of the Nile Delta, which forms a distinct boundary with the tan desert to the west. It is in the desert that the monuments of the ancient rulers of Egypt are found. Several monuments are visible in this image, including the large Red and Bent Pyramids built by Snofru, first king of the 4th Dynasty that lasted from 2575-2465 BC. Other visible monuments include the pyramid complexes of Amenemhat III and Sesostris III, both kings of the 12th Dynasty (1991-1783 BC). Both of these complexes are poorly preserved, due both to unstable ground conditions, and dismantling of the limestone blocks forming the outer pyramid casings during later historical periods. The Bent Pyramid (lower right) is so called as the slope of the outer face was lessened halfway through construction, leading to a distinctive "bent" profile -- explanations for why this was done include decreasing the mass of the pyramid to prevent collapse, or to reduce the work necessary to complete it. The Red Pyramid to the north (center) was built after the Bent Pyramid, and is named for the coloration of the building stone at the structure's core. An irregular dark feature to the southeast of the Bent Pyramid is not a shadow cast by a monument; it is an irrigation feature extending into the desert.
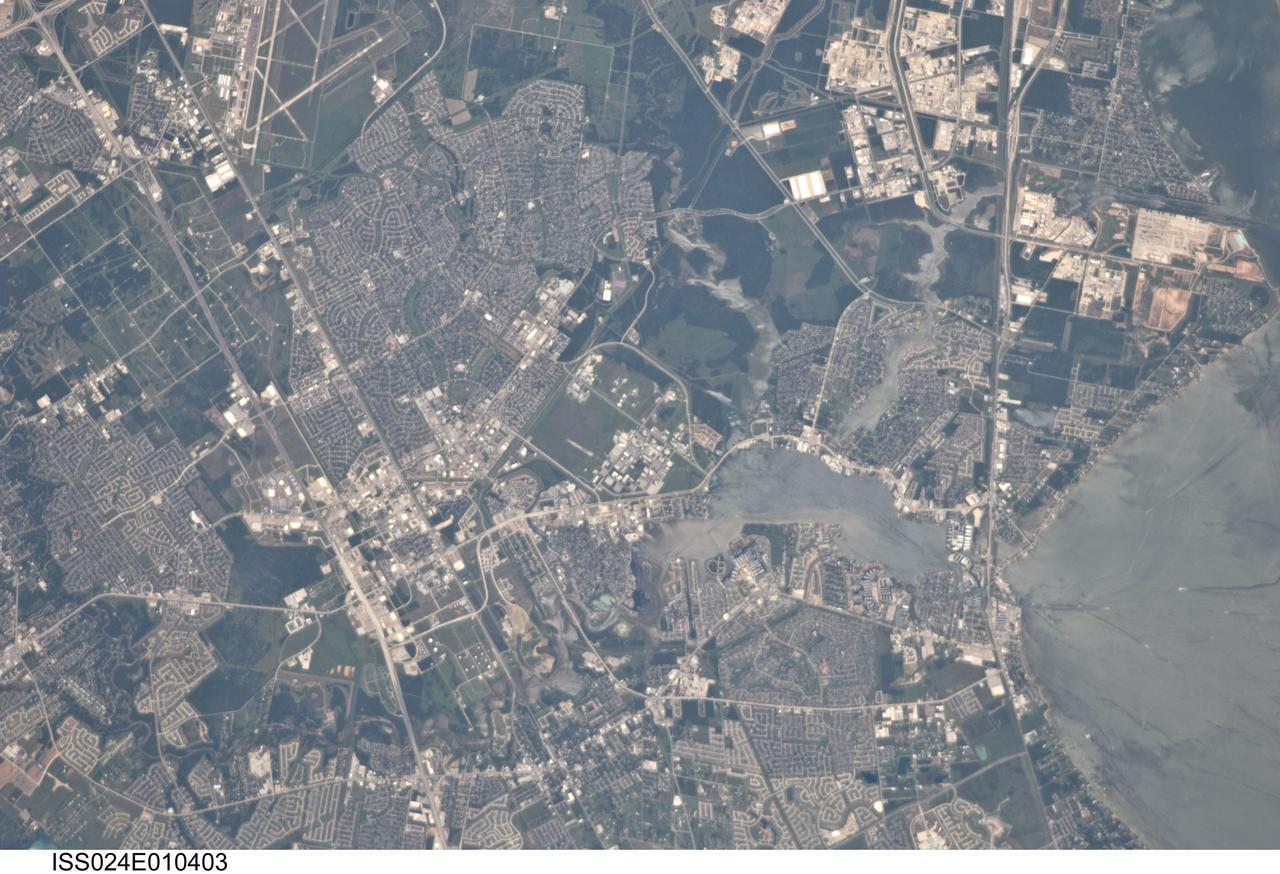
ISS024-E-010403 (31 July 2010) --- This detailed image ? photographed by an Expedition 24 crew member on the International Space Station (ISS) ? is centered on the NASA Lyndon B. Johnson Space Center (JSC), located in the southeastern Houston, TX metropolitan area. While initially being represented by a number of temporary locations in Houston, the facility was established in 1961 as the Manned Spacecraft Center and renamed in honor of the late U.S. President Johnson (a Texas native) in 1973. JSC serves as the lead NASA center for both astronaut training and mission control of manned spacecraft - such as the ISS and space shuttle - and has done so throughout the history of the U.S. manned space program. The Center also collaborates with other NASA and international partner facilities in a variety of scientific and engineering programs related to human spaceflight and planetary exploration. JSC is located approximately midway between downtown Houston and Galveston, TX, and is bordered by several smaller municipalities that form a mosaic of urban and suburban land use (grey areas with street grids, and commercial/industrial areas characterized by white rooftops). Large tracts of grassy fields and forests in the area (light to dark green respectively) include nature preserves, grazing lands, and flood control areas. Also visible at upper left is Ellington Field. This airport services a variety of NASA aircraft used for astronaut training, scientific, and cargo transport purposes. Clear Lake, an inlet of Galveston Bay, is located to the immediate southeast of JSC. Both Clear Lake and Galveston Bay appear silver-grey due to sunglint, or light reflected back towards the observer on the ISS that gives the water surface a mirror-like appearance. Several boat wakes are visible in Galveston Bay (right) due to disruption of the water surface that reduces the sunglint effect.
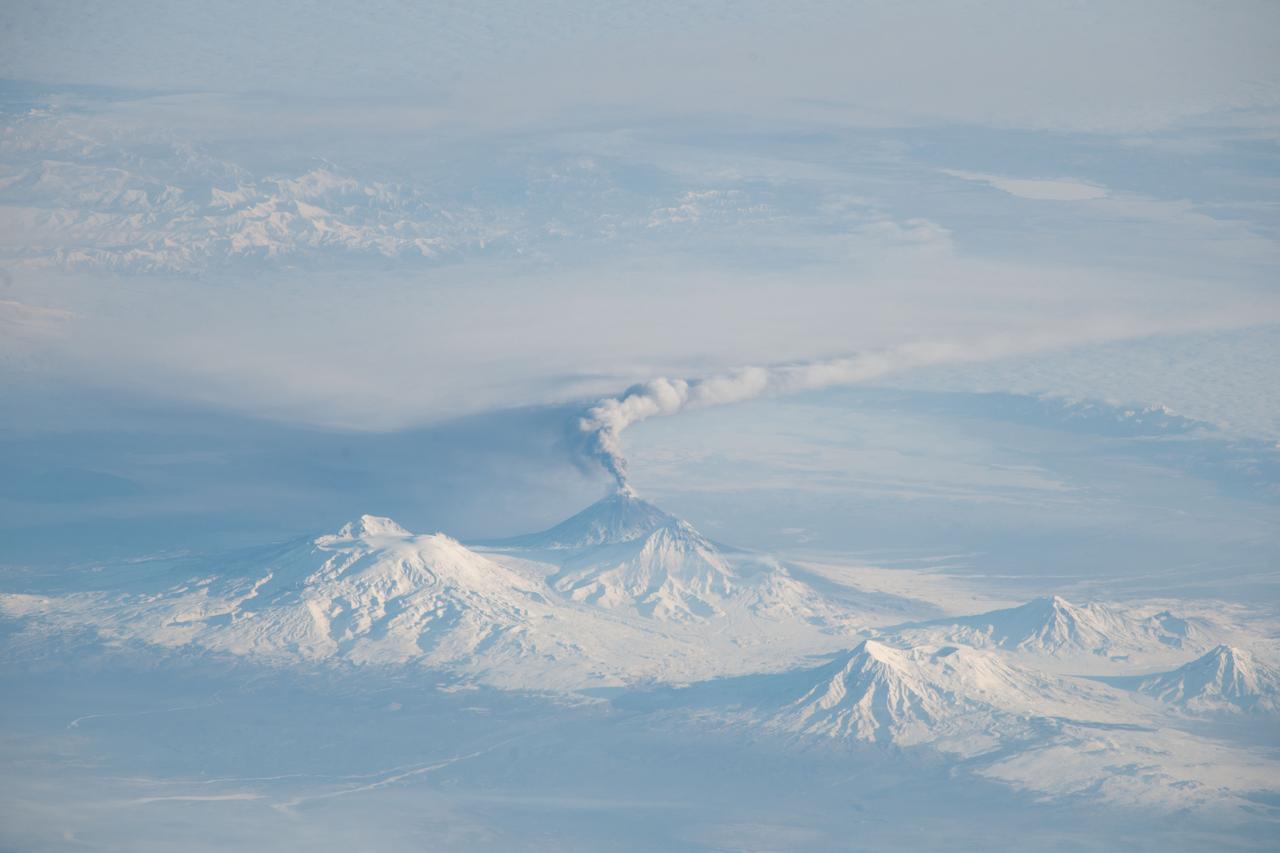
ISS038-E-005515 (16 Nov. 2013) --- Activity at Kliuchevskoi Volcano on Kamchatka Peninsula in the Russian Federation is featured in this image photographed by an Expedition 38 crew member on the International Space Station. When viewing conditions are favorable, crew members onboard the space station can take unusual and striking images of Earth. This photograph provides a view of an eruption plume emanating from Kliuchevskoi Volcano, one of the many active volcanoes on the Kamchatka Peninsula. Nadir views – looking “straight down”—that are typical of orbital satellite imagery tend to flatten the appearance of the landscape by reducing the sense of three dimensions of the topography. In contrast, this image was taken from the ISS with a very oblique viewing angle that gives a strong sense of three dimensions, which is accentuated by the shadows cast by the volcanic peaks. This resulted in a view similar to what a person might see from a low-altitude airplane. The image was taken when the space station was located over a ground position more than 1,500 kilometers to the southwest. The plume – likely a combination of steam, volcanic gases, and ash – is extended to the east-southeast by prevailing winds; the dark region to the north-northwest of the plume is likely a product of both shadow and ash settling out. Several other volcanoes are visible in the image, including Ushkovsky, Tolbachik, Zimina, and Udina. To the south-southwest of Kliuchevskoi lies Bezymianny Volcano which appears to be emitting a small steam plume (visible at center).
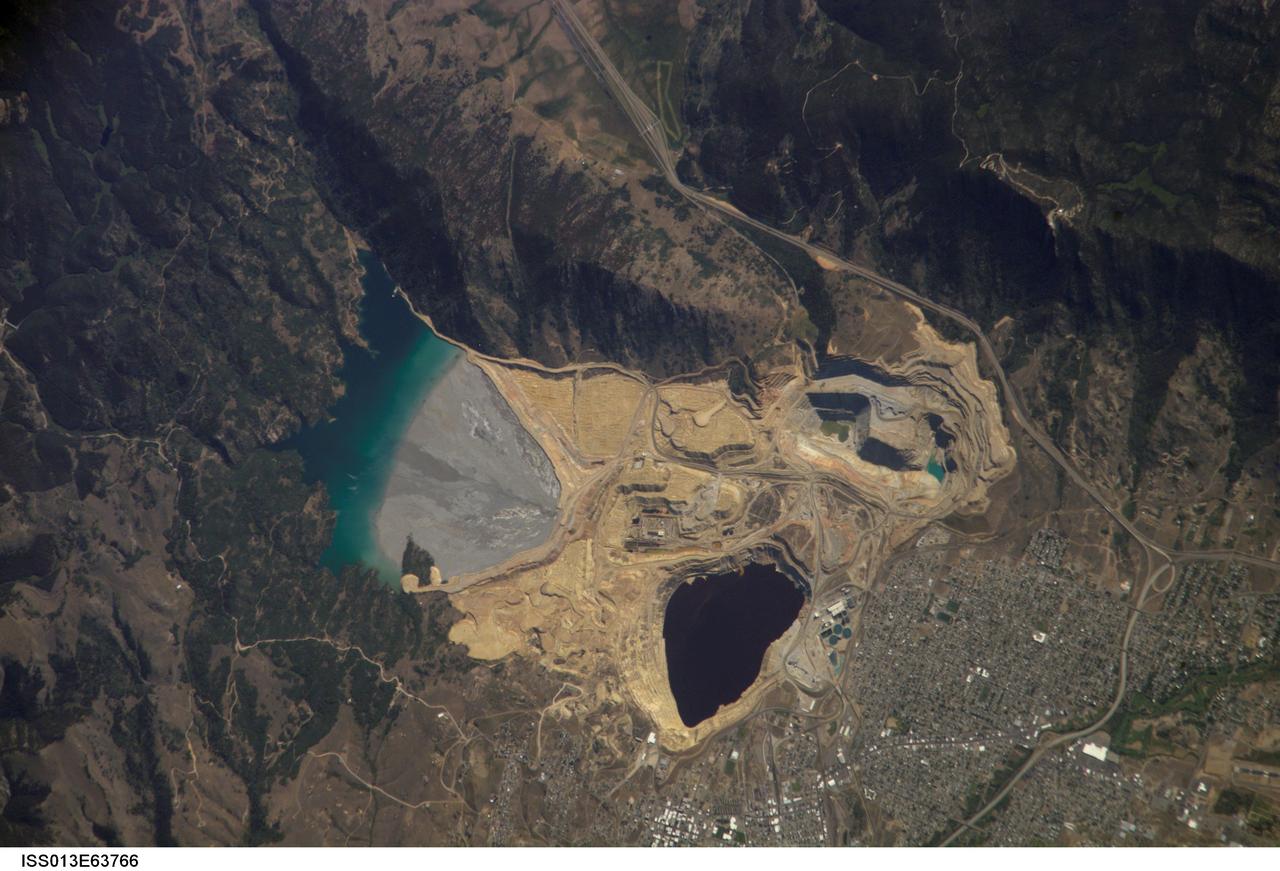
ISS013-E-63766 (2 Aug. 2006) --- Berkeley Pit and Butte, Montana are featured in this image photographed by an Expedition 13 crewmember on the International Space Station. The city of Butte, Montana has long been a center of mining activity. Underground mining of copper began in Butte in the 1870s, and by 1901 underground workings had extended to the groundwater table. Thus began the creation of an intricate complex of underground drains and pumps to lower the groundwater level and continue the extraction of copper. Water extracted from the mines was so rich in dissolved copper sulfate that it was also "mined" (by chemical precipitation) for the copper it contained. In 1955, the Anaconda Copper Mining Company began open-pit mining for copper in what is now know as the Berkeley Pit (dark oblong area in center). The mine took advantage of the existing subterranean drainage and pump network to lower groundwater until 1982, when the new owner ARCO suspended operations at the mine. The groundwater level swiftly rose, and today water in the Pit is more than 900 feet deep. Many features of the mine workings are visible in this image such as the many terraced levels and access roadways of the open mine pits (gray and tan sculptured surfaces). A large gray tailings pile of waste rock and an adjacent tailings pond are visible to the north of the Berkeley Pit. Color changes in the tailings pond are due primarily to changing water depth. The Berkeley Pit is listed as a federal Superfund site due to its highly acidic water, which contains high concentrations of metals such as copper and zinc. The Berkeley Pit receives groundwater flowing through the surrounding bedrock and acts as a "terminal pit" or sink for these heavy metal-laden waters. Ongoing efforts include regulation of water flow into the pit to reduce filling of the Pit and potential release of contaminated water into local aquifers or surface streams.
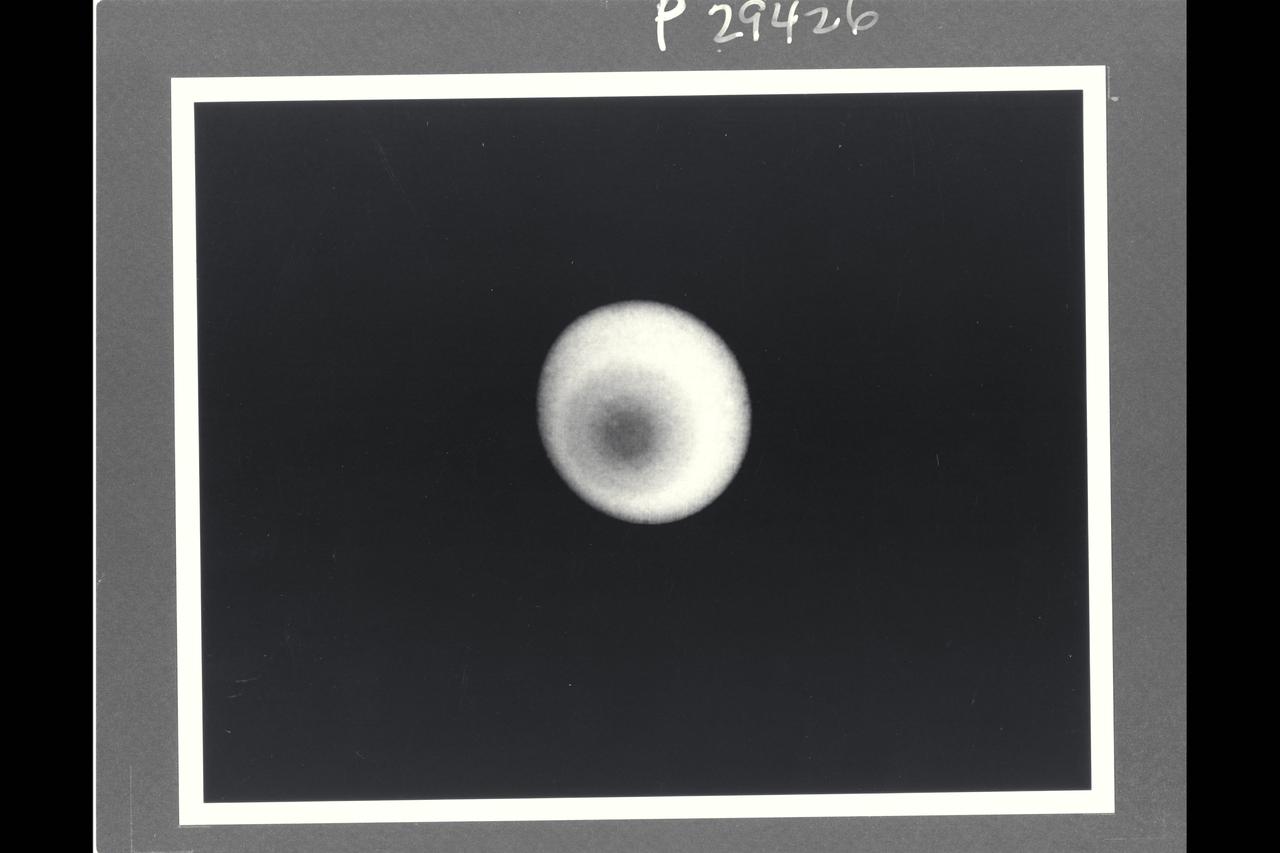
Range : 36 million km. ( 22 million miles ) P-29426B/W This Voyager 2 photograph of Uranus shows the is the first picture to show clear evidence of latitudinal banding in the planet's atmosphere. This is a computerized summation of five images shot by the narrow angle camera. The concentric pattern emanates like a bulls-eye from the planets pole of rotation, which, in this view, lies left of center. uranus lies almost on its side with respect to the other planets and is rotating in a counter clockwise direction, as seen here. Clouds in the Uranian atmosphere give rise to the pattern, the first clear evidence of banding similiar to that seen previosly on Saturn and Jupiter. The bandind on Uranus, however, shows much less contrast. At the distance at which the images were acquired, Voyager's camera could have detected individual features as small as 660 km. (410 miles) across, but no such cloud or markings were apparent. Scientists cannot yet say what properties, such as cloud height, composition, or particle size, are giving rise to the varying levels of brightness visible here. The images composing this picture were shot through a filter that transmits only violet light. in the original, unprocessed images, the contrast of features producing the banding is low, not more than 10 percent. In order to reduce 'noise' and enhance the visiblity of the features, processors combined five images and then compared the resulting composite to a hypothetical featureless planet illuminated by the Sun from the proper direction. Only the ratio between the original data and the hypothetical image is shown.
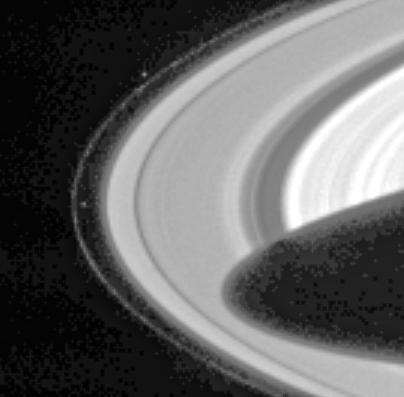
Cassini has sighted Prometheus and Pandora, the two F-ring-shepherding moons whose unpredictable orbits both fascinate scientists and wreak havoc on the F ring. Prometheus (102 kilometers, or 63 miles across) is visible left of center in the image, inside the F ring. Pandora (84 kilometers, or 52 miles across) appears above center, outside the ring. The dark shadow cast by the planet stretches more than halfway across the A ring, the outermost main ring. The mottled pattern appearing in the dark regions of the image is 'noise' in the signal recorded by the camera system, which has subsequently been magnified by the image processing. The F ring is a narrow, ribbon-like structure, with a width seen in this geometry equivalent to a few kilometers. The two small, irregularly shaped moons exert a gravitational influence on particles that make up the F ring, confining it and possibly leading to the formation of clumps, strands and other structures observed there. Pandora prevents the F ring from spreading outward and Prometheus prevents it from spreading inward. However, their interaction with the ring is complex and not fully understood. The shepherds are also known to be responsible for many of the observed structures in Saturn's A ring. The moons, which were discovered in images returned by the Voyager 1 spacecraft in 1980, are in chaotic orbits--their orbits can change unpredictably when the moons get very close to each other. This strange behavior was first noticed in ground-based and Hubble Space Telescope observations in 1995, when the rings were seen nearly edge-on from Earth and the usual glare of the rings was reduced, making the satellites more readily visible than usual. The positions of both satellites at that time were different than expected based on Voyager data. One of the goals for the Cassini-Huygens mission is to derive more precise orbits for Prometheus and Pandora. Seeing how their orbits change over the duration of the mission will help to determine their masses, which in turn will help constrain models of their interiors and provide a more complete understanding of their effect on the rings. This narrow angle camera image was snapped through the broadband green spectral filter, centered at 568 nanometers, on March 10, 2004, when the spacecraft was 55.5 million kilometers (34.5 million miles) from the planet. Image scale is approximately 333 kilometers (207 miles) per pixel. Contrast has been greatly enhanced, and the image has been magnified to aid visibility of the moons as well as structure in the rings. http://photojournal.jpl.nasa.gov/catalog/PIA05387
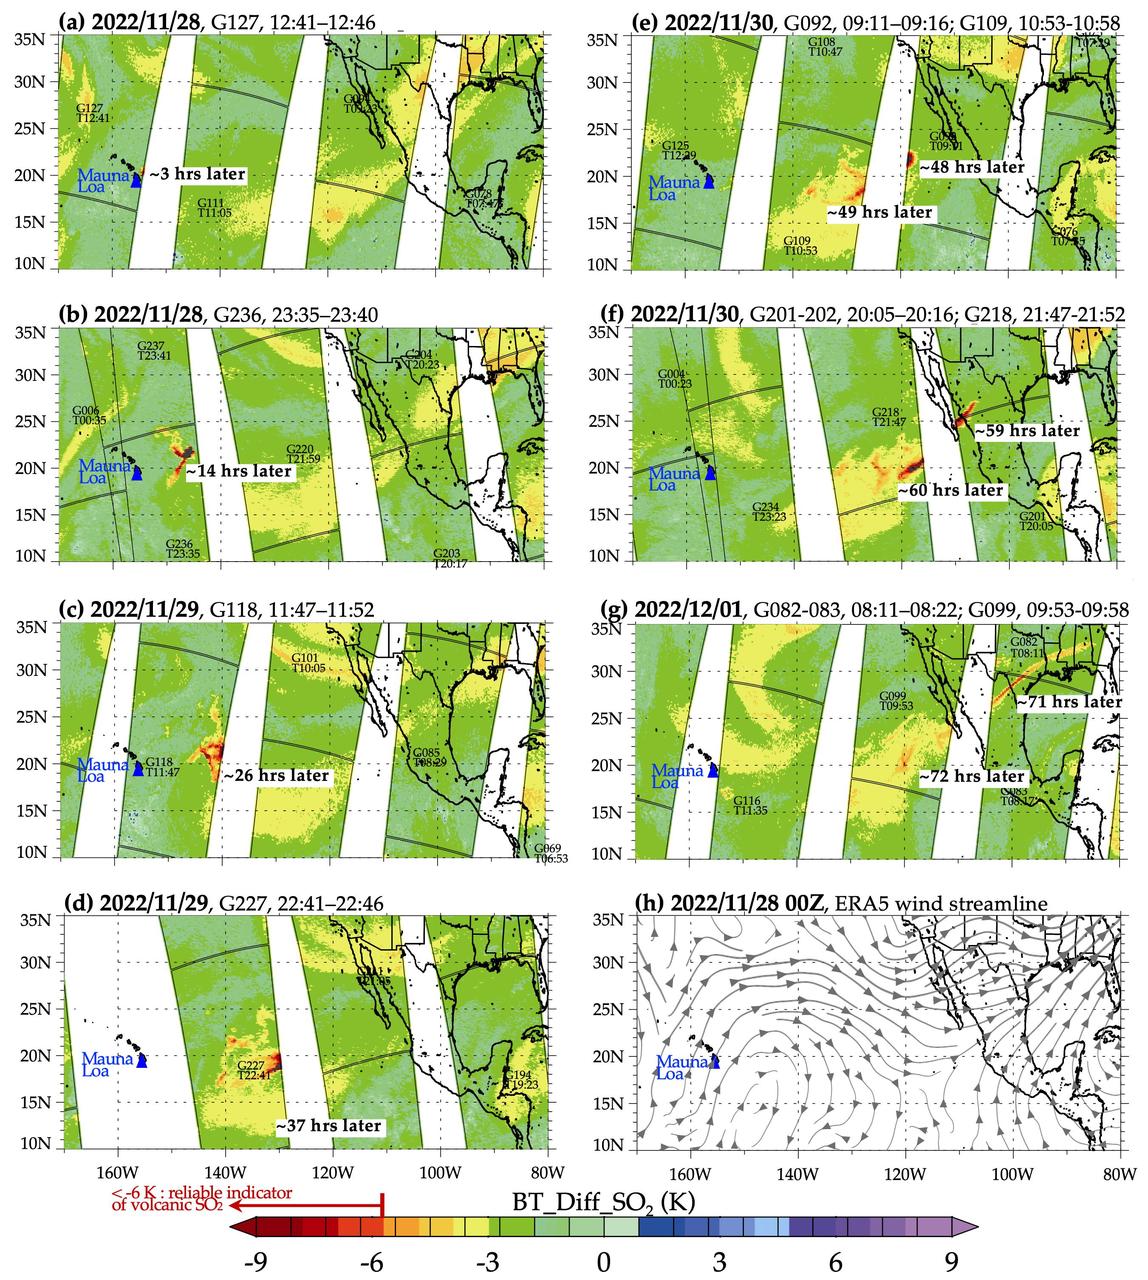
The Atmospheric Infrared Sounder (AIRS) instrument aboard NASA's Aqua satellite detected volcanic sulfur dioxide (SO₂) plumes emanating from Hawaii's Mauna Loa volcano, which started erupting late Sunday, Nov. 27, 2022, at 11:30 p.m. Hawaiian Standard Time (9:30 a.m. UTC, Nov. 28). The AIRS images shown here were taken from seven overpasses, capturing the SO₂ volcanic plumes and its pathways since the eruption. Starting from the upper left frame — captured at 2:41 a.m. HST (12:41 UTC) on Nov. 28, around three hours after the eruption began — a red patch that represents an SO₂ plume can be seen east of the volcano, which is shown as a blue triangle, then moving east and diffusing through subsequent frames. By 71 hours after the eruption, the eastern part of the plume is over the southeastern United States. SO₂ can be harmful to the human respiratory system when inhaled. In the atmosphere, it can also lead to the formation of other gaseous sulfur oxides (SOₓ). These substances can react with other chemicals to form particulate-matter pollution, which can cause breathing problems, contribute to acid rain, and reduce sky visibility. AIRS measures the amount of radiation reaching the instrument from the top of the atmosphere at more than 2,000 different wavelengths. Brightness temperature (BT) is a measure of the amount of radiation, and the images show the difference between BT observed at two different wavelengths. One of the wavelengths is sensitive to atmospheric SO₂, and the other is not, so the difference between the two measurements can give a reliable signal of volcanic SO₂ plumes. A fully automated volcanic plume detection rapid response system that uses AIRS data has been developed at the Jet Propulsion Laboratory in Southern California. This tool is available at the AIRS Rapid Response website, where detections of the most recent volcanic SO₂, dust, and clouds, in visible and infrared images, are updated in near real-time when a volcanic event anywhere on Earth triggers the system. AIRS historical detections of volcanic SO₂ and dust are archived on the site at https://airs.jpl.nasa.gov/volcanic_plumes/. AIRS, in conjunction with the Advanced Microwave Sounding Unit (AMSU), senses emitted infrared and microwave radiation from Earth to provide a three-dimensional look at the planet's weather and climate. Working in tandem, the two instruments make simultaneous observations down to Earth's surface. With more than 2,000 channels sensing different regions of the atmosphere, the system creates a global map of atmospheric temperature and humidity, cloud amounts and heights, greenhouse gas concentrations, and many other atmospheric phenomena. Launched into Earth orbit in 2002 aboard NASA's Aqua spacecraft, the AIRS and AMSU instruments are managed by JPL, under contract to NASA. JPL is a division of Caltech. https://photojournal.jpl.nasa.gov/catalog/PIA25562
![These six infrared images of Saturn's moon Titan represent some of the clearest, most seamless-looking global views of the icy moon's surface produced so far. The views were created using 13 years of data acquired by the Visual and Infrared Mapping Spectrometer (VIMS) instrument on board NASA's Cassini spacecraft. The images are the result of a focused effort to smoothly combine data from the multitude of different observations VIMS made under a wide variety of lighting and viewing conditions over the course of Cassini's mission. Previous VIMS maps of Titan (for example, PIA02145) display great variation in imaging resolution and lighting conditions, resulting in obvious seams between different areas of the surface. With the seams now gone, this new collection of images is by far the best representation of how the globe of Titan might appear to the casual observer if it weren't for the moon's hazy atmosphere, and it likely will not be superseded for some time to come. Observing the surface of Titan in the visible region of the spectrum is difficult, due to the globe enshrouding haze that envelops the moon. This is primarily because small particles called aerosols in Titan's upper atmosphere strongly scatter visible light. But Titan's surface can be more readily imaged in a few infrared "windows" -- infrared wavelengths where scattering and absorption is much weaker. This is where the VIMS instrument excelled, parting the haze to obtain clear images of Titan's surface. (For comparison, Figure 1 shows Titan as it appears in visible light, as does PIA11603.) Making mosaics of VIMS images of Titan has always been a challenge because the data were obtained over many different flybys with different observing geometries and atmospheric conditions. One result is that very prominent seams appear in the mosaics that are quite difficult for imaging scientists to remove. But, through laborious and detailed analyses of the data, along with time consuming hand processing of the mosaics, the seams have been mostly removed. This is an update to the work previously discussed in PIA20022. Any full color image is comprised of three color channels: red, green and blue. Each of the three color channels combined to create these views was produced using a ratio between the brightness of Titan's surface at two different wavelengths (1.59/1.27 microns [red], 2.03/1.27 microns [green] and 1.27/1.08 microns [blue]). This technique (called a "band-ratio" technique) reduces the prominence of seams, as well as emphasizing subtle spectral variations in the materials on Titan's surface. For example, the moon's equatorial dune fields appear a consistent brown color here. There are also bluish and purplish areas that may have different compositions from the other bright areas, and may be enriched in water ice. For a map of Titan with latitudes, longitudes and labeled surface features, see PIA20713. It is quite clear from this unique set of images that Titan has a complex surface, sporting myriad geologic features and compositional units. The VIMS instrument has paved the way for future infrared instruments that could image Titan at much higher resolution, revealing features that were not detectable by any of Cassini's instruments. https://photojournal.jpl.nasa.gov/catalog/PIA21923](https://images-assets.nasa.gov/image/PIA21923/PIA21923~medium.jpg)
These six infrared images of Saturn's moon Titan represent some of the clearest, most seamless-looking global views of the icy moon's surface produced so far. The views were created using 13 years of data acquired by the Visual and Infrared Mapping Spectrometer (VIMS) instrument on board NASA's Cassini spacecraft. The images are the result of a focused effort to smoothly combine data from the multitude of different observations VIMS made under a wide variety of lighting and viewing conditions over the course of Cassini's mission. Previous VIMS maps of Titan (for example, PIA02145) display great variation in imaging resolution and lighting conditions, resulting in obvious seams between different areas of the surface. With the seams now gone, this new collection of images is by far the best representation of how the globe of Titan might appear to the casual observer if it weren't for the moon's hazy atmosphere, and it likely will not be superseded for some time to come. Observing the surface of Titan in the visible region of the spectrum is difficult, due to the globe enshrouding haze that envelops the moon. This is primarily because small particles called aerosols in Titan's upper atmosphere strongly scatter visible light. But Titan's surface can be more readily imaged in a few infrared "windows" -- infrared wavelengths where scattering and absorption is much weaker. This is where the VIMS instrument excelled, parting the haze to obtain clear images of Titan's surface. (For comparison, Figure 1 shows Titan as it appears in visible light, as does PIA11603.) Making mosaics of VIMS images of Titan has always been a challenge because the data were obtained over many different flybys with different observing geometries and atmospheric conditions. One result is that very prominent seams appear in the mosaics that are quite difficult for imaging scientists to remove. But, through laborious and detailed analyses of the data, along with time consuming hand processing of the mosaics, the seams have been mostly removed. This is an update to the work previously discussed in PIA20022. Any full color image is comprised of three color channels: red, green and blue. Each of the three color channels combined to create these views was produced using a ratio between the brightness of Titan's surface at two different wavelengths (1.59/1.27 microns [red], 2.03/1.27 microns [green] and 1.27/1.08 microns [blue]). This technique (called a "band-ratio" technique) reduces the prominence of seams, as well as emphasizing subtle spectral variations in the materials on Titan's surface. For example, the moon's equatorial dune fields appear a consistent brown color here. There are also bluish and purplish areas that may have different compositions from the other bright areas, and may be enriched in water ice. For a map of Titan with latitudes, longitudes and labeled surface features, see PIA20713. It is quite clear from this unique set of images that Titan has a complex surface, sporting myriad geologic features and compositional units. The VIMS instrument has paved the way for future infrared instruments that could image Titan at much higher resolution, revealing features that were not detectable by any of Cassini's instruments. https://photojournal.jpl.nasa.gov/catalog/PIA21923

The THEMIS VIS camera contains 5 filters. The data from different filters can be combined in multiple ways to create a false color image. These false color images may reveal subtle variations of the surface not easily identified in a single band image. Today's false color image shows part of Argentea Planum. The edge of the south polar cap is visible at the bottom of the image. The THEMIS VIS camera is capable of capturing color images of the Martian surface using five different color filters. In this mode of operation, the spatial resolution and coverage of the image must be reduced to accommodate the additional data volume produced from using multiple filters. To make a color image, three of the five filter images (each in grayscale) are selected. Each is contrast enhanced and then converted to a red, green, or blue intensity image. These three images are then combined to produce a full color, single image. Because the THEMIS color filters don't span the full range of colors seen by the human eye, a color THEMIS image does not represent true color. Also, because each single-filter image is contrast enhanced before inclusion in the three-color image, the apparent color variation of the scene is exaggerated. Nevertheless, the color variation that does appear is representative of some change in color, however subtle, in the actual scene. Note that the long edges of THEMIS color images typically contain color artifacts that do not represent surface variation. Orbit Number: 85035 Latitude: -82.5422 Longitude: 335.069 Instrument: VIS Captured: 2021-02-14 01:40 https://photojournal.jpl.nasa.gov/catalog/PIA25051
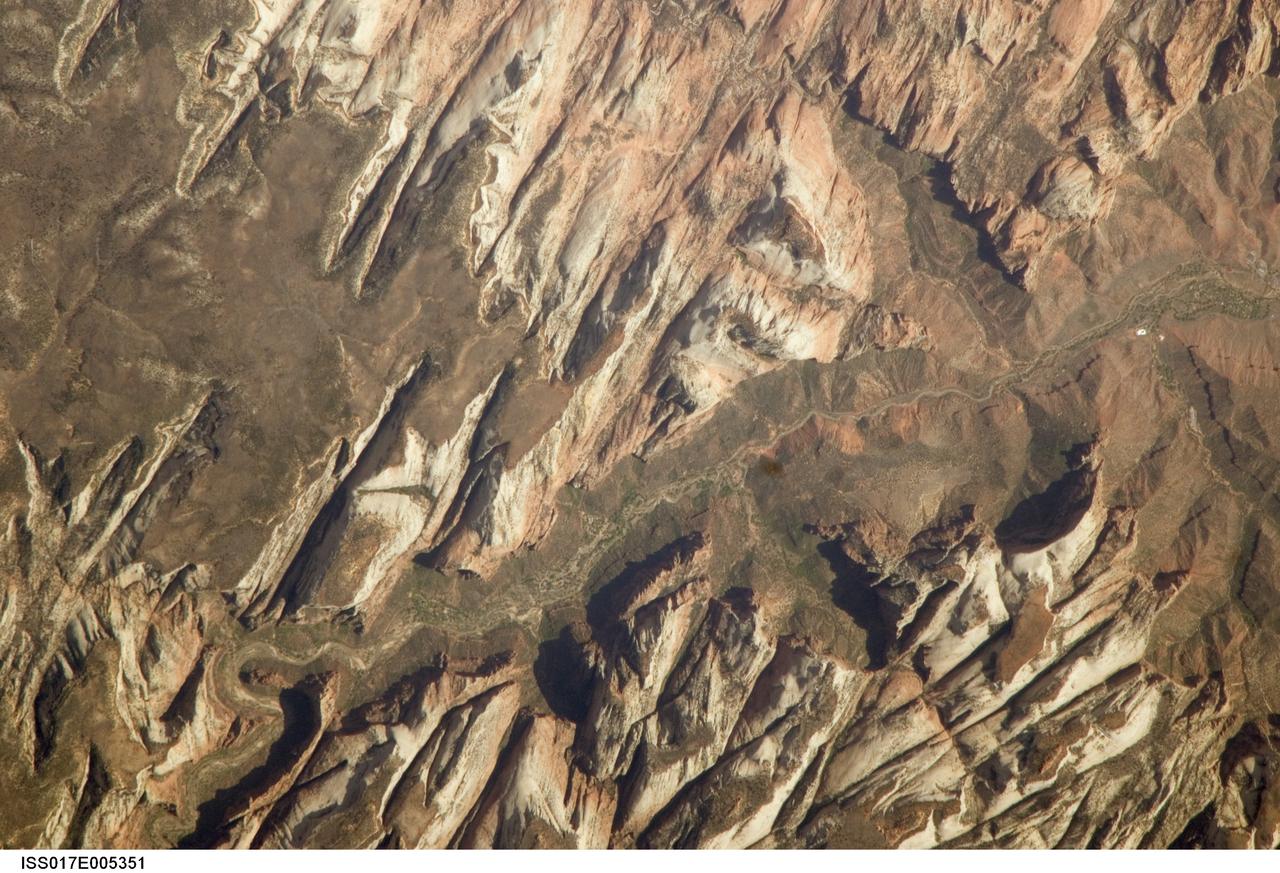
ISS017-E-005351 (26 April 2008) --- Zion National Park, Utah is featured in this image photographed by an Expedition 17 crewmember on the International Space Station. Zion National Park is located in southwestern Utah, along the western margin of the Colorado Plateau. The park was established in 1919, after roadway improvements in southwestern Utah allowed access to the preceding Mukuntuweap National Monument (1909) located in Zion Canyon. The towering cliffs bounding the North Fork of the Virgin River are formed mainly of tan to light pink Navajo Sandstone, the lithified remnants of an extensive sand dune sea that covered the area during the early Mesozoic Era, nearly 200 million years ago, according to scientists. The Zion region would have looked much like the present-day Sahara desert at this time in its geologic history. Brown rock capping the Navajo Sandstone (right) is comprised of younger beds that record changing environmental conditions that fluctuated between shallow seas and deserts. This high resolution image illustrates the incised nature of the bedrock forming the park. The long linear features are joints -- fractures in the rock mass -- formed in response to tectonic stresses that affected the region during its geologic history. The mainly north-northwest trending joints serve to channelize water runoff and are thought to be the main factor that determined the present canyon network. While the park is perhaps best experienced by hiking, backpacking, or biking, Utah State Route 9 provides automobile access up the side of Zion Canyon. The road is visible in this view as a thin brown line climbing the south wall of the canyon (lower left). Access to the rest of the park is provided by a shuttle bus system instituted in 2000 to reduce vehicle noise, improve air quality, and improve wildlife habitat.
ISS010-E-13807 (18 January 2005) --- Shenyang, China is featured in this image photographed by an Expedition 10 crewmember on the International Space Station (ISS). The city of Shenyang is China’s sixth largest city with a population of over 4 million residents in the urban core. The city is the major industrial, commercial, and cultural center of northeast China (the region historically known as Manchuria). Its geographic location on the floodplains of the Hun and Liao Rivers ensured an early agrarian economy that was later replaced by industrialization and natural resource extraction. Shenyang was first settled as a Mongol trading center in the 10th century, and served as the capitol of the Manchu government from the 17th through 20th centuries. Currently the city serves as the capital of Liaoning Province. Snow cover provides a clear contrast between urbanized (dark grey, center of image) and rural regions (white to light grey). The major portion of the local economy is devoted to industries such as metal smelting, coal mining, and petrochemical processing. Several southeast-trending plumes from industrial facilities are visible in the image. According to NASA scientists studying the Expedition 10 imagery, the high density of industrial land use in the Shenyang metropolitan area has lead to significant air, water, and soil pollution in the region. Recently, several initiatives to reduce pollution levels and establish environmentally-sound development guidelines have begun with support from local government and the United Nations.
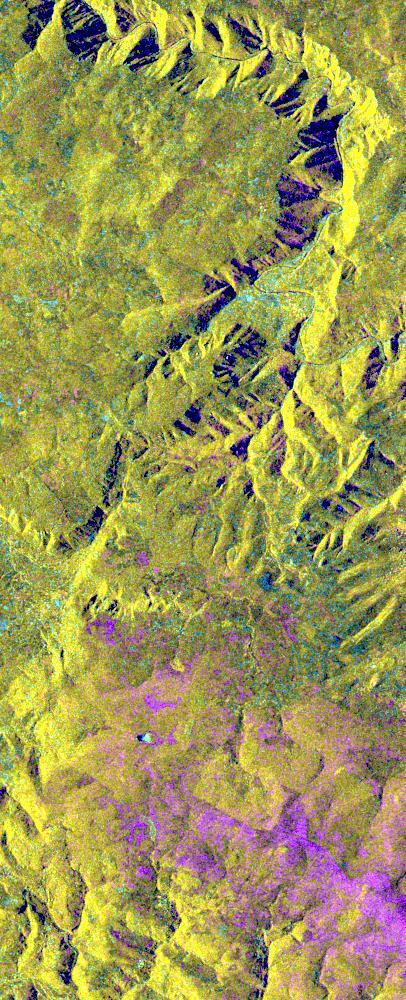
This is an X-band seasonal image of the central part of Lozere Departement situated south of the Massif Central in France. The image is 10 kilometers by 25 kilometers (6 miles by 15.5 miles) and is centered at approximately 44.3 degrees north latitude and 3 degrees east longitude. This image was acquired by the Spaceborne Imaging Radar-C/X-band Synthetic Aperture Radar aboard the space shuttle Endeavour on April 15, 1994 and on October 6, 1994. The image channels have the following color assignments: red was acquired in April; green was acquired in October; and blue is the ratio of the two data sets combined. Seasonal differences in the vegetation are visible in pink, which are heaths growing in the spring. This research area features two large limestone plateaus cut by the famous Gorges du Tarn, standing in parallel with the granite mountain range known as the Cevennes Mountains nearby. Land-use consists mainly of grasslands, heaths and forests. Forest types seen in the images are Austrian pines,Scots pines, spruce, fir and beech trees. Most forests were planted at the end of the 19th century through a national reforestation program aimed at reducing the strong erosion risks in these areas. This program was so successful that today the forests are exploited for forest pulpwood and sawlogs, but also remain protected as conservation regions. The study being performed in this area will assess the potential of spaceborne radar remote sensing for temperate forest type mapping and forest resource monitoring. The combination of X-band SAR data with lower frequency data (such as the SIR-C L-band data) allows scientists to distinguish forest tree species and biomass, or areas of ground vegetation. The lessons learned from the radar images of these controlled forest regions can be applied to larger areas and naturally grown forests to help ecologists protect and maintain them. The SIR-C/X-SAR images will be investigated by scientists from the remote sensing laboratory Cemagref in Montpellier and the National Forestry Board in Mende, France. http://photojournal.jpl.nasa.gov/catalog/PIA01755
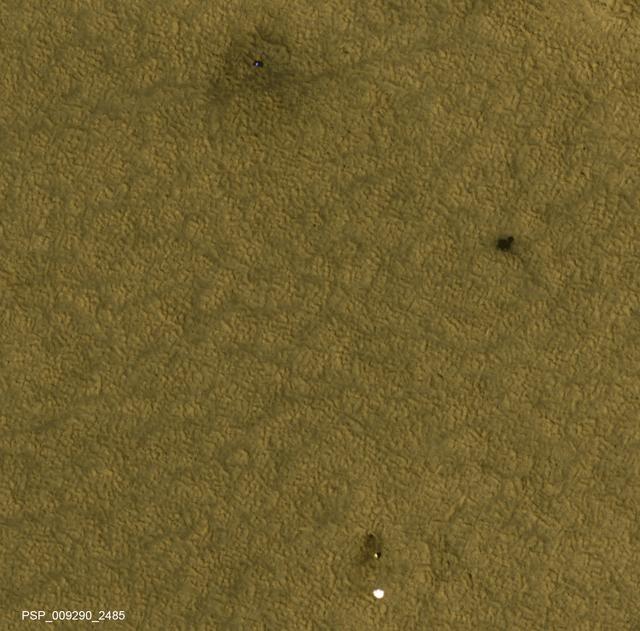
This is one of two images taken nearly a decade apart of NASA's Mars Phoenix Lander and related hardware around the mission's May 25, 2008, landing site on far-northern Mars. By late 2017, dust had obscured much of what was visible two months after the landing. Both images were taken by the High Resolution Imaging Science Experiment (HiRISE) camera on NASA's Mars Reconnaissance Orbiter. The one with three patches of darker ground -- where landing events removed dust -- was taken on July 20, 2008. It is Fig. 1, an excerpt of HiRISE observation PSP_009290_2485. The one with a more even coating of pale dust throughout the area was taken on Dec. 21, 2017. It is Fig. 2, an excerpt of HiRISE observation ESP_053451_2485. Both cover an area roughly 300 meters wide at 68 degrees north latitude, 234 degrees east longitude, and the two are closely matched in viewing and illumination geometry, from about five Martian years apart in northern hemisphere summers. An animation comparing the two images shows a number of changes between mid-2008 and late 2017. The lander (top) appears darker, and is now covered by dust. The dark spot created by the heat shield impact (right) is brighter, again due to dust deposition. The back shell and parachute (bottom) shows a darker parachute and brighter area of impact disturbance, thanks again to deposits of dust. We also see that the parachute has shifted in the wind, moving to the east. In August 2008, Phoenix completed its three-month mission studying Martian ice, soil and atmosphere. The lander worked for two additional months before reduced sunlight caused energy to become insufficient to keep the lander functioning. The solar-powered robot was not designed to survive through the dark and cold conditions of a Martian arctic winter. An animation and both images are available at https://photojournal.jpl.nasa.gov/catalog/PIA22223
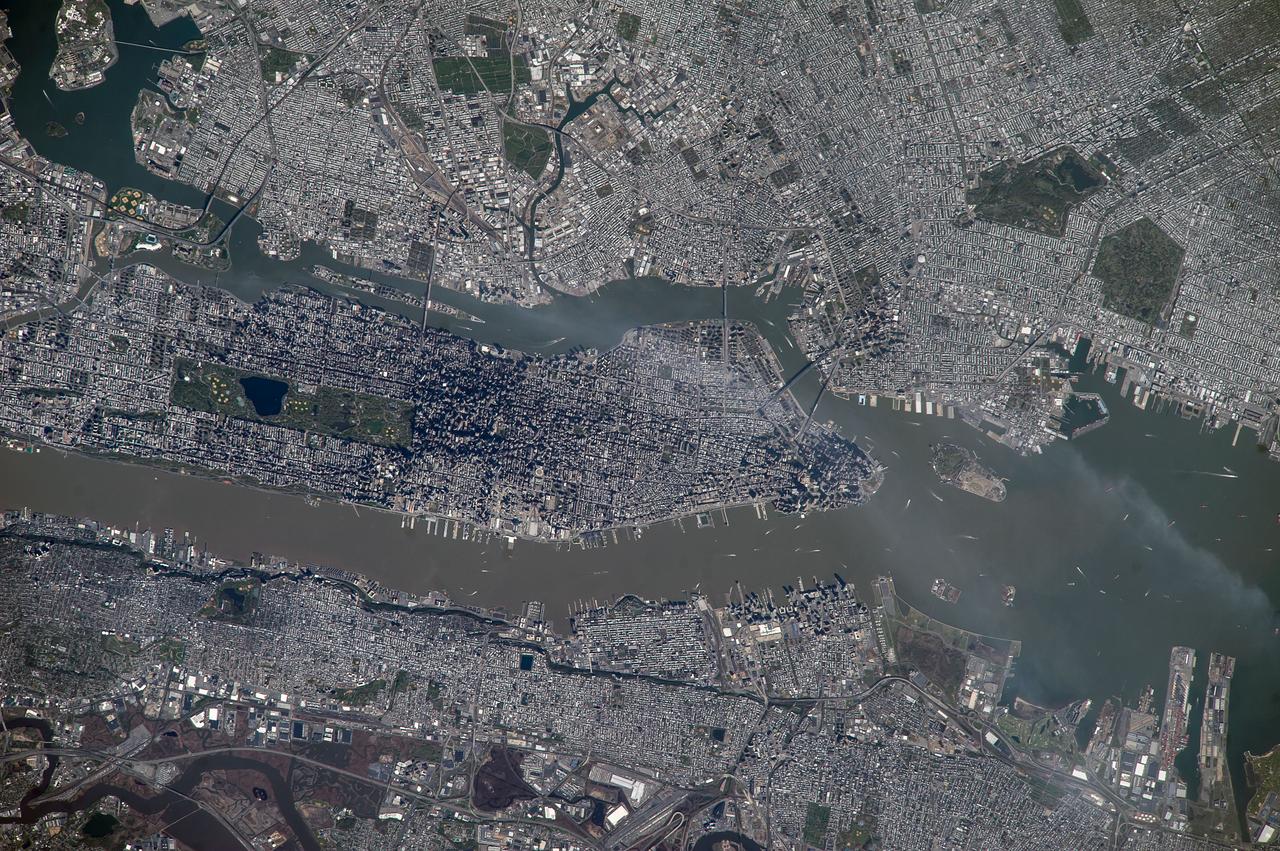
ISS039-E-018541 (5 May 2014) --- New York City is featured in this image photographed by an Expedition 39 crew member on the International Space Station. This detailed image reveals the narrow shape of Manhattan located between the Hudson River and the East River, a feature familiar to crews on the space station. The ragged line of shadow cast by the Palisades cliff crosses the bottom of the image. Wharves jut into the rivers; bridges are visible mainly because of the shadows they cast, and the grid pattern of major roads stands out. On the island of Manhattan itself the main visual features are Central Park (with playing fields as white dots) and two darker zones where the tallest buildings in Midtown East and the Financial District cast strong shadows, even in this early afternoon view. Rivers and parks reduce the effect of the urban heat island – the local zone of higher surface and atmospheric temperatures generated by storage and later release of heat by city materials such as concrete and tarmac. Rivers provide pathways for wind and the cooling effect of parks is detectable by instruments on spacecraft that can measure the temperature of the ground surface. Tall buildings have a more complex effect. Shadowed zones in the "urban canyons" between tall buildings – as shown in this image – receive fewer hours of direct sun per day. But where the sun can reach canyon floors, the sun's energy is reflected back up at the walls of the buildings where it is absorbed and later released as heat. This is especially the case at night when urban canyons retain more heat than those sections of the city with shorter buildings.
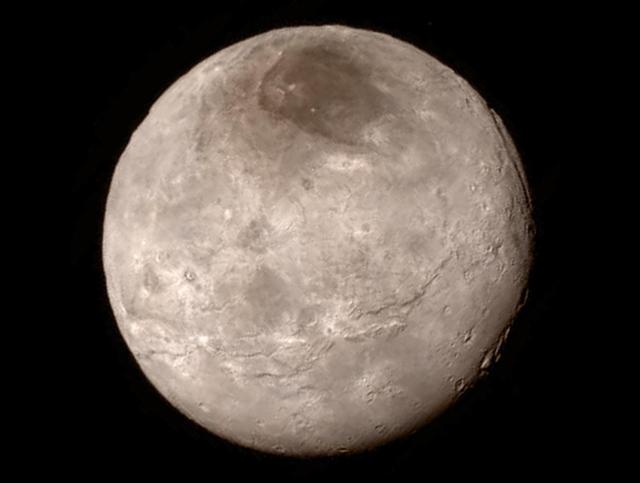
Remarkable new details of Pluto's largest moon Charon are revealed in this image from New Horizons' Long Range Reconnaissance Imager (LORRI), taken late on July 13, 2015 from a distance of 289,000 miles (466,000 kilometers). A swath of cliffs and troughs stretches about 600 miles (1,000 kilometers) from left to right, suggesting widespread fracturing of Charon's crust, likely a result of internal processes. At upper right, along the moon's curving edge, is a canyon estimated to be 4 to 6 miles (7 to 9 kilometers) deep. Mission scientists are surprised by the apparent lack of craters on Charon. South of the moon's equator, at the bottom of this image, terrain is lit by the slanting rays of the sun, creating shadows that make it easier to distinguish topography. Even here, however, relatively few craters are visible, indicating a relatively young surface that has been reshaped by geologic activity. In Charon's north polar region, a dark marking prominent in New Horizons' approach images is now seen to have a diffuse boundary, suggesting it is a thin deposit of dark material. Underlying it is a distinct, sharply bounded, angular feature; higher resolution images still to come are expected to shed more light on this enigmatic region. The image has been compressed to reduce its file size for transmission to Earth. In high-contrast areas of the image, features as small as 3 miles (5 kilometers) across can be seen. Some lower-contrast detail is obscured by the compression of the image, which may make some areas appear smoother than they really are. The uncompressed version still resides in New Horizons' computer memory and is scheduled to be transmitted at a later date. The image has been combined with color information obtained by New Horizons' Ralph instrument on July 13. New Horizons traveled more than three billion miles over nine-and-a-half years to reach the Pluto system. http://photojournal.jpl.nasa.gov/catalog/PIA19709
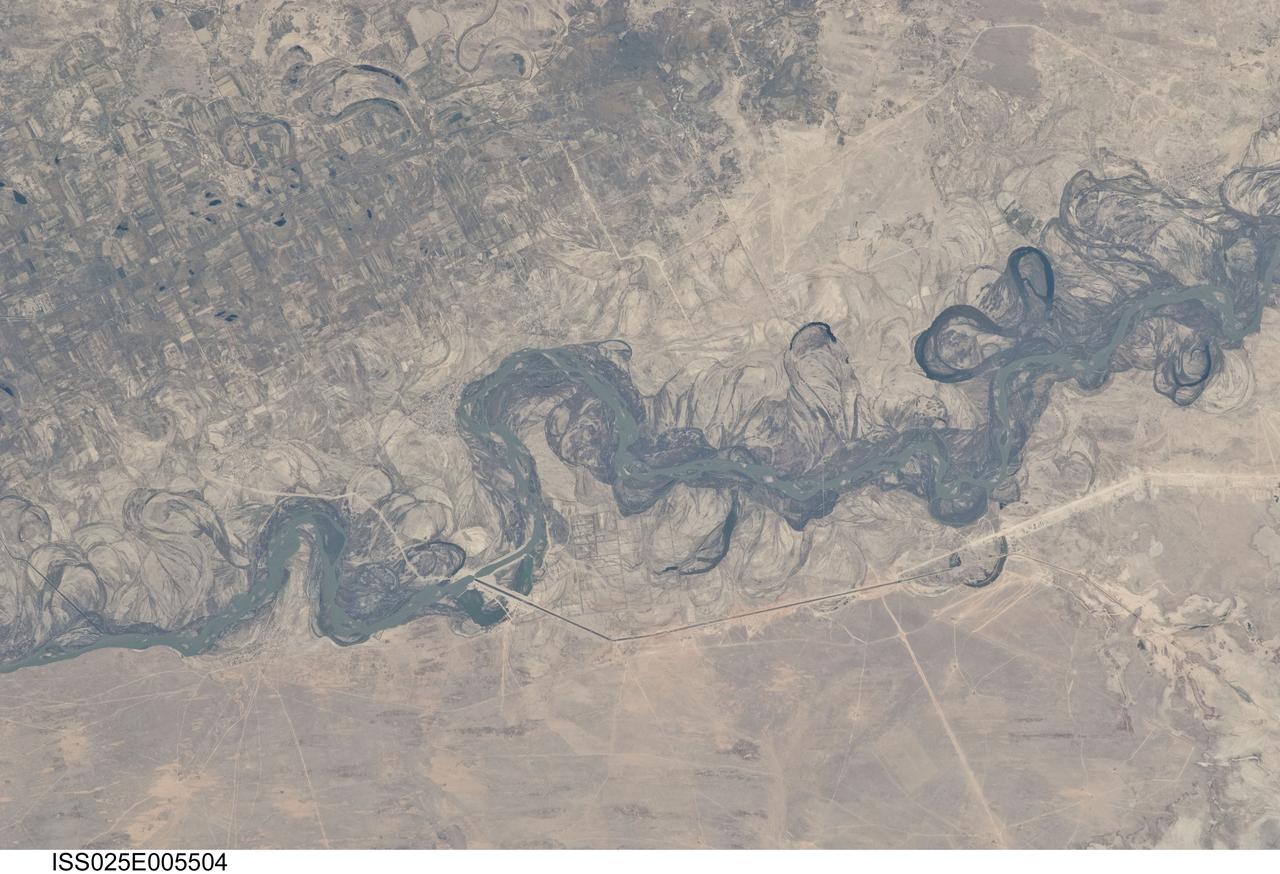
ISS025-E-005504 (30 Sept. 2010) --- Syr Dar’ya River floodplain in Kazakhstan, central Asia is featured in this image photographed by an Expedition 25 crew member on the International Space Station. Central Asia’s most important cotton-growing region is concentrated in the floodplain of the Syr Dar’ya, and is irrigated by water from the river. The floodplain is shown here as a tangle of twisting meanders and loops (center). The darkest areas are brushy vegetation along the present course (filled with blue-green water); wisps of vegetation are also visible along flanking swampy depressions, or sloughs. An older floodplain appears as an area of more diffuse dark vegetation (upper left), where a pattern of relict meander bends is overlain by a rectangular pattern of cotton fields. The straight channel of a new diversion canal—one of sixteen from this point downstream—can be seen along the east bank of the river. The older floodplain area is fed from the Chardara Reservoir immediately upstream (not shown). Half the river flow is controlled from reservoirs, and half from direct water take-off from canals. By contrast with the intensive agricultural use of water shown here, upstream water control in the mountain valleys is oriented more toward power generation. The river flows for a total distance of 2,200 kilometers from the Tien Shan Mountains westward and northwestward to the Aral Sea—the dying waterbody at the low point of the basin far to the northwest. Withdrawals of water from the river for agriculture have continued for many decades. Although the Syr Dar’ya is the second largest river flowing into the sea, its discharge is not very large. As such, it has been easily depleted, with none of its water today reaching the Aral Sea. Control of the river is vested in the Syr Dar’ya Basin Water Organization run by nations with territory in the Syr Dar’ya basin. Some of the organization’s main efforts are accurate gauging of water use along the river course, and repair of canals to reduce widespread water loss by leakage.
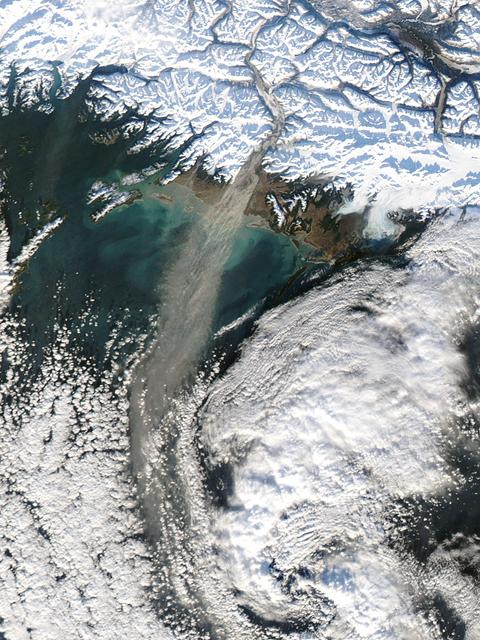
Dust storm in Alaska captured by Aqua/MODIS on Nov. 17, 2013 at 21:45 UTC. When glaciers grind against underlying bedrock, they produce a silty powder with grains finer than sand. Geologists call it “glacial flour” or “rock flour.” This iron- and feldspar-rich substance often finds its ways into rivers and lakes, coloring the water brown, grey, or aqua. When river or lake levels are low, the flour accumulates on drying riverbanks and deltas, leaving raw material for winds to lift into the air and create plumes of dust. Scientists are monitoring Arctic dust for a number of reasons. Dust storms can reduce visibility enough to disrupt air travel, and they can pose health hazards to people on the ground. Dust is also a key source of iron for phytoplankton in regional waters. Finally, there is the possibility that dust events are becoming more frequent and severe due to ongoing recession of glaciers in coastal Alaska. To read more about dust storm in this region go to: <a href="http://earthobservatory.nasa.gov/IOTD/view.php?id=79518" rel="nofollow">earthobservatory.nasa.gov/IOTD/view.php?id=79518</a> Credit: NASA/GSFC/Jeff Schmaltz/MODIS Land Rapid Response Team <b><a href="http://www.nasa.gov/audience/formedia/features/MP_Photo_Guidelines.html" rel="nofollow">NASA image use policy.</a></b> <b><a href="http://www.nasa.gov/centers/goddard/home/index.html" rel="nofollow">NASA Goddard Space Flight Center</a></b> enables NASA’s mission through four scientific endeavors: Earth Science, Heliophysics, Solar System Exploration, and Astrophysics. Goddard plays a leading role in NASA’s accomplishments by contributing compelling scientific knowledge to advance the Agency’s mission. <b>Follow us on <a href="http://twitter.com/NASA_GoddardPix" rel="nofollow">Twitter</a></b> <b>Like us on <a href="http://www.facebook.com/pages/Greenbelt-MD/NASA-Goddard/395013845897?ref=tsd" rel="nofollow">Facebook</a></b> <b>Find us on <a href="http://instagram.com/nasagoddard?vm=grid" rel="nofollow">Instagram</a></b>

The THEMIS VIS camera contains 5 filters. The data from different filters can be combined in multiple ways to create a false color image. These false color images may reveal subtle variations of the surface not easily identified in a single band image. Today's false color image shows part of Angustus Labyrinthus. Angustus Labyrinthus is a unique region near the south polar cap. In the center of this image squares formed by intersecting ridges are visible. The feature earned the informal name of the Inca City when it was discovered in Mariner 9 images in 1972.The linear ridges are believed to have formed by volcanic and tectonic forces, where magma filled fractures in the subsurface and then erosion revealed the magmatic material. The THEMIS VIS camera is capable of capturing color images of the Martian surface using five different color filters. In this mode of operation, the spatial resolution and coverage of the image must be reduced to accommodate the additional data volume produced from using multiple filters. To make a color image, three of the five filter images (each in grayscale) are selected. Each is contrast enhanced and then converted to a red, green, or blue intensity image. These three images are then combined to produce a full color, single image. Because the THEMIS color filters don't span the full range of colors seen by the human eye, a color THEMIS image does not represent true color. Also, because each single-filter image is contrast enhanced before inclusion in the three-color image, the apparent color variation of the scene is exaggerated. Nevertheless, the color variation that does appear is representative of some change in color, however subtle, in the actual scene. Note that the long edges of THEMIS color images typically contain color artifacts that do not represent surface variation. Orbit Number: 85024 Latitude: -81.1964 Longitude: 296.058 Instrument: VIS Captured: 2021-02-13 03:55 https://photojournal.jpl.nasa.gov/catalog/PIA25009
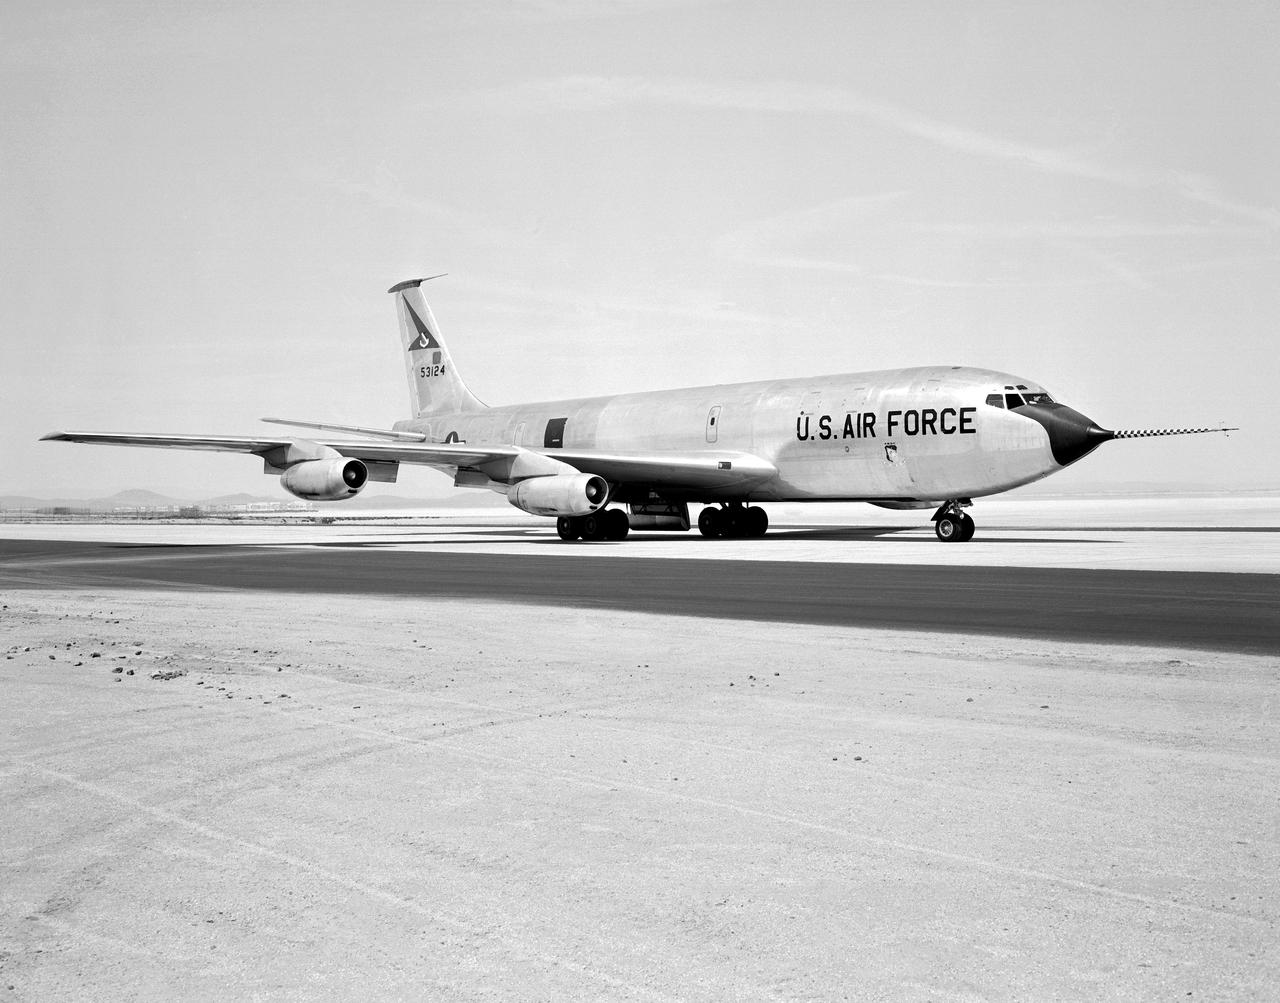
The Boeing KC-135 Stratotanker, besides being used extensively in its primary role as an inflight aircraft refueler, has assisted in several projects at the NASA Dryden Flight Research Center, Edwards, California. In 1957 and 1958, Dryden was asked by what was then the Civil Aeronautics Administration (later absorbed into the Federal Aviation Administration (FAA) in 1958) to help establish new approach procedure guidelines on cloud-ceiling and visibility minimums for Boeing's first jet airliner, the B-707. Dryden used a KC-135 (the military variant of the 707), seen here on the runway at Edwards Air Force Base, to aid the CAA in these tests. In 1979 and 1980, Dryden was again involved with general aviation research with the KC-135. This time, a special wingtip "winglet", developed by Richard Whitcomb of Langley Research Center, was tested on the jet aircraft. Winglets are small, nearly vertical fins installed on an airplane's wing tips to help produce a forward thrust in the vortices that typically swirl off the end of the wing, thereby reducing drag. This winglet idea was tested at the Dryden Flight Research Center on a KC-135A tanker loaned to NASA by the Air Force. The research showed that the winglets could increase an aircraft's range by as much as 7 percent at cruise speeds. The first application of NASA's winglet technology in industry was in general aviation business jets, but winglets are now being incorporated into most new commercial and military transport jets, including the Gulfstream III and IV business jets, the Boeing 747-400 and MD-11 airliners, and the C-17 military transport. In the 1980's, a KC-135 was used in support of the Space Shuttle program. Since the Shuttle was to be launched from Florida, researchers wanted to test the effect of rain on the sensitive thermal tiles. Tiles were mounted on special fixtures on an F-104 aircraft and a P-3 Orion. The F-104 was flown in actual rain conditions, and also behind the KC-135 spray tanker as it rel

The THEMIS VIS camera contains 5 filters. The data from different filters can be combined in multiple ways to create a false color image. These false color images may reveal subtle variations of the surface not easily identified in a single band image. Today's false color image shows part of Angustus Labyrinthus. Angustus Labyrinthus is a unique region near the south polar cap. In the center of this image squares formed by intersecting ridges are visible. The feature earned the informal name of the Inca City when it was discovered in Mariner 9 images in 1972.The linear ridges are believed to have formed by volcanic and tectonic forces, where magma filled fractures in the subsurface and then erosion revealed the magmatic material. The THEMIS VIS camera is capable of capturing color images of the Martian surface using five different color filters. In this mode of operation, the spatial resolution and coverage of the image must be reduced to accommodate the additional data volume produced from using multiple filters. To make a color image, three of the five filter images (each in grayscale) are selected. Each is contrast enhanced and then converted to a red, green, or blue intensity image. These three images are then combined to produce a full color, single image. Because the THEMIS color filters don't span the full range of colors seen by the human eye, a color THEMIS image does not represent true color. Also, because each single-filter image is contrast enhanced before inclusion in the three-color image, the apparent color variation of the scene is exaggerated. Nevertheless, the color variation that does appear is representative of some change in color, however subtle, in the actual scene. Note that the long edges of THEMIS color images typically contain color artifacts that do not represent surface variation. Orbit Number: 85049 Latitude: -81.1305 Longitude: 295.000 Instrument: VIS Captured: 2021-02-15 05:19 https://photojournal.jpl.nasa.gov/catalog/PIA25010
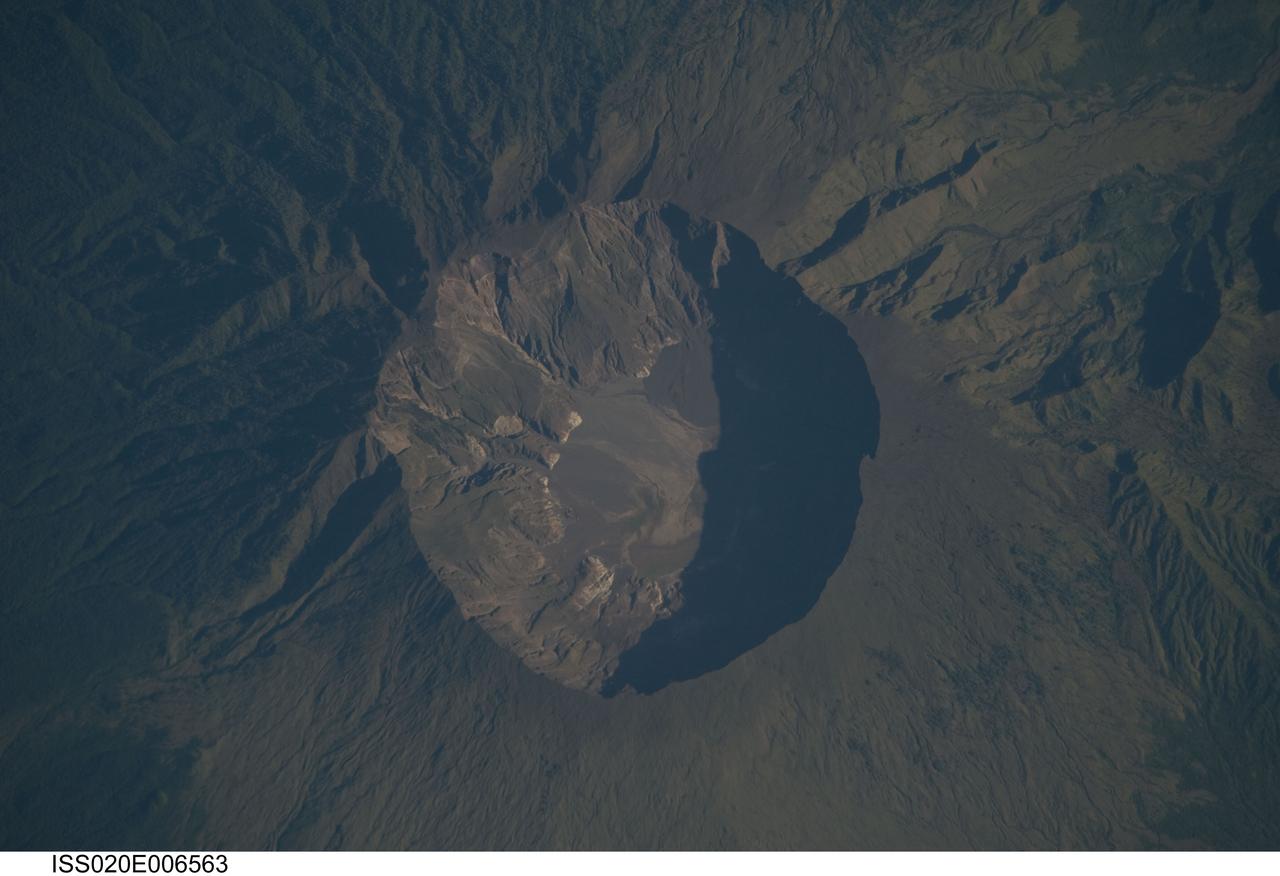
ISS020-E-006563 (3 June 2009) --- Mount Tambora Volcano, Sumbawa Island in Indonesia is featured in this image photographed by an Expedition 20 crew member on the International Space Station. On April 10, 1815 the Tambora volcano produced the largest eruption in history. An estimated 150 cubic kilometers of tephra ? exploded rock and ash ? was produced, with ash from the eruption recognized at least 1,300 kilometers away to the northwest. While the April 10 eruption was catastrophic, historical records and geological analysis of eruption deposits indicate that the volcano had been active between 1812 and 1815. Enough ash was input into the atmosphere from the April 10 eruption to reduce incident sunlight on Earth?s surface and cause global cooling, resulting in the 1816 ?year without a summer?. This detailed photograph depicts the summit caldera of the volcano. The huge caldera ? six kilometers in diameter and 1,100 meters deep ? formed when Tambora?s estimated 4,000 meter-high peak was removed, and the magma chamber below emptied, during the April 10 eruption. Today the crater floor is occupied by an ephemeral fresh-water lake, recent sedimentary deposits, and minor lava flows and domes emplaced during the 19th and 20th centuries. Layered tephra deposits are visible along the northwestern crater rim. Active fumaroles, or steam vents, are still present within the caldera. In 2004 scientists discovered the remains of a village and two adults buried under approximately three meters of ash in a gully on Tambora?s flank - remnants of the former Kingdom of Tambora preserved by the 1815 eruption that destroyed it. The similarity of the Tambora remains to those associated with the 79 AD eruption of Mount Vesuvius has led to the site being called ?the Pompeii of the East.?
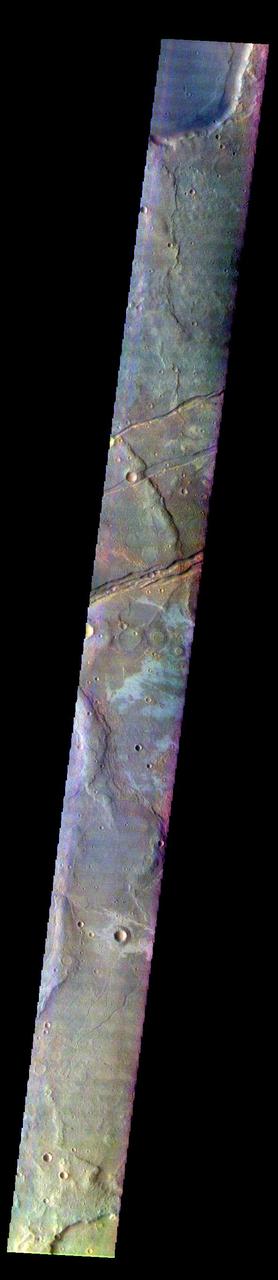
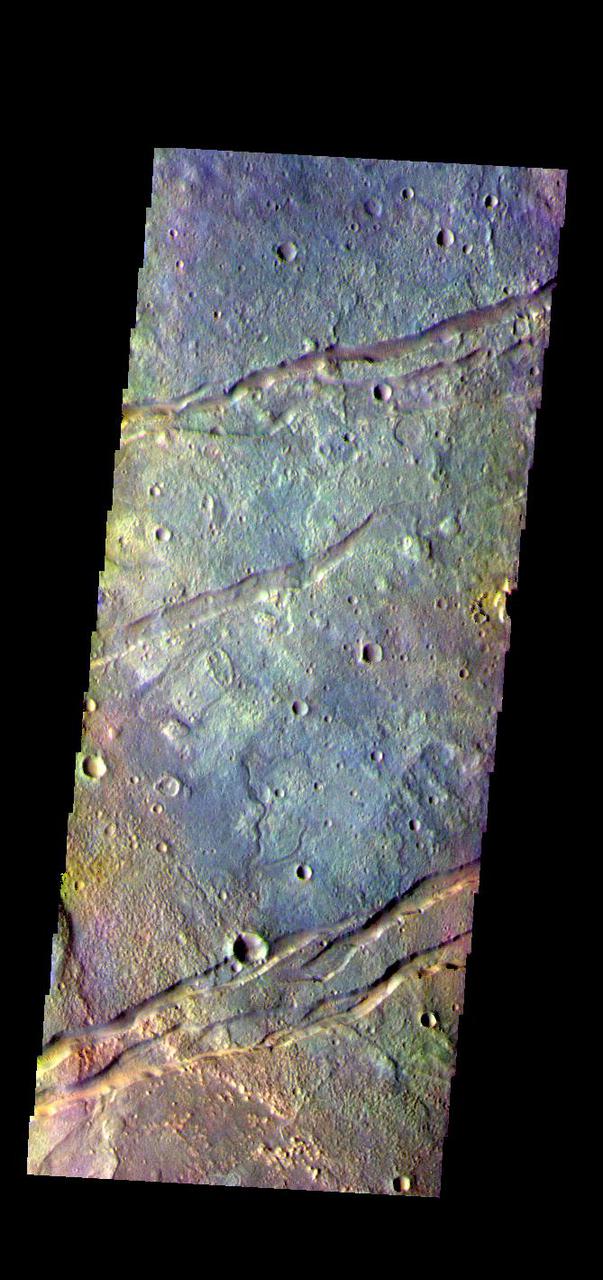
The THEMIS VIS camera contains 5 filters. The data from different filters can be combined in multiple ways to create a false color image. These false color images may reveal subtle variations of the surface not easily identified in a single band image. Today's false color image shows part of Sirenum Fossae. The linear depressions in this VIS image are tectonic graben. Graben are formed by extension of the crust and faulting. When large amounts of pressure or tension are applied to rocks on timescales that are fast enough that the rock cannot respond by deforming, the rock breaks along faults. In the case of a graben, two parallel faults are formed by extension of the crust and the rock in between the faults drops downward into the space created by the extension. Several graben are visible in this THEMIS VIS image, trending from north-northeast to south-southwest. Because the faults defining the graben are formed perpendicular to the direction of the applied stress, we know that extensional forces were pulling the crust apart in the west-northwest/east-southeast direction. The Sirenum Fossae graben are 2735km (1700 miles) long. The THEMIS VIS camera is capable of capturing color images of the Martian surface using five different color filters. In this mode of operation, the spatial resolution and coverage of the image must be reduced to accommodate the additional data volume produced from using multiple filters. To make a color image, three of the five filter images (each in grayscale) are selected. Each is contrast enhanced and then converted to a red, green, or blue intensity image. These three images are then combined to produce a full color, single image. Because the THEMIS color filters don't span the full range of colors seen by the human eye, a color THEMIS image does not represent true color. Also, because each single-filter image is contrast enhanced before inclusion in the three-color image, the apparent color variation of the scene is exaggerated. Nevertheless, the color variation that does appear is representative of some change in color, however subtle, in the actual scene. Note that the long edges of THEMIS color images typically contain color artifacts that do not represent surface variation. Orbit Number: 92540 Latitude: -32.6048 Longitude: 205.563 Instrument: VIS Captured: 2022-10-25 00:23 https://photojournal.jpl.nasa.gov/catalog/PIA26122
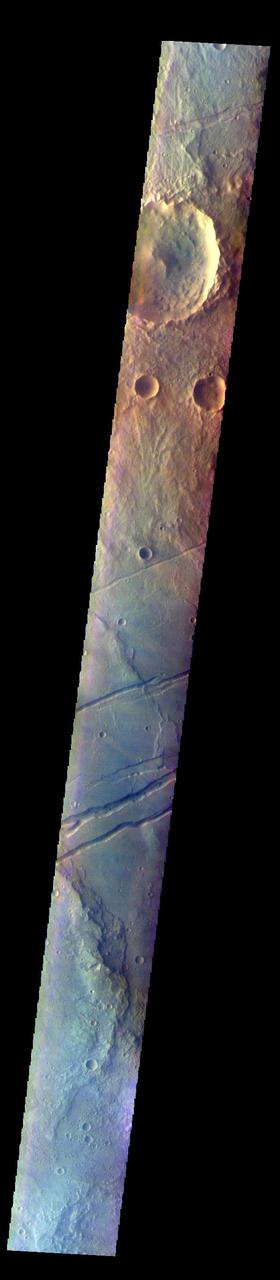
The THEMIS VIS camera contains 5 filters. The data from different filters can be combined in multiple ways to create a false color image. These false color images may reveal subtle variations of the surface not easily identified in a single band image. Today's false color image shows part of Sirenum Fossae. The linear depressions in this VIS image are tectonic graben. Graben are formed by extension of the crust and faulting. When large amounts of pressure or tension are applied to rocks on timescales that are fast enough that the rock cannot respond by deforming, the rock breaks along faults. In the case of a graben, two parallel faults are formed by extension of the crust and the rock in between the faults drops downward into the space created by the extension. Several graben are visible in this THEMIS VIS image, trending from north-northeast to south-southwest. Because the faults defining the graben are formed parallel to the direction of the applied stress, we know that extensional forces were pulling the crust apart in the west-northwest/east-southeast direction. The Sirenum Fossae graben are 2735km (1700 miles) long. The THEMIS VIS camera is capable of capturing color images of the Martian surface using five different color filters. In this mode of operation, the spatial resolution and coverage of the image must be reduced to accommodate the additional data volume produced from using multiple filters. To make a color image, three of the five filter images (each in grayscale) are selected. Each is contrast enhanced and then converted to a red, green, or blue intensity image. These three images are then combined to produce a full color, single image. Because the THEMIS color filters don't span the full range of colors seen by the human eye, a color THEMIS image does not represent true color. Also, because each single-filter image is contrast enhanced before inclusion in the three-color image, the apparent color variation of the scene is exaggerated. Nevertheless, the color variation that does appear is representative of some change in color, however subtle, in the actual scene. Note that the long edges of THEMIS color images typically contain color artifacts that do not represent surface variation. Orbit Number: 84903 Latitude: -30.8518 Longitude: 208.42 Instrument: VIS Captured: 2021-02-03 04:32 https://photojournal.jpl.nasa.gov/catalog/PIA25007
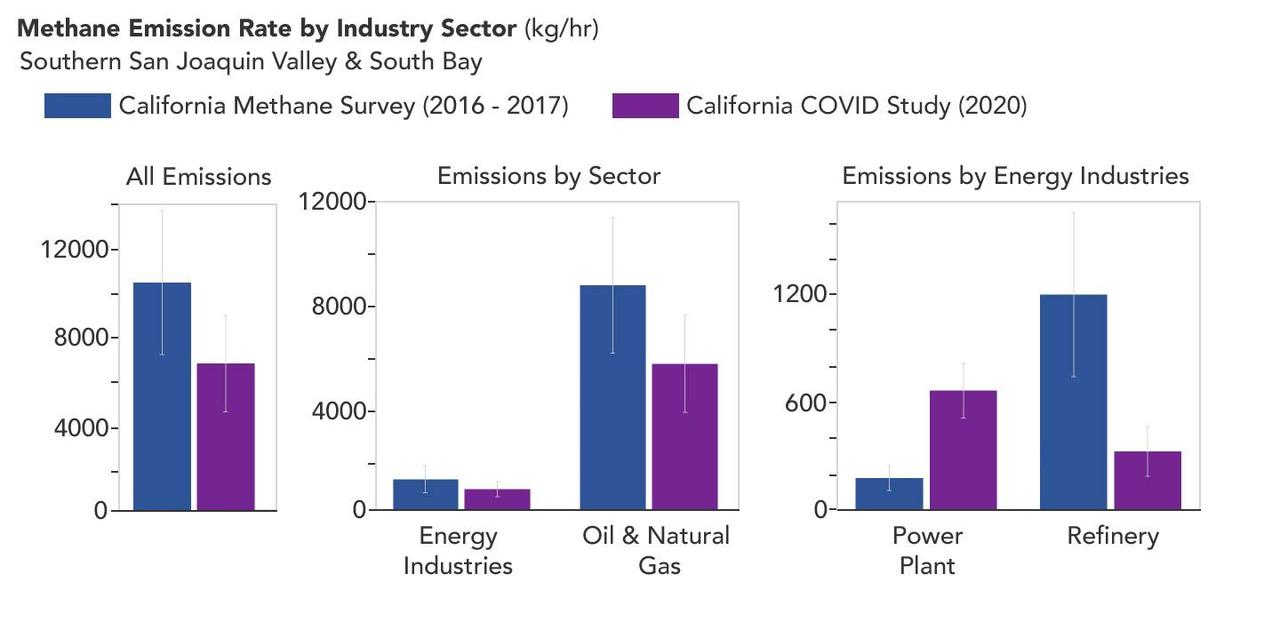
A March 2023 study by researchers at NASA's Jet Propulsion Laboratory in Southern California compared emissions from a belt of oil refineries across the South Bay area of Los Angeles during the first summer of the COVID-19 pandemic to those observed three years earlier. Using data from a NASA airborne instrument, researchers saw that most of the facilities they identified as methane sources in 2016-17 were no longer emitting the greenhouse gas in 2020, leading to a 73% reduction in measured emissions. The study uses measurements made by an imaging spectrometer called AVIRIS-NG (Airborne Visible/Infrared Imaging Spectrometer-Next Generation). Attached to the bottom of an aircraft, the instrument can detect greenhouse gas emissions from individual facilities or even pieces of equipment by looking at how the gases absorb sunlight. In 2016 and 2017, AVIRIS-NG was flown over 22,000 square miles (57,000 square kilometers) of the state as part of the California Methane Survey. From July to September 2020, researchers retraced some of those flight paths over refineries and power plants in Los Angeles County and over oil fields in central California's San Joaquin Valley. The flights were funded by NASA's Earth Science Division, the California Air Resources Board, and the California Energy Commission. The 2020 surveys over Los Angeles identified only 11 plumes from five refinery sources, with a total emissions rate of about 712 pounds (323 kilograms) methane per hour. The 2016 and 2017 flights had found 48 plumes from 33 sources, with a total emissions rate of roughly 2,639 pounds (1,197 kilograms) methane per hour. The drop correlates with an 18% decrease in monthly production in Southern California refineries between the two flight campaigns, the scientists noted, citing data from the California Energy Commission. The study also found that emissions from oil fields in and around the city of Bakersfield in central California fell 34.2%, correlating with a 24.2% drop in oil production. Reduced production during the pandemic due to lower demand for fuel and lower gas prices could have led to the drop in methane emissions, as oil fields and refineries emitted less methane as part of operations. However, researchers said, improved equipment maintenance and mitigation efforts at those facilities between 2016 and 2020 can't be ruled out as a factor. https://photojournal.jpl.nasa.gov/catalog/PIA25864
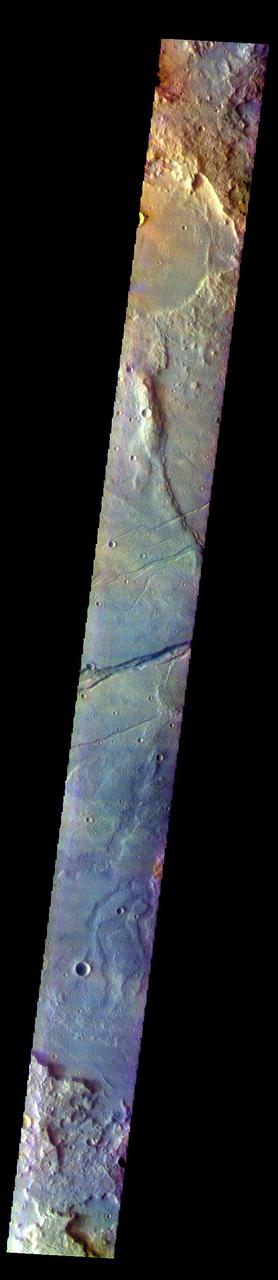
The THEMIS VIS camera contains 5 filters. The data from different filters can be combined in multiple ways to create a false color image. These false color images may reveal subtle variations of the surface not easily identified in a single band image. Today's false color image shows part of Sirenum Fossae. The linear depressions in this VIS image are tectonic graben. Graben are formed by extension of the crust and faulting. When large amounts of pressure or tension are applied to rocks on timescales that are fast enough that the rock cannot respond by deforming, the rock breaks along faults. In the case of a graben, two parallel faults are formed by extension of the crust and the rock in between the faults drops downward into the space created by the extension. Several graben are visible in this THEMIS VIS image, trending from north-northeast to south-southwest. Because the faults defining the graben are formed parallel to the direction of the applied stress, we know that extensional forces were pulling the crust apart in the west-northwest/east-southeast direction. The Sirenum Fossae graben are 2735km (1700 miles) long. The THEMIS VIS camera is capable of capturing color images of the Martian surface using five different color filters. In this mode of operation, the spatial resolution and coverage of the image must be reduced to accommodate the additional data volume produced from using multiple filters. To make a color image, three of the five filter images (each in grayscale) are selected. Each is contrast enhanced and then converted to a red, green, or blue intensity image. These three images are then combined to produce a full color, single image. Because the THEMIS color filters don't span the full range of colors seen by the human eye, a color THEMIS image does not represent true color. Also, because each single-filter image is contrast enhanced before inclusion in the three-color image, the apparent color variation of the scene is exaggerated. Nevertheless, the color variation that does appear is representative of some change in color, however subtle, in the actual scene. Note that the long edges of THEMIS color images typically contain color artifacts that do not represent surface variation. Orbit Number: 84379 Latitude: -32.7134 Longitude: 204.562 Instrument: VIS Captured: 2020-12-22 01:06 https://photojournal.jpl.nasa.gov/catalog/PIA25004
The THEMIS VIS camera contains 5 filters. The data from different filters can be combined in multiple ways to create a false color image. These false color images may reveal subtle variations of the surface not easily identified in a single band image. Today's false color image shows part of Sirenum Fossae. The linear depressions in this VIS image are tectonic graben. Graben are formed by extension of the crust and faulting. When large amounts of pressure or tension are applied to rocks on timescales that are fast enough that the rock cannot respond by deforming, the rock breaks along faults. In the case of a graben, two parallel faults are formed by extension of the crust and the rock in between the faults drops downward into the space created by the extension. Several graben are visible in this THEMIS VIS image, trending from north-northeast to south-southwest. Because the faults defining the graben are formed parallel to the direction of the applied stress, we know that extensional forces were pulling the crust apart in the west-northwest/east-southeast direction. The Sirenum Fossae graben are 2735km (1700 miles) long. The THEMIS VIS camera is capable of capturing color images of the Martian surface using five different color filters. In this mode of operation, the spatial resolution and coverage of the image must be reduced to accommodate the additional data volume produced from using multiple filters. To make a color image, three of the five filter images (each in grayscale) are selected. Each is contrast enhanced and then converted to a red, green, or blue intensity image. These three images are then combined to produce a full color, single image. Because the THEMIS color filters don't span the full range of colors seen by the human eye, a color THEMIS image does not represent true color. Also, because each single-filter image is contrast enhanced before inclusion in the three-color image, the apparent color variation of the scene is exaggerated. Nevertheless, the color variation that does appear is representative of some change in color, however subtle, in the actual scene. Note that the long edges of THEMIS color images typically contain color artifacts that do not represent surface variation. Orbit Number: 83755 Latitude: -32.1324 Longitude: 205.871 Instrument: VIS Captured: 2020-10-31 16:02 https://photojournal.jpl.nasa.gov/catalog/PIA25001
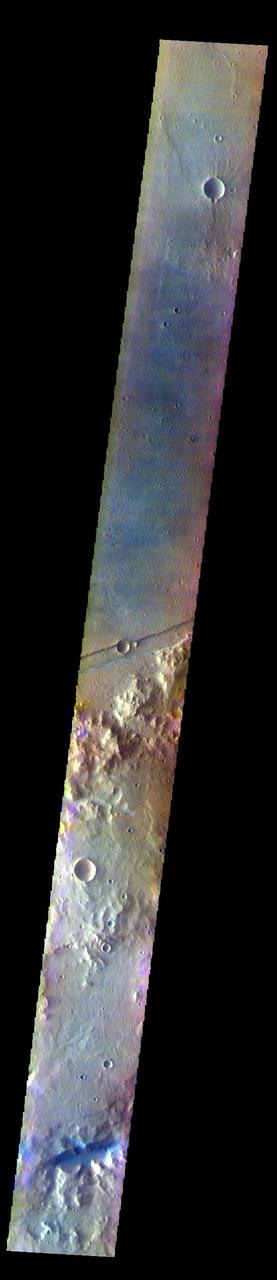
The THEMIS VIS camera contains 5 filters. The data from different filters can be combined in multiple ways to create a false color image. These false color images may reveal subtle variations of the surface not easily identified in a single band image. Today's false color image shows part of Sirenum Fossae. The linear depressions in this VIS image are tectonic graben. Graben are formed by extension of the crust and faulting. When large amounts of pressure or tension are applied to rocks on timescales that are fast enough that the rock cannot respond by deforming, the rock breaks along faults. In the case of a graben, two parallel faults are formed by extension of the crust and the rock in between the faults drops downward into the space created by the extension. Several graben are visible in this THEMIS VIS image, trending from north-northeast to south-southwest. Because the faults defining the graben are formed parallel to the direction of the applied stress, we know that extensional forces were pulling the crust apart in the west-northwest/east-southeast direction. The Sirenum Fossae graben are 2735km (1700 miles) long. The THEMIS VIS camera is capable of capturing color images of the Martian surface using five different color filters. In this mode of operation, the spatial resolution and coverage of the image must be reduced to accommodate the additional data volume produced from using multiple filters. To make a color image, three of the five filter images (each in grayscale) are selected. Each is contrast enhanced and then converted to a red, green, or blue intensity image. These three images are then combined to produce a full color, single image. Because the THEMIS color filters don't span the full range of colors seen by the human eye, a color THEMIS image does not represent true color. Also, because each single-filter image is contrast enhanced before inclusion in the three-color image, the apparent color variation of the scene is exaggerated. Nevertheless, the color variation that does appear is representative of some change in color, however subtle, in the actual scene. Note that the long edges of THEMIS color images typically contain color artifacts that do not represent surface variation. Orbit Number: 84841 Latitude: -35.7019 Longitude: 196.266 Instrument: VIS Captured: 2021-01-29 02:03 https://photojournal.jpl.nasa.gov/catalog/PIA25005
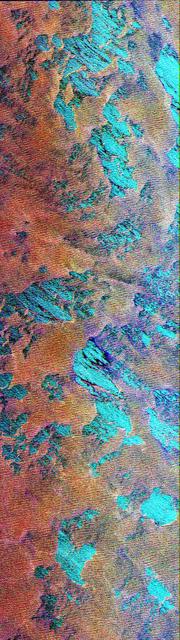
This Spaceborne Imaging Radar-C/X-band Synthetic Aperture Radar color composite shows a portion of the Weddell Sea, which is adjacent to the continent of Antarctica. The image shows extensive coverage of first-year sea ice mixtures and patches of open water inside the ice margin. The image covers a 100 kilometer by 30 kilometer (62 mile by 18.5 mile) region of the southern ocean, centered at approximately 57 degrees south latitude and 3 degrees east longitude, which was acquired on October 3, 1994. Data used to create this image were obtained using the L-band (horizontally transmitted and vertically received) in red; the L-band (horizontally transmitted and received) in green; and the C-band (horizontally transmitted and received) in blue. The sea ice, which appears rust-brown in the image, is composed of loosely packed floes from approximately 1 meter to 2 meters (3 feet to 6.5 feet) thick and ranging from 1 meter to 20 meters (3 feet to 65.5 feet) in diameter. Large patches of open water, shown as turquoise blue, are scattered throughout the area, which is typical for ice margins experiencing off-ice winds. The thin, well-organized lines clearly visible in the ice pack are caused by radar energy reflected by floes riding the crest of ocean swells. The wispy, black features seen throughout the image represent areas where new ice is forming. Sea ice, because it acts as an insulator, reduces the loss of heat between the relatively warm ocean and cold atmosphere. This interaction is an important component of the global climate system. Because of the unique combination of winds, currents and temperatures found in this region, ice can extend many hundreds of kilometers north of Antarctica each winter, which classifies the Weddell Sea as one of nature's greatest ice-making engines. During the formation of sea ice, great quantities of salt are expelled from the frozen water. The salt increases the density of the upper layer of sea water, which then sinks to great depths. Oceanographers believe this process forms most of the oceans' deep water. Sea ice covering all of the southern oceans, including the Weddell Sea, typically reaches its most northerly extent in about September. As periods of daylight become gradually longer in the Southern Hemisphere, ice formation stops and the ice edge retreats southward. By February, most of the sea ice surrounding Antarctica disappears. Imaging radar is extremely useful for studying the polar regions because of the long periods of darkness and extensive cloud cover. The multiple frequencies of the SIR-C/X-SAR instruments allow further study into ways of improving the separation of the various thickness ranges of sea ice, which are vital to understanding the heat balance in the ice, ocean and atmospheric system. http://photojournal.jpl.nasa.gov/catalog/PIA01737
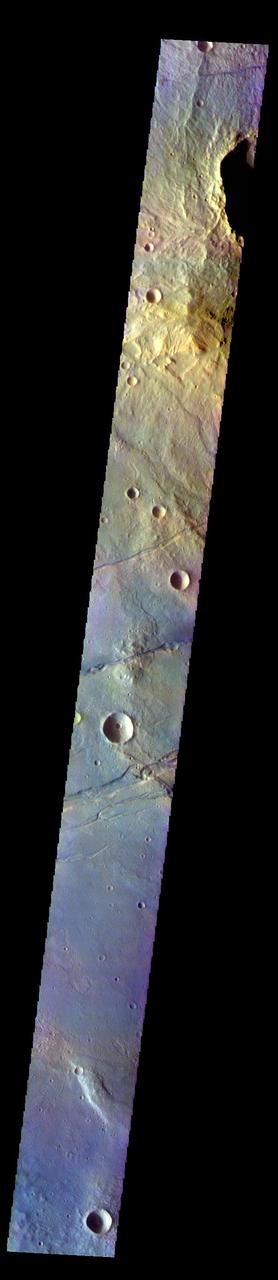
The THEMIS VIS camera contains 5 filters. The data from different filters can be combined in multiple ways to create a false color image. These false color images may reveal subtle variations of the surface not easily identified in a single band image. Today's false color image shows part of Sirenum Fossae. The linear depressions in this VIS image are tectonic graben. Graben are formed by extension of the crust and faulting. When large amounts of pressure or tension are applied to rocks on timescales that are fast enough that the rock cannot respond by deforming, the rock breaks along faults. In the case of a graben, two parallel faults are formed by extension of the crust and the rock in between the faults drops downward into the space created by the extension. Several graben are visible in this THEMIS VIS image, trending from north-northeast to south-southwest. Because the faults defining the graben are formed perpendicular to the direction of the applied stress, we know that extensional forces were pulling the crust apart in the west-northwest/east-southeast direction. The Sirenum Fossae graben are 2735km (1700 miles) long. The THEMIS VIS camera is capable of capturing color images of the Martian surface using five different color filters. In this mode of operation, the spatial resolution and coverage of the image must be reduced to accommodate the additional data volume produced from using multiple filters. To make a color image, three of the five filter images (each in grayscale) are selected. Each is contrast enhanced and then converted to a red, green, or blue intensity image. These three images are then combined to produce a full color, single image. Because the THEMIS color filters don't span the full range of colors seen by the human eye, a color THEMIS image does not represent true color. Also, because each single-filter image is contrast enhanced before inclusion in the three-color image, the apparent color variation of the scene is exaggerated. Nevertheless, the color variation that does appear is representative of some change in color, however subtle, in the actual scene. Note that the long edges of THEMIS color images typically contain color artifacts that do not represent surface variation. Orbit Number: 92203 Latitude: -31.0389 Longitude: 208.065 Instrument: VIS Captured: 2022-09-27 06:25 https://photojournal.jpl.nasa.gov/catalog/PIA26087
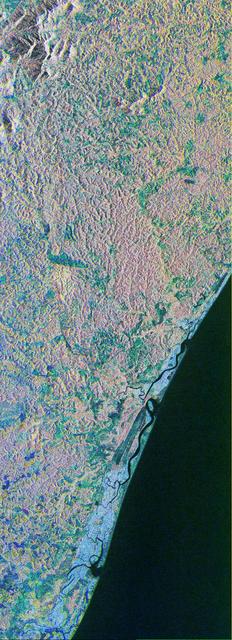
This is a color composite image of southern Bahia, Brazil, centered at 15.22 degree south latitude and 39.07 degrees west longitude. The image was acquired by the Spaceborne Imaging Radar-C/X-band Synthetic Aperture Radar aboard the space shuttle Endeavour on its 38th orbit of Earth on October 2, 1994. The image covers an area centered over the Una Biological Reserve, one the largest protected areas in northeastern Brazil. The 7,000-hectare reserve is administered by the Brazilian Institute for the Environment and is part of the larger Atlantic coastal forest, a narrow band of rain forest extending along the eastern coast of Brazil. The Atlantic coastal forest of southern Bahia is one of the world's most threatened and diverse ecosystems. Due to widespread settlement, only 2 to 5 percent of the original forest cover remains. Yet the region still contains an astounding variety of plants and animals, including a large number of endemic species. More than half of the region's tree species and 80 percent of its animal species are indigenous and found nowhere else on Earth. The Una Reserve is also the only federally protected habitat for the golden-headed lion tamarin, the yellow-breasted capuchin monkey and many other endangered species. In the past few years, scientists from Brazilian and international conservation organizations have coordinated efforts to study the biological diversity of this region and to develop practical and economically viable options for preserving the remaining primary forests in southern Bahia. The shuttle imaging radar is used in this study to identify various land uses and vegetation types, including remaining patches of primary forest, cabruca forest (cacao planted in the understory of the native forest), secondary forest, pasture and coastal mangrove. Standard remote-sensing technology that relies on light reflected from the forest canopy cannot accurately distinguish between cabruca and undisturbed forest. Optical remote sensing is also limited by the nearly continuous cloud cover in the region and heavy rainfall, which occurs more than 150 days each year. The ability of the shuttle radars to "see" through the forest canopy to the cultivated cacao below -- independent of weather or sunlight conditions --will allow researchers to distinguish forest from cabruca in unprecedented detail. This SIR-C/X-SAR image was produced by assigning red to the L-band, green to the C-band and blue to the X-band. The Una Reserve is located in the middle of the image west of the coastline and slightly northwest of Comandatuba River. The reserve's primary forests are easily detected by the pink areas in the image. The intensity of red in these areas is due to the high density of forest vegetation (biomass) detected by the radar's L-band (horizontally transmitted and vertically received) channel. Secondary forest is visible along the reserve's eastern border. The Serrado Mar mountain range is located in the top left portion of the image. Cabruca forest to the west of Una Reserve has a different texture and a yellow color. The removal of understory in cabruca forest reduces its biomass relative to primary forest, which changes the L-band and C-band penetration depth and returns, and produces a different texture and color in the image. The region along the Atlantic is mainly mangrove swamp, agricultural fields and urban areas. The high intensity of blue in this region is a result of increasing X-band return in areas covered with swamp and low vegetation. The image clearly separates the mangrove region (east of coastal Highway 001, shown in blue) from the taller and dryer forest west of the highway. The high resolution capability of SIR-C/X-SAR imaging and the sensitivity of its frequency and polarization channels to various land covers will be used for monitoring and mapping areas of importance for conservation. http://photojournal.jpl.nasa.gov/catalog/PIA01764