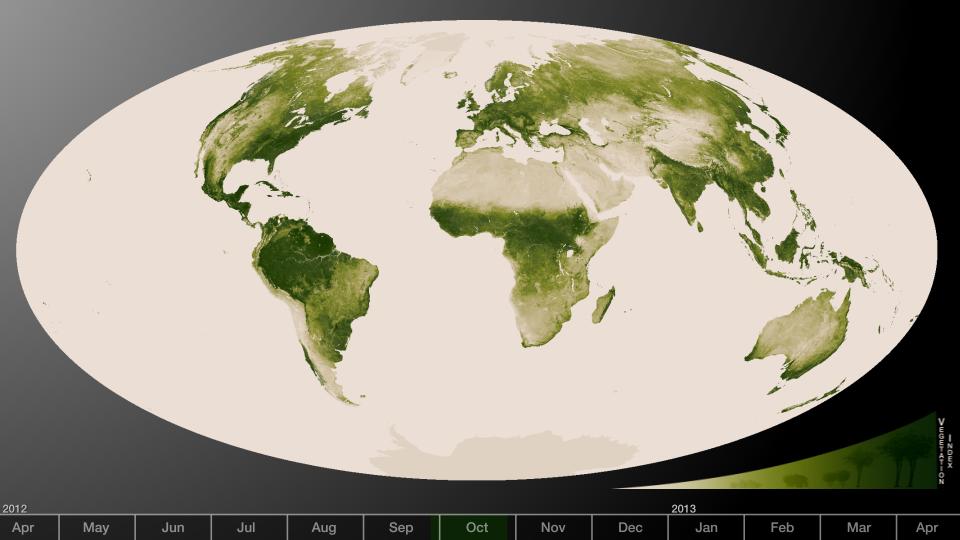
Subtle vegetation changes are visible in this year-long visualization. Large-scale patterns vary with seasons, but the local variations in green are also sensitive precipitation, drought and fire. High values of Normalized Difference Vegetation Index, or NDVI, represent dense green functioning vegetation and low NDVI values represent sparse green vegetation or vegetation under stress from limiting conditions, such as drought. The visualization was created from a year’s worth of data from April 2012 to April 2013. The information was sent back to Earth from the Visible-Infrared Imager/Radiometer Suite (VIIRS) instrument aboard the Suomi National Polar-orbiting Partnership or Suomi NPP satellite, a partnership between NASA and the National Oceanic and Atmospheric Administration, or NOAA. Credit: NASA/NOAA To read more go to: <a href="http://www.nasa.gov/mission_pages/NPP/news/vegetation.html" rel="nofollow">www.nasa.gov/mission_pages/NPP/news/vegetation.html</a> <b><a href="http://www.nasa.gov/audience/formedia/features/MP_Photo_Guidelines.html" rel="nofollow">NASA image use policy.</a></b> <b><a href="http://www.nasa.gov/centers/goddard/home/index.html" rel="nofollow">NASA Goddard Space Flight Center</a></b> enables NASA’s mission through four scientific endeavors: Earth Science, Heliophysics, Solar System Exploration, and Astrophysics. Goddard plays a leading role in NASA’s accomplishments by contributing compelling scientific knowledge to advance the Agency’s mission. <b>Follow us on <a href="http://twitter.com/NASA_GoddardPix" rel="nofollow">Twitter</a></b> <b>Like us on <a href="http://www.facebook.com/pages/Greenbelt-MD/NASA-Goddard/395013845897?ref=tsd" rel="nofollow">Facebook</a></b> <b>Find us on <a href="http://instagram.com/nasagoddard?vm=grid" rel="nofollow">Instagram</a></b>
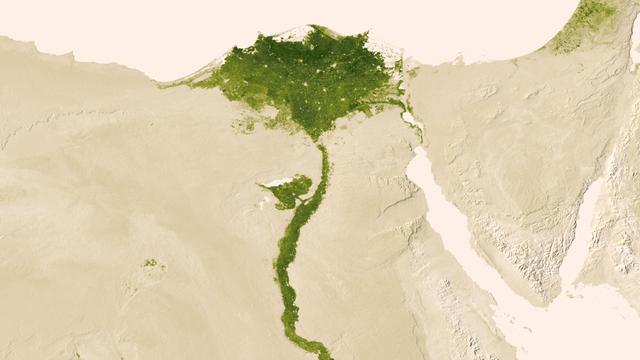
Urbanized areas of northern Egypt are visible amidst the deserts of Egypt. The image captured July 9-15, 2012 also shows the Nile River which provides life-sustaining water to the region. The image was created from the Visible-Infrared Imager/Radiometer Suite (VIIRS) instrument aboard the Suomi National Polar-orbiting Partnership or Suomi NPP satellite, a partnership between NASA and the National Oceanic and Atmospheric Administration, or NOAA. Credit: NASA/NOAA To read more go to: <a href="http://www.nasa.gov/mission_pages/NPP/news/vegetation.html" rel="nofollow">www.nasa.gov/mission_pages/NPP/news/vegetation.html</a> <b><a href="http://www.nasa.gov/audience/formedia/features/MP_Photo_Guidelines.html" rel="nofollow">NASA image use policy.</a></b> <b><a href="http://www.nasa.gov/centers/goddard/home/index.html" rel="nofollow">NASA Goddard Space Flight Center</a></b> enables NASA’s mission through four scientific endeavors: Earth Science, Heliophysics, Solar System Exploration, and Astrophysics. Goddard plays a leading role in NASA’s accomplishments by contributing compelling scientific knowledge to advance the Agency’s mission. <b>Follow us on <a href="http://twitter.com/NASA_GoddardPix" rel="nofollow">Twitter</a></b> <b>Like us on <a href="http://www.facebook.com/pages/Greenbelt-MD/NASA-Goddard/395013845897?ref=tsd" rel="nofollow">Facebook</a></b> <b>Find us on <a href="http://instagram.com/nasagoddard?vm=grid" rel="nofollow">Instagram</a></b>
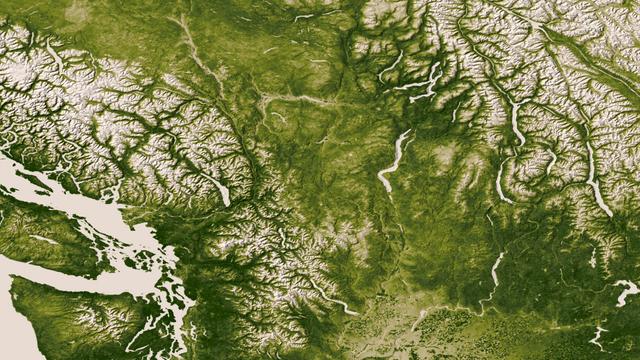
The Rocky, Cascade, and Coast Mountain Ranges dominate the landscape of the Pacific Northwest in this image created June 11-17, 2012 from the Visible-Infrared Imager/Radiometer Suite (VIIRS) instrument aboard the Suomi National Polar-orbiting Partnership or Suomi NPP satellite, a partnership between NASA and the National Oceanic and Atmospheric Administration, or NOAA. Potato and other agriculture can be seen in the bottom center of the image, as the Rockies transition to the plains of Idaho. High values of Normalized Difference Vegetation Index, or NDVI, represent dense green functioning vegetation and low NDVI values represent sparse green vegetation or vegetation under stress from limiting conditions, such as drought. Credit: NASA/NOAA To read more go to: <a href="http://www.nasa.gov/mission_pages/NPP/news/vegetation.html" rel="nofollow">www.nasa.gov/mission_pages/NPP/news/vegetation.html</a> <b><a href="http://www.nasa.gov/audience/formedia/features/MP_Photo_Guidelines.html" rel="nofollow">NASA image use policy.</a></b> <b><a href="http://www.nasa.gov/centers/goddard/home/index.html" rel="nofollow">NASA Goddard Space Flight Center</a></b> enables NASA’s mission through four scientific endeavors: Earth Science, Heliophysics, Solar System Exploration, and Astrophysics. Goddard plays a leading role in NASA’s accomplishments by contributing compelling scientific knowledge to advance the Agency’s mission. <b>Follow us on <a href="http://twitter.com/NASA_GoddardPix" rel="nofollow">Twitter</a></b> <b>Like us on <a href="http://www.facebook.com/pages/Greenbelt-MD/NASA-Goddard/395013845897?ref=tsd" rel="nofollow">Facebook</a></b> <b>Find us on <a href="http://instagram.com/nasagoddard?vm=grid" rel="nofollow">Instagram</a></b>

Located in the crater Eminescu, this high-resolution image shows part of the mountainous peak ring, as well as an example of the extensive formation of hollows located within the crater. Hollows maintain an air of mystery in the realm of planetary science. Though the exact formation mechanism is unknown, most scientists agree sublimation of volatiles holds the answer. This image highlights the prevalence of these hollows on and around the peak ring, as well as captures the beauty of such enigmatic formations. This image was acquired as a high-resolution targeted observation. Targeted observations are images of a small area on Mercury's surface at resolutions much higher than the 200-meter/pixel morphology base map. It is not possible to cover all of Mercury's surface at this high resolution, but typically several areas of high scientific interest are imaged in this mode each week. Credit: NASA/Johns Hopkins University Applied Physics Laboratory/Carnegie Institution of Washington <b><a href="http://www.nasa.gov/audience/formedia/features/MP_Photo_Guidelines.html" rel="nofollow">NASA image use policy.</a></b> <b><a href="http://www.nasa.gov/centers/goddard/home/index.html" rel="nofollow">NASA Goddard Space Flight Center</a></b> enables NASA’s mission through four scientific endeavors: Earth Science, Heliophysics, Solar System Exploration, and Astrophysics. Goddard plays a leading role in NASA’s accomplishments by contributing compelling scientific knowledge to advance the Agency’s mission. <b>Follow us on <a href="http://twitter.com/NASA_GoddardPix" rel="nofollow">Twitter</a></b> <b>Like us on <a href="http://www.facebook.com/pages/Greenbelt-MD/NASA-Goddard/395013845897?ref=tsd" rel="nofollow">Facebook</a></b> <b>Find us on <a href="http://instagram.com/nasagoddard?vm=grid" rel="nofollow">Instagram</a></b>

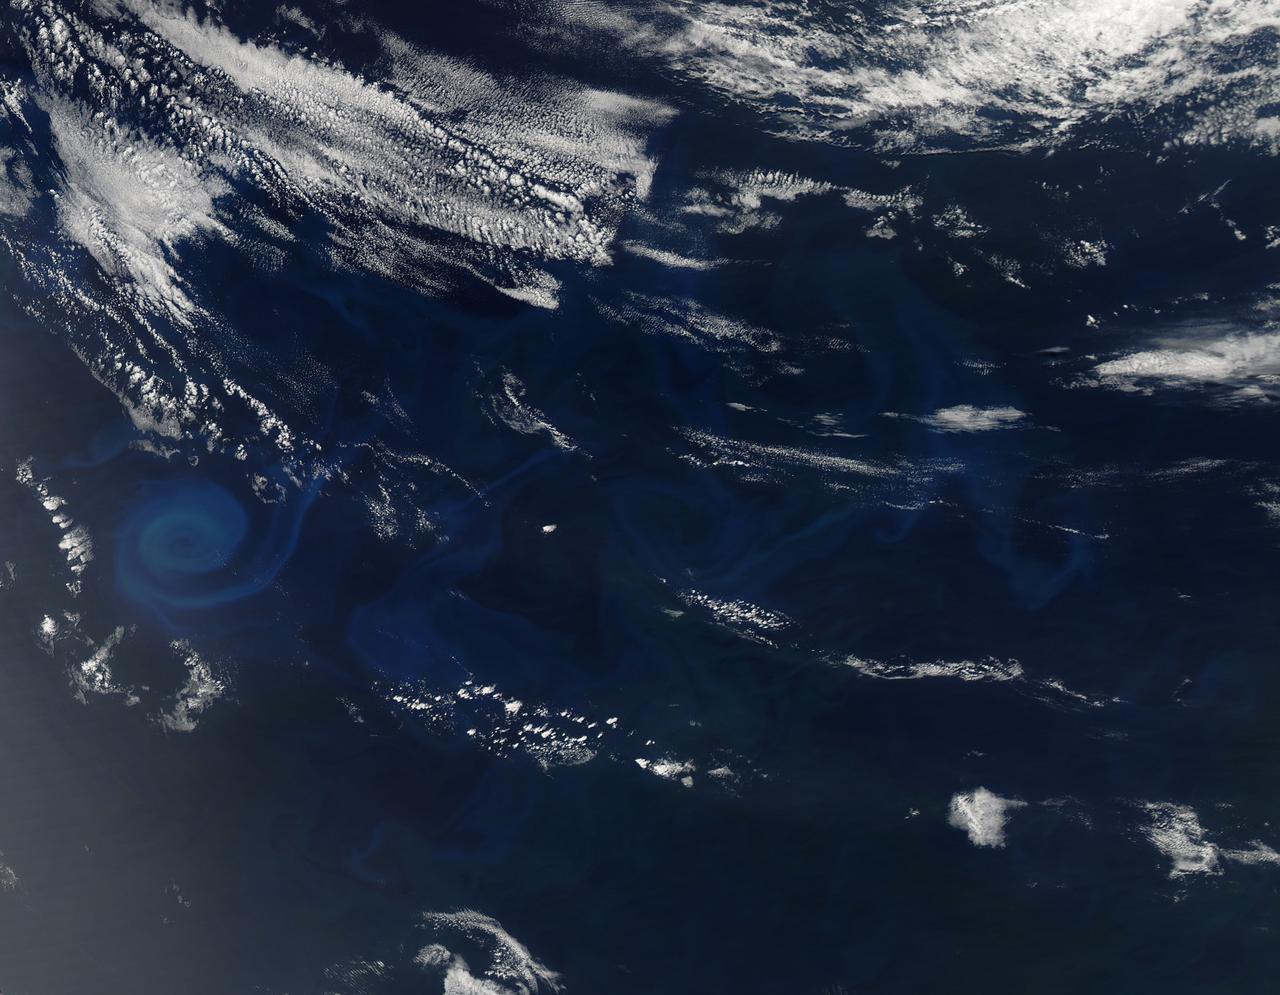
NASA's Aqua satellite observed swirls of sea ice along the coast of Greenland on December 30, 2012. Credit: NASA/GSFC/Jeff Schmaltz/MODIS Land Rapid Response Team <b><a href="http://www.nasa.gov/audience/formedia/features/MP_Photo_Guidelines.html" rel="nofollow">NASA image use policy.</a></b> <b><a href="http://www.nasa.gov/centers/goddard/home/index.html" rel="nofollow">NASA Goddard Space Flight Center</a></b> enables NASA’s mission through four scientific endeavors: Earth Science, Heliophysics, Solar System Exploration, and Astrophysics. Goddard plays a leading role in NASA’s accomplishments by contributing compelling scientific knowledge to advance the Agency’s mission. <b>Follow us on <a href="http://twitter.com/NASA_GoddardPix" rel="nofollow">Twitter</a></b> <b>Like us on <a href="http://www.facebook.com/pages/Greenbelt-MD/NASA-Goddard/395013845897?ref=tsd" rel="nofollow">Facebook</a></b> <b>Find us on <a href="http://instagram.com/nasagoddard?vm=grid" rel="nofollow">Instagram</a></b>
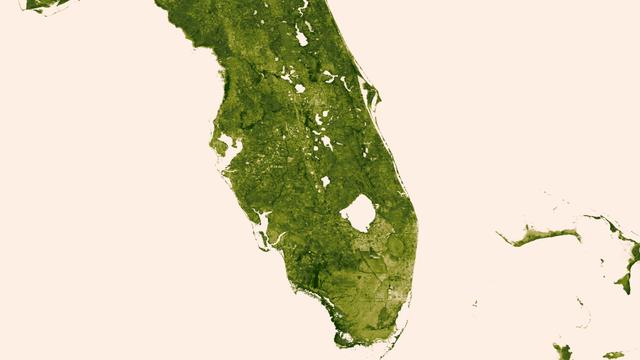
A "river of grass" extending south of Lake Okeechobee shows how the area was modified by man with visible areas of dense agriculture, urban sprawl and water conservation areas delineated by a series of waterways that crisscross Southern Florida. The image was created March 18-24, 2013 from the Visible-Infrared Imager/Radiometer Suite (VIIRS) instrument aboard the Suomi National Polar-orbiting Partnership or Suomi NPP satellite, a partnership between NASA and the National Oceanic and Atmospheric Administration, or NOAA. Credit: NASA/NOAA To read more go to: <a href="http://www.nasa.gov/mission_pages/NPP/news/vegetation.html" rel="nofollow">www.nasa.gov/mission_pages/NPP/news/vegetation.html</a> <b><a href="http://www.nasa.gov/audience/formedia/features/MP_Photo_Guidelines.html" rel="nofollow">NASA image use policy.</a></b> <b><a href="http://www.nasa.gov/centers/goddard/home/index.html" rel="nofollow">NASA Goddard Space Flight Center</a></b> enables NASA’s mission through four scientific endeavors: Earth Science, Heliophysics, Solar System Exploration, and Astrophysics. Goddard plays a leading role in NASA’s accomplishments by contributing compelling scientific knowledge to advance the Agency’s mission. <b>Follow us on <a href="http://twitter.com/NASA_GoddardPix" rel="nofollow">Twitter</a></b> <b>Like us on <a href="http://www.facebook.com/pages/Greenbelt-MD/NASA-Goddard/395013845897?ref=tsd" rel="nofollow">Facebook</a></b> <b>Find us on <a href="http://instagram.com/nasagoddard?vm=grid" rel="nofollow">Instagram</a></b>
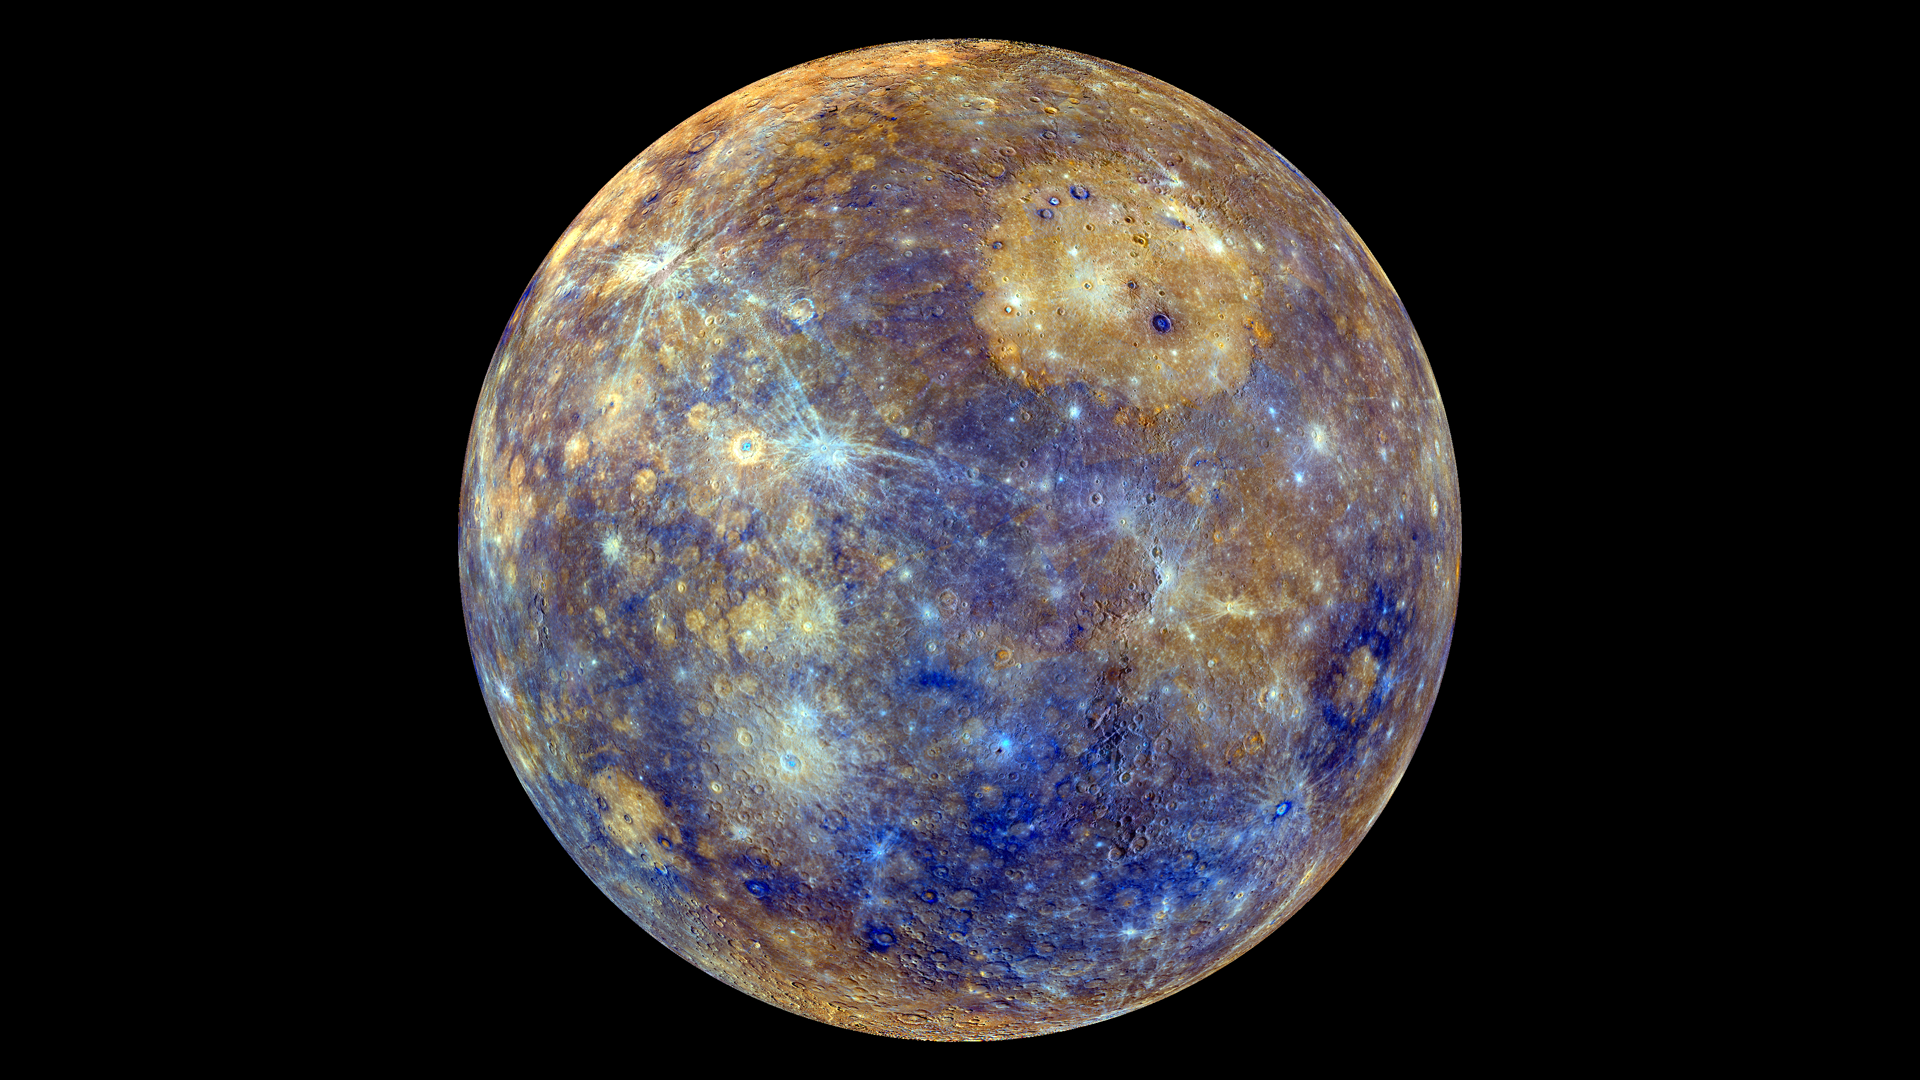
This colorful view of Mercury was produced by using images from the color base map imaging campaign during MESSENGER's primary mission. These colors are not what Mercury would look like to the human eye, but rather the colors enhance the chemical, mineralogical, and physical differences between the rocks that make up Mercury's surface. <b>To watch a movie of this colorful view of Mercury as a spinning globe go here: <a href="http://www.flickr.com/photos/gsfc/8497927473">www.flickr.com/photos/gsfc/8497927473</a></b> Young crater rays, extending radially from fresh impact craters, appear light blue or white. Medium- and dark-blue areas are a geologic unit of Mercury's crust known as the "low-reflectance material", thought to be rich in a dark, opaque mineral. Tan areas are plains formed by eruption of highly fluid lavas. The giant Caloris basin is the large circular tan feature located just to the upper right of center of the image. The MESSENGER spacecraft is the first ever to orbit the planet Mercury, and the spacecraft's seven scientific instruments and radio science investigation are unraveling the history and evolution of the Solar System's innermost planet. Visit the Why Mercury? section of this website to learn more about the key science questions that the MESSENGER mission is addressing. During the one-year primary mission, MESSENGER acquired 88,746 images and extensive other data sets. MESSENGER is now in a yearlong extended mission, during which plans call for the acquisition of more than 80,000 additional images to support MESSENGER's science goals. Credit: NASA/Johns Hopkins University Applied Physics Laboratory/Carnegie Institution of Washington <b><a href="http://www.nasa.gov/audience/formedia/features/MP_Photo_Guidelines.html" rel="nofollow">NASA image use policy.</a></b> <b><a href="http://www.nasa.gov/centers/goddard/home/index.html" rel="nofollow">NASA Goddard Space Flight Center</a></b> enables NASA’s mission through four scientific endeavors: Earth Science, Heliophysics, Solar System Exploration, and Astrophysics. Goddard plays a leading role in NASA’s accomplishments by contributing compelling scientific knowledge to advance the Agency’s mission. <b>Follow us on <a href="http://twitter.com/NASA_GoddardPix" rel="nofollow">Twitter</a></b> <b>Like us on <a href="http://www.facebook.com/pages/Greenbelt-MD/NASA-Goddard/395013845897?ref=tsd" rel="nofollow">Facebook</a></b> <b>Find us on <a href="http://instagram.com/nasagoddard?vm=grid" rel="nofollow">Instagram</a></b>

The GOES-East satellite captured a Midwestern wintertime "White Out" at 2015 UTC/3:15 p.m. EST on January 6, 2014. Blowing snow and intensely cold air created dangerous white-out conditions over the Midwest, particularly around the Great Lakes, where daytime temperatures averaged -20F with a wind chill near -50F. The GOES-East satellite is managed by NOAA. The image was created at NASA's GOES Project at NASA's Goddard Space Flight Center, Greenbelt, Md. Credit: NASA NOAA GOES Project, Dennis Chesters <b><a href="http://www.nasa.gov/audience/formedia/features/MP_Photo_Guidelines.html" rel="nofollow">NASA image use policy.</a></b> <b><a href="http://www.nasa.gov/centers/goddard/home/index.html" rel="nofollow">NASA Goddard Space Flight Center</a></b> enables NASA’s mission through four scientific endeavors: Earth Science, Heliophysics, Solar System Exploration, and Astrophysics. Goddard plays a leading role in NASA’s accomplishments by contributing compelling scientific knowledge to advance the Agency’s mission. <b>Follow us on <a href="http://twitter.com/NASA_GoddardPix" rel="nofollow">Twitter</a></b> <b>Like us on <a href="http://www.facebook.com/pages/Greenbelt-MD/NASA-Goddard/395013845897?ref=tsd" rel="nofollow">Facebook</a></b> <b>Find us on <a href="http://instagram.com/nasagoddard?vm=grid" rel="nofollow">Instagram</a></b>
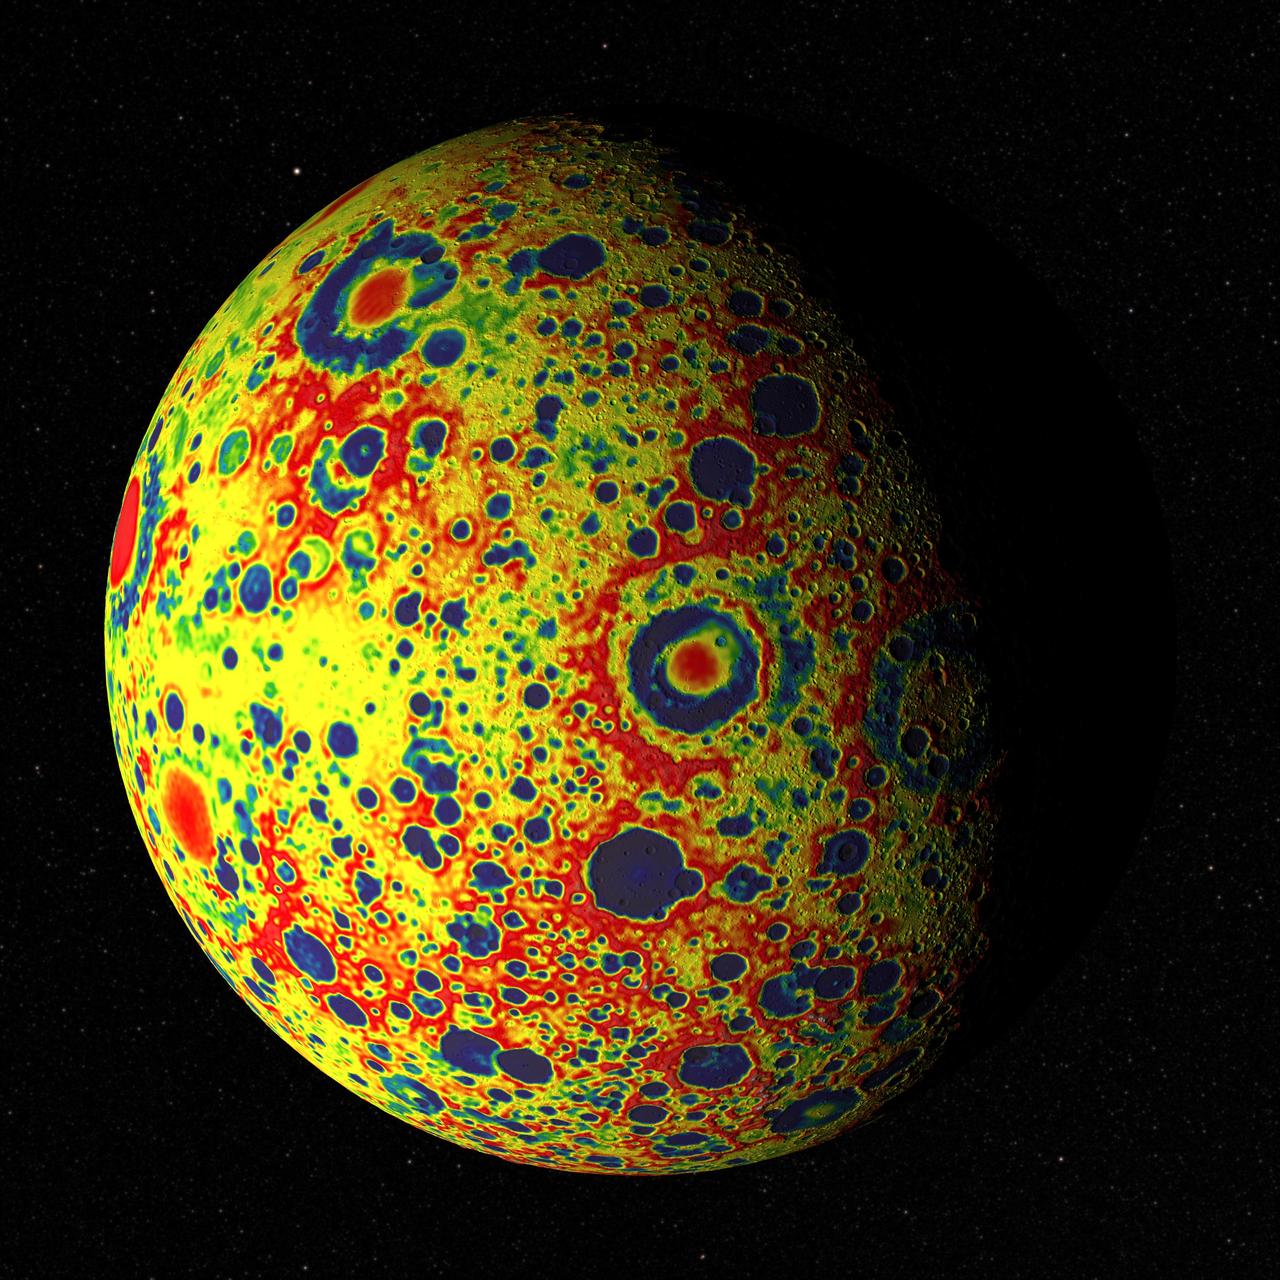
If the Moon were a perfectly smooth sphere of uniform density, the gravity map would be a single, featureless color, indicating that the force of gravity at a given elevation was the same everywhere. But like other rocky bodies in the solar system, including Earth, the Moon has both a bumpy surface and a lumpy interior. Spacecraft in orbit around the Moon experience slight variations in gravity caused by both of these irregularities. The free-air gravity map shows deviations from the mean, the gravity that a cueball Moon would have. The deviations are measured in milliGals, a unit of acceleration. On the map, dark purple is at the low end of the range, at around -400 mGals, and red is at the high end near +400 mGals. Yellow denotes the mean. These views show a part of the Moon's surface that's never visible from Earth. They are centered on lunar coordinates 29°N 142°E. The large, multi-ringed impact feature near the center is Mare Moscoviense. The crater Mendeleev is south of this. The digital elevation model for the terrain is from the Lunar Reconnaissance Orbiter laser altimeter (LOLA). Merely for plausibility, the sun angle and starry background are accurate for specific dates (December 21, 2012, 0:00 UT and January 8, 2013, 14:00 UT, respectively). To see or download more views go to: <a href="http://svs.gsfc.nasa.gov/goto?4041" rel="nofollow">svs.gsfc.nasa.gov/goto?4041</a> Credit: NASA's Goddard Goddard Space Flight Center Scientific Visualization Studio <b><a href="http://www.nasa.gov/audience/formedia/features/MP_Photo_Guidelines.html" rel="nofollow">NASA image use policy.</a></b> <b><a href="http://www.nasa.gov/centers/goddard/home/index.html" rel="nofollow">NASA Goddard Space Flight Center</a></b> enables NASA’s mission through four scientific endeavors: Earth Science, Heliophysics, Solar System Exploration, and Astrophysics. Goddard plays a leading role in NASA’s accomplishments by contributing compelling scientific knowledge to advance the Agency’s mission. <b>Follow us on <a href="http://twitter.com/NASA_GoddardPix" rel="nofollow">Twitter</a></b> <b>Like us on <a href="http://www.facebook.com/pages/Greenbelt-MD/NASA-Goddard/395013845897?ref=tsd" rel="nofollow">Facebook</a></b> <b>Find us on <a href="http://instagram.com/nasagoddard?vm=grid" rel="nofollow">Instagram</a></b>
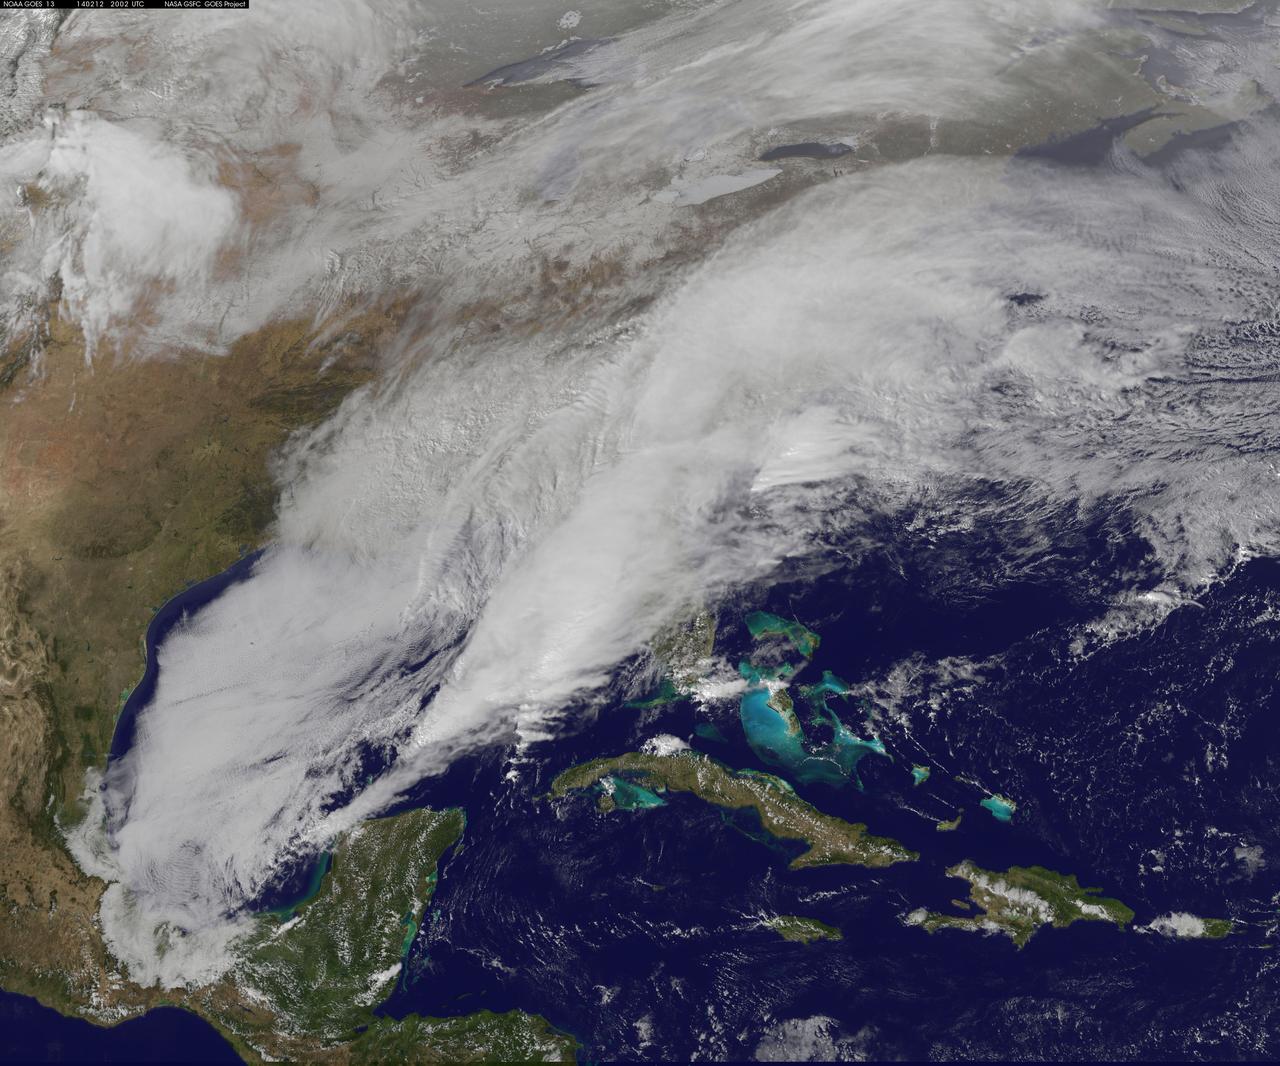
<b>View a video of the storm here: <a href="http://bit.ly/1m9aJFY" rel="nofollow">bit.ly/1m9aJFY</a></b> This visible image of the winter storm over the U.S. south and East Coast was taken by NOAA's GOES-13 satellite on Feb. 12 at 1855 UTC/1:55 p.m. EST. Snow covered ground can be seen over the Great Lakes region and Ohio Valley. On February 12 at 10 a.m. EST, NOAA's National Weather Service or NWS continued to issue watches and warnings from Texas to New England. Specifically, NWS cited Winter Storm Warnings and Winter Weather Advisories were in effect from eastern Texas eastward across the interior section of southeastern U.S. states and across much of the eastern seaboard including the Appalachians. Winter storm watches are in effect for portions of northern New England as well as along the western slopes of northern and central Appalachians. For updates on local forecasts, watches and warnings, visit NOAA's <a href="http://www.weather.gov" rel="nofollow">www.weather.gov</a> webpage. NOAA's Weather Prediction Center or WPC noted the storm is expected to bring "freezing rain spreading into the Carolinas, significant snow accumulations are expected in the interior Mid-Atlantic states tonight into Thursday and ice storm warnings and freezing rain advisories are in effect across much of central Georgia. GOES satellites provide the kind of continuous monitoring necessary for intensive data analysis. Geostationary describes an orbit in which a satellite is always in the same position with respect to the rotating Earth. This allows GOES to hover continuously over one position on Earth's surface, appearing stationary. As a result, GOES provide a constant vigil for the atmospheric "triggers" for severe weather conditions such as tornadoes, flash floods, hail storms and hurricanes. For updated information about the storm system, visit NOAA's WPC website; <a href="http://www.hpc.ncep.noaa.gov/" rel="nofollow">www.hpc.ncep.noaa.gov/</a> For more information about GOES satellites, visit: <a href="http://www.goes.noaa.gov/" rel="nofollow">www.goes.noaa.gov/</a> or <a href="http://goes.gsfc.nasa.gov/" rel="nofollow">goes.gsfc.nasa.gov/</a> Rob Gutro NASA's Goddard Space Flight Center <b><a href="http://goes.gsfc.nasa.gov/" rel="nofollow">Credit: NOAA/NASA GOES Project</a></b> <b><a href="http://www.nasa.gov/audience/formedia/features/MP_Photo_Guidelines.html" rel="nofollow">NASA image use policy.</a></b> <b><a href="http://www.nasa.gov/centers/goddard/home/index.html" rel="nofollow">NASA Goddard Space Flight Center</a></b> enables NASA’s mission through four scientific endeavors: Earth Science, Heliophysics, Solar System Exploration, and Astrophysics. Goddard plays a leading role in NASA’s accomplishments by contributing compelling scientific knowledge to advance the Agency’s mission. <b>Follow us on <a href="http://twitter.com/NASAGoddardPix" rel="nofollow">Twitter</a></b> <b>Like us on <a href="http://www.facebook.com/pages/Greenbelt-MD/NASA-Goddard/395013845897?ref=tsd" rel="nofollow">Facebook</a></b> <b>Find us on <a href="http://instagrid.me/nasagoddard/?vm=grid" rel="nofollow">Instagram</a></b>
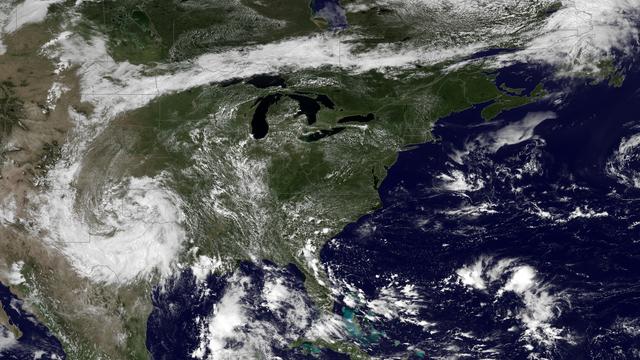
This NOAA GOES-East satellite animation shows the development of System 91L into Tropical Storm Andrea over the course of 3 days from June 4 to June 6, just after Andrea was officially designated a tropical storm. Credit: NASA's GOES Project --- NASA Sees Heavy Rainfall in Tropical Storm Andrea NASA’s TRMM satellite passed over Tropical Storm Andrea right after it was named, while NASA’s Terra satellite captured a visible image of the storm’s reach hours beforehand. TRMM measures rainfall from space and saw that rainfall rates in the southern part of the storm was falling at almost 5 inches per hour. NASA’s Terra satellite passed over Tropical Storm Andrea on June 5 at 16:25 UTC (12:25 p.m. EDT) and the Moderate Resolution Imaging Spectroradiometer or MODIS instrument, captured a visible image of the storm. At that time, Andrea’s clouds had already extended over more than half of Florida. At 8 p.m. EDT on Wednesday, June 5, System 91L became the first tropical storm of the Atlantic Ocean hurricane season. Tropical Storm Andrea was centered near 25.5 North and 86.5 West, about 300 miles (485 km) southwest of Tampa, Fla. At the time Andrea intensified into a tropical storm, its maximum sustained winds were near 40 mph (65 kph). Full updates can be found at NASA's Hurricane page: <a href="http://www.nasa.gov/hurricane" rel="nofollow">www.nasa.gov/hurricane</a> Rob Gutro NASA’s Goddard Space Flight Center
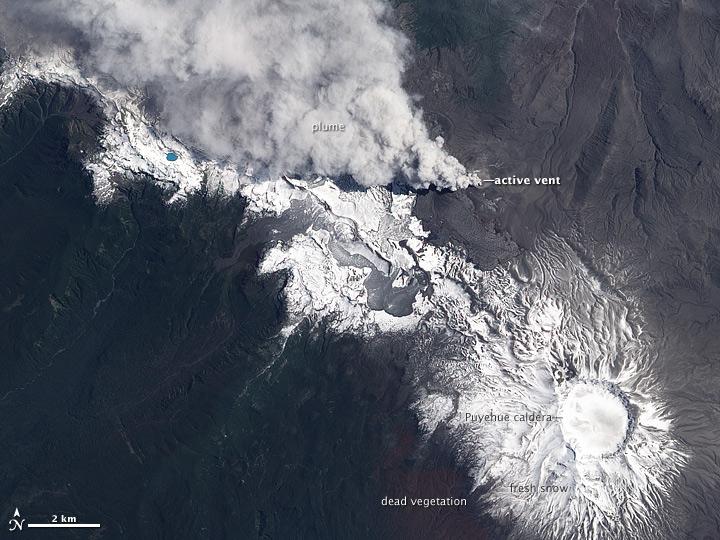
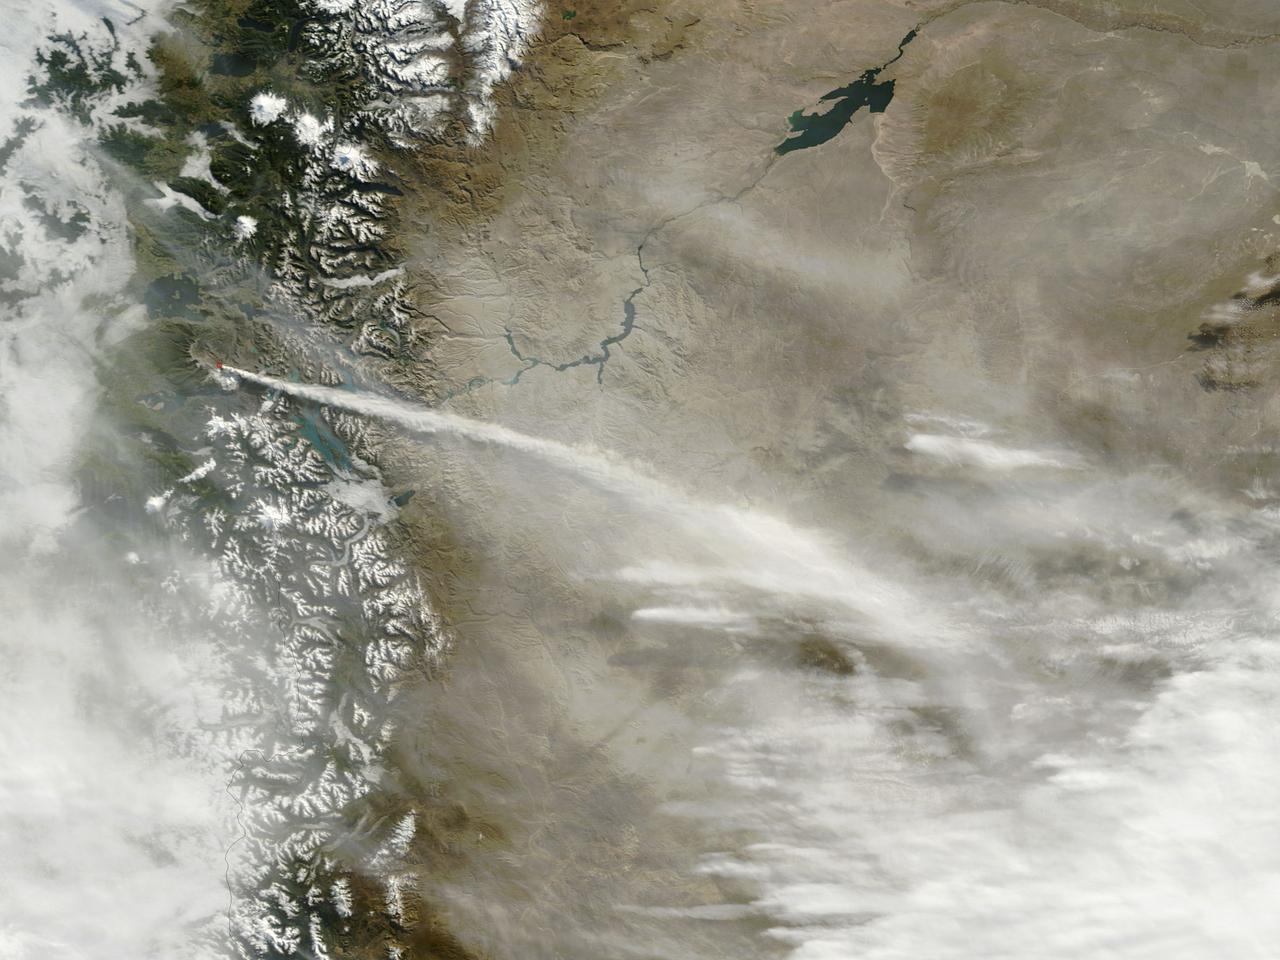
NASA image acquired December 23, 2011 In early June 2011, Chile’s Puyehue-Cordón Caulle Volcano erupted explosively, sending volcanic ash around the Southern Hemisphere. In late December 2011, activity at the volcano had calmed, but volcanic ash and steam continued to pour through the fissure that opened several months earlier. The Advanced Land Imager (ALI) on NASA’s Earth Observing-1 (EO-1) satellite captured this natural-color image on December 23, 2011. The active fissure lies northwest of the Puyehue caldera, and a plume blows from the fissure toward the west and north. This image shows not just ash but also snow on the volcano surface, including the caldera. Because volcanic ash regularly coats the land surface, the pristine snow probably fell recently. In a bulletin issued December 26, 2011, Chile’s Servicio Nacional de Geología y Minería (SERNAGEOMIN) characterized the activity over the previous 24 hours as a minor eruption of low intensity. Reaching an altitude of 2,236 meters (7,336 feet), Puyehue-Cordón Caulle is a stratovolcano, a steep-sloped, conical volcano composed of layers of ash, lava, and rocks released by previous eruptions. This volcano comprises part of the largest active geothermal area in the southern Andes. NASA Earth Observatory image created by Jesse Allen, using EO-1 ALI data provided courtesy of the NASA EO-1 team. Caption by Michon Scott. Instrument: EO-1 - ALI To view more images from this event go here: <a href="http://earthobservatory.nasa.gov/NaturalHazards/event.php?id=50859" rel="nofollow">earthobservatory.nasa.gov/NaturalHazards/event.php?id=50859</a> Credit: <b><a href="http://www.earthobservatory.nasa.gov/" rel="nofollow"> NASA Earth Observatory</a></b> <b><a href="http://www.nasa.gov/audience/formedia/features/MP_Photo_Guidelines.html" rel="nofollow">NASA image use policy.</a></b> <b><a href="http://www.nasa.gov/centers/goddard/home/index.html" rel="nofollow">NASA Goddard Space Flight Center</a></b> enables NASA’s mission through four scientific endeavors: Earth Science, Heliophysics, Solar System Exploration, and Astrophysics. Goddard plays a leading role in NASA’s accomplishments by contributing compelling scientific knowledge to advance the Agency’s mission. <b>Follow us on <a href="http://twitter.com/NASA_GoddardPix" rel="nofollow">Twitter</a></b> <b>Like us on <a href="http://www.facebook.com/pages/Greenbelt-MD/NASA-Goddard/395013845897?ref=tsd" rel="nofollow">Facebook</a></b> <b>Find us on <a href="http://instagrid.me/nasagoddard/?vm=grid" rel="nofollow">Instagram</a></b>
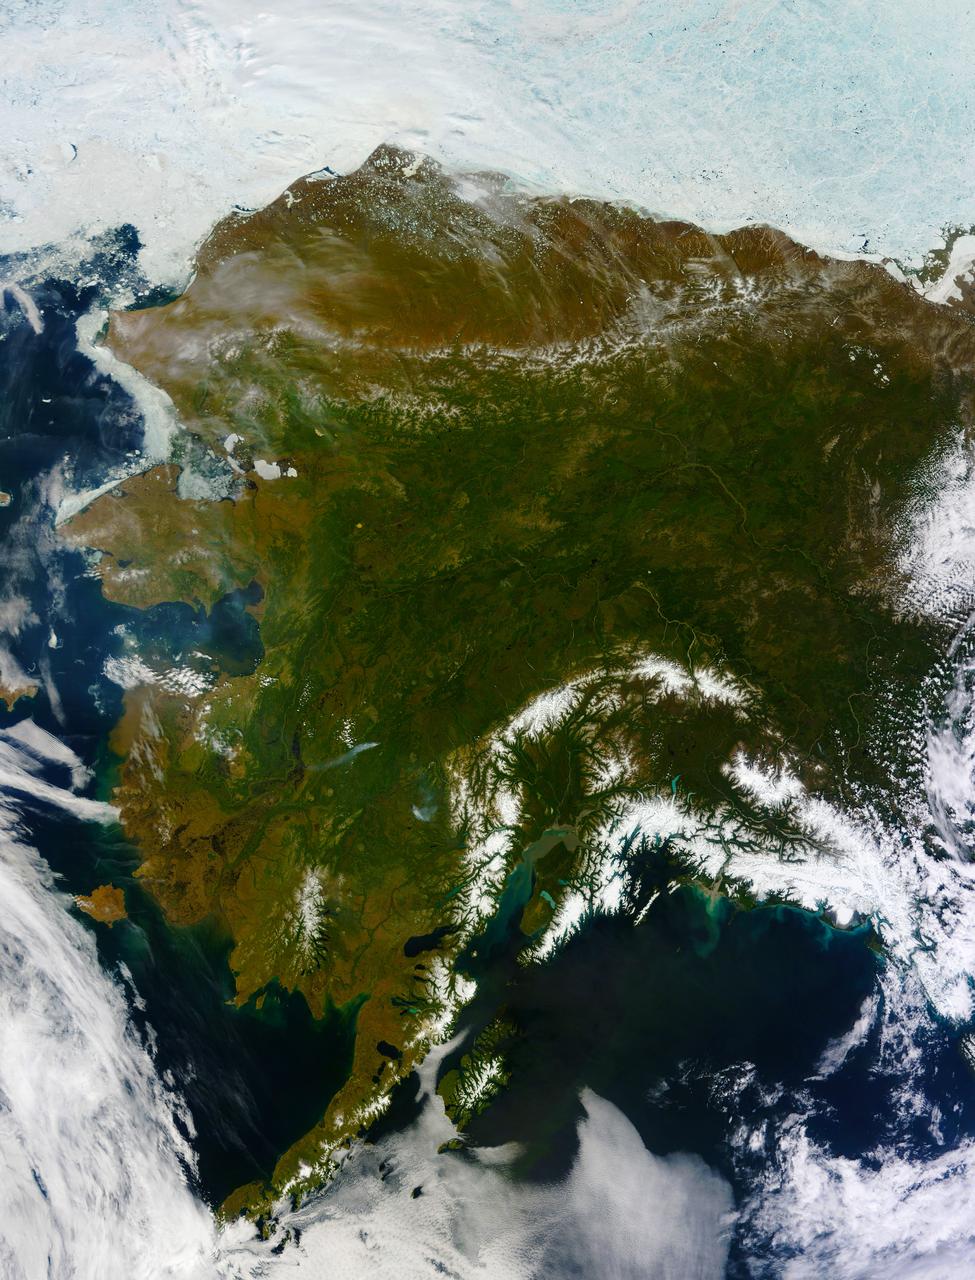
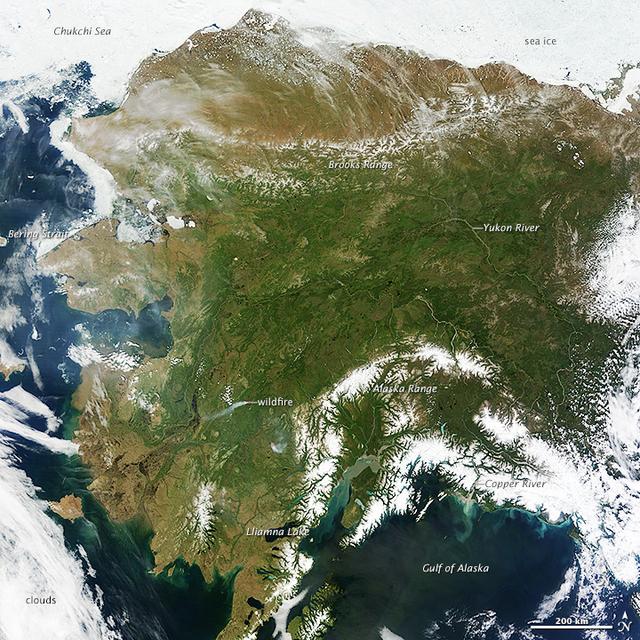
On most days, relentless rivers of clouds wash over Alaska, obscuring most of the state’s 6,640 miles (10,690 kilometers) of coastline and 586,000 square miles (1,518,000 square kilometers) of land. The south coast of Alaska even has the dubious distinction of being the cloudiest region of the United States, with some locations averaging more than 340 cloudy days per year. That was certainly not the case on June 17, 2013, the date that the Moderate Resolution Imaging Spectroradiometer (MODIS) on NASA’s Terra satellite acquired this rare, nearly cloud-free view of the state. The absence of clouds exposed a striking tapestry of water, ice, land, forests, and even wildfires. Snow-covered mountains such as the Alaska Range and Chugach Mountains were visible in southern Alaska, while the arc of mountains that make up the Brooks Range dominated the northern part of the state. The Yukon River—the longest in Alaska and the third longest in the United States—wound its way through the green boreal forests that inhabit the interior of the state. Plumes of sediment and glacial dust poured into the Gulf of Alaska from the Copper River. And Iliamna Lake, the largest in Alaska, was ice free. The same ridge of high pressure that cleared Alaska’s skies also brought stifling temperatures to many areas accustomed to chilly June days. Talkeetna, a town about 100 miles north of Anchorage, saw temperatures reach 96°F (36°C) on June 17. Other towns in southern Alaska set all-time record highs, including Cordova, Valez, and Seward. The high temperatures also helped fuel wildfires and hastened the breakup of sea ice in the Chukchi Sea. NASA image courtesy Jeff Schmaltz, LANCE MODIS Rapid Response Team at NASA GSFC. Caption by Adam Voiland. Instrument: Terra - MODIS More info: <a href="http://1.usa.gov/102MAEj" rel="nofollow">1.usa.gov/102MAEj</a> Credit: <b><a href="http://www.earthobservatory.nasa.gov/" rel="nofollow"> NASA Earth Observatory</a></b> <b><a href="http://www.nasa.gov/audience/formedia/features/MP_Photo_Guidelines.html" rel="nofollow">NASA image use policy.</a></b> <b><a href="http://www.nasa.gov/centers/goddard/home/index.html" rel="nofollow">NASA Goddard Space Flight Center</a></b> enables NASA’s mission through four scientific endeavors: Earth Science, Heliophysics, Solar System Exploration, and Astrophysics. Goddard plays a leading role in NASA’s accomplishments by contributing compelling scientific knowledge to advance the Agency’s mission. <b>Follow us on <a href="http://twitter.com/NASA_GoddardPix" rel="nofollow">Twitter</a></b> <b>Like us on <a href="http://www.facebook.com/pages/Greenbelt-MD/NASA-Goddard/395013845897?ref=tsd" rel="nofollow">Facebook</a></b> <b>Find us on <a href="http://instagram.com/nasagoddard?vm=grid" rel="nofollow">Instagram</a></b>
Phytoplankton bloom in the Great Australian Bight captured by the MODIS instrument on the Aqua satellite on December 30, 2013 at 6:05 UTC. The Great Australian Bight is a large bight, or open bay, off the central and western portions of the southern coastline of mainland Australia. Credit: NASA/GSFC/Jeff Schmaltz/MODIS Land Rapid Response Team <b><a href="http://www.nasa.gov/audience/formedia/features/MP_Photo_Guidelines.html" rel="nofollow">NASA image use policy.</a></b> <b><a href="http://www.nasa.gov/centers/goddard/home/index.html" rel="nofollow">NASA Goddard Space Flight Center</a></b> enables NASA’s mission through four scientific endeavors: Earth Science, Heliophysics, Solar System Exploration, and Astrophysics. Goddard plays a leading role in NASA’s accomplishments by contributing compelling scientific knowledge to advance the Agency’s mission. <b>Follow us on <a href="http://twitter.com/NASA_GoddardPix" rel="nofollow">Twitter</a></b> <b>Like us on <a href="http://www.facebook.com/pages/Greenbelt-MD/NASA-Goddard/395013845897?ref=tsd" rel="nofollow">Facebook</a></b> <b>Find us on <a href="http://instagram.com/nasagoddard?vm=grid" rel="nofollow">Instagram</a></b>
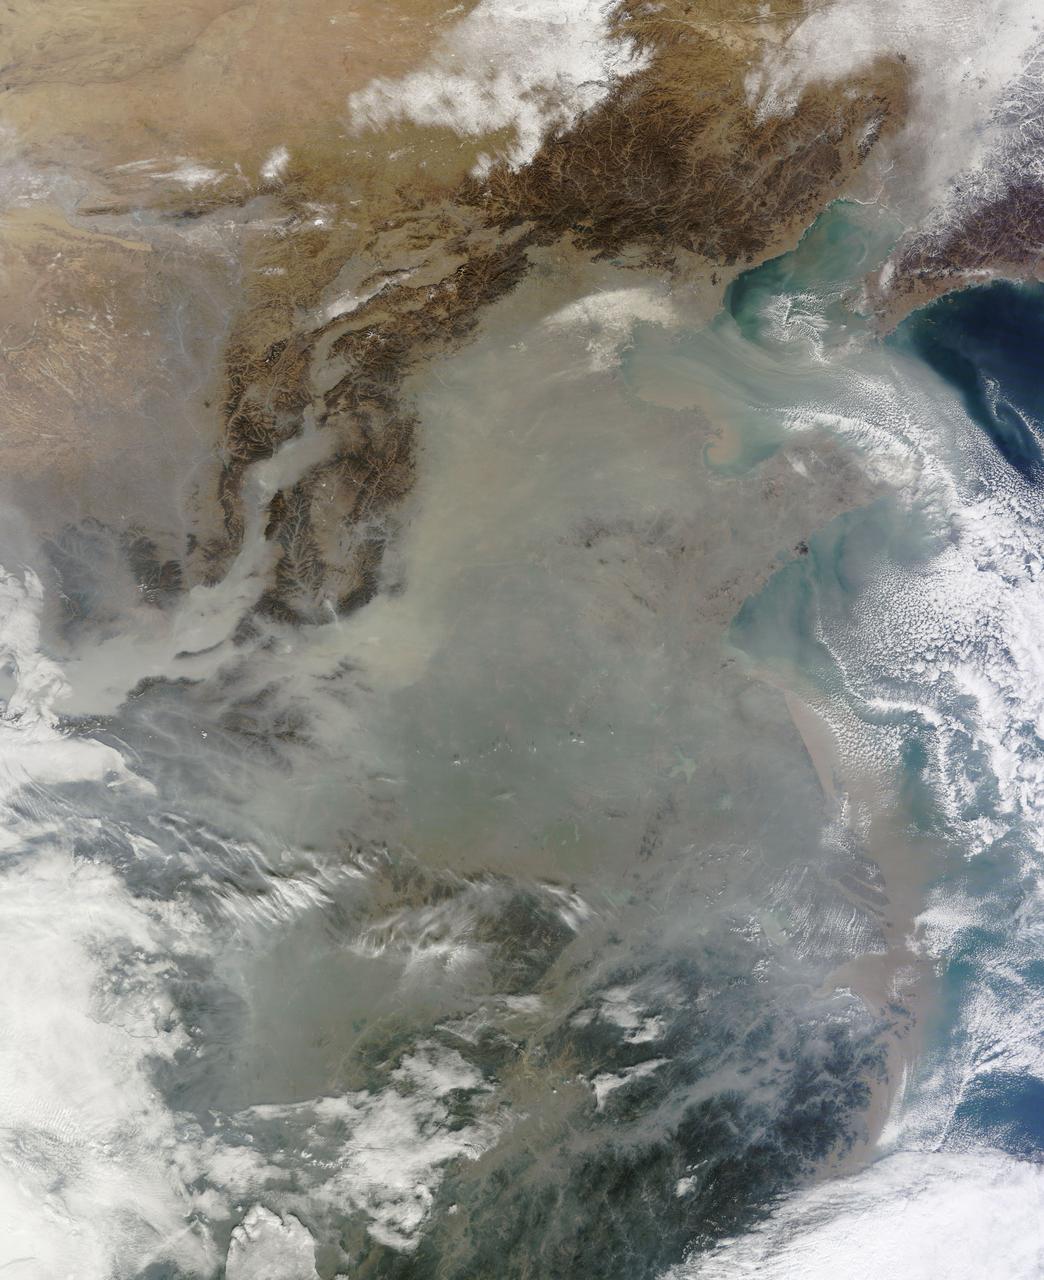
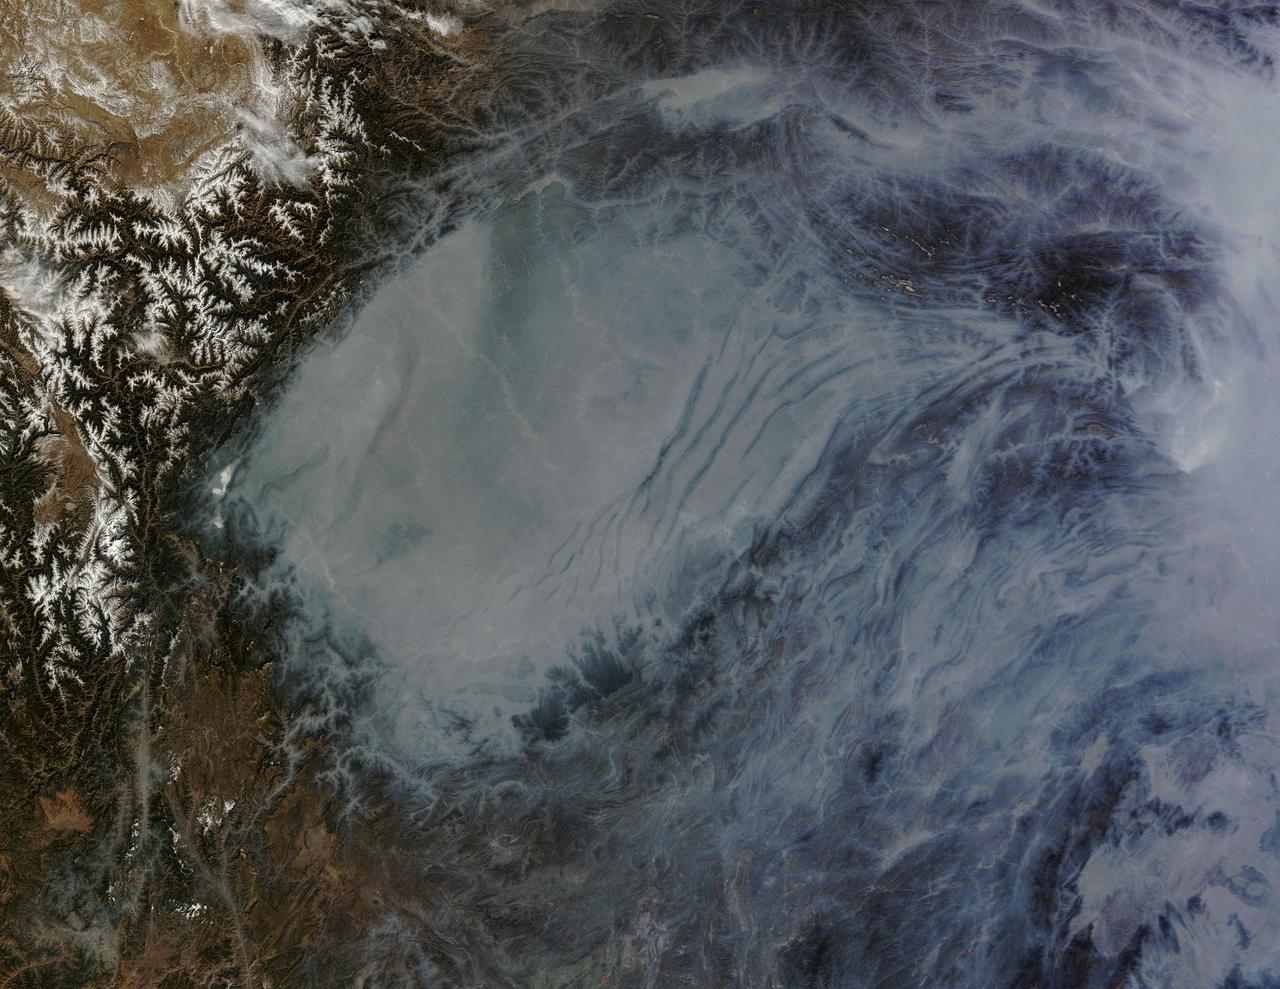
The skies over northern China were shrouded with a thick haze in late December, 2013. The Moderate Resolution Imaging Spectroradiometer (MODIS) aboard the Terra satellite captured this true-color image on December 23. The dense, gray haze obscures almost all the land and much of the coastal waters from view south and east of the Taihang Mountains. Clearer air covers the region north of the mountains, although fingers of haze roll through most river valleys. The cities of Beijing and Hebei, both west of the Bohai Sea are complete enshrouded. By December 24 the smog levels in some area exceeded World Health Organization-recommended levels by 30 times, according to Bloomberg News. The concentration of PM2.5, which are fine air particulates, were reported at 421 micrograms per cubic meter at 2 p.m. near Tiananmen Square in Beijing, while levels were 795 in Xi’an and 740 in Zhengzhou. The World Health Organization (WHO) recommends 24-hour exposure to PM2.5 concentrations no higher than 25 micrograms per cubic meter. While not the sole cause of haze and pollution, the use of coal as a very cheap energy source adds to the problem, particularly north of the Huai River. Prior to 1980, the government policy provided free coal for fuel boilers for all people living north of the Huai River. The widespread use of coal allows people in the north to stay warm in winter, but they have paid a price in air quality. According to Michael Greenstone, a Professor of Environmental Economics at Massachusetts Institute of Technology (MIT), whose research team published a paper on sustained exposure to air pollution on life expectancy in the region, air pollution, as measured by total suspended particulates, was about 55% higher north of the Huai River than south of it, for a difference of around 184 micrograms of particulate matter per cubic meter. The research, published in Proceedings of the National Academy of Sciences in July, 2013, also noted life expectancies were about 5.5 years lower in the north, owing to an increased incidence of cardiorespiratory mortality. Air pollution is an on-going issue for the government of China, and Beijing’s Five-Year Clean Air Action Plan aims to reduce overall particle density by over 25 percent on the PM2.5 scale by 2017, and also takes aim at shutting down all coal-burning plants. Credit: NASA/GSFC/Jeff Schmaltz/MODIS Land Rapid Response Team <b><a href="http://www.nasa.gov/audience/formedia/features/MP_Photo_Guidelines.html" rel="nofollow">NASA image use policy.</a></b> <b><a href="http://www.nasa.gov/centers/goddard/home/index.html" rel="nofollow">NASA Goddard Space Flight Center</a></b> enables NASA’s mission through four scientific endeavors: Earth Science, Heliophysics, Solar System Exploration, and Astrophysics. Goddard plays a leading role in NASA’s accomplishments by contributing compelling scientific knowledge to advance the Agency’s mission. <b>Follow us on <a href="http://twitter.com/NASA_GoddardPix" rel="nofollow">Twitter</a></b> <b>Like us on <a href="http://www.facebook.com/pages/Greenbelt-MD/NASA-Goddard/395013845897?ref=tsd" rel="nofollow">Facebook</a></b> <b>Find us on <a href="http://instagram.com/nasagoddard?vm=grid" rel="nofollow">Instagram</a></b>
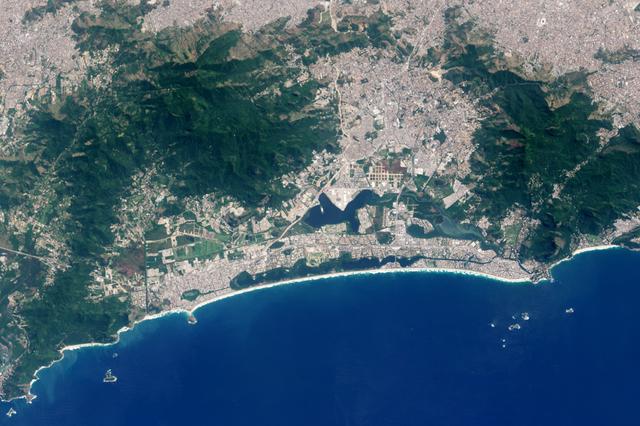
While gymnasts leap, cyclists pedal and divers twirl for Olympic gold in Rio de Janeiro, Brazil, several NASA Earth Observing satellites catch glimpses of the city and its surroundings from space. This image shows how Rio Olympic Park appeared to the Operational Land Imager (OLI), a sensor on Landsat 8, last September as the city prepared for the 2016 Summer Olympic Games. Image credit: Landsat 8/NASA Earth Observatory <b><a href="http://www.nasa.gov/audience/formedia/features/MP_Photo_Guidelines.html" rel="nofollow">NASA image use policy.</a></b> <b><a href="http://www.nasa.gov/centers/goddard/home/index.html" rel="nofollow">NASA Goddard Space Flight Center</a></b> enables NASA’s mission through four scientific endeavors: Earth Science, Heliophysics, Solar System Exploration, and Astrophysics. Goddard plays a leading role in NASA’s accomplishments by contributing compelling scientific knowledge to advance the Agency’s mission. <b>Follow us on <a href="http://twitter.com/NASAGoddardPix" rel="nofollow">Twitter</a></b> <b>Like us on <a href="http://www.facebook.com/pages/Greenbelt-MD/NASA-Goddard/395013845897?ref=tsd" rel="nofollow">Facebook</a></b> <b>Find us on <a href="http://instagrid.me/nasagoddard/?vm=grid" rel="nofollow">Instagram</a></b>
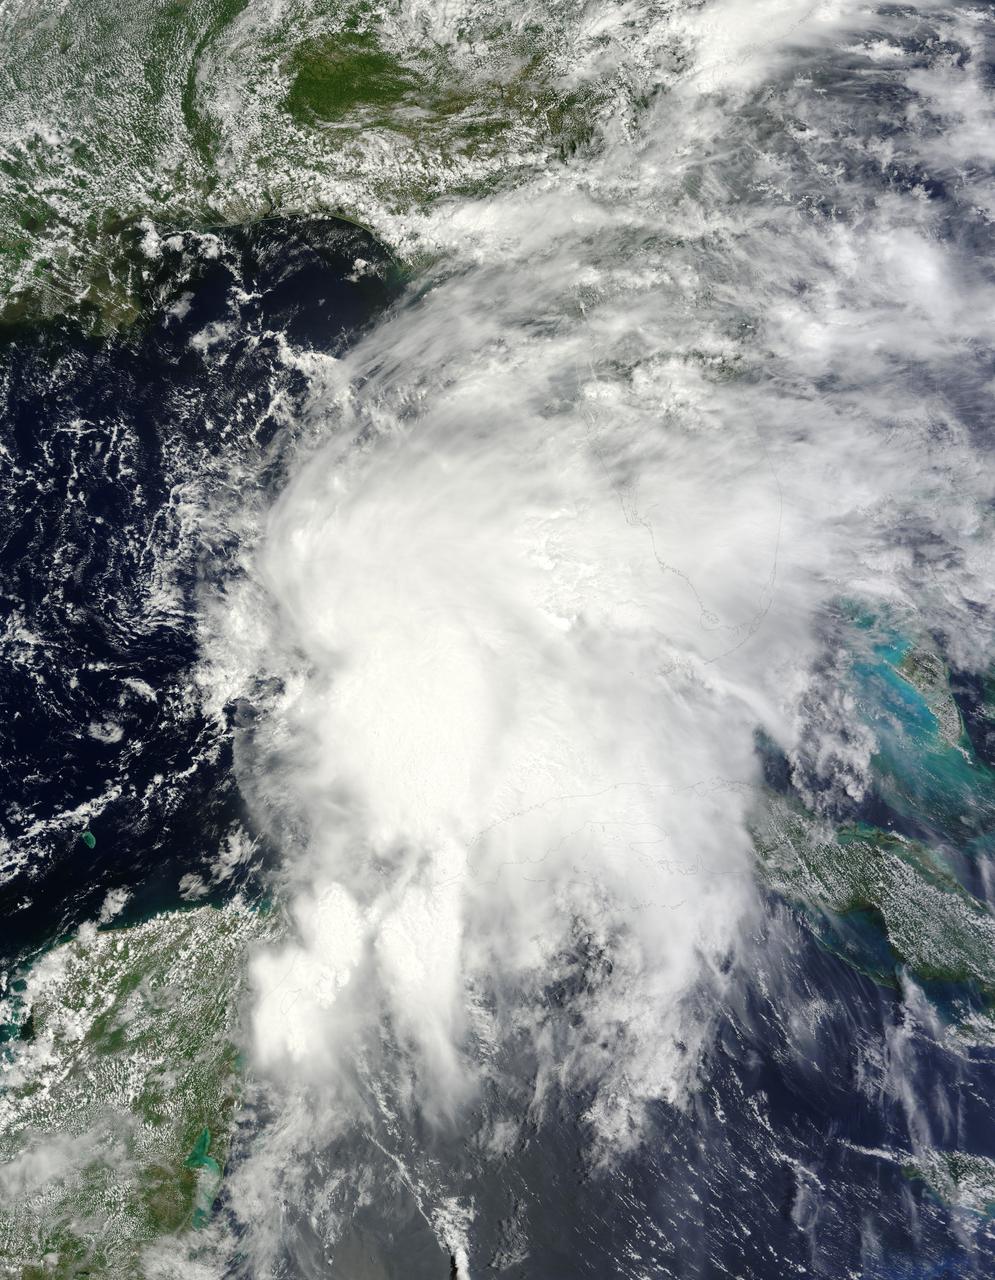
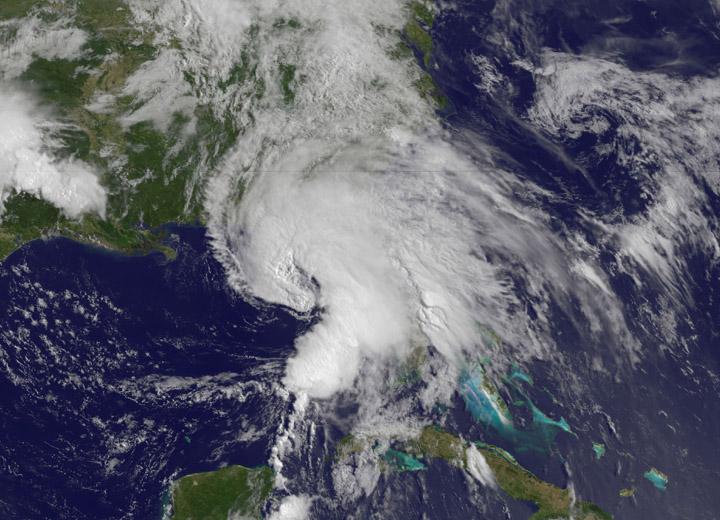
NASA’s Terra satellite passed over Tropical Storm Andrea on June 5 at 16:25 UTC (12:25 p.m. EDT) and the MODIS instrument captured this visible image of the storm. Andrea’s clouds had already extended over more than half of Florida. Credit: NASA Goddard MODIS Rapid Response Team --- NASA Sees Heavy Rainfall in Tropical Storm Andrea NASA’s TRMM satellite passed over Tropical Storm Andrea right after it was named, while NASA’s Terra satellite captured a visible image of the storm’s reach hours beforehand. TRMM measures rainfall from space and saw that rainfall rates in the southern part of the storm was falling at almost 5 inches per hour. NASA’s Terra satellite passed over Tropical Storm Andrea on June 5 at 16:25 UTC (12:25 p.m. EDT) and the Moderate Resolution Imaging Spectroradiometer or MODIS instrument, captured a visible image of the storm. At that time, Andrea’s clouds had already extended over more than half of Florida. At 8 p.m. EDT on Wednesday, June 5, System 91L became the first tropical storm of the Atlantic Ocean hurricane season. Tropical Storm Andrea was centered near 25.5 North and 86.5 West, about 300 miles (485 km) southwest of Tampa, Fla. At the time Andrea intensified into a tropical storm, its maximum sustained winds were near 40 mph (65 kph). Full updates can be found at NASA's Hurricane page: <a href="http://www.nasa.gov/hurricane" rel="nofollow">www.nasa.gov/hurricane</a> Rob Gutro NASA’s Goddard Space Flight Center
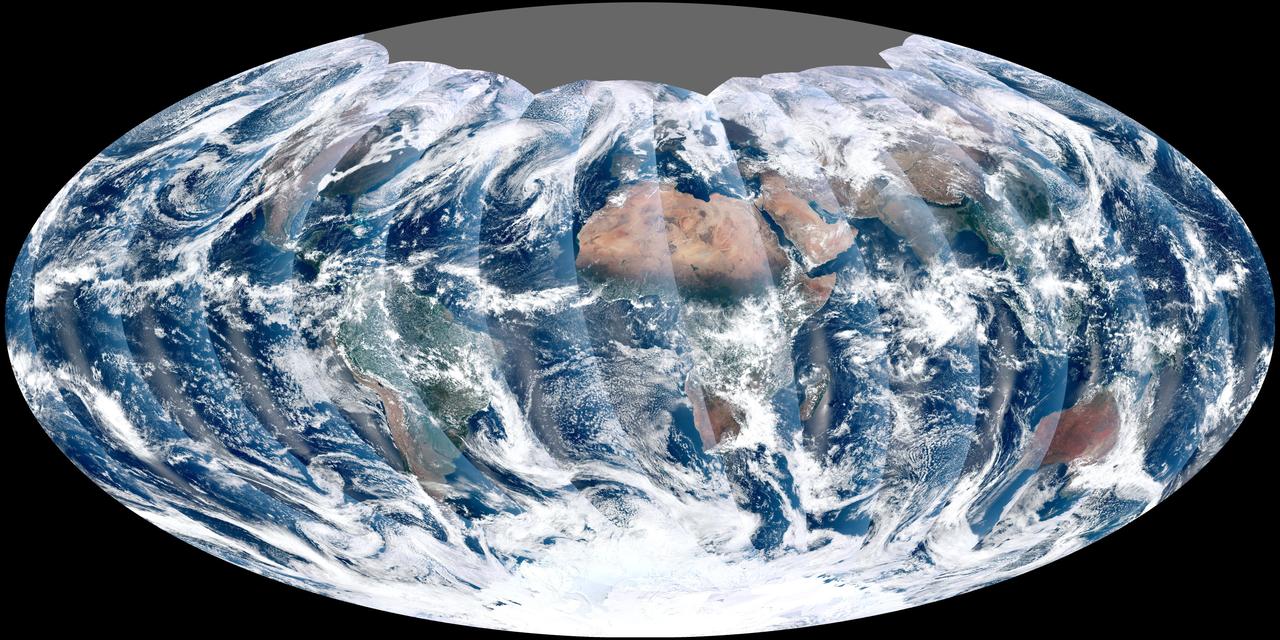
NASA acquired November 24, 2011 From its vantage 824 kilometers (512 miles) above Earth, the Visible Infrared Imager Radiometer Suite (VIIRS) on the NPOESS Preparatory Project (NPP) satellite gets a complete view of our planet every day. This image from November 24, 2011, is the first complete global image from VIIRS. The NPP satellite launched on October 28, 2011, and VIIRS acquired its first measurements on November 21. To date, the images are preliminary, used to gauge the health of the sensor as engineers continue to power it up for full operation. Rising from the south and setting in the north on the daylight side of Earth, VIIRS images the surface in long wedges measuring 3,000 kilometers (1,900 miles) across. The swaths from each successive orbit overlap one another, so that at the end of the day, the sensor has a complete view of the globe. The Arctic is missing because it is too dark to view in visible light during the winter. The NPP satellite was placed in a Sun-synchronous orbit, a unique path that takes the satellite over the equator at the same local (ground) time in every orbit. So, when NPP flies over Kenya, it is about 1:30 p.m. on the ground. When NPP reaches Gabon—about 3,000 kilometers to the west—on the next orbit, it is close to 1:30 p.m. on the ground. This orbit allows the satellite to maintain the same angle between the Earth and the Sun so that all images have similar lighting. The consistent lighting is evident in the daily global image. Stripes of sunlight (sunglint) reflect off the ocean in the same place on the left side of every swath. The consistent angle is important because it allows scientists to compare images from year to year without worrying about extreme changes in shadows and lighting. The image also shows a band of haze along the right side of every orbit swath. When light travels through the atmosphere, it bounces off particles or scatters, making the atmosphere look hazy. The scattering effect is most pronounced along the edge of the swath, where the sensor is looking at an angle through more of the atmosphere. Scientists can correct for this scattering effect, but need measurements from a range of wavelengths to do so. The degree to which light scatters depends partly on the wavelength of the light. Blue light scatters more than red light, for example, which is why the sky is blue. VIIRS measures 22 different wavelengths of light, but not all of the sensor’s detectors are operating at peak performance yet. Those measuring thermal infrared light are not yet cold enough to collect reliable measurements. Once VIIRS begins full operations, it will produce a range of measurements from ocean temperature to clouds to the locations of fires. These measurements will help extend the record from earlier sensors like the Moderate Resolution Imaging Spectroradiometer (MODIS). VIIRS is very similar to MODIS, but flies at a higher altitude to measure the whole planet without gaps. (MODIS daily measurements have gaps at the equator. See the MODIS image from November 24.) VIIRS also sees the Earth in less detail, 375 meters per pixel, compared to 250 meters per pixel for MODIS. Image by NASA’s NPP Land Product Evaluation and Testing Element. Caption by Holli Riebeek. Credit: <b><a href="http://www.earthobservatory.nasa.gov/" rel="nofollow"> NASA Earth Observatory</a></b> <b><a href="http://www.nasa.gov/audience/formedia/features/MP_Photo_Guidelines.html" rel="nofollow">NASA image use policy.</a></b> <b><a href="http://www.nasa.gov/centers/goddard/home/index.html" rel="nofollow">NASA Goddard Space Flight Center</a></b> enables NASA’s mission through four scientific endeavors: Earth Science, Heliophysics, Solar System Exploration, and Astrophysics. Goddard plays a leading role in NASA’s accomplishments by contributing compelling scientific knowledge to advance the Agency’s mission. <b>Follow us on <a href="http://twitter.com/NASA_GoddardPix" rel="nofollow">Twitter</a></b> <b>Like us on <a href="http://www.facebook.com/pages/Greenbelt-MD/NASA-Goddard/395013845897?ref=tsd" rel="nofollow">Facebook</a></b> <b>Find us on <a href="http://instagrid.me/nasagoddard/?vm=grid" rel="nofollow">Instagram</a></b>
On most days, relentless rivers of clouds wash over Alaska, obscuring most of the state’s 6,640 miles (10,690 kilometers) of coastline and 586,000 square miles (1,518,000 square kilometers) of land. The south coast of Alaska even has the dubious distinction of being the cloudiest region of the United States, with some locations averaging more than 340 cloudy days per year. That was certainly not the case on June 17, 2013, the date that the Moderate Resolution Imaging Spectroradiometer (MODIS) on NASA’s Terra satellite acquired this rare, nearly cloud-free view of the state. The absence of clouds exposed a striking tapestry of water, ice, land, forests, and even wildfires. Snow-covered mountains such as the Alaska Range and Chugach Mountains were visible in southern Alaska, while the arc of mountains that make up the Brooks Range dominated the northern part of the state. The Yukon River—the longest in Alaska and the third longest in the United States—wound its way through the green boreal forests that inhabit the interior of the state. Plumes of sediment and glacial dust poured into the Gulf of Alaska from the Copper River. And Iliamna Lake, the largest in Alaska, was ice free. The same ridge of high pressure that cleared Alaska’s skies also brought stifling temperatures to many areas accustomed to chilly June days. Talkeetna, a town about 100 miles north of Anchorage, saw temperatures reach 96°F (36°C) on June 17. Other towns in southern Alaska set all-time record highs, including Cordova, Valez, and Seward. The high temperatures also helped fuel wildfires and hastened the breakup of sea ice in the Chukchi Sea. NASA image courtesy Jeff Schmaltz, LANCE MODIS Rapid Response Team at NASA GSFC. Caption by Adam Voiland. Instrument: Terra - MODIS More info: <a href="http://1.usa.gov/102MAEj" rel="nofollow">1.usa.gov/102MAEj</a> Credit: <b><a href="http://www.earthobservatory.nasa.gov/" rel="nofollow"> NASA Earth Observatory</a></b> <b><a href="http://www.nasa.gov/audience/formedia/features/MP_Photo_Guidelines.html" rel="nofollow">NASA image use policy.</a></b> <b><a href="http://www.nasa.gov/centers/goddard/home/index.html" rel="nofollow">NASA Goddard Space Flight Center</a></b> enables NASA’s mission through four scientific endeavors: Earth Science, Heliophysics, Solar System Exploration, and Astrophysics. Goddard plays a leading role in NASA’s accomplishments by contributing compelling scientific knowledge to advance the Agency’s mission. <b>Follow us on <a href="http://twitter.com/NASA_GoddardPix" rel="nofollow">Twitter</a></b> <b>Like us on <a href="http://www.facebook.com/pages/Greenbelt-MD/NASA-Goddard/395013845897?ref=tsd" rel="nofollow">Facebook</a></b> <b>Find us on <a href="http://instagram.com/nasagoddard?vm=grid" rel="nofollow">Instagram</a></b>
The Moderate Resolution Imaging Spectroradiometer (MODIS) on NASA’s Terra satellite acquired this natural-color image of central China on January 23, 2013 at 04:05 UTC. The image shows extensive haze over the region. In areas where the ground is visible, some of the landscape is covered with lingering snow. Credit: NASA/GSFC/Jeff Schmaltz/MODIS Land Rapid Response Team <b><a href="http://www.nasa.gov/audience/formedia/features/MP_Photo_Guidelines.html" rel="nofollow">NASA image use policy.</a></b> <b><a href="http://www.nasa.gov/centers/goddard/home/index.html" rel="nofollow">NASA Goddard Space Flight Center</a></b> enables NASA’s mission through four scientific endeavors: Earth Science, Heliophysics, Solar System Exploration, and Astrophysics. Goddard plays a leading role in NASA’s accomplishments by contributing compelling scientific knowledge to advance the Agency’s mission. <b>Follow us on <a href="http://twitter.com/NASAGoddardPix" rel="nofollow">Twitter</a></b> <b>Like us on <a href="http://www.facebook.com/pages/Greenbelt-MD/NASA-Goddard/395013845897?ref=tsd" rel="nofollow">Facebook</a></b> <b>Find us on <a href="http://instagram.com/nasagoddard?vm=grid" rel="nofollow">Instagram</a></b>
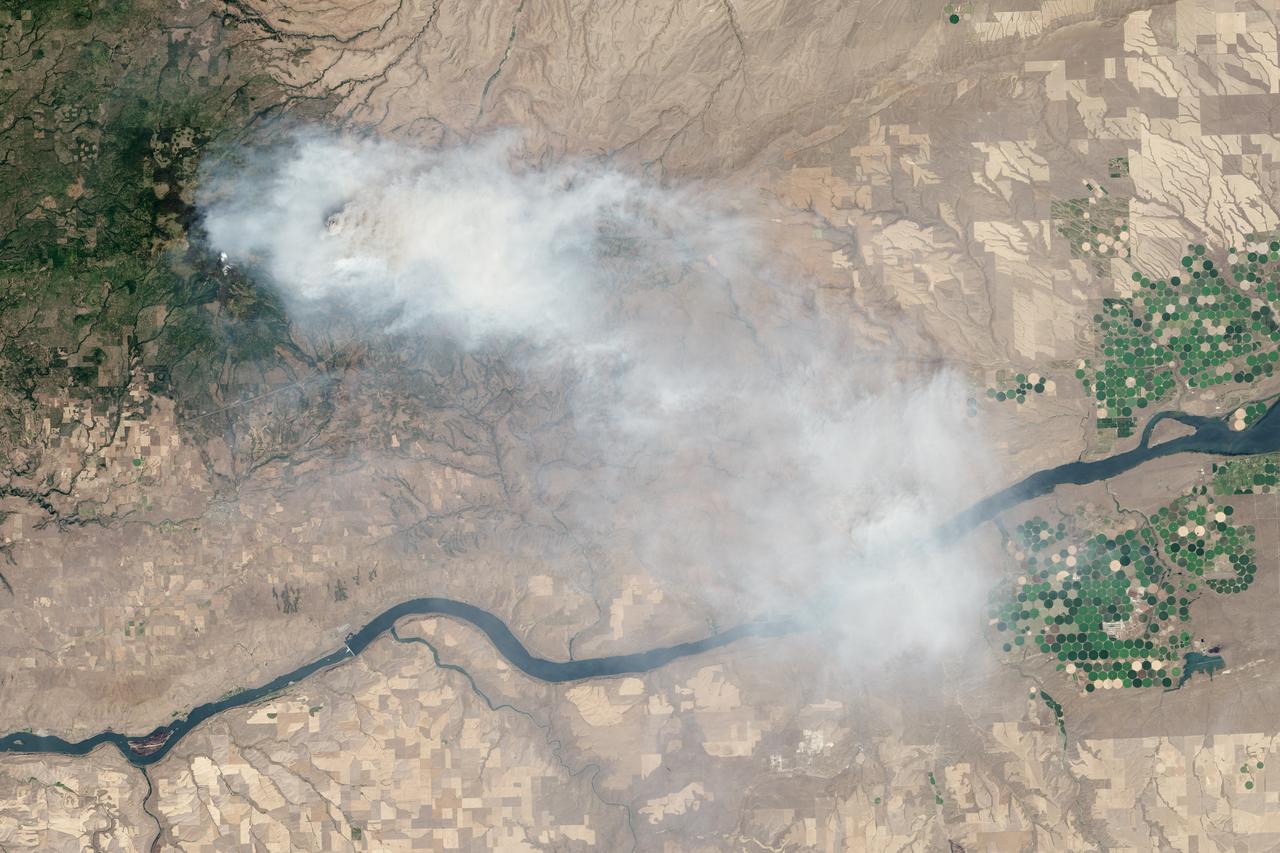
Eight major wildfires burned through forests and grasslands in the Pacific Northwest in late-July 2013, threatening homes and forcing road closings and evacuations. Many parts of Washington and Oregon faced extreme fire threats, as strong thunderstorms lined up to hit parched forests and grasslands with lightning. On July 28, 2013, the Operational Land Imager (OLI) on Landsat 8 captured these images of the Mile Marker 28 fire in the Simcoe Mountains northeast of Goldendale, Washington. Smoke blew east toward Kennewick, Pasco, and Richland. The lower image shows a closer view of smoke billowing up from the most active part of the fire. Ignited on July 24, 2013, the fire charred more than 22,000 acres (8,900 hectares) by July 30, when more than 1,000 firefighters achieved 40 percent containment. The blaze forced the evacuation of dozens of homes and the closure of US Highway 97. Through July 25, 450 wildfires had burned 10,220 acres (4,136 hectares) in Washington, while Oregon saw 603 fires that burned 63,135 acres (25,549 hectares). In all, 2.3 million acres burned across the United States by late-July, below the national average. Over the past ten years, an average of 4.2 million acres had burned in the United States by the end of each July. While coastal and western Washington receive heavy rain throughout the year, the rain shadow caused by the Cascades leaves central Washington quite dry. The mountains force moist air from the Pacific to rise, causing it to cool and condense into rain or snow on the windward side of the Cascades. So little moisture is left by the time air passes over the Cascades, that the area around Mile Marker 28 typically receives just 8 inches (20 centimeters) of precipitation per year. NASA Earth Observatory image by Jesse Allen and Robert Simmon, using Landsat data from the U.S. Geological Survey. Caption by Adam Voiland Instrument: Landsat 8 - OLI More info: <a href="http://earthobservatory.nasa.gov/IOTD/view.php?id=81738" rel="nofollow">earthobservatory.nasa.gov/IOTD/view.php?id=81738</a> Credit: <b><a href="http://www.earthobservatory.nasa.gov/" rel="nofollow"> NASA Earth Observatory</a></b> <b><a href="http://www.nasa.gov/audience/formedia/features/MP_Photo_Guidelines.html" rel="nofollow">NASA image use policy.</a></b> <b><a href="http://www.nasa.gov/centers/goddard/home/index.html" rel="nofollow">NASA Goddard Space Flight Center</a></b> enables NASA’s mission through four scientific endeavors: Earth Science, Heliophysics, Solar System Exploration, and Astrophysics. Goddard plays a leading role in NASA’s accomplishments by contributing compelling scientific knowledge to advance the Agency’s mission. <b>Follow us on <a href="http://twitter.com/NASA_GoddardPix" rel="nofollow">Twitter</a></b> <b>Like us on <a href="http://www.facebook.com/pages/Greenbelt-MD/NASA-Goddard/395013845897?ref=tsd" rel="nofollow">Facebook</a></b> <b>Find us on <a href="http://instagram.com/nasagoddard?vm=grid" rel="nofollow">Instagram</a></b>
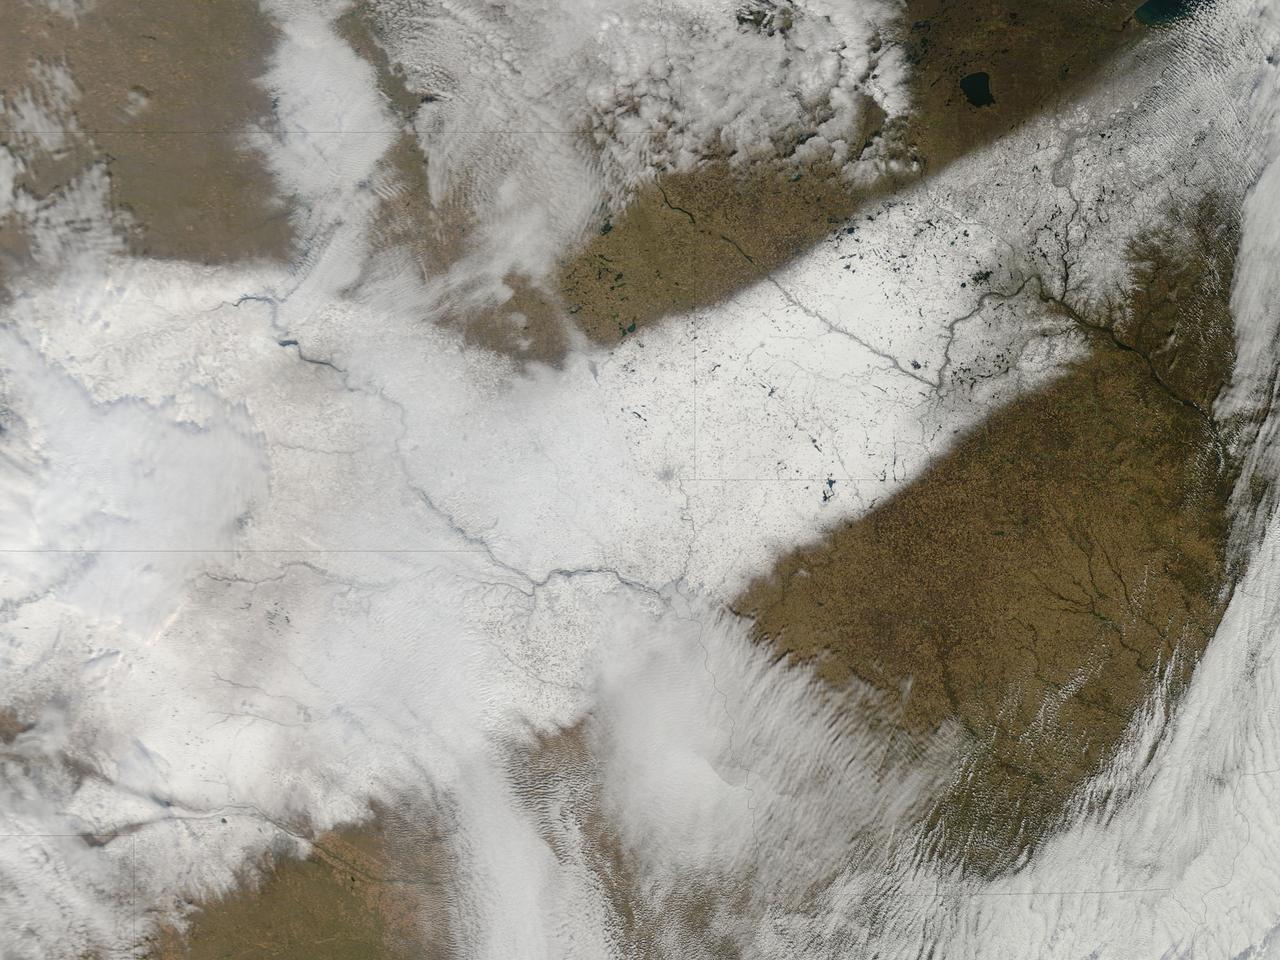
An autumn storm brought the first snow of the season to the Upper Mississippi River Valley and the Midwestern United States in early November, 2013. The Moderate Resolution Imaging Spectroradiometer (MODIS) aboard NASA’s Terra satellite captured this true color image on November 6 just as the storm was clearing. A long band of snow stretching from Colorado in the southwest to Wisconsin in the northeast marked the path of the blowing storm. According to WeatherBug, up to 10 inches blanketed Gordon, Nebraska and Pipestone, Minnesota. Most snow totals in the Central and Northern Plains and Upper Mississippi Valley ranged from 2-5 inches, while Minneapolis-St. Paul metro area picked up 1-2 inches of new snow from the event. Credit: NASA/GSFC/Jeff Schmaltz/MODIS Land Rapid Response Team <b><a href="http://www.nasa.gov/audience/formedia/features/MP_Photo_Guidelines.html" rel="nofollow">NASA image use policy.</a></b> <b><a href="http://www.nasa.gov/centers/goddard/home/index.html" rel="nofollow">NASA Goddard Space Flight Center</a></b> enables NASA’s mission through four scientific endeavors: Earth Science, Heliophysics, Solar System Exploration, and Astrophysics. Goddard plays a leading role in NASA’s accomplishments by contributing compelling scientific knowledge to advance the Agency’s mission. <b>Follow us on <a href="http://twitter.com/NASA_GoddardPix" rel="nofollow">Twitter</a></b> <b>Like us on <a href="http://www.facebook.com/pages/Greenbelt-MD/NASA-Goddard/395013845897?ref=tsd" rel="nofollow">Facebook</a></b> <b>Find us on <a href="http://instagram.com/nasagoddard?vm=grid" rel="nofollow">Instagram</a></b>
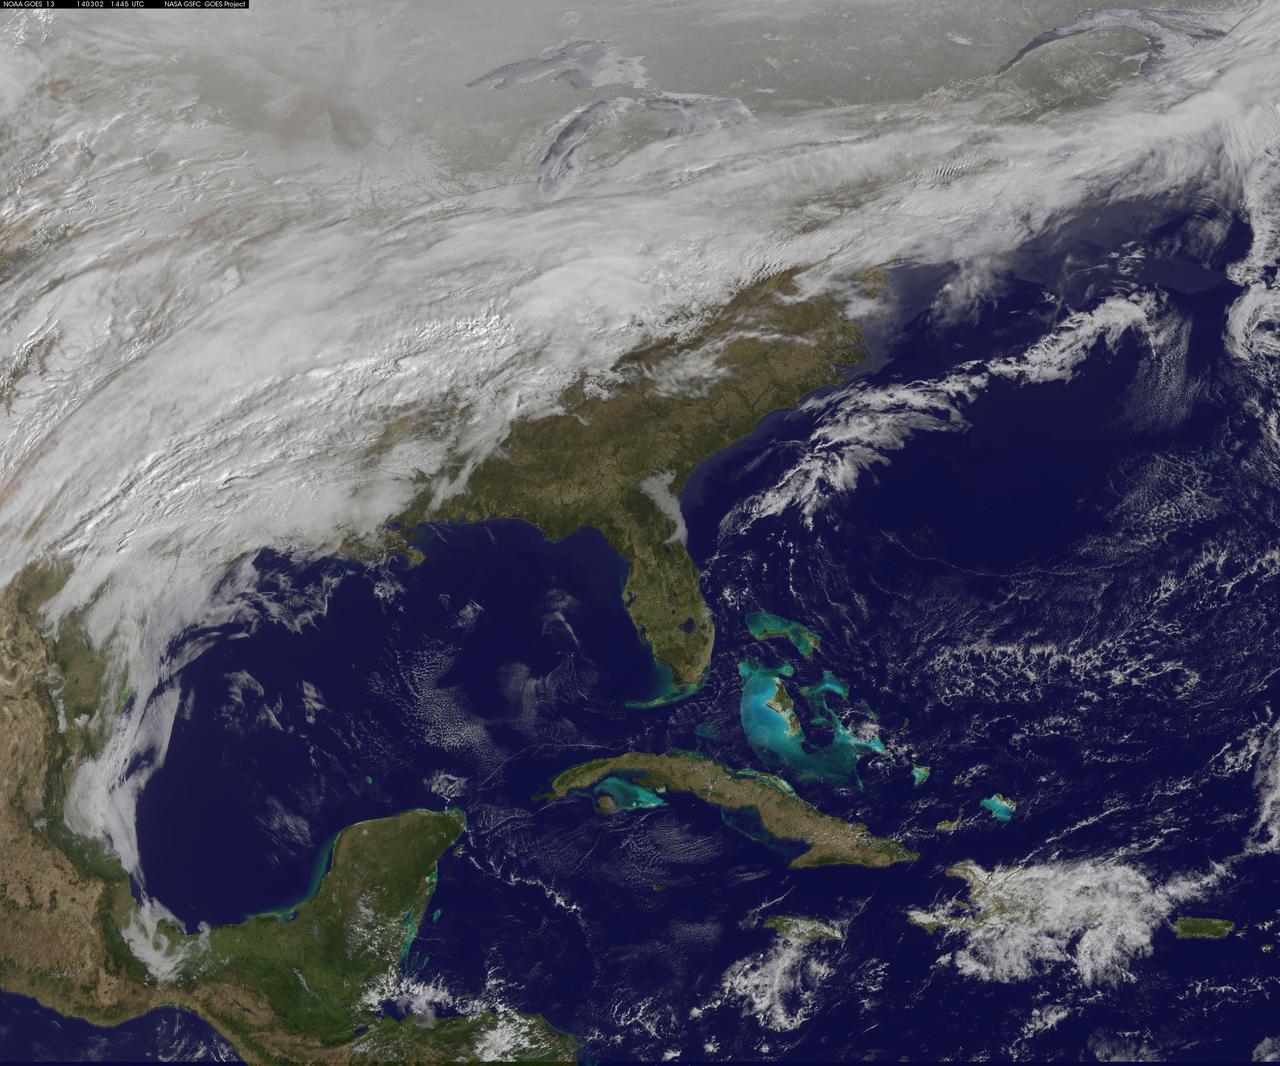
A major winter storm is poised to wallop the Mid-Atlantic and bring large amounts of snow to cities including Baltimore, Md., Washington, D.C. area on March 2 and 3, according to NOAA's National Weather Service. NOAA's GOES-East satellite captured this image of the clouds associated with the winter storm as it continued moving east toward those cities. On March 2, the National Weather Prediction Center in College Park, Md. noted that there is a slight risk for severe thunderstorms over parts of the western Gulf Coast and the Lower Mississippi Valley as a result of the southern portion of the system. The update at 7 a.m. EST noted that freezing rain/sleet is possible over parts of the lower Mississippi Valley and parts of the central Appalachians, while eastern Texas and the lower Mississippi Valley into the Ohio Valley are expected to experience heavy rain. The NWS Short Range Forecast Discussion stated "A strong storm over the Southern Plains/Lower Mississippi Valley will advance northeastward along a quasi-stationary front to off the Southern Mid-Atlantic Coast by Monday evening. Moisture from the Gulf of Mexico will overrun and pool along the associated front producing an area of snow extending from the Central Plains into the Northeast." The clouds are associated with a cold from that stretches from eastern Maine through Maryland and west into the Tennessee Valley. The low pressure center associated with the front was located over Arkansas. At NASA/NOAA's GOES Project at NASA's Goddard Space Flight Center in Greenbelt, Md. the cloud data from NOAA's GOES-East satellite were overlaid on a true-color image of land and ocean created by data from the Moderate Resolution Imaging Spectroradiometer or MODIS instrument that flies aboard NASA's Aqua and Terra satellites. Together, those data created the entire picture of the position of this major winter storm. GOES satellites provide the kind of continuous monitoring necessary for intensive data analysis. Geostationary describes an orbit in which a satellite is always in the same position with respect to the rotating Earth. This allows GOES to hover continuously over one position on Earth's surface, appearing stationary. As a result, GOES provide a constant vigil for the atmospheric "triggers" for severe weather conditions such as tornadoes, flash floods, hail storms and hurricanes. For updated information about the storm system, visit NOAA's NWS website: <a href="http://www.weather.gov" rel="nofollow">www.weather.gov</a> For more information about GOES satellites, visit: <a href="http://www.goes.noaa.gov/" rel="nofollow">www.goes.noaa.gov/</a> or <a href="http://goes.gsfc.nasa.gov/" rel="nofollow">goes.gsfc.nasa.gov/</a> Rob Gutro NASA Goddard Space Flight Center, Greenbelt, Md. <b><a href="http://www.nasa.gov/audience/formedia/features/MP_Photo_Guidelines.html" rel="nofollow">NASA image use policy.</a></b> <b><a href="http://www.nasa.gov/centers/goddard/home/index.html" rel="nofollow">NASA Goddard Space Flight Center</a></b> enables NASA’s mission through four scientific endeavors: Earth Science, Heliophysics, Solar System Exploration, and Astrophysics. Goddard plays a leading role in NASA’s accomplishments by contributing compelling scientific knowledge to advance the Agency’s mission. <b>Follow us on <a href="http://twitter.com/NASAGoddardPix" rel="nofollow">Twitter</a></b> <b>Like us on <a href="http://www.facebook.com/pages/Greenbelt-MD/NASA-Goddard/395013845897?ref=tsd" rel="nofollow">Facebook</a></b> <b>Find us on <a href="http://instagram.com/nasagoddard?vm=grid" rel="nofollow">Instagram</a></b>
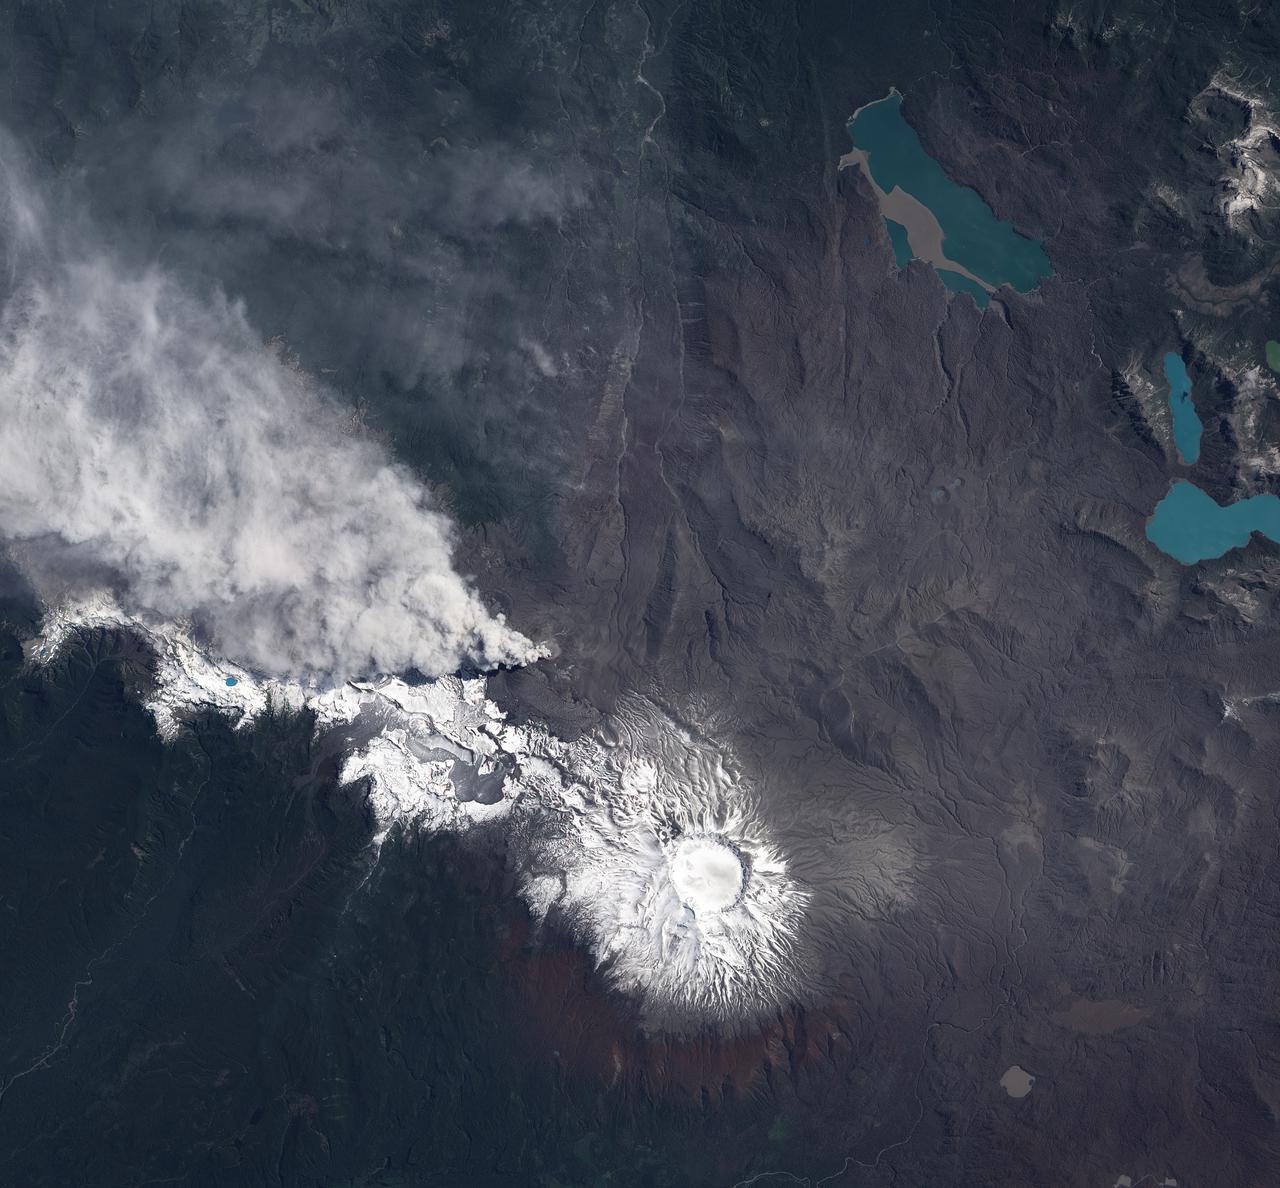
NASA image acquired December 23, 2011 In early June 2011, Chile’s Puyehue-Cordón Caulle Volcano erupted explosively, sending volcanic ash around the Southern Hemisphere. In late December 2011, activity at the volcano had calmed, but volcanic ash and steam continued to pour through the fissure that opened several months earlier. The Advanced Land Imager (ALI) on NASA’s Earth Observing-1 (EO-1) satellite captured this natural-color image on December 23, 2011. The active fissure lies northwest of the Puyehue caldera, and a plume blows from the fissure toward the west and north. This image shows not just ash but also snow on the volcano surface, including the caldera. Because volcanic ash regularly coats the land surface, the pristine snow probably fell recently. In a bulletin issued December 26, 2011, Chile’s Servicio Nacional de Geología y Minería (SERNAGEOMIN) characterized the activity over the previous 24 hours as a minor eruption of low intensity. Reaching an altitude of 2,236 meters (7,336 feet), Puyehue-Cordón Caulle is a stratovolcano, a steep-sloped, conical volcano composed of layers of ash, lava, and rocks released by previous eruptions. This volcano comprises part of the largest active geothermal area in the southern Andes. NASA Earth Observatory image created by Jesse Allen, using EO-1 ALI data provided courtesy of the NASA EO-1 team. Caption by Michon Scott. Instrument: EO-1 - ALI To view more images from this event go here: <a href="http://earthobservatory.nasa.gov/NaturalHazards/event.php?id=50859" rel="nofollow">earthobservatory.nasa.gov/NaturalHazards/event.php?id=50859</a> Credit: <b><a href="http://www.earthobservatory.nasa.gov/" rel="nofollow"> NASA Earth Observatory</a></b> <b><a href="http://www.nasa.gov/audience/formedia/features/MP_Photo_Guidelines.html" rel="nofollow">NASA image use policy.</a></b> <b><a href="http://www.nasa.gov/centers/goddard/home/index.html" rel="nofollow">NASA Goddard Space Flight Center</a></b> enables NASA’s mission through four scientific endeavors: Earth Science, Heliophysics, Solar System Exploration, and Astrophysics. Goddard plays a leading role in NASA’s accomplishments by contributing compelling scientific knowledge to advance the Agency’s mission. <b>Follow us on <a href="http://twitter.com/NASA_GoddardPix" rel="nofollow">Twitter</a></b> <b>Like us on <a href="http://www.facebook.com/pages/Greenbelt-MD/NASA-Goddard/395013845897?ref=tsd" rel="nofollow">Facebook</a></b> <b>Find us on <a href="http://instagrid.me/nasagoddard/?vm=grid" rel="nofollow">Instagram</a></b>
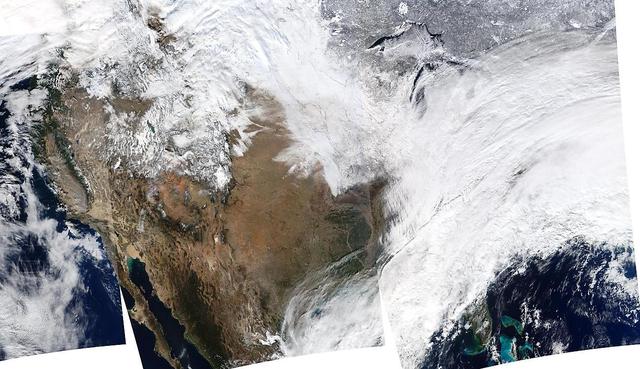
On January 2, 2014, NASA’s Aqua satellite passed over the United States mutiple times showing winter weather, allowing the Moderate Resolution Imaging Spectroradiometer (MODIS) on board to capture this true-color image of a massive winter storm moving up the eastern seaboard. According to the National Weather Service the winter storm that impacted the Midwest and Northeast over the past couple of days is moving into the Atlantic Friday. Very cold temperatures and dangerous wind chills are moving in behind the system. The next storm is forming, and will bring blizzard conditions to the northern Plains Friday Night into Saturday. Extreme wind chills to -55 F are possible in the northern Plains this weekend. Credit: NASA/GSFC/Aqua/MODIS <b><a href="http://www.nasa.gov/audience/formedia/features/MP_Photo_Guidelines.html" rel="nofollow">NASA image use policy.</a></b> <b><a href="http://www.nasa.gov/centers/goddard/home/index.html" rel="nofollow">NASA Goddard Space Flight Center</a></b> enables NASA’s mission through four scientific endeavors: Earth Science, Heliophysics, Solar System Exploration, and Astrophysics. Goddard plays a leading role in NASA’s accomplishments by contributing compelling scientific knowledge to advance the Agency’s mission. <b>Follow us on <a href="http://twitter.com/NASA_GoddardPix" rel="nofollow">Twitter</a></b> <b>Like us on <a href="http://www.facebook.com/pages/Greenbelt-MD/NASA-Goddard/395013845897?ref=tsd" rel="nofollow">Facebook</a></b> <b>Find us on <a href="http://instagrid.me/nasagoddard/?vm=grid" rel="nofollow">Instagram</a></b>
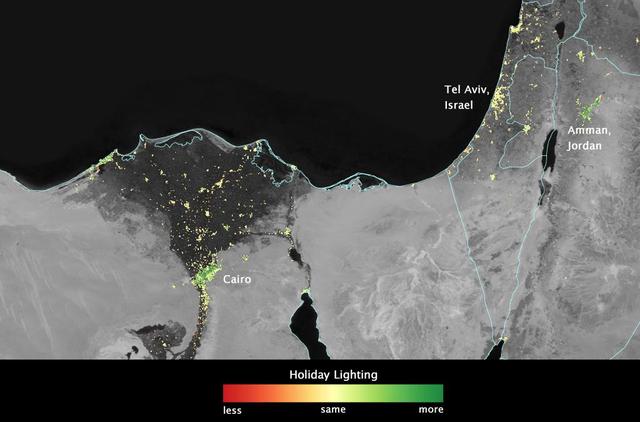
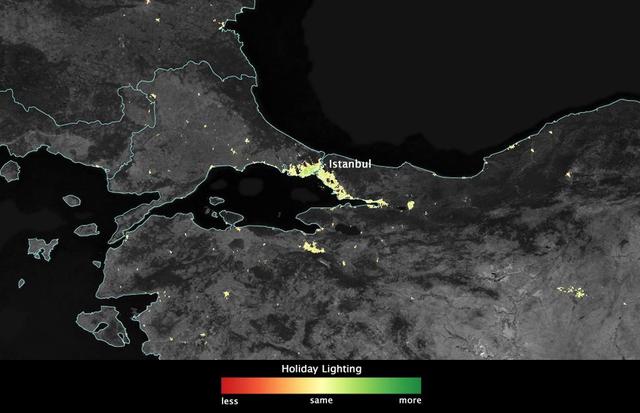
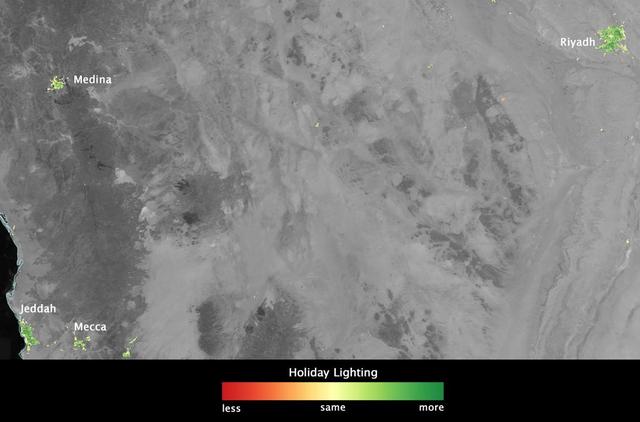
In several cities in the Middle East, city lights brighten during the Muslim holy month of Ramadan, as seen using a new analysis of daily data from the NASA-NOAA Suomi NPP satellite. Dark green pixels are areas where the lights are 50 percent brighter, or more, during Ramadan. Credit: Jesse Allen, NASA’s Earth Observatory Read more: <a href="http://www.nasa.gov/content/goddard/satellite-sees-holiday-lights-brighten-cities" rel="nofollow">www.nasa.gov/content/goddard/satellite-sees-holiday-light...</a> <b><a href="http://www.nasa.gov/audience/formedia/features/MP_Photo_Guidelines.html" rel="nofollow">NASA image use policy.</a></b> <b><a href="http://www.nasa.gov/centers/goddard/home/index.html" rel="nofollow">NASA Goddard Space Flight Center</a></b> enables NASA’s mission through four scientific endeavors: Earth Science, Heliophysics, Solar System Exploration, and Astrophysics. Goddard plays a leading role in NASA’s accomplishments by contributing compelling scientific knowledge to advance the Agency’s mission. <b>Follow us on <a href="http://twitter.com/NASAGoddardPix" rel="nofollow">Twitter</a></b> <b>Like us on <a href="http://www.facebook.com/pages/Greenbelt-MD/NASA-Goddard/395013845897?ref=tsd" rel="nofollow">Facebook</a></b> <b>Find us on <a href="http://instagram.com/nasagoddard?vm=grid" rel="nofollow">Instagram</a></b>
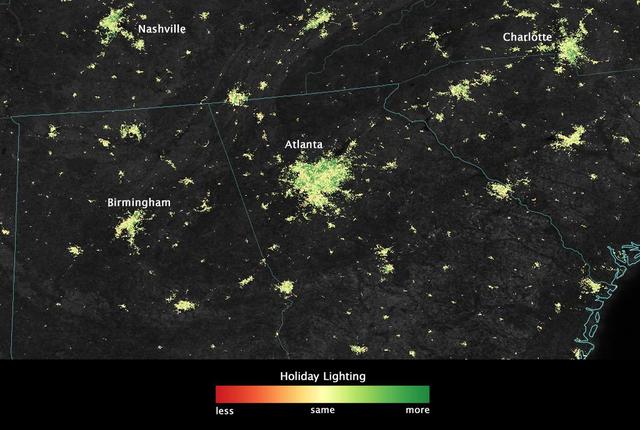
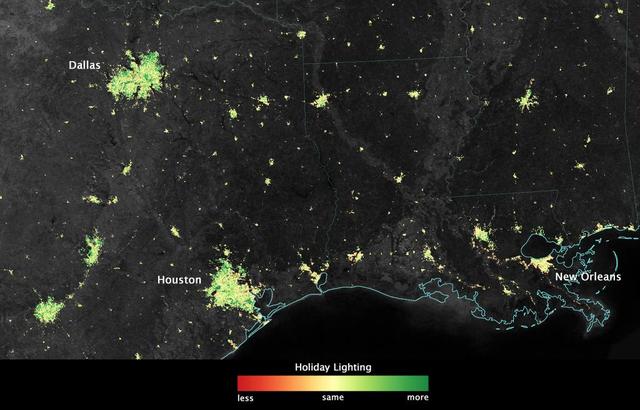
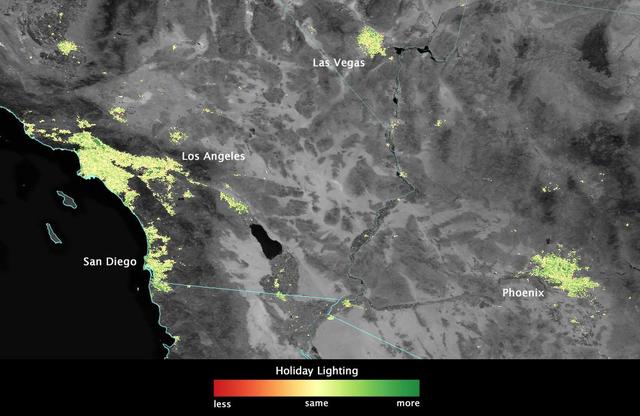
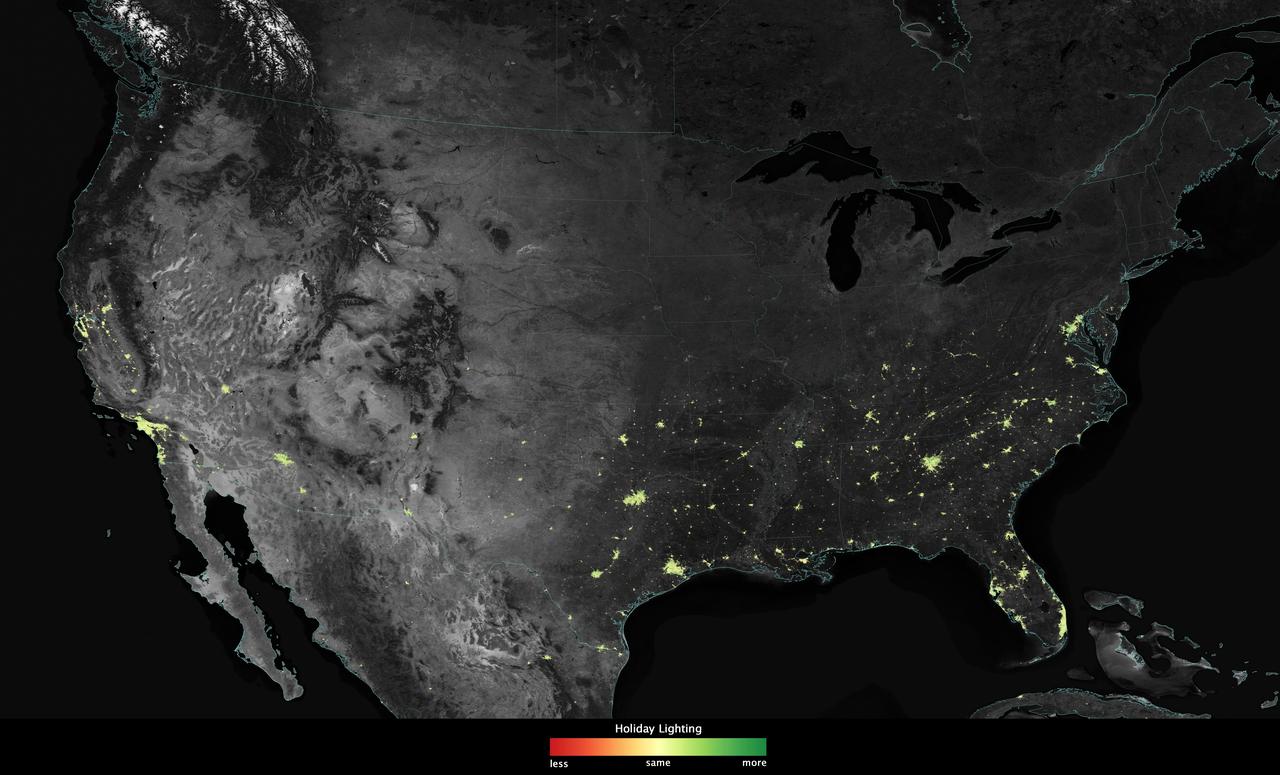
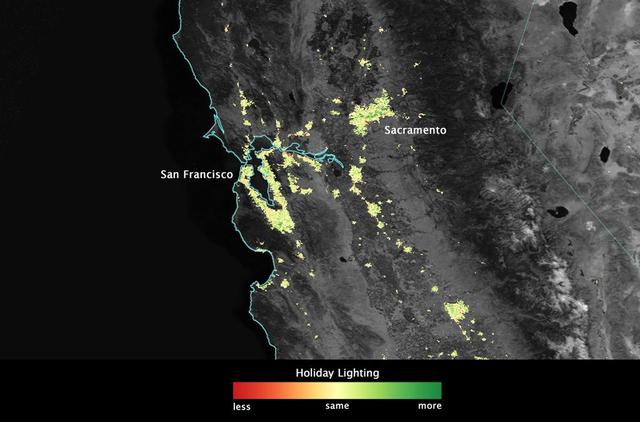
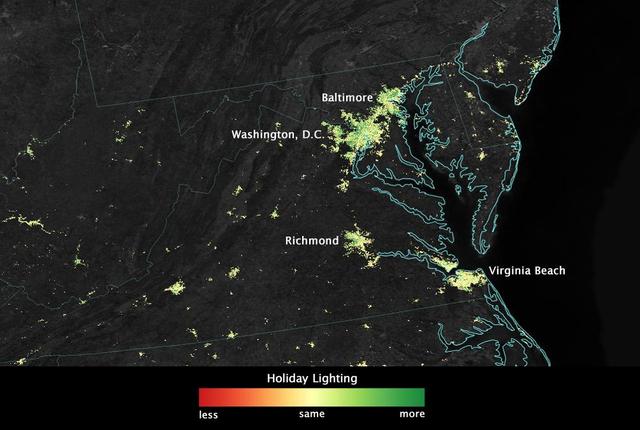
City lights shine brighter during the holidays in the United States when compared with the rest of the year, as shown using a new analysis of daily data from the NASA-NOAA Suomi NPP satellite. Dark green pixels are areas where lights are 50 percent brighter, or more, during December. Because snow reflects so much light, the researchers could only analyze snow-free cities. They focused on the U.S. West Coast from San Francisco and Los Angeles, and cities south of a rough imaginary line from St. Louis to Washington, D.C. Credit: Jesse Allen, NASA’s Earth Observatory Read more: <a href="http://www.nasa.gov/content/goddard/satellite-sees-holiday-lights-brighten-cities." rel="nofollow">www.nasa.gov/content/goddard/satellite-sees-holiday-light...</a>.<b><a href="http://www.nasa.gov/audience/formedia/features/MP_Photo_Guidelines.html" rel="nofollow">NASA image use policy.</a></b> <b><a href="http://www.nasa.gov/centers/goddard/home/index.html" rel="nofollow">NASA Goddard Space Flight Center</a></b> enables NASA’s mission through four scientific endeavors: Earth Science, Heliophysics, Solar System Exploration, and Astrophysics. Goddard plays a leading role in NASA’s accomplishments by contributing compelling scientific knowledge to advance the Agency’s mission. <b>Follow us on <a href="http://twitter.com/NASAGoddardPix" rel="nofollow">Twitter</a></b> <b>Like us on <a href="http://www.facebook.com/pages/Greenbelt-MD/NASA-Goddard/395013845897?ref=tsd" rel="nofollow">Facebook</a></b> <b>Find us on <a href="http://instagram.com/nasagoddard?vm=grid" rel="nofollow">Instagram</a></b>
In several cities in the Middle East, city lights brighten during the Muslim holy month of Ramadan, as seen using a new analysis of daily data from the NASA-NOAA Suomi NPP satellite. Dark green pixels are areas where the lights are 50 percent brighter, or more, during Ramadan. Credit: Jesse Allen, NASA’s Earth Observatory Read more: <a href="http://www.nasa.gov/content/goddard/satellite-sees-holiday-lights-brighten-cities" rel="nofollow">www.nasa.gov/content/goddard/satellite-sees-holiday-light...</a> <b><a href="http://www.nasa.gov/audience/formedia/features/MP_Photo_Guidelines.html" rel="nofollow">NASA image use policy.</a></b> <b><a href="http://www.nasa.gov/centers/goddard/home/index.html" rel="nofollow">NASA Goddard Space Flight Center</a></b> enables NASA’s mission through four scientific endeavors: Earth Science, Heliophysics, Solar System Exploration, and Astrophysics. Goddard plays a leading role in NASA’s accomplishments by contributing compelling scientific knowledge to advance the Agency’s mission. <b>Follow us on <a href="http://twitter.com/NASAGoddardPix" rel="nofollow">Twitter</a></b> <b>Like us on <a href="http://www.facebook.com/pages/Greenbelt-MD/NASA-Goddard/395013845897?ref=tsd" rel="nofollow">Facebook</a></b> <b>Find us on <a href="http://instagram.com/nasagoddard?vm=grid" rel="nofollow">Instagram</a></b>
When NASA's Terra satellite flew over the Puyehue-Cordon Caulle volcano on July 8, 2011 at 14:25 UTC (10:25 a.m. EDT) it captured this visible image of a steady stream of ash (light brown) blowing southeast into Argentina. The Puyehue-Cordón Caulle Volcano is located in the Andes Mountains of central Chile, near the Argentina border. Image: NASA Goddard/MODIS Rapid Response Team, Jeff Schmaltz Text: NASA Goddard/Rob Gutro <b><a href="http://www.nasa.gov/centers/goddard/home/index.html" rel="nofollow">NASA Goddard Space Flight Center</a></b> enables NASA’s mission through four scientific endeavors: Earth Science, Heliophysics, Solar System Exploration, and Astrophysics. Goddard plays a leading role in NASA’s accomplishments by contributing compelling scientific knowledge to advance the Agency’s mission. <b>Follow us on <a href="http://twitter.com/NASA_GoddardPix" rel="nofollow">Twitter</a></b> <b>Like us on <a href="http://www.facebook.com/pages/Greenbelt-MD/NASA-Goddard/395013845897?ref=tsd" rel="nofollow">Facebook</a></b> <b>Find us on <a href="http://web.stagram.com/n/nasagoddard/?vm=grid" rel="nofollow">Instagram</a></b>
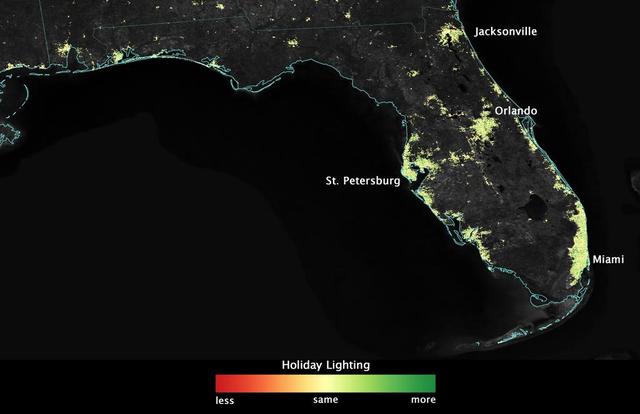
City lights shine brighter during the holidays in the United States when compared with the rest of the year, as shown using a new analysis of daily data from the NASA-NOAA Suomi NPP satellite. Dark green pixels are areas where lights are 50 percent brighter, or more, during December. Because snow reflects so much light, the researchers could only analyze snow-free cities. They focused on the U.S. West Coast from San Francisco and Los Angeles, and cities south of a rough imaginary line from St. Louis to Washington, D.C. Credit: Jesse Allen, NASA’s Earth Observatory Read more: <a href="http://www.nasa.gov/content/goddard/satellite-sees-holiday-lights-brighten-cities." rel="nofollow">www.nasa.gov/content/goddard/satellite-sees-holiday-light...</a>.<b><a href="http://www.nasa.gov/audience/formedia/features/MP_Photo_Guidelines.html" rel="nofollow">NASA image use policy.</a></b> <b><a href="http://www.nasa.gov/centers/goddard/home/index.html" rel="nofollow">NASA Goddard Space Flight Center</a></b> enables NASA’s mission through four scientific endeavors: Earth Science, Heliophysics, Solar System Exploration, and Astrophysics. Goddard plays a leading role in NASA’s accomplishments by contributing compelling scientific knowledge to advance the Agency’s mission. <b>Follow us on <a href="http://twitter.com/NASAGoddardPix" rel="nofollow">Twitter</a></b> <b>Like us on <a href="http://www.facebook.com/pages/Greenbelt-MD/NASA-Goddard/395013845897?ref=tsd" rel="nofollow">Facebook</a></b> <b>Find us on <a href="http://instagram.com/nasagoddard?vm=grid" rel="nofollow">Instagram</a></b>
City lights shine brighter during the holidays in the United States when compared with the rest of the year, as shown using a new analysis of daily data from the NASA-NOAA Suomi NPP satellite. Dark green pixels are areas where lights are 50 percent brighter, or more, during December. Because snow reflects so much light, the researchers could only analyze snow-free cities. They focused on the U.S. West Coast from San Francisco and Los Angeles, and cities south of a rough imaginary line from St. Louis to Washington, D.C. Credit: Jesse Allen, NASA’s Earth Observatory Read more: <a href="http://www.nasa.gov/content/goddard/satellite-sees-holiday-lights-brighten-cities." rel="nofollow">www.nasa.gov/content/goddard/satellite-sees-holiday-light...</a>.<b><a href="http://www.nasa.gov/audience/formedia/features/MP_Photo_Guidelines.html" rel="nofollow">NASA image use policy.</a></b> <b><a href="http://www.nasa.gov/centers/goddard/home/index.html" rel="nofollow">NASA Goddard Space Flight Center</a></b> enables NASA’s mission through four scientific endeavors: Earth Science, Heliophysics, Solar System Exploration, and Astrophysics. Goddard plays a leading role in NASA’s accomplishments by contributing compelling scientific knowledge to advance the Agency’s mission. <b>Follow us on <a href="http://twitter.com/NASAGoddardPix" rel="nofollow">Twitter</a></b> <b>Like us on <a href="http://www.facebook.com/pages/Greenbelt-MD/NASA-Goddard/395013845897?ref=tsd" rel="nofollow">Facebook</a></b> <b>Find us on <a href="http://instagram.com/nasagoddard?vm=grid" rel="nofollow">Instagram</a></b>
City lights shine brighter during the holidays in the United States when compared with the rest of the year, as shown using a new analysis of daily data from the NASA-NOAA Suomi NPP satellite. Dark green pixels are areas where lights are 50 percent brighter, or more, during December. Because snow reflects so much light, the researchers could only analyze snow-free cities. They focused on the U.S. West Coast from San Francisco and Los Angeles, and cities south of a rough imaginary line from St. Louis to Washington, D.C. Credit: Jesse Allen, NASA’s Earth Observatory Read more: <a href="http://www.nasa.gov/content/goddard/satellite-sees-holiday-lights-brighten-cities." rel="nofollow">www.nasa.gov/content/goddard/satellite-sees-holiday-light...</a>.<b><a href="http://www.nasa.gov/audience/formedia/features/MP_Photo_Guidelines.html" rel="nofollow">NASA image use policy.</a></b> <b><a href="http://www.nasa.gov/centers/goddard/home/index.html" rel="nofollow">NASA Goddard Space Flight Center</a></b> enables NASA’s mission through four scientific endeavors: Earth Science, Heliophysics, Solar System Exploration, and Astrophysics. Goddard plays a leading role in NASA’s accomplishments by contributing compelling scientific knowledge to advance the Agency’s mission. <b>Follow us on <a href="http://twitter.com/NASAGoddardPix" rel="nofollow">Twitter</a></b> <b>Like us on <a href="http://www.facebook.com/pages/Greenbelt-MD/NASA-Goddard/395013845897?ref=tsd" rel="nofollow">Facebook</a></b> <b>Find us on <a href="http://instagram.com/nasagoddard?vm=grid" rel="nofollow">Instagram</a></b>
City lights shine brighter during the holidays in the United States when compared with the rest of the year, as shown using a new analysis of daily data from the NASA-NOAA Suomi NPP satellite. Dark green pixels are areas where lights are 50 percent brighter, or more, during December. Because snow reflects so much light, the researchers could only analyze snow-free cities. They focused on the U.S. West Coast from San Francisco and Los Angeles, and cities south of a rough imaginary line from St. Louis to Washington, D.C. Credit: Jesse Allen, NASA’s Earth Observatory Read more: <a href="http://www.nasa.gov/content/goddard/satellite-sees-holiday-lights-brighten-cities." rel="nofollow">www.nasa.gov/content/goddard/satellite-sees-holiday-light...</a>.<b><a href="http://www.nasa.gov/audience/formedia/features/MP_Photo_Guidelines.html" rel="nofollow">NASA image use policy.</a></b> <b><a href="http://www.nasa.gov/centers/goddard/home/index.html" rel="nofollow">NASA Goddard Space Flight Center</a></b> enables NASA’s mission through four scientific endeavors: Earth Science, Heliophysics, Solar System Exploration, and Astrophysics. Goddard plays a leading role in NASA’s accomplishments by contributing compelling scientific knowledge to advance the Agency’s mission. <b>Follow us on <a href="http://twitter.com/NASAGoddardPix" rel="nofollow">Twitter</a></b> <b>Like us on <a href="http://www.facebook.com/pages/Greenbelt-MD/NASA-Goddard/395013845897?ref=tsd" rel="nofollow">Facebook</a></b> <b>Find us on <a href="http://instagram.com/nasagoddard?vm=grid" rel="nofollow">Instagram</a></b>
A very anomalous weather pattern is in place over the U.S. for mid-July. Trapped between an upper level ridge centered over the Ohio Valley and the closed upper level low over the Texas/Oklahoma border, atypical hot, muggy air is stifling a broad swath of the eastern U.S. The closed low is expected to drift west toward New Mexico bringing heavy, localized rain to some areas and temperatures running 10-20 degrees below mid-July averages. Across the east, temperatures will warm well into the 90's and stay there through the week. This image was taken by GOES East at 1645Z on July 15, 2013. Image credit: <b><a href="http://goes.gsfc.nasa.gov/" rel="nofollow">Credit: NOAA/NASA GOES Project</a></b> Text credit: NOAA <b><a href="http://www.nasa.gov/audience/formedia/features/MP_Photo_Guidelines.html" rel="nofollow">NASA image use policy.</a></b> <b><a href="http://www.nasa.gov/centers/goddard/home/index.html" rel="nofollow">NASA Goddard Space Flight Center</a></b> enables NASA’s mission through four scientific endeavors: Earth Science, Heliophysics, Solar System Exploration, and Astrophysics. Goddard plays a leading role in NASA’s accomplishments by contributing compelling scientific knowledge to advance the Agency’s mission. <b>Follow us on <a href="http://twitter.com/NASA_GoddardPix" rel="nofollow">Twitter</a></b> <b>Like us on <a href="http://www.facebook.com/pages/Greenbelt-MD/NASA-Goddard/395013845897?ref=tsd" rel="nofollow">Facebook</a></b> <b>Find us on <a href="http://instagram.com/nasagoddard?vm=grid" rel="nofollow">Instagram</a></b>
In several cities in the Middle East, city lights brighten during the Muslim holy month of Ramadan, as seen using a new analysis of daily data from the NASA-NOAA Suomi NPP satellite. Dark green pixels are areas where the lights are 50 percent brighter, or more, during Ramadan. Credit: Jesse Allen, NASA’s Earth Observatory Read more: <a href="http://www.nasa.gov/content/goddard/satellite-sees-holiday-lights-brighten-cities" rel="nofollow">www.nasa.gov/content/goddard/satellite-sees-holiday-light...</a> <b><a href="http://www.nasa.gov/audience/formedia/features/MP_Photo_Guidelines.html" rel="nofollow">NASA image use policy.</a></b> <b><a href="http://www.nasa.gov/centers/goddard/home/index.html" rel="nofollow">NASA Goddard Space Flight Center</a></b> enables NASA’s mission through four scientific endeavors: Earth Science, Heliophysics, Solar System Exploration, and Astrophysics. Goddard plays a leading role in NASA’s accomplishments by contributing compelling scientific knowledge to advance the Agency’s mission. <b>Follow us on <a href="http://twitter.com/NASAGoddardPix" rel="nofollow">Twitter</a></b> <b>Like us on <a href="http://www.facebook.com/pages/Greenbelt-MD/NASA-Goddard/395013845897?ref=tsd" rel="nofollow">Facebook</a></b> <b>Find us on <a href="http://instagram.com/nasagoddard?vm=grid" rel="nofollow">Instagram</a></b>
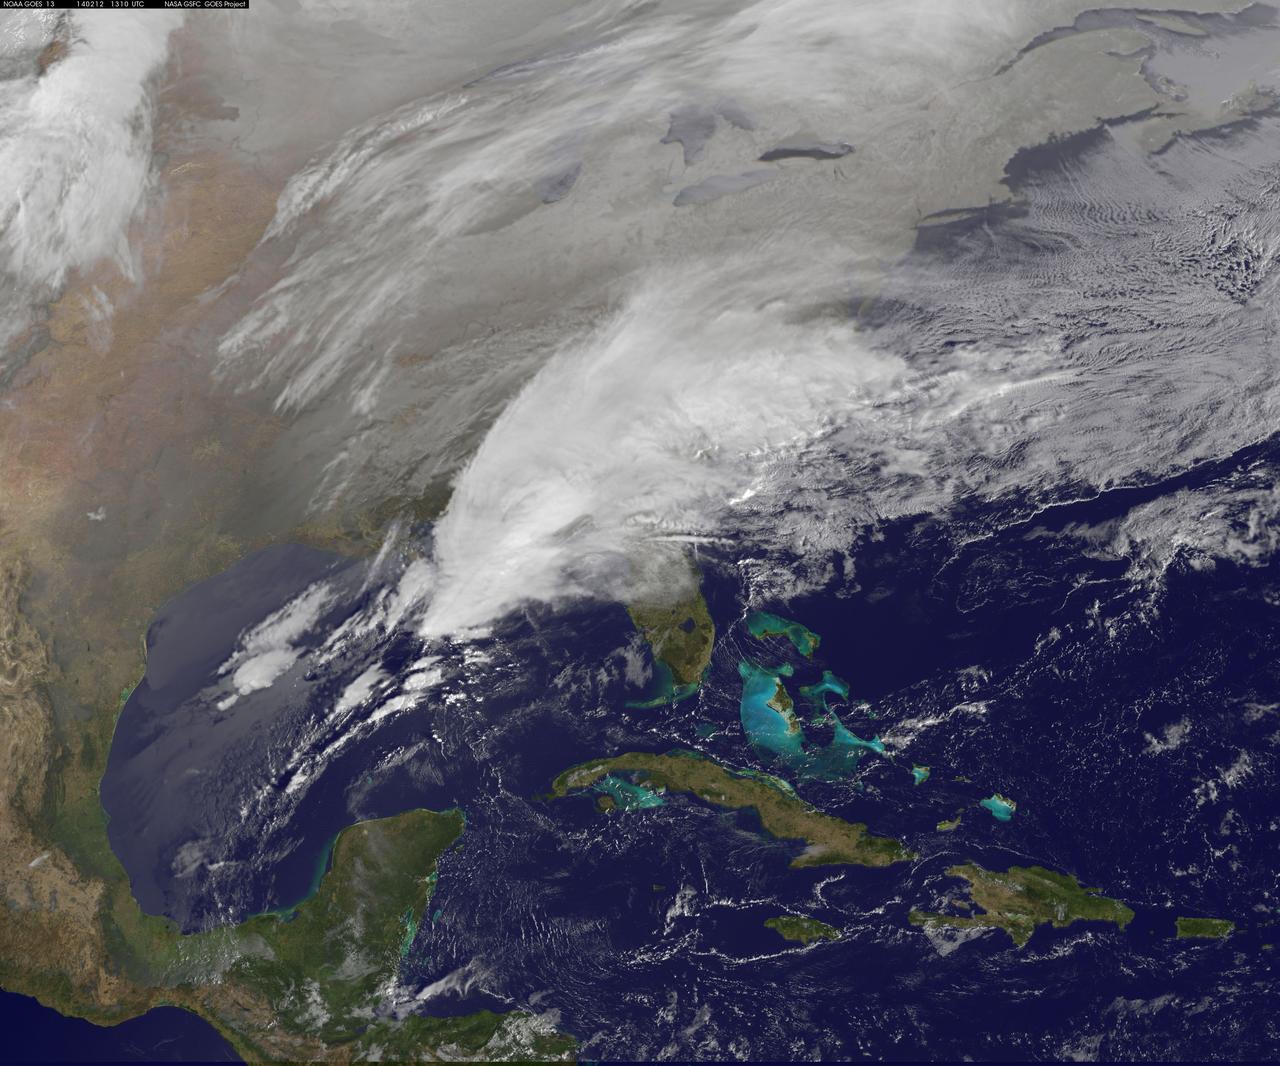
Clouds associated with the major winter storm that is bringing wintry precipitation and chilly temperatures to the U.S. south is the focus in an image from NOAA's GOES-East satellite today, February 12 at 1310 UTC/ 8:10 EST. Rain, freezing rain, sleet and snow are part of the large front that stretches from eastern Texas to the Carolinas in the Geostationary Operational Environmental satellite or GOES image. NOAA's weather maps show several areas of low pressure along the frontal boundary. One low pressure is in the northern Gulf of Mexico, while the other is in the Atlantic Ocean, just south of South Carolina. (Insert link: <a href="http://www.hpc.ncep.noaa.gov/noaa/noaad1.gif" rel="nofollow">www.hpc.ncep.noaa.gov/noaa/noaad1.gif</a>). NOAA's National Weather Service has been issuing watches and warnings throughout the south that extend along Mid-Atlantic east coast. The visible cloud and ground snow data in this image was taken from NOAA's GOES-East satellite. The image was created by the NASA GOES Project at NASA's Goddard Space Flight Center in Greenbelt, Md. The clouds and fallen snow were overlaid on a true-color image of land and ocean created by data from the Moderate Resolution Imaging Spectroradiometer or MODIS instrument that flies aboard NASA's Aqua and Terra satellites. NOAA's Weather Prediction Center, or WPC noted on Feb. 11 at 3:59 a.m. EST, "Once the intensifying surface low moves off the Southeast coast and begins its track up the Eastern Seaboard Wednesday night...winter weather will start lifting northward into the northern Mid-Atlantic states." GOES satellites provide the kind of continuous monitoring necessary for intensive data analysis. Geostationary describes an orbit in which a satellite is always in the same position with respect to the rotating Earth. This allows GOES to hover continuously over one position on Earth's surface, appearing stationary. As a result, GOES provide a constant vigil for the atmospheric "triggers" for severe weather conditions such as tornadoes, flash floods, hail storms and hurricanes. For updated information about the storm system, visit NOAA's WPC website; <a href="http://www.hpc.ncep.noaa.gov/" rel="nofollow">www.hpc.ncep.noaa.gov/</a> For more information about GOES satellites, visit: <a href="http://www.goes.noaa.gov/" rel="nofollow">www.goes.noaa.gov/</a> or <a href="http://goes.gsfc.nasa.gov/" rel="nofollow">goes.gsfc.nasa.gov/</a> Rob Gutro NASA's Goddard Space Flight Center <b><a href="http://www.nasa.gov/audience/formedia/features/MP_Photo_Guidelines.html" rel="nofollow">NASA image use policy.</a></b> <b><a href="http://www.nasa.gov/centers/goddard/home/index.html" rel="nofollow">NASA Goddard Space Flight Center</a></b> enables NASA’s mission through four scientific endeavors: Earth Science, Heliophysics, Solar System Exploration, and Astrophysics. Goddard plays a leading role in NASA’s accomplishments by contributing compelling scientific knowledge to advance the Agency’s mission. <b>Follow us on <a href="http://twitter.com/NASAGoddardPix" rel="nofollow">Twitter</a></b> <b>Like us on <a href="http://www.facebook.com/pages/Greenbelt-MD/NASA-Goddard/395013845897?ref=tsd" rel="nofollow">Facebook</a></b> <b>Find us on <a href="http://instagram.com/nasagoddard?vm=grid" rel="nofollow">Instagram</a></b>
City lights shine brighter during the holidays in the United States when compared with the rest of the year, as shown using a new analysis of daily data from the NASA-NOAA Suomi NPP satellite. Dark green pixels are areas where lights are 50 percent brighter, or more, during December. Because snow reflects so much light, the researchers could only analyze snow-free cities. They focused on the U.S. West Coast from San Francisco and Los Angeles, and cities south of a rough imaginary line from St. Louis to Washington, D.C. Credit: Jesse Allen, NASA’s Earth Observatory Read more: <a href="http://www.nasa.gov/content/goddard/satellite-sees-holiday-lights-brighten-cities." rel="nofollow">www.nasa.gov/content/goddard/satellite-sees-holiday-light...</a>.<b><a href="http://www.nasa.gov/audience/formedia/features/MP_Photo_Guidelines.html" rel="nofollow">NASA image use policy.</a></b> <b><a href="http://www.nasa.gov/centers/goddard/home/index.html" rel="nofollow">NASA Goddard Space Flight Center</a></b> enables NASA’s mission through four scientific endeavors: Earth Science, Heliophysics, Solar System Exploration, and Astrophysics. Goddard plays a leading role in NASA’s accomplishments by contributing compelling scientific knowledge to advance the Agency’s mission. <b>Follow us on <a href="http://twitter.com/NASAGoddardPix" rel="nofollow">Twitter</a></b> <b>Like us on <a href="http://www.facebook.com/pages/Greenbelt-MD/NASA-Goddard/395013845897?ref=tsd" rel="nofollow">Facebook</a></b> <b>Find us on <a href="http://instagram.com/nasagoddard?vm=grid" rel="nofollow">Instagram</a></b>
City lights shine brighter during the holidays in the United States when compared with the rest of the year, as shown using a new analysis of daily data from the NASA-NOAA Suomi NPP satellite. Dark green pixels are areas where lights are 50 percent brighter, or more, during December. Because snow reflects so much light, the researchers could only analyze snow-free cities. They focused on the U.S. West Coast from San Francisco and Los Angeles, and cities south of a rough imaginary line from St. Louis to Washington, D.C. Credit: Jesse Allen, NASA’s Earth Observatory Read more: <a href="http://www.nasa.gov/content/goddard/satellite-sees-holiday-lights-brighten-cities." rel="nofollow">www.nasa.gov/content/goddard/satellite-sees-holiday-light...</a>.<b><a href="http://www.nasa.gov/audience/formedia/features/MP_Photo_Guidelines.html" rel="nofollow">NASA image use policy.</a></b> <b><a href="http://www.nasa.gov/centers/goddard/home/index.html" rel="nofollow">NASA Goddard Space Flight Center</a></b> enables NASA’s mission through four scientific endeavors: Earth Science, Heliophysics, Solar System Exploration, and Astrophysics. Goddard plays a leading role in NASA’s accomplishments by contributing compelling scientific knowledge to advance the Agency’s mission. <b>Follow us on <a href="http://twitter.com/NASAGoddardPix" rel="nofollow">Twitter</a></b> <b>Like us on <a href="http://www.facebook.com/pages/Greenbelt-MD/NASA-Goddard/395013845897?ref=tsd" rel="nofollow">Facebook</a></b> <b>Find us on <a href="http://instagram.com/nasagoddard?vm=grid" rel="nofollow">Instagram</a></b>
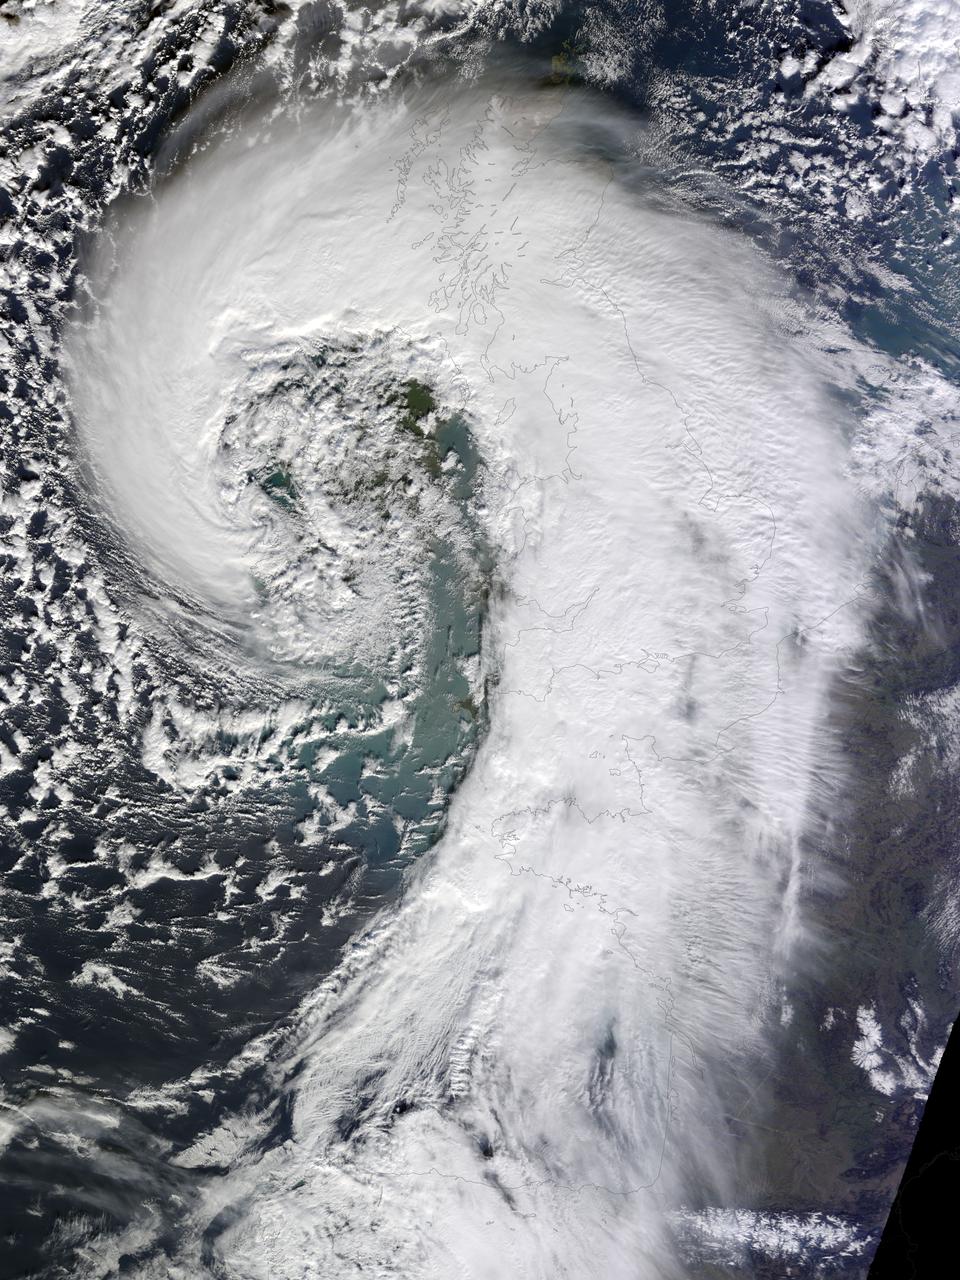
Soggy winters are not unusual in the United Kingdom, but this winter has been in a category of its own. UK Met Office meteorologists had just declared January 2014 the wettest month on record for parts of southern Britain when another series of storms swept across the area in early February. The Moderate Resolution Imaging Spectroradiometer (MODIS) on NASA’s Terra satellite captured this image of an extratropical cyclone bearing down on the United Kingdom on February 12, 2014. Mature extratropical cyclones often feature comma-shaped cloud patterns that are the product of “conveyor belt” circulation. While heavy precipitation is often present near the low-pressure head of the comma, a slot of dry air usually trails the west side of the tail. The storm brought the United Kingdom yet another round of heavy rain, as well as winds that exceeded 160 kilometers (100 miles) per hour. It snarled traffic, disrupted train service, and caused power outages for more than 700,000 people. The also exacerbated severe flooding in southern England. More than 5,800 homes have flooded since early December, according to media reports. Authorities have deployed thousands of soldiers to towns and cities in southern England to help with flood recovery. Meanwhile, the Met Office was forecasting more of the same. They warned that another system bearing heavy rain and winds was lining up to push into the United Kingdom from the southeast on Friday morning. NASA Earth Observatory image by Jesse Allen, using data from the Land Atmosphere Near real-time Capability for EOS (LANCE). Caption by Adam Voiland. More info: <a href="http://earthobservatory.nasa.gov/NaturalHazards/view.php?id=83127" rel="nofollow">earthobservatory.nasa.gov/NaturalHazards/view.php?id=83127</a> Instrument: Terra - MODIS Credit: <b><a href="http://www.earthobservatory.nasa.gov/" rel="nofollow"> NASA Earth Observatory</a></b> <b><a href="http://www.nasa.gov/audience/formedia/features/MP_Photo_Guidelines.html" rel="nofollow">NASA image use policy.</a></b> <b><a href="http://www.nasa.gov/centers/goddard/home/index.html" rel="nofollow">NASA Goddard Space Flight Center</a></b> enables NASA’s mission through four scientific endeavors: Earth Science, Heliophysics, Solar System Exploration, and Astrophysics. Goddard plays a leading role in NASA’s accomplishments by contributing compelling scientific knowledge to advance the Agency’s mission. <b>Follow us on <a href="http://twitter.com/NASAGoddardPix" rel="nofollow">Twitter</a></b> <b>Like us on <a href="http://www.facebook.com/pages/Greenbelt-MD/NASA-Goddard/395013845897?ref=tsd" rel="nofollow">Facebook</a></b> <b>Find us on <a href="http://instagrid.me/nasagoddard/?vm=grid" rel="nofollow">Instagram</a></b>