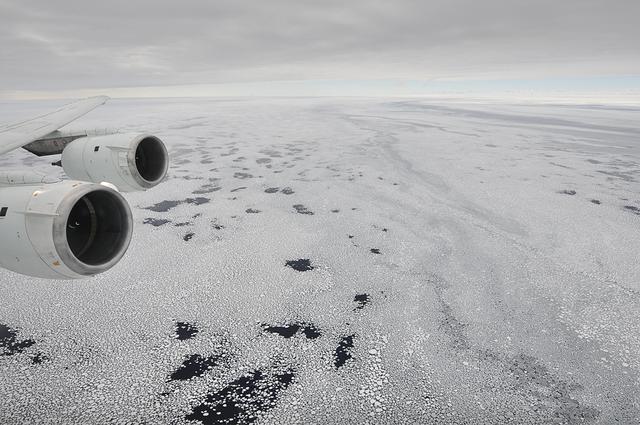
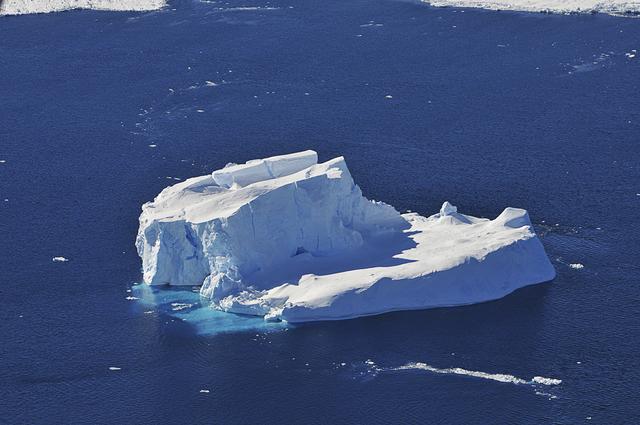
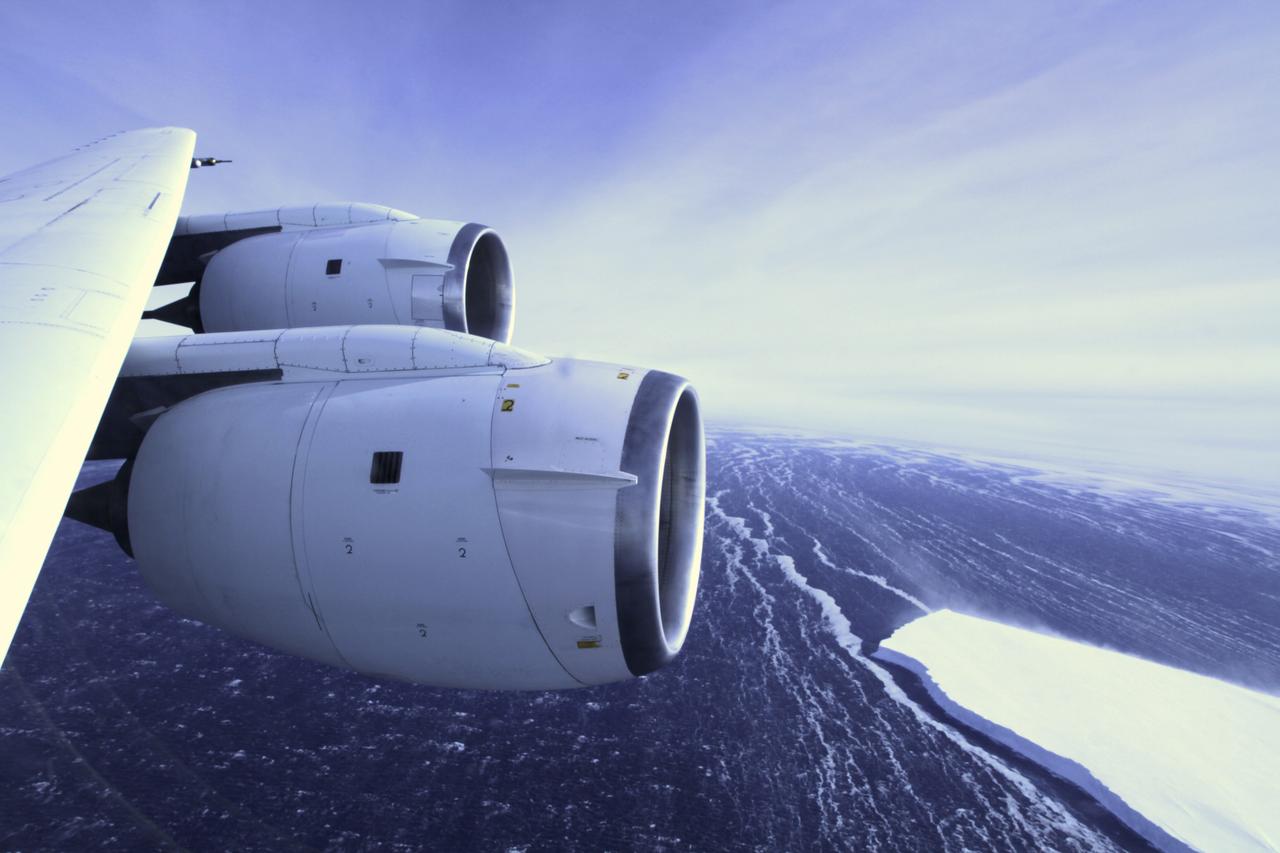
Sea ice is seen out the window of NASA's DC-8 research aircraft as it flies 2,000 feet above the Bellingshausen Sea in West Antarctica on Wednesday, Oct., 21, 2009. This was the fourth science flight of NASA’s Operation Ice Bridge airborne Earth science mission to study Antarctic ice sheets, sea ice, and ice shelves. Photo Credit: (NASA/Jane Peterson)

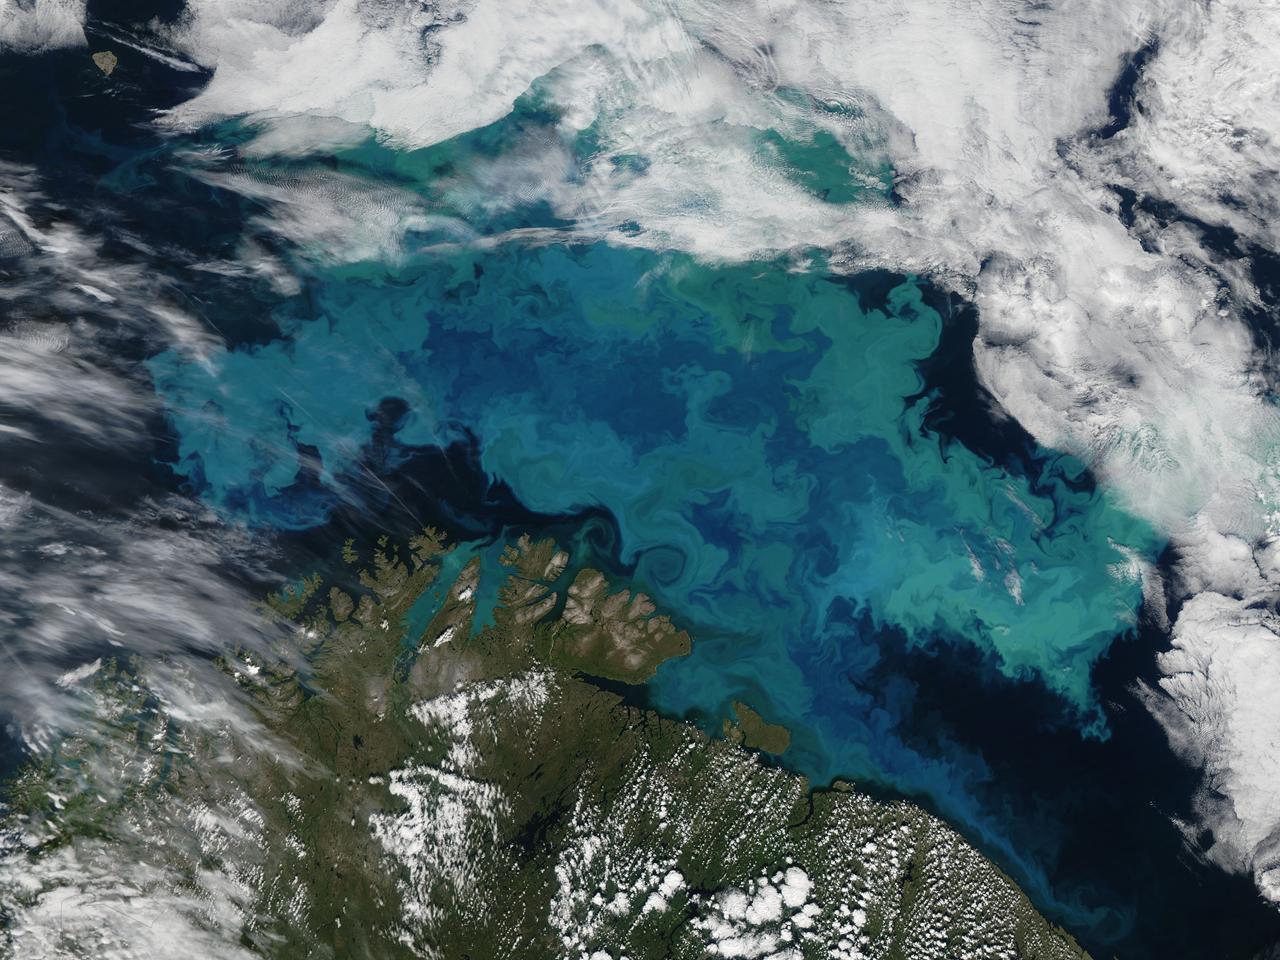
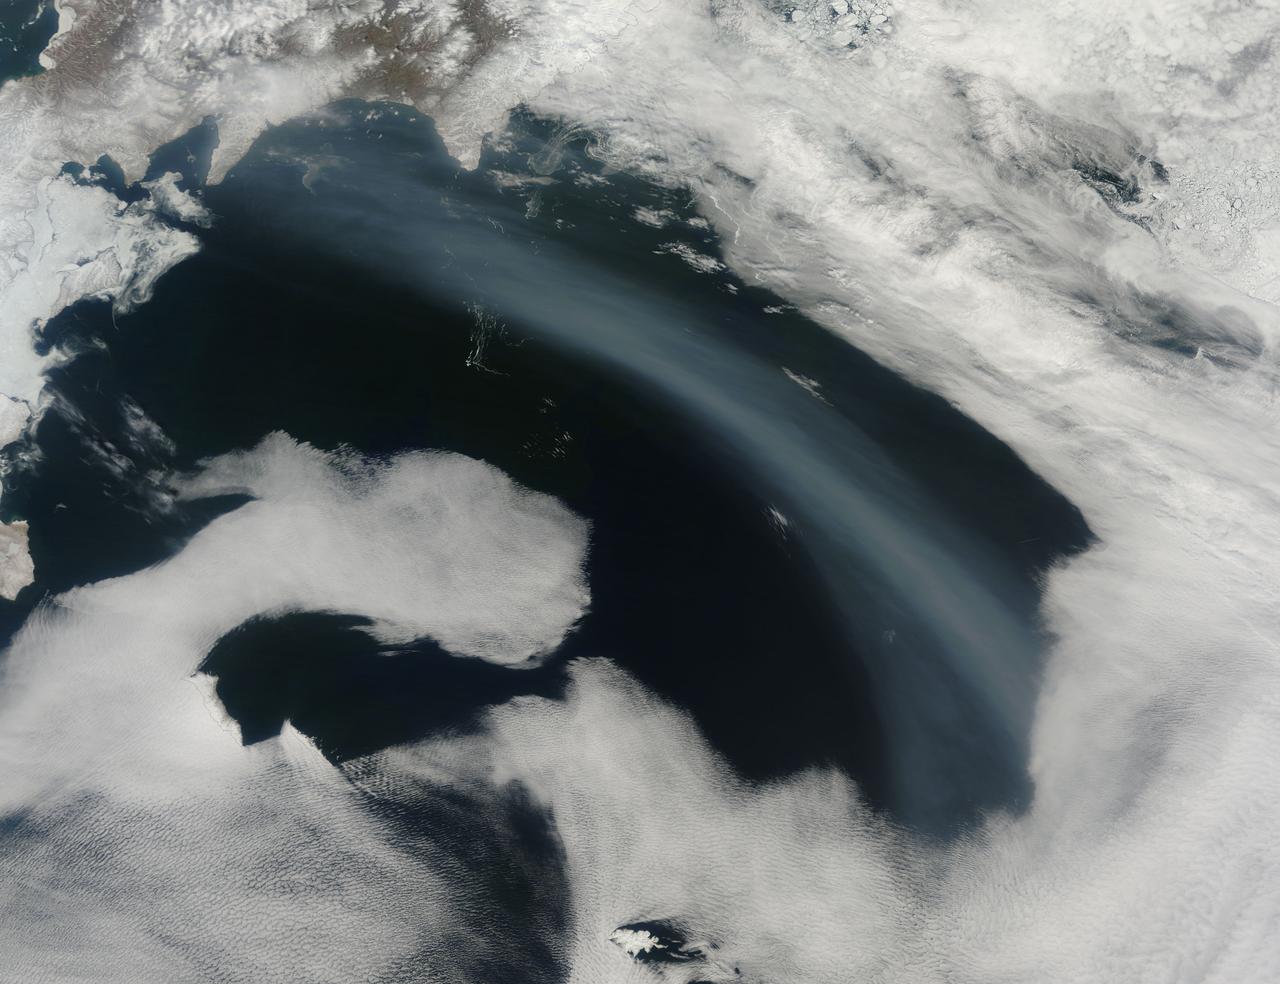
As the northern hemisphere experiences the heat of summer, ice moves and melts in the Arctic waters and the far northern lands surrounding it. The Moderate Resolution Imaging Spectroradiometer (MODIS) aboard NASA’s Aqua satellite captured this true-color image of sea ice off Greenland on July 16, 2015. Large chunks of melting sea ice can be seen in the sea ice off the coast, and to the south spirals of ice have been shaped by the winds and currents that move across the Greenland Sea. Along the Greenland coast, cold, fresh melt water from the glaciers flows out to the sea, as do newly calved icebergs. Frigid air from interior Greenland pushes the ice away from the shoreline, and the mixing of cold water and air allows some sea ice to be sustained even at the height of summer. According to observations from satellites, 2015 is on track to be another low year for arctic summer sea ice cover. The past ten years have included nine of the lowest ice extents on record. The annual minimum typically occurs in late August or early September. The amount of Arctic sea ice cover has been dropping as global temperatures rise. The Arctic is two to three times more sensitive to temperature changes as the Earth as a whole. Credit: NASA/GSFC/Jeff Schmaltz/MODIS Land Rapid Response Team <b><a href="http://www.nasa.gov/audience/formedia/features/MP_Photo_Guidelines.html" rel="nofollow">NASA image use policy.</a></b> <b><a href="http://www.nasa.gov/centers/goddard/home/index.html" rel="nofollow">NASA Goddard Space Flight Center</a></b> enables NASA’s mission through four scientific endeavors: Earth Science, Heliophysics, Solar System Exploration, and Astrophysics. Goddard plays a leading role in NASA’s accomplishments by contributing compelling scientific knowledge to advance the Agency’s mission. <b>Follow us on <a href="http://twitter.com/NASAGoddardPix" rel="nofollow">Twitter</a></b> <b>Like us on <a href="http://www.facebook.com/pages/Greenbelt-MD/NASA-Goddard/395013845897?ref=tsd" rel="nofollow">Facebook</a></b> <b>Find us on <a href="http://instagrid.me/nasagoddard/?vm=grid" rel="nofollow">Instagram</a></b>
Seven Seas
A Frozen Sea

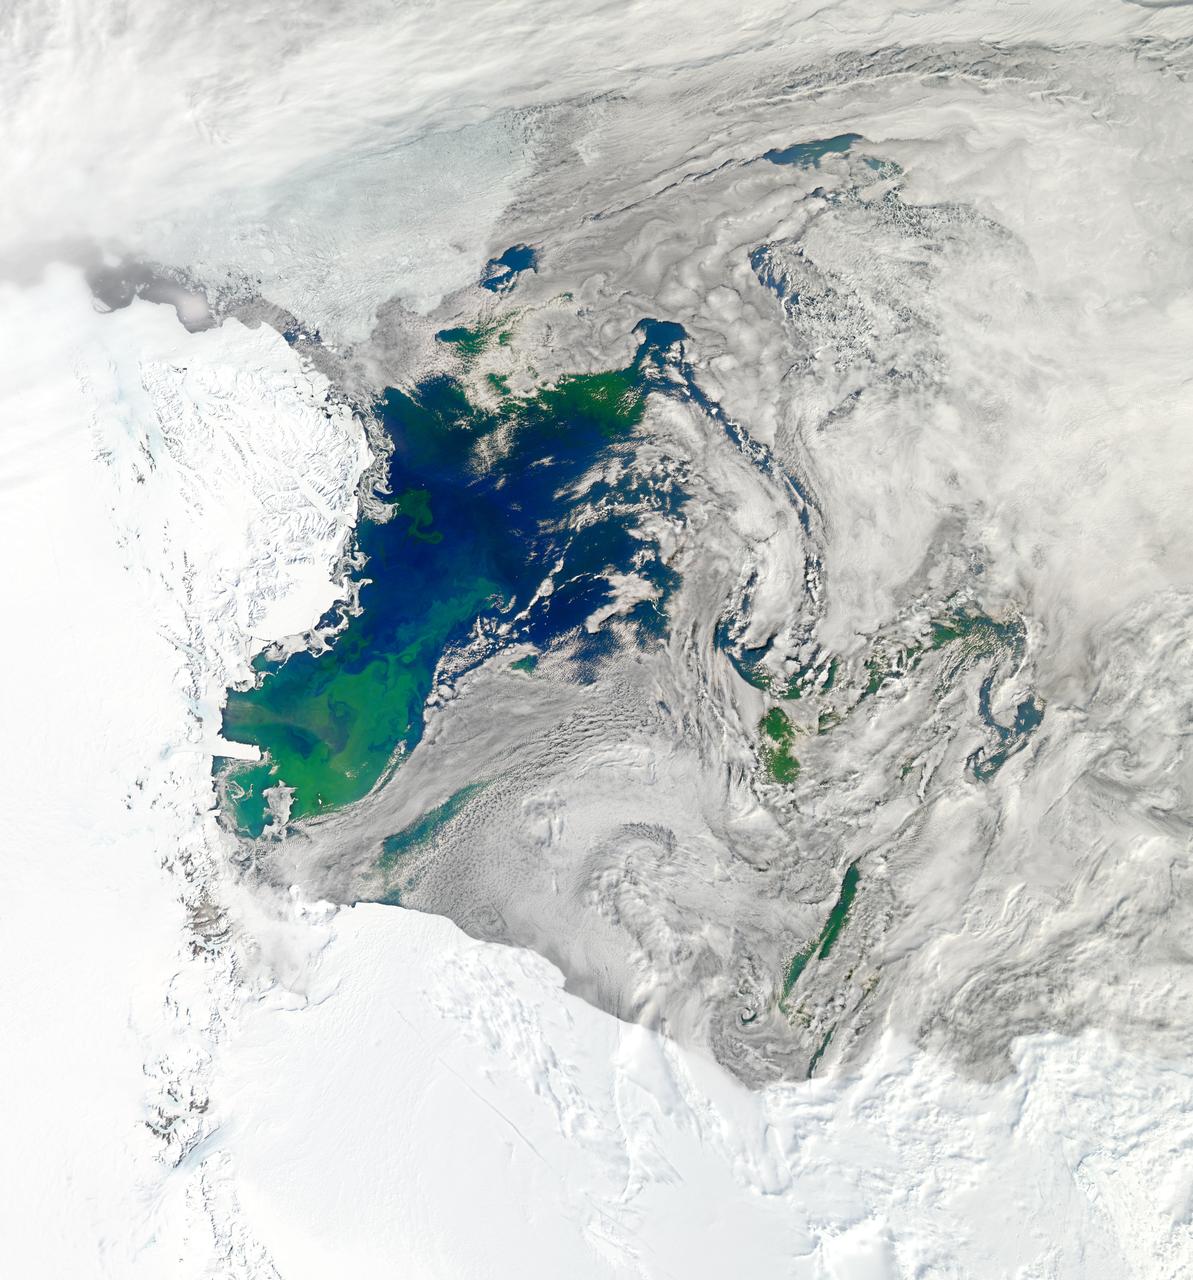
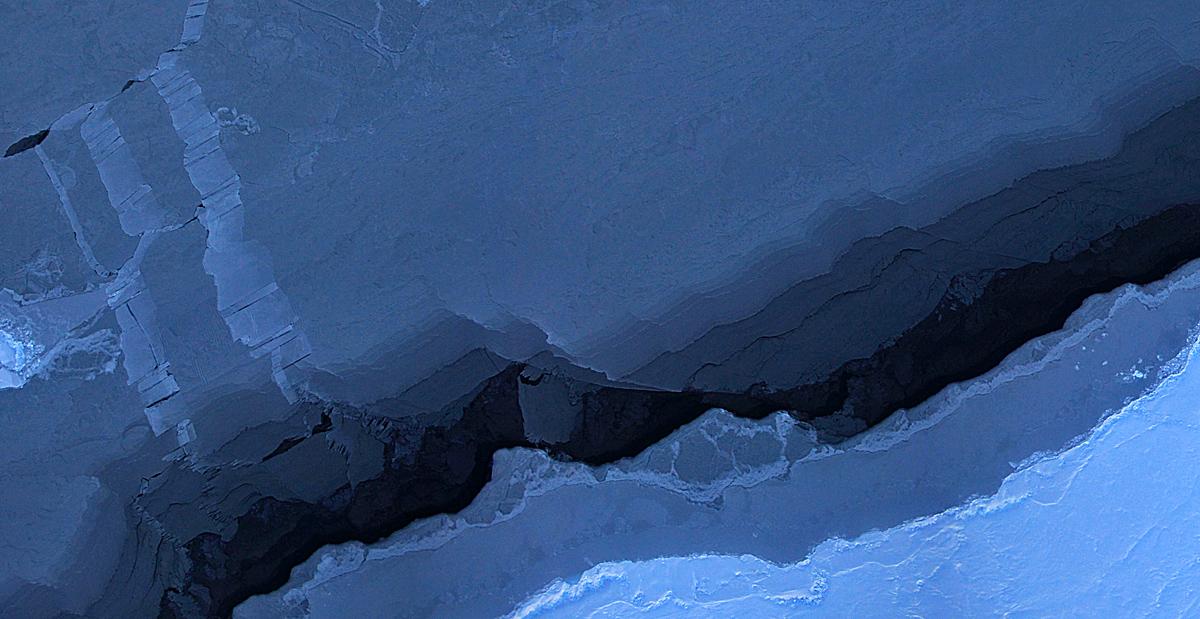
Antarctica—the continent at the southernmost reach of the planet—is fringed by cold, often frozen waters of the Southern Ocean. The extent of sea ice around the continent typically reaches a peak in September and a minimum in February. The photograph above shows Antarctic sea ice on November 5, 2014, during the annual cycle of melt. The image was acquired by the Digital Mapping System (DMS), a digital camera installed in the belly of research aircraft to capture images of terrain below. In this case, the system flew on the DC-8 during a flight as part of NASA’s Operation IceBridge. Most of the view shows first-year sea ice in the Bellingshausen Sea, as it appeared from an altitude of 328 meters (1,076 feet). The block of ice on the right side of the image is older, thicker, and was once attached to the Antarctic Ice Sheet. By the time this image was acquired, however, the ice had broken away to form an iceberg. Given its close proximity to the ice sheet, this could have been a relatively new berg. Read more: <a href="http://earthobservatory.nasa.gov/IOTD/view.php?id=86721" rel="nofollow">earthobservatory.nasa.gov/IOTD/view.php?id=86721</a> Credit: NASA/Goddard/IceBridge DMS L0 Raw Imagery courtesy of the Digital Mapping System (DMS) team and the NASA DAAC at the National Snow and Ice Data Center Credit: <b><a href="http://www.earthobservatory.nasa.gov/" rel="nofollow"> NASA Earth Observatory</a></b> <b><a href="http://www.nasa.gov/audience/formedia/features/MP_Photo_Guidelines.html" rel="nofollow">NASA image use policy.</a></b> <b><a href="http://www.nasa.gov/centers/goddard/home/index.html" rel="nofollow">NASA Goddard Space Flight Center</a></b> enables NASA’s mission through four scientific endeavors: Earth Science, Heliophysics, Solar System Exploration, and Astrophysics. Goddard plays a leading role in NASA’s accomplishments by contributing compelling scientific knowledge to advance the Agency’s mission. <b>Follow us on <a href="http://twitter.com/NASAGoddardPix" rel="nofollow">Twitter</a></b> <b>Like us on <a href="http://www.facebook.com/pages/Greenbelt-MD/NASA-Goddard/395013845897?ref=tsd" rel="nofollow">Facebook</a></b> <b>Find us on <a href="http://instagrid.me/nasagoddard/?vm=grid" rel="nofollow">Instagram</a></b>

The U.S. Coast Guard Cutter Healy encountered only small patches of sea ice in the Chukchi Sea during the final days collecting ocean data for the 2011 ICESCAPE mission. The ICESCAPE mission, or "Impacts of Climate on Ecosystems and Chemistry of the Arctic Pacific Environment," is a NASA shipborne investigation to study how changing conditions in the Arctic affect the ocean's chemistry and ecosystems. The bulk of the research took place in the Beaufort and Chukchi seas in summer 2010 and 2011. Credit: NASA/Kathryn Hansen <b><a href="http://www.nasa.gov/audience/formedia/features/MP_Photo_Guidelines.html" rel="nofollow">NASA image use policy.</a></b> <b><a href="http://www.nasa.gov/centers/goddard/home/index.html" rel="nofollow">NASA Goddard Space Flight Center</a></b> enables NASA’s mission through four scientific endeavors: Earth Science, Heliophysics, Solar System Exploration, and Astrophysics. Goddard plays a leading role in NASA’s accomplishments by contributing compelling scientific knowledge to advance the Agency’s mission. <b>Follow us on <a href="http://twitter.com/NASA_GoddardPix" rel="nofollow">Twitter</a></b> <b>Like us on <a href="http://www.facebook.com/pages/Greenbelt-MD/NASA-Goddard/395013845897?ref=tsd" rel="nofollow">Facebook</a></b> <b>Find us on <a href="http://instagrid.me/nasagoddard/?vm=grid" rel="nofollow">Instagram</a></b>
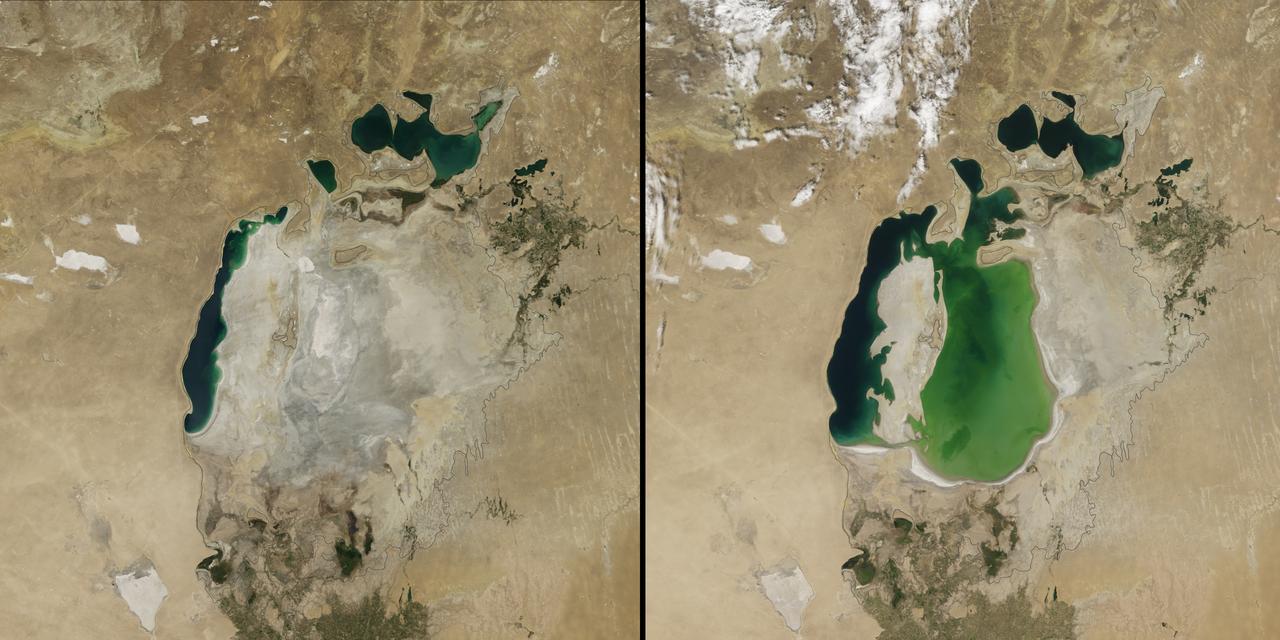
(Aral Sea: left 2014 and right 2000, 1960 extent black line) In the 1960s, the Soviet Union undertook a major water diversion project on the arid plains of Kazakhstan, Uzbekistan, and Turkmenistan. The region’s two major rivers, fed by snowmelt and precipitation in faraway mountains, were used to transform the desert into farms for cotton and other crops. Before the project, the Syr Darya and the Amu Darya rivers flowed down from the mountains, cut northwest through the Kyzylkum Desert, and finally pooled together in the lowest part of the basin. The lake they made, the Aral Sea, was once the fourth largest in the world. Although irrigation made the desert bloom, it devastated the Aral Sea. This series of images from the Moderate Resolution Imaging Spectroradiometer (MODIS) on NASA’s Terra satellite documents the changes. At the start of the series in 2000, the lake was already a fraction of its 1960 extent (black line). The Northern Aral Sea (sometimes called the Small Aral Sea) had separated from the Southern (Large) Aral Sea. The Southern Aral Sea had split into eastern and western lobes that remained tenuously connected at both ends. By 2001, the southern connection had been severed, and the shallower eastern part retreated rapidly over the next several years. Especially large retreats in the eastern lobe of the Southern Sea appear to have occurred between 2005 and 2009, when drought limited and then cut off the flow of the Amu Darya. Water levels then fluctuated annually between 2009 and 2014 in alternately dry and wet years. Dry conditions in 2014 caused the Southern Sea’s eastern lobe to completely dry up for the first time in modern times. Continue reading: <a href="http://1.usa.gov/1nLX9Ku" rel="nofollow">1.usa.gov/1nLX9Ku</a> Read more: <a href="http://1.usa.gov/1pqEnDj" rel="nofollow">1.usa.gov/1pqEnDj</a> Credit: <b><a href="http://www.earthobservatory.nasa.gov/" rel="nofollow"> NASA Earth Observatory</a></b> <b><a href="http://www.nasa.gov/audience/formedia/features/MP_Photo_Guidelines.html" rel="nofollow">NASA image use policy.</a></b> <b><a href="http://www.nasa.gov/centers/goddard/home/index.html" rel="nofollow">NASA Goddard Space Flight Center</a></b> enables NASA’s mission through four scientific endeavors: Earth Science, Heliophysics, Solar System Exploration, and Astrophysics. Goddard plays a leading role in NASA’s accomplishments by contributing compelling scientific knowledge to advance the Agency’s mission. <b>Follow us on <a href="http://twitter.com/NASAGoddardPix" rel="nofollow">Twitter</a></b> <b>Like us on <a href="http://www.facebook.com/pages/Greenbelt-MD/NASA-Goddard/395013845897?ref=tsd" rel="nofollow">Facebook</a></b> <b>Find us on <a href="http://instagram.com/nasagoddard?vm=grid" rel="nofollow">Instagram</a></b>
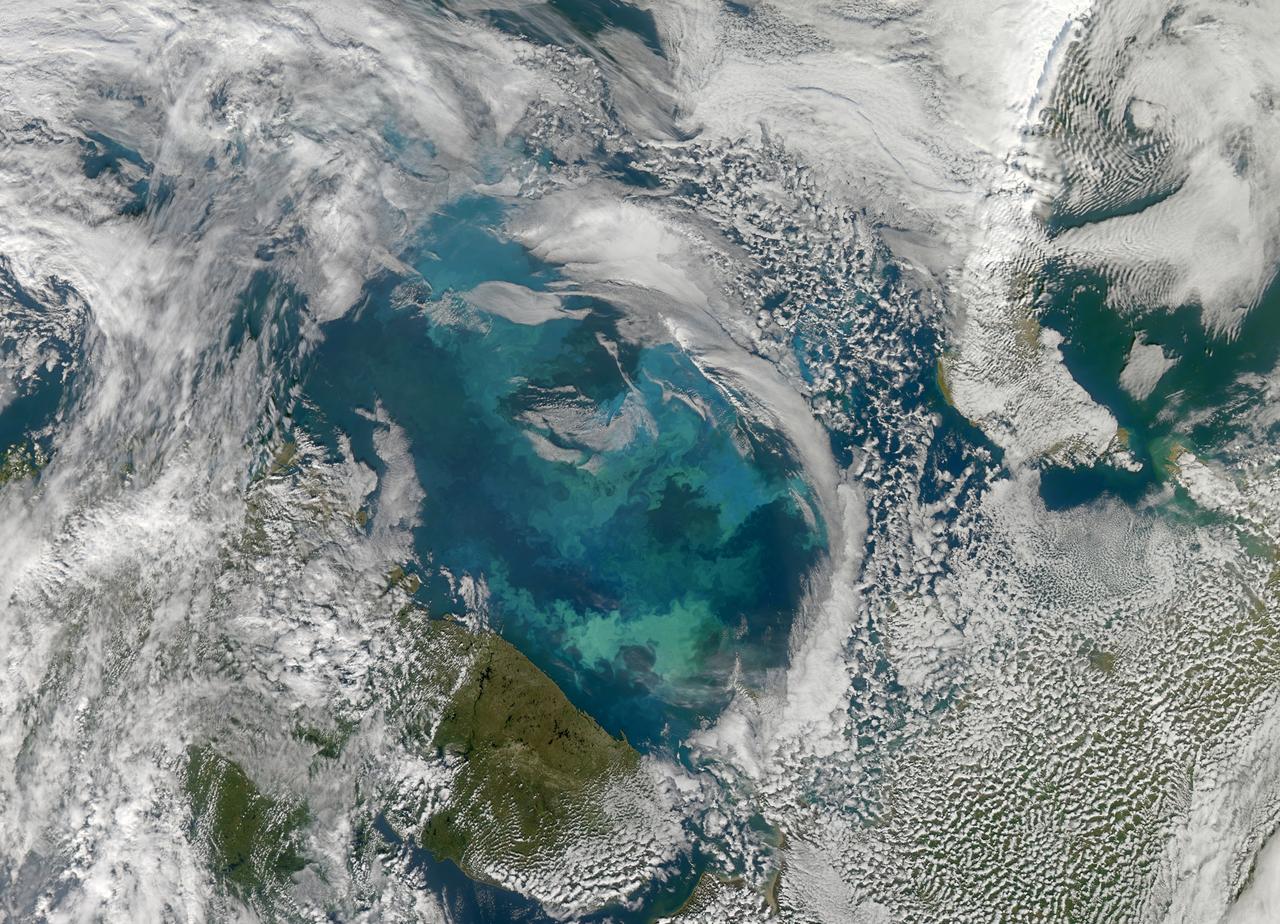
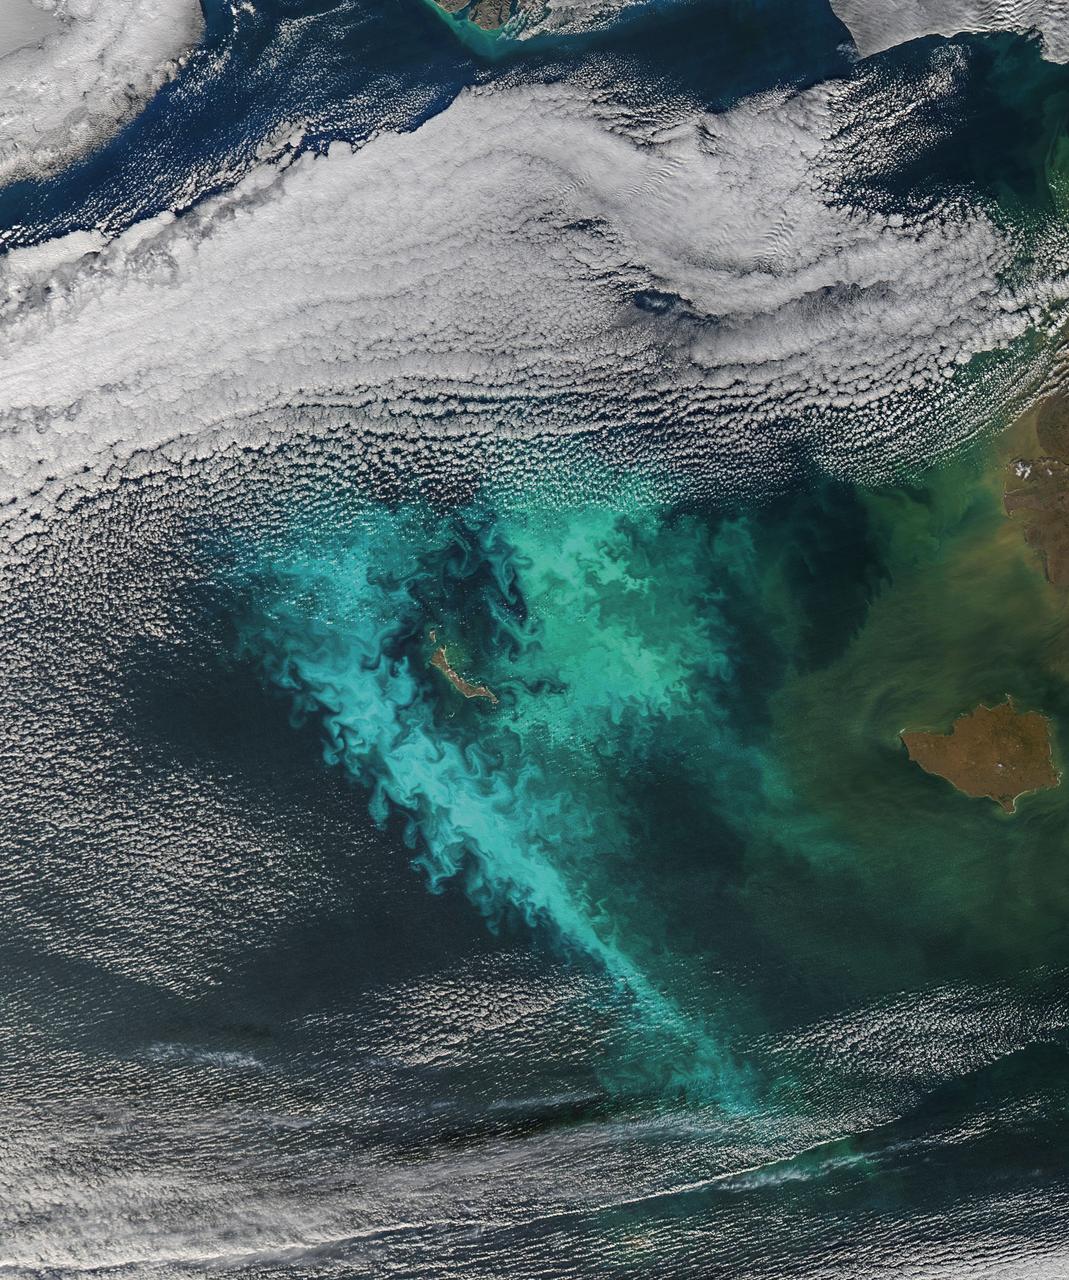
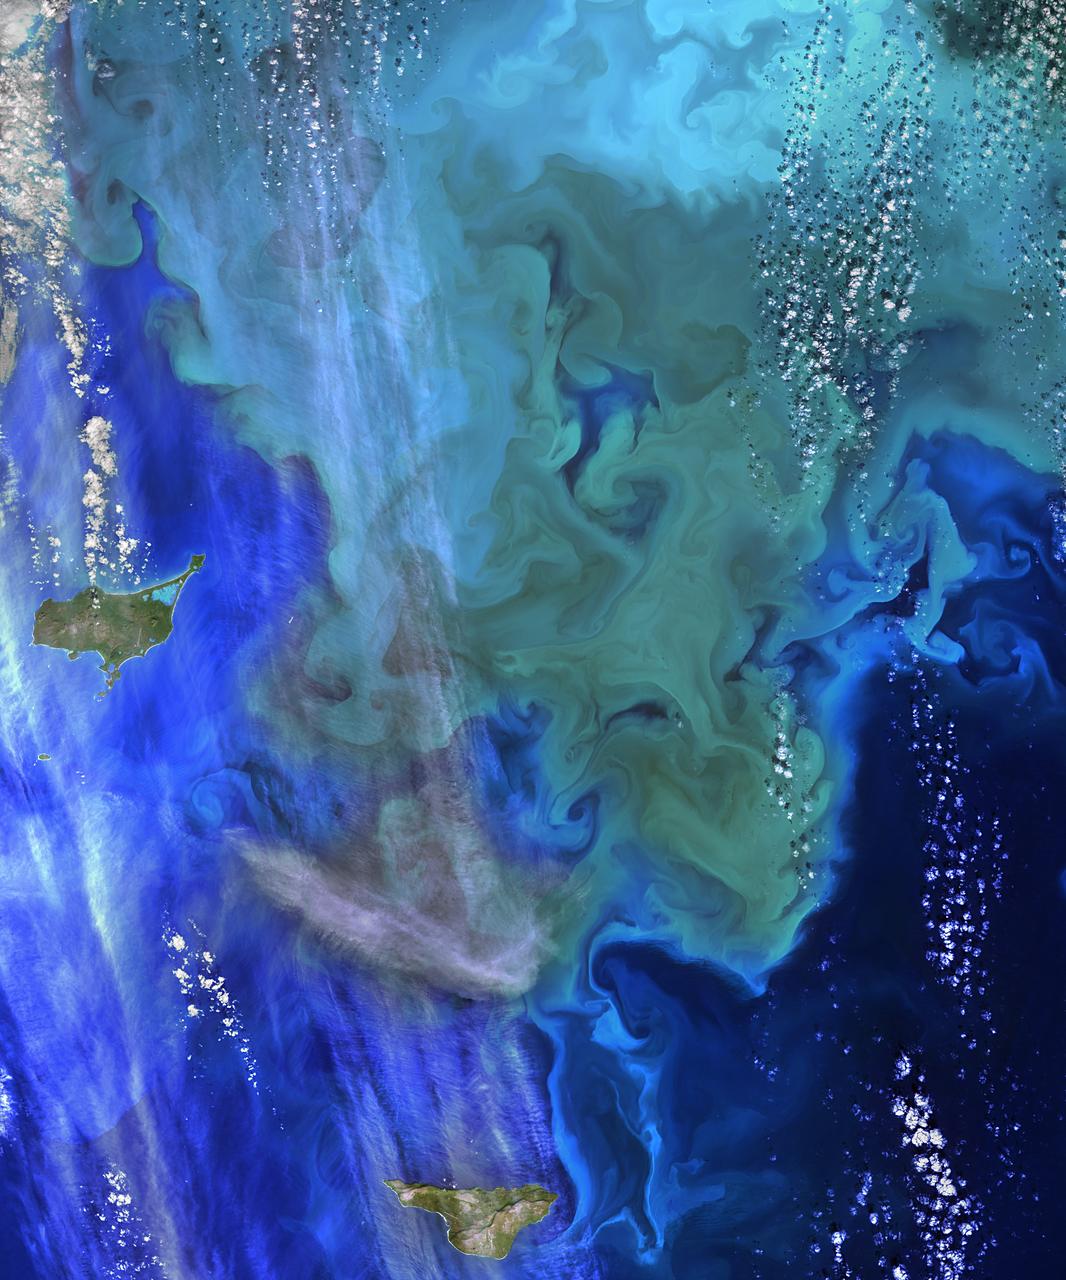
Phytoplankton bloom in the Barents Sea captured August 14, 2011. At times nature exceeds the ability of the artist’s brush to blend brilliant colors, interweave textures and combine patterns to create stunning panoramas, while using only the palette of land, water, cloud and vegetation. This stunning and artistic image of a phytoplankton bloom in the Barents Sea was by the Moderate Resolution Imaging Spectroradiometer (MODIS) aboard the Aqua satellite was captured on August 14, 2011. The peacock-hued swirls of blues and green that paint the navy-blue sea water are created by light reflecting off of millions of phytoplankton, microscopic plants that grow in the sunlit surface water of the world’s oceans. Different types of phytoplankton reflect different colored light, so a multi-color bloom such as this typically contains multiple species. The depth of the bloom also affects coloration – the deeper the organism, the less light is reflected and the duller the color. Coccolithophores, a type of phytoplankton which flourish in nutrient-poor, sub-polar waters, have unique limestone (calcite) scales. This white coating makes the plant highly reflective, and thus a bloom can appear to be a bright, almost iridescent blue. The chalky coating can also cause whitish swirls in the water, making the blues washed out with a milky hue. August is a highly active month for phytoplankton blooms in the Barents Sea, but the timing, development, abundance and species composition is variable in this area. The distribution of phytoplankton is largely controlled by the polar front, ice cover, freshwater runoff and ice melting. Each water source – the Artic, the Atlantic and the coastal water – all bring their own characteristic species into the Barents Sea, creating a multi-specie and multi-color spectacle. Because phytoplankton are the base of the marine food chain, places were blooms are large and frequent often support a thriving marine population. This is certainly the case in the Barents Sea where the fisheries, particularly the cod fisheries, are of great importance for both Norway and Russia. The coastlines of both of these countries can be seen in the bottom of the image. Russia forms the south-eastern most coast, while the remaining three-quarters of the coastline belongs to Norway. Two fjords in the west, Porsangerfjorden and Laksefjord are tinted bright blue with phytoplankton. Just to the east of these fjords, freshwater from the Tana River flows through Tanafjord, turning the waters here are a duller blue. As fresh water flows into the Barents Sea, phytoplankton bloom is affected by the flowing water, creating paisley-like patterns in the coastal eddies. Credit: NASA/GSFC/Jeff Schmaltz/MODIS Land Rapid Response Team <b><a href="http://www.nasa.gov/centers/goddard/home/index.html" rel="nofollow">NASA Goddard Space Flight Center</a></b> enables NASA’s mission through four scientific endeavors: Earth Science, Heliophysics, Solar System Exploration, and Astrophysics. Goddard plays a leading role in NASA’s accomplishments by contributing compelling scientific knowledge to advance the Agency’s mission. <b>Follow us on <a href="http://twitter.com/NASA_GoddardPix" rel="nofollow">Twitter</a></b> <b>Like us on <a href="http://www.facebook.com/pages/Greenbelt-MD/NASA-Goddard/395013845897?ref=tsd" rel="nofollow">Facebook</a></b> <b>Find us on <a href="http://web.stagram.com/n/nasagoddard/?vm=grid" rel="nofollow">Instagram</a></b>
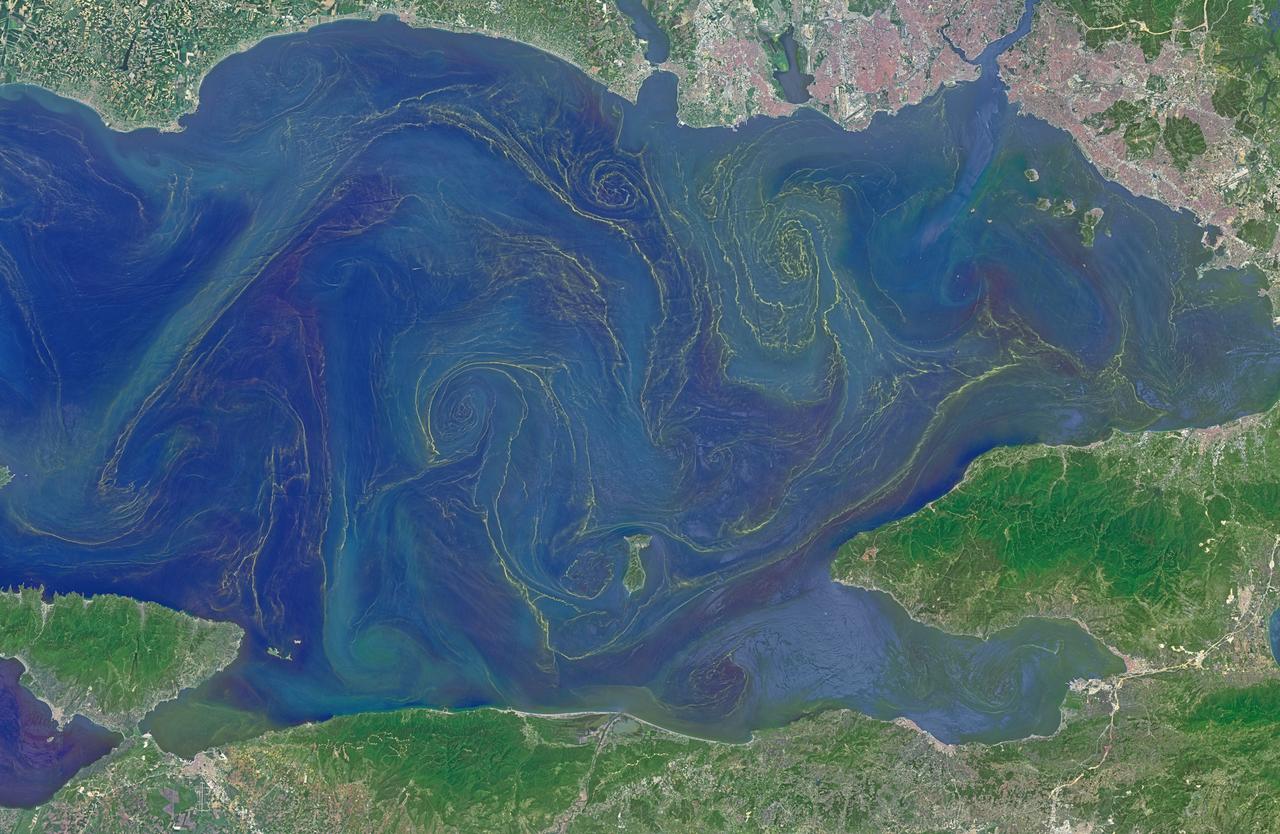
Situated between the Black Sea and the Aegean Sea, the Sea of Marmara is full of a rich soup of nutrients and life and surrounded by a rich history of civilization. Like the Black Sea to its northeast, the Marmara has an unusual layered structure with fresher water near the surface and much saltier water near the bottom. That fresh surface is fed by exchanges with the Black Sea and by flows from the Susurluk, Biga, and Gonen Rivers. The fresh water (just two thirds the salinity of the ocean) makes it easier for floating, plant-like organisms—phytoplankton—to grow, as does the abundance of nutrients pouring into the seas from European and Turkish rivers. The Operational Land Imager on the Landsat 8 satellite captured this image of a phytoplankton bloom in the Sea of Marmara on May 17, 2015. The sea is surrounded on all sides by the nation of Turkey. The swirling shapes on the water are phytoplankton, with the yellow-green and red-purple filaments likely (but not necessarily) representing different species. Those wavy colored lines not only show where the densest concentrations of plankton are floating, but also reveal the eddies and currents within the small sea. Waters rushing in through the narrow Bosphorous Strait (at Istanbul) and Dardanelles Strait (off the left side of the image), as well as a jagged coastline and tectonically fractured seafloor on this edge of the Asian and European continents, all conspire to create intricate mixing patterns. If you download the large image and open it in full resolution, you also can see ship tracks crossing the bloom lines. “I often see features in imagery and wonder: what could be causing that?” said Norman Kuring, an ocean color specialist at NASA Goddard. “Remote sensing is great for the big picture, but it still needs data from the surface for validation and interpretation.” According to scientists Baris Salihoglu of Turkey’s Institute of Marine Sciences and Ahsen Yuksek of Istanbul University, the blooms in the satellite image are mostly Prorocentrum micans and Noctiluca scintillans. They recently sampled the waters of the Marmara and found that Prorocentrum bloomed first, though Noctiluca eventually dominated. According to Ajit Subramaniam of the Lamont Doherty Earth Observatory, both species are dinoflagellates, known to discolor the water (red tides). Neither is directly toxic to humans, but they can kill marine life by becoming caught in fish gills, depleting the sea of oxygen, or excreting ammonia into the water. “Noctiluca is phagotrophic—a really interesting beast since it eats other phytoplankton that can then change its color,” Subramaniam noted. “It switches from being photosynthetic to becoming heterotrophic.” The Moderate Resolution Imaging Spectroradiometer (MODIS) on NASA’s Terra satellite captured wider views of bloom events in the Sea of Marmara on on May 23 and May 25. Credit: <b><a href="http://www.earthobservatory.nasa.gov/" rel="nofollow"> NASA Earth Observatory</a></b> Read more: <a href="http://earthobservatory.nasa.gov/IOTD/view.php?id=85947" rel="nofollow">earthobservatory.nasa.gov/IOTD/view.php?id=85947</a> <b><a href="http://www.nasa.gov/audience/formedia/features/MP_Photo_Guidelines.html" rel="nofollow">NASA image use policy.</a></b> <b><a href="http://www.nasa.gov/centers/goddard/home/index.html" rel="nofollow">NASA Goddard Space Flight Center</a></b> enables NASA’s mission through four scientific endeavors: Earth Science, Heliophysics, Solar System Exploration, and Astrophysics. Goddard plays a leading role in NASA’s accomplishments by contributing compelling scientific knowledge to advance the Agency’s mission. <b>Follow us on <a href="http://twitter.com/NASAGoddardPix" rel="nofollow">Twitter</a></b> <b>Like us on <a href="http://www.facebook.com/pages/Greenbelt-MD/NASA-Goddard/395013845897?ref=tsd" rel="nofollow">Facebook</a></b> <b>Find us on <a href="http://instagrid.me/nasagoddard/?vm=grid" rel="nofollow">Instagram</a></b>
Sea of Sand in Juventae Chasma
Sand Sea in False Color
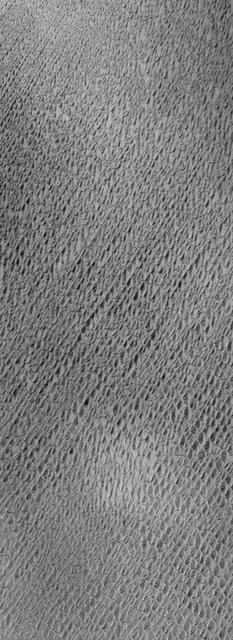
Northern Sand Sea
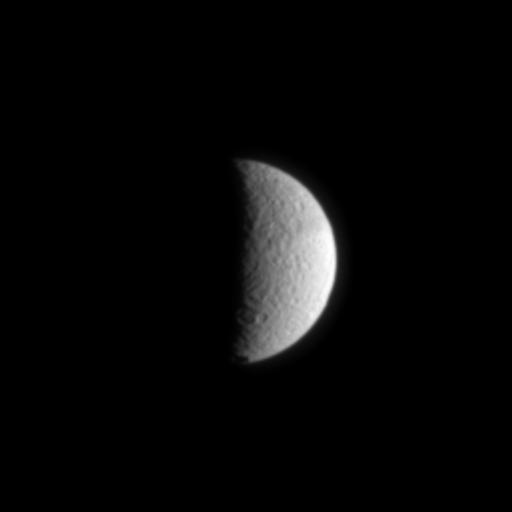
Tethys: The Sea Goddess
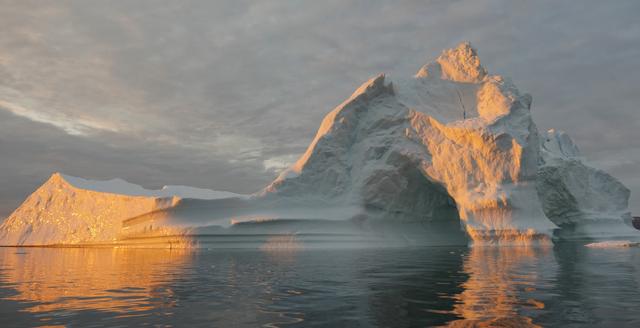
An iceberg is seen out the window of NASA's DC-8 research aircraft as it flies 2,000 feet above the Amundsen Sea in West Antarctica on Wednesday, Oct., 21, 2009. This was the fourth science flight of NASA’s Operation Ice Bridge airborne Earth science mission to study Antarctic ice sheets, sea ice, and ice shelves. Photo Credit: (NASA/Jane Peterson)
Sea level rise is a natural consequence of the warming of our planet. We know this from basic physics. When water heats up, it expands. So when the ocean warms, sea level rises. When ice is exposed to heat, it melts. And when ice on land melts and water runs into the ocean, sea level rises. For thousands of years, sea level has remained relatively stable and human communities have settled along the planet’s coastlines. But now Earth’s seas are rising. Globally, sea level has risen about eight inches since the beginning of the 20th century and more than two inches in the last 20 years alone. All signs suggest that this rise is accelerating. Read more: <a href="http://go.nasa.gov/1heZn29" rel="nofollow">go.nasa.gov/1heZn29</a> Caption: An iceberg floats in Disko Bay, near Ilulissat, Greenland, on July 24, 2015. The massive Greenland ice sheet is shedding about 300 gigatons of ice a year into the ocean, making it the single largest source of sea level rise from melting ice. Credits: NASA/Saskia Madlener <b><a href="http://www.nasa.gov/audience/formedia/features/MP_Photo_Guidelines.html" rel="nofollow">NASA image use policy.</a></b> <b><a href="http://www.nasa.gov/centers/goddard/home/index.html" rel="nofollow">NASA Goddard Space Flight Center</a></b> enables NASA’s mission through four scientific endeavors: Earth Science, Heliophysics, Solar System Exploration, and Astrophysics. Goddard plays a leading role in NASA’s accomplishments by contributing compelling scientific knowledge to advance the Agency’s mission. <b>Follow us on <a href="http://twitter.com/NASAGoddardPix" rel="nofollow">Twitter</a></b> <b>Like us on <a href="http://www.facebook.com/pages/Greenbelt-MD/NASA-Goddard/395013845897?ref=tsd" rel="nofollow">Facebook</a></b> <b>Find us on <a href="http://instagrid.me/nasagoddard/?vm=grid" rel="nofollow">Instagram</a></b>
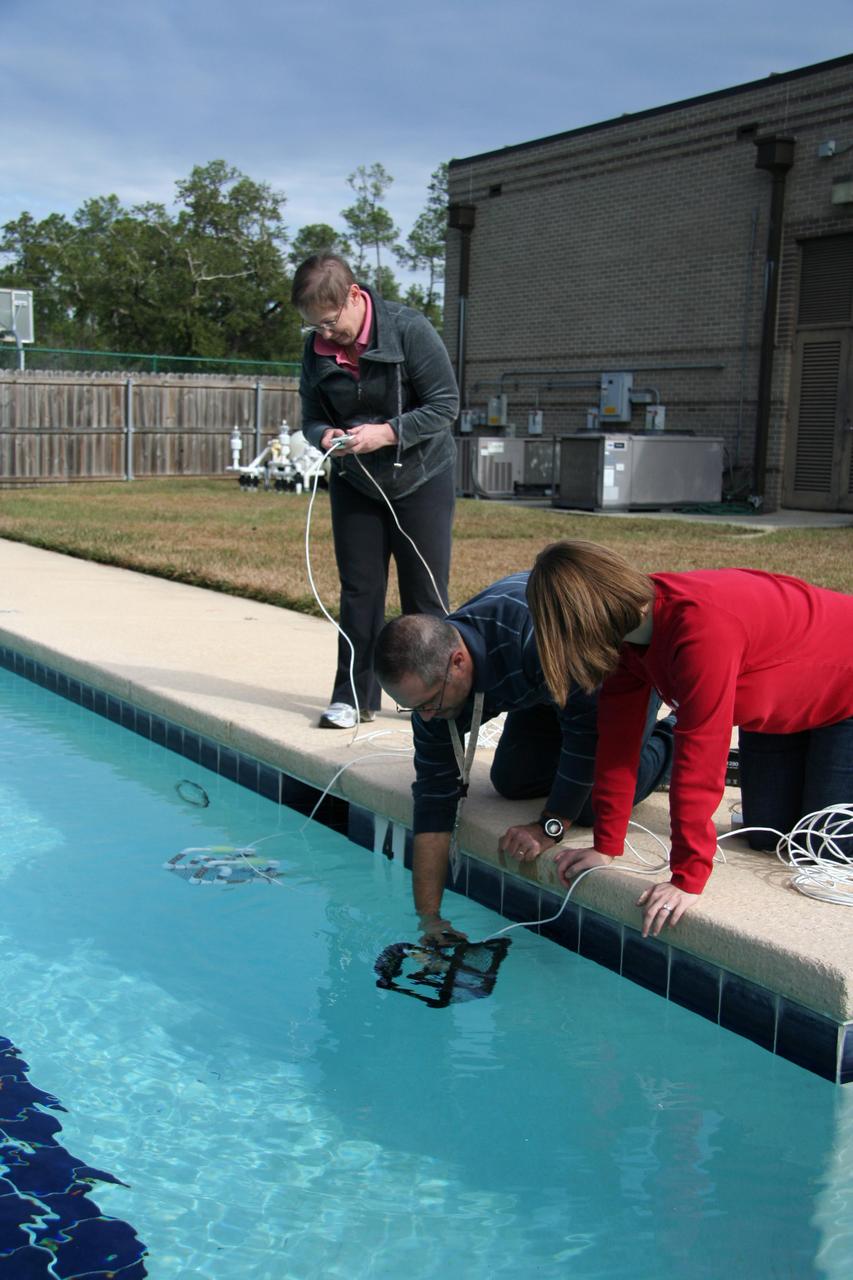
David Lalejini, an employee of the Naval Research Laboratory at NASA's John C. Stennis Space Center, helps a pair of teachers deploy a remotely-operated underwater Sea Perch robot during workshop activities Dec. 11. The Stennis Education Office teamed with Naval Research Laboratory counterparts to conduct a two-day workshop Dec. 10-11 for Louisiana and Mississippi teachers. During the no-cost workshop, teachers learned to build and operate Sea Perch robots. The teachers now can take the Sea Perch Program back to students.
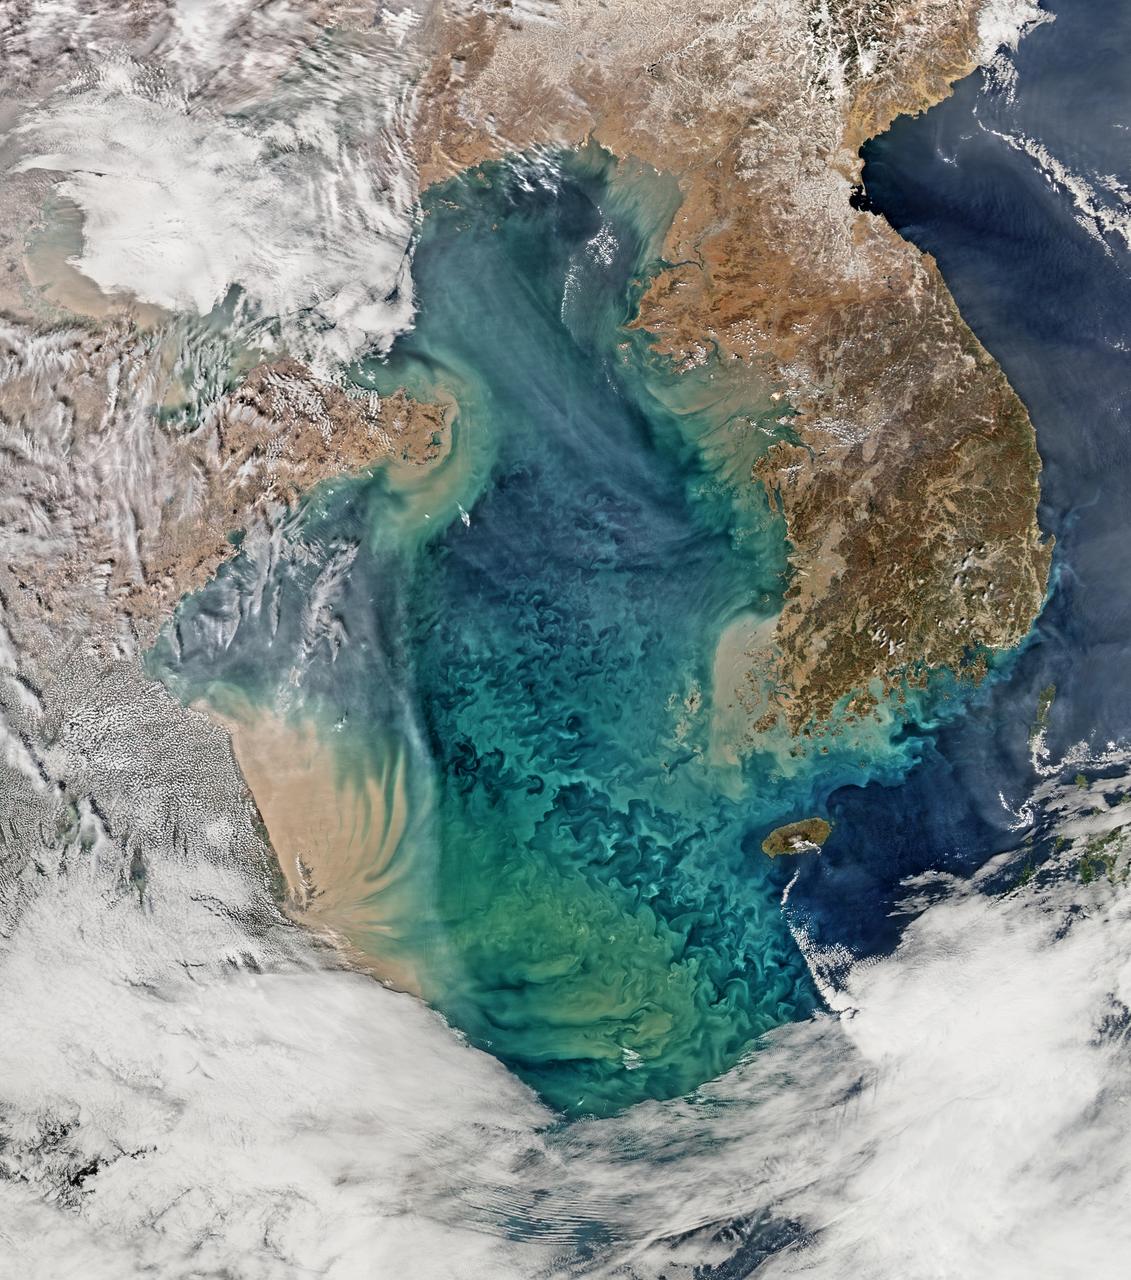
Remote sensing of ocean color in the Yellow Sea can be a challenge. Phytoplankton, suspended sediments, and dissolved organic matter color the water while various types of aerosols modify those colors before they are "seen" by orbiting radiometers. The Aqua-MODIS data used to create the above image were collected on February 24, 2015. NASA's OceanColor Web is supported by the Ocean Biology Processing Group (OBPG) at NASA's Goddard Space Flight Center. Our responsibilities include the collection, processing, calibration, validation, archive and distribution of ocean-related products from a large number of operational, satellite-based remote-sensing missions providing ocean color, sea surface temperature and sea surface salinity data to the international research community since 1996. Credit: NASA/Goddard/Ocean Color <b><a href="http://www.nasa.gov/audience/formedia/features/MP_Photo_Guidelines.html" rel="nofollow">NASA image use policy.</a></b> <b><a href="http://www.nasa.gov/centers/goddard/home/index.html" rel="nofollow">NASA Goddard Space Flight Center</a></b> enables NASA’s mission through four scientific endeavors: Earth Science, Heliophysics, Solar System Exploration, and Astrophysics. Goddard plays a leading role in NASA’s accomplishments by contributing compelling scientific knowledge to advance the Agency’s mission. <b>Follow us on <a href="http://twitter.com/NASAGoddardPix" rel="nofollow">Twitter</a></b> <b>Like us on <a href="http://www.facebook.com/pages/Greenbelt-MD/NASA-Goddard/395013845897?ref=tsd" rel="nofollow">Facebook</a></b> <b>Find us on <a href="http://instagram.com/nasagoddard?vm=grid" rel="nofollow">Instagram</a></b>
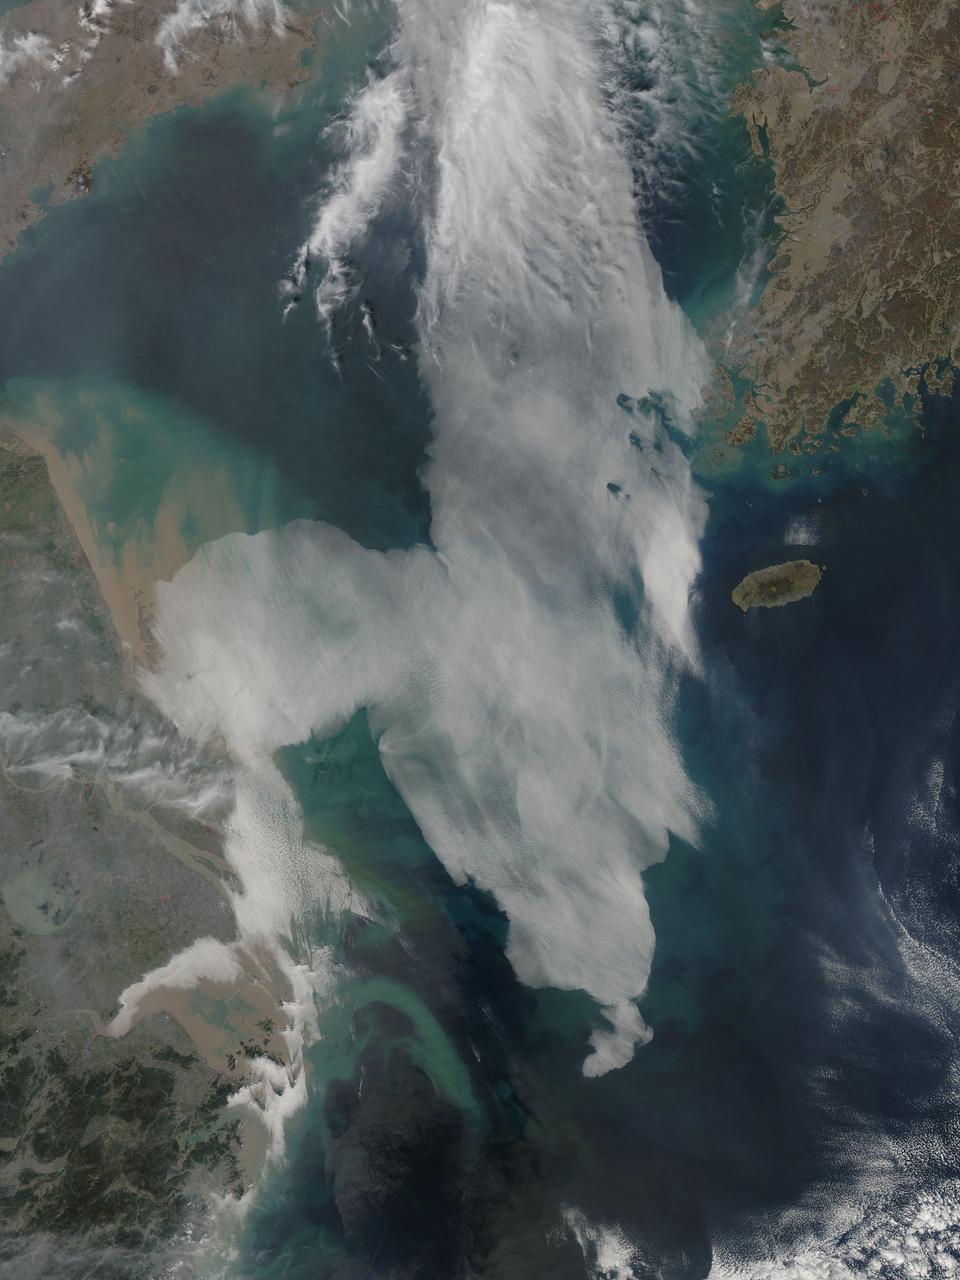
Low clouds over the Yellow Sea and the East China Sea was captured by the MODIS instrument on the Aqua satellite on April 1, 2016 at 4:55 UTC. Credit: NASA/Goddard/Jeff Schmaltz/MODIS Land Rapid Response Team <b><a href="http://www.nasa.gov/audience/formedia/features/MP_Photo_Guidelines.html" rel="nofollow">NASA image use policy.</a></b> <b><a href="http://www.nasa.gov/centers/goddard/home/index.html" rel="nofollow">NASA Goddard Space Flight Center</a></b> enables NASA’s mission through four scientific endeavors: Earth Science, Heliophysics, Solar System Exploration, and Astrophysics. Goddard plays a leading role in NASA’s accomplishments by contributing compelling scientific knowledge to advance the Agency’s mission. <b>Follow us on <a href="http://twitter.com/NASAGoddardPix" rel="nofollow">Twitter</a></b> <b>Like us on <a href="http://www.facebook.com/pages/Greenbelt-MD/NASA-Goddard/395013845897?ref=tsd" rel="nofollow">Facebook</a></b> <b>Find us on <a href="http://instagrid.me/nasagoddard/?vm=grid" rel="nofollow">Instagram</a></b>
During a flight over the Pine Island Glacier ice shelf, the DC-8 banks over the Amundsen Sea and the clean edge of the ice shelf front. The shelf drops about 200 feet from its surface to sea level. This image was taken on Oct. 26, 2011. Credit: NASA/GSFC/Jefferson Beck NASA's Operation IceBridge returns to a base camp of Punta Arenas, Chile for the third year of flights over Antarctica's changing sea ice, glaciers and ice sheets. NASA's DC-8, outfitted with seven remote-sensing instruments, and a Gulfstream 5 operated by the National Science Foundation and National Center for Atmospheric Research and outfitted with a high-altitude laser-ranging mapper, will fly from Chile over Antarctica in October and November. The mission is designed to record changes to Antarctica's ice sheets and give scientists insight into what is driving those changes. Follow the progress of the mission: Campaign News site: <a href="http://www.nasa.gov/mission_pages/icebridge/index.html" rel="nofollow">www.nasa.gov/mission_pages/icebridge/index.html</a> IceBridge blog: <a href="http://blogs.nasa.gov/cm/newui/blog/viewpostlist.jsp?blogname=icebridge" rel="nofollow">blogs.nasa.gov/cm/newui/blog/viewpostlist.jsp?blogname=ic...</a> Twitter: @nasa_ice <b><a href="http://www.nasa.gov/audience/formedia/features/MP_Photo_Guidelines.html" rel="nofollow">NASA image use policy.</a></b> <b><a href="http://www.nasa.gov/centers/goddard/home/index.html" rel="nofollow">NASA Goddard Space Flight Center</a></b> enables NASA’s mission through four scientific endeavors: Earth Science, Heliophysics, Solar System Exploration, and Astrophysics. Goddard plays a leading role in NASA’s accomplishments by contributing compelling scientific knowledge to advance the Agency’s mission. <b>Follow us on <a href="http://twitter.com/NASA_GoddardPix" rel="nofollow">Twitter</a></b> <b>Like us on <a href="http://www.facebook.com/pages/Greenbelt-MD/NASA-Goddard/395013845897?ref=tsd" rel="nofollow">Facebook</a></b> <b>Find us on <a href="http://instagrid.me/nasagoddard/?vm=grid" rel="nofollow">Instagram</a></b>
Smoke from Far Eastern Russia’s spring wildfires reached the Bering Sea by May 11, 2012. The Moderate Resolution Imaging Spectroradiometer aboard NASA’s Terra satellite passed over the region at 23:30 UTC on that same day and acquired this true-color image of a broad band of smoke stretching across the blue waters. In this image, the plume of smoke appears light gray while banks of cloud are bright white. Snow covers much of Kamchatka the land mass in the west. Karaginsky Island, just off Kamchatka’s eastern shore, is surrounded by sea ice. Clouds stream off the southwest shores of Beringa and Medny Islands. To the east, Attu Station, Alaska, is surrounded by cloud. In early May, numerous wildfires burned near Lake Baikal, in Siberia. These fires billowed heavy smoke across eastern Mongolia, China and Russia’s Far East. An image of the smoke and fires was captured on May 8 and appeared as the MODIS image of the day on May 11. That image can be viewed here: <a href="http://modis.gsfc.nasa.gov/gallery/individual.php?db_date=2012-05-11" rel="nofollow">modis.gsfc.nasa.gov/gallery/individual.php?db_date=2012-0...</a>. According to a model by the National Oceanic and Atmospheric Administration (NOAA), it is possible that smoke from the Lake Baikal region could take just a few days to reach the Bering Sea. Credit: NASA/GSFC/Jeff Schmaltz/MODIS Land Rapid Response Team <b><a href="http://www.nasa.gov/audience/formedia/features/MP_Photo_Guidelines.html" rel="nofollow">NASA image use policy.</a></b> <b><a href="http://www.nasa.gov/centers/goddard/home/index.html" rel="nofollow">NASA Goddard Space Flight Center</a></b> enables NASA’s mission through four scientific endeavors: Earth Science, Heliophysics, Solar System Exploration, and Astrophysics. Goddard plays a leading role in NASA’s accomplishments by contributing compelling scientific knowledge to advance the Agency’s mission. <b>Follow us on <a href="http://twitter.com/NASA_GoddardPix" rel="nofollow">Twitter</a></b> <b>Like us on <a href="http://www.facebook.com/pages/Greenbelt-MD/NASA-Goddard/395013845897?ref=tsd" rel="nofollow">Facebook</a></b> <b>Find us on <a href="http://instagrid.me/nasagoddard/?vm=grid" rel="nofollow">Instagram</a></b>
The Sea of Galilee (or Sea of Kinneret) in northern Israel is the lowest freshwater lake on Earth. The lake's main source is the Jordan River, in the Jordan Rift Valley. In antiquity, the Greeks, Hasmoneans, and Romans founded towns on the lake. In the New Testament, much of the ministry of Jesus occured on the shores of the Sea. (Information from Wikipedia.) The image was acquired October 14, 2018, and is located at 32.8 degrees north, 35.6 degrees east. https://photojournal.jpl.nasa.gov/catalog/PIA24130
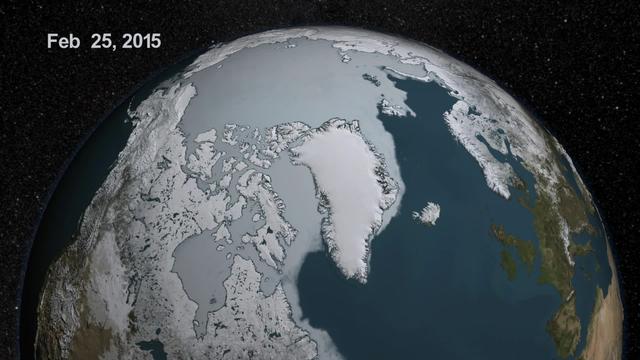
As the sun sets over the Arctic, the end of this year’s melt season is quickly approaching and the sea ice cover has already shrunk to the fourth lowest in the satellite record. With possibly some days of melting left, the sea ice extent could still drop to the second or third lowest on record. Arctic sea ice, which regulates the planet’s temperature by bouncing solar energy back to space, has been on a steep decline for the last two decades. This animation shows the evolution of Arctic sea ice in 2015, from its annual maximum wintertime extent, reached on February 25, to September 6. Credit: NASA Scientific Visualization Studio DOWNLOAD THIS VIDEO HERE: <a href="https://svs.gsfc.nasa.gov/cgi-bin/details.cgi?aid=11999" rel="nofollow">svs.gsfc.nasa.gov/cgi-bin/details.cgi?aid=11999</a> <b><a href="http://www.nasa.gov/audience/formedia/features/MP_Photo_Guidelines.html" rel="nofollow">NASA image use policy.</a></b> <b><a href="http://www.nasa.gov/centers/goddard/home/index.html" rel="nofollow">NASA Goddard Space Flight Center</a></b> enables NASA’s mission through four scientific endeavors: Earth Science, Heliophysics, Solar System Exploration, and Astrophysics. Goddard plays a leading role in NASA’s accomplishments by contributing compelling scientific knowledge to advance the Agency’s mission. <b>Follow us on <a href="http://twitter.com/NASAGoddardPix" rel="nofollow">Twitter</a></b> <b>Like us on <a href="http://www.facebook.com/pages/Greenbelt-MD/NASA-Goddard/395013845897?ref=tsd" rel="nofollow">Facebook</a></b> <b>Find us on <a href="http://instagrid.me/nasagoddard/?vm=grid" rel="nofollow">Instagram</a></b>
The Dead Sea is the lowest point on Earth at 418 meters below sea level, and also one of the saltiest bodies of water on Earth. This image was acquired by NASA Terra spacecraft.
NASA image acquired August 31, 2010 To see a detail of this image go to: <a href="http://www.flickr.com/photos/gsfc/4971318856/">www.flickr.com/photos/gsfc/4971318856/</a> In this natural-color image from August 31, 2010, the ocean’s canvas swirls with turquoise, teal, navy, and green, the abstract art of the natural world. The colors were painted by a massive phytoplankton bloom made up of millions of tiny, light-reflecting organisms growing in the sunlit surface waters of the Barents Sea. Such blooms peak every August in the Barents Sea. The variations in color are caused by different species and concentrations of phytoplankton. The bright blue colors are probably from coccolithophores, a type of phytoplankton that is coated in a chalky shell that reflects light, turning the ocean a milky turquoise. Coccolithophores dominate the Barents Sea in August. Shades of green are likely from diatoms, another type of phytoplankton. Diatoms usually dominate the Barents Sea earlier in the year, giving way to coccolithophores in the late summer. However, field measurements of previous August blooms have also turned up high concentrations of diatoms. The Barents Sea is a shallow sea sandwiched between the coastline of northern Russia and Scandinavia and the islands of Svalbard, Franz Josef Land, and Novaya Zemlya. Within the shallow basin, currents carrying warm, salty water from the Atlantic collide with currents carrying cold, fresher water from the Arctic. During the winter, strong winds drive the currents and mix the waters. When winter’s sea ice retreats and light returns in the spring, diatoms thrive, typically peaking in a large bloom in late May. The shift between diatoms and coccolithophores occurs as the Barents Sea changes during the summer months. Throughout summer, perpetual light falls on the waters, gradually warming the surface. Eventually, the ocean stratifies into layers, with warm water sitting on top of cooler water. The diatoms deplete most of the nutrients in the surface waters and stop growing. Coccolithophores, on the other hand, do well in warm, nutrient-depleted water with a lot of light. In the Barents Sea, these conditions are strongest in August. The shifting conditions and corresponding change in species lead to strikingly beautiful multicolored blooms such as this one. The Moderate Resolution Imaging Spectroradiometer (MODIS) on NASA’s Aqua satellite acquired this image. NASA image courtesy Norman Kuring, NASA Ocean Color Group. Caption by Holli Riebeek. Instrument: Aqua - MODIS Click here to see more images from <b><a href="#//earthobservatory.nasa.gov/" rel="nofollow"> NASA Goddard’s Earth Observatory</a></b> <b><a href="http://www.nasa.gov/centers/goddard/home/index.html" rel="nofollow">NASA Goddard Space Flight Center</a></b> is home to the nation's largest organization of combined scientists, engineers and technologists that build spacecraft, instruments and new technology to study the Earth, the sun, our solar system, and the universe. <b>Follow us on <a href="http://twitter.com/NASA_GoddardPix" rel="nofollow">Twitter</a></b> <b>Join us on <a href="http://www.facebook.com/pages/Greenbelt-MD/NASA-Goddard/395013845897?ref=tsd" rel="nofollow">Facebook</a></b>

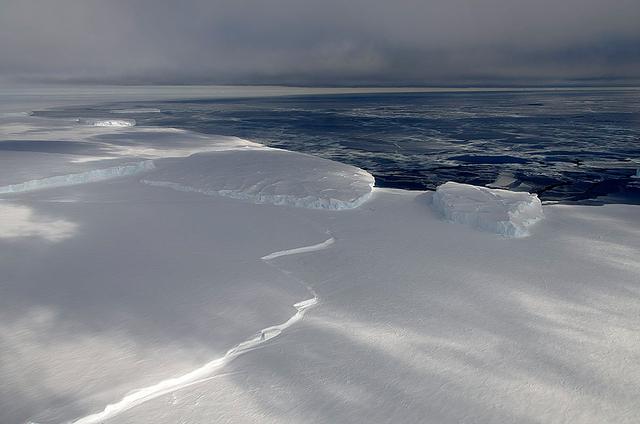
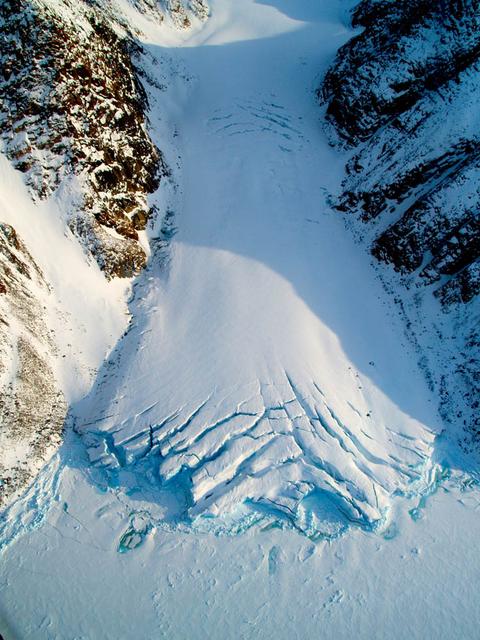
A small hole in the clouds revealed newly formed sea ice in the Bellingshausen Sea next to an ice berg on Nov. 5, 2014 flight. Image Credit: NASA/Digital Mapping System NASA’s Operation IceBridge collected some rare images on a flight out of Punta Arenas, Chile on Nov. 5, 2014, on a science flight over western Antarctica dubbed Ferrigno-Alison-Abbott 01. The crew snapped a few shots of a calving front of the Antarctic ice sheet. This particular flight plan was designed to collect data on changes in ice elevation along the coast near the Ferrigno and Alison ice streams, on the Abbot Ice Shelf, and grounded ice along the Eights Coast.
November 21, 2013 - NASA's Operation IceBridge P-3 landed a few minutes ago after a successful survey of sea ice in the Ross Sea. In this photo taken by project scientist Michael Studinger we see icebergs in Sulzberger Bay off of the eastern portion of the Ross Sea. NASA's Operation IceBridge is an airborne science mission to study Earth's polar ice. In 2013, IceBridge is conducting its first field campaign directly from Antarctica. For more information about IceBridge, visit: <a href="http://www.nasa.gov/icebridge" rel="nofollow">www.nasa.gov/icebridge</a> Credit: NASA/GSFC/Michael Studinger <b><a href="http://www.nasa.gov/audience/formedia/features/MP_Photo_Guidelines.html" rel="nofollow">NASA image use policy.</a></b> <b><a href="http://www.nasa.gov/centers/goddard/home/index.html" rel="nofollow">NASA Goddard Space Flight Center</a></b> enables NASA’s mission through four scientific endeavors: Earth Science, Heliophysics, Solar System Exploration, and Astrophysics. Goddard plays a leading role in NASA’s accomplishments by contributing compelling scientific knowledge to advance the Agency’s mission. <b>Follow us on <a href="http://twitter.com/NASA_GoddardPix" rel="nofollow">Twitter</a></b> <b>Like us on <a href="http://www.facebook.com/pages/Greenbelt-MD/NASA-Goddard/395013845897?ref=tsd" rel="nofollow">Facebook</a></b> <b>Find us on <a href="http://instagram.com/nasagoddard?vm=grid" rel="nofollow">Instagram</a></b>
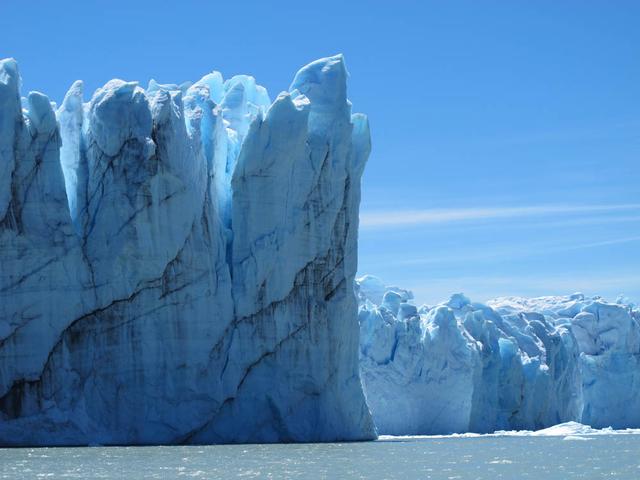
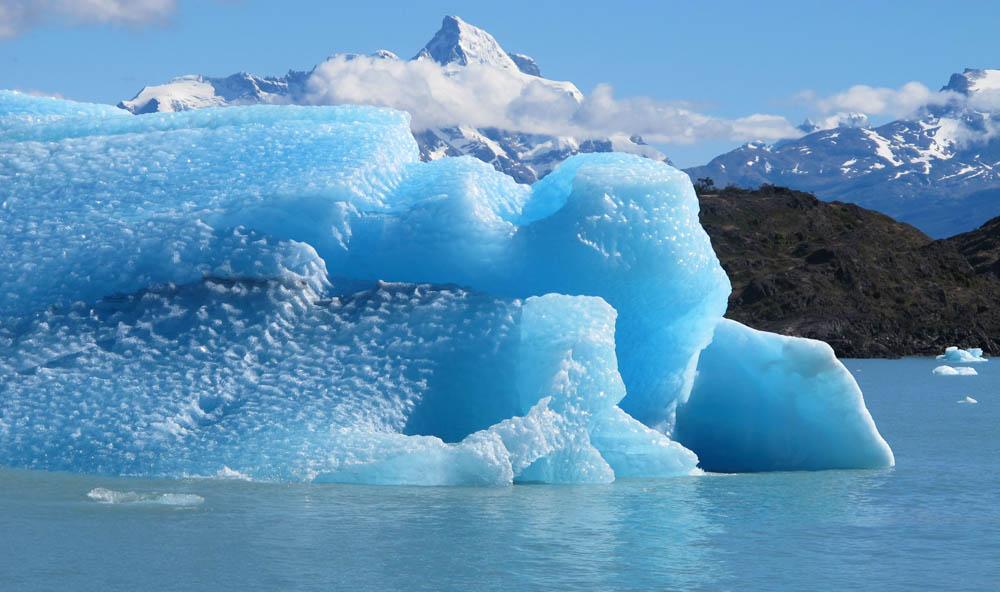
Calving front of the Perito Moreno Glacier (Argentina). Contrary to the majority of the glaciers from the southern Patagonian ice field, the Perito Moreno Glacier is currently stable. It is also one of the most visited glaciers in the world. To learn about the contributions of glaciers to sea level rise, visit: <a href="http://www.nasa.gov/topics/earth/features/glacier-sea-rise.html" rel="nofollow">www.nasa.gov/topics/earth/features/glacier-sea-rise.html</a> Credit: Etienne Berthier, Université de Toulouse <b><a href="http://www.nasa.gov/audience/formedia/features/MP_Photo_Guidelines.html" rel="nofollow">NASA image use policy.</a></b> <b><a href="http://www.nasa.gov/centers/goddard/home/index.html" rel="nofollow">NASA Goddard Space Flight Center</a></b> enables NASA’s mission through four scientific endeavors: Earth Science, Heliophysics, Solar System Exploration, and Astrophysics. Goddard plays a leading role in NASA’s accomplishments by contributing compelling scientific knowledge to advance the Agency’s mission. <b>Follow us on <a href="http://twitter.com/NASA_GoddardPix" rel="nofollow">Twitter</a></b> <b>Like us on <a href="http://www.facebook.com/pages/Greenbelt-MD/NASA-Goddard/395013845897?ref=tsd" rel="nofollow">Facebook</a></b> <b>Find us on <a href="http://instagram.com/nasagoddard?vm=grid" rel="nofollow">Instagram</a></b>
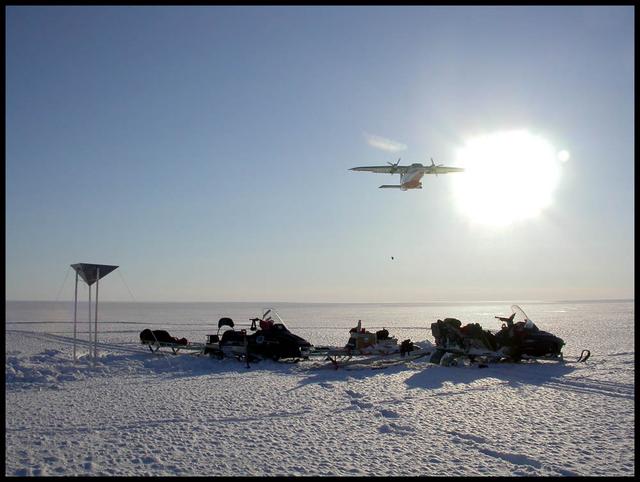
An airplane drops essential support on the Austfonna Ice Cap in Svalbard (Norwegian Arctic). The triangular structure is a corner reflector used as ground reference for airborne radar surveys. To learn about the contributions of glaciers to sea level rise, visit: <a href="http://www.nasa.gov/topics/earth/features/glacier-sea-rise.html" rel="nofollow">www.nasa.gov/topics/earth/features/glacier-sea-rise.html</a> Credit: Andrea Taurisano, Norwegian Polar Institute <b><a href="http://www.nasa.gov/audience/formedia/features/MP_Photo_Guidelines.html" rel="nofollow">NASA image use policy.</a></b> <b><a href="http://www.nasa.gov/centers/goddard/home/index.html" rel="nofollow">NASA Goddard Space Flight Center</a></b> enables NASA’s mission through four scientific endeavors: Earth Science, Heliophysics, Solar System Exploration, and Astrophysics. Goddard plays a leading role in NASA’s accomplishments by contributing compelling scientific knowledge to advance the Agency’s mission. <b>Follow us on <a href="http://twitter.com/NASA_GoddardPix" rel="nofollow">Twitter</a></b> <b>Like us on <a href="http://www.facebook.com/pages/Greenbelt-MD/NASA-Goddard/395013845897?ref=tsd" rel="nofollow">Facebook</a></b> <b>Find us on <a href="http://instagram.com/nasagoddard?vm=grid" rel="nofollow">Instagram</a></b>
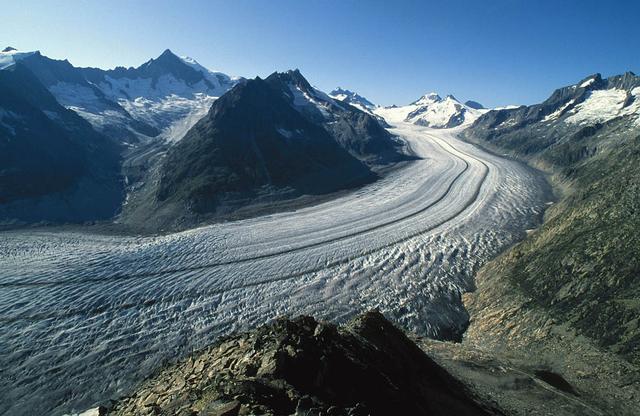
The Aletsch Glacier in Switzerland is the largest valley glacier in the Alps. Its volume loss since the middle of the 19th century is well-visible from the trimlines to the right of the image. To learn about the contributions of glaciers to sea level rise, visit: <a href="http://www.nasa.gov/topics/earth/features/glacier-sea-rise.html" rel="nofollow">www.nasa.gov/topics/earth/features/glacier-sea-rise.html</a> Credit: Frank Paul, University of Zurich <b><a href="http://www.nasa.gov/audience/formedia/features/MP_Photo_Guidelines.html" rel="nofollow">NASA image use policy.</a></b> <b><a href="http://www.nasa.gov/centers/goddard/home/index.html" rel="nofollow">NASA Goddard Space Flight Center</a></b> enables NASA’s mission through four scientific endeavors: Earth Science, Heliophysics, Solar System Exploration, and Astrophysics. Goddard plays a leading role in NASA’s accomplishments by contributing compelling scientific knowledge to advance the Agency’s mission. <b>Follow us on <a href="http://twitter.com/NASA_GoddardPix" rel="nofollow">Twitter</a></b> <b>Like us on <a href="http://www.facebook.com/pages/Greenbelt-MD/NASA-Goddard/395013845897?ref=tsd" rel="nofollow">Facebook</a></b> <b>Find us on <a href="http://instagram.com/nasagoddard?vm=grid" rel="nofollow">Instagram</a></b>
Small valley glacier exiting the Devon Island Ice Cap in Canada. To learn about the contributions of glaciers to sea level rise, visit: <a href="http://www.nasa.gov/topics/earth/features/glacier-sea-rise.html" rel="nofollow">www.nasa.gov/topics/earth/features/glacier-sea-rise.html</a> Credit: Alex Gardner, Clark University <b><a href="http://www.nasa.gov/audience/formedia/features/MP_Photo_Guidelines.html" rel="nofollow">NASA image use policy.</a></b> <b><a href="http://www.nasa.gov/centers/goddard/home/index.html" rel="nofollow">NASA Goddard Space Flight Center</a></b> enables NASA’s mission through four scientific endeavors: Earth Science, Heliophysics, Solar System Exploration, and Astrophysics. Goddard plays a leading role in NASA’s accomplishments by contributing compelling scientific knowledge to advance the Agency’s mission. <b>Follow us on <a href="http://twitter.com/NASA_GoddardPix" rel="nofollow">Twitter</a></b> <b>Like us on <a href="http://www.facebook.com/pages/Greenbelt-MD/NASA-Goddard/395013845897?ref=tsd" rel="nofollow">Facebook</a></b> <b>Find us on <a href="http://instagram.com/nasagoddard?vm=grid" rel="nofollow">Instagram</a></b>

Aerial view of the Sverdrup Glacier, a river of ice that flows from the interior of the Devon Island Ice Cap (Canada) into the ocean. To learn about the contributions of glaciers to sea level rise, visit: <a href="http://www.nasa.gov/topics/earth/features/glacier-sea-rise.html" rel="nofollow">www.nasa.gov/topics/earth/features/glacier-sea-rise.html</a> Credit: Alex Gardner, Clark University <b><a href="http://www.nasa.gov/audience/formedia/features/MP_Photo_Guidelines.html" rel="nofollow">NASA image use policy.</a></b> <b><a href="http://www.nasa.gov/centers/goddard/home/index.html" rel="nofollow">NASA Goddard Space Flight Center</a></b> enables NASA’s mission through four scientific endeavors: Earth Science, Heliophysics, Solar System Exploration, and Astrophysics. Goddard plays a leading role in NASA’s accomplishments by contributing compelling scientific knowledge to advance the Agency’s mission. <b>Follow us on <a href="http://twitter.com/NASA_GoddardPix" rel="nofollow">Twitter</a></b> <b>Like us on <a href="http://www.facebook.com/pages/Greenbelt-MD/NASA-Goddard/395013845897?ref=tsd" rel="nofollow">Facebook</a></b> <b>Find us on <a href="http://instagram.com/nasagoddard?vm=grid" rel="nofollow">Instagram</a></b>
Summit camp on top of the Austfonna Ice Cap in Svalbard (Norwegian Arctic). To learn about the contributions of glaciers to sea level rise, visit: <a href="http://www.nasa.gov/topics/earth/features/glacier-sea-rise.html" rel="nofollow">www.nasa.gov/topics/earth/features/glacier-sea-rise.html</a> Credit: Thorben Dunse, University of Oslo <b><a href="http://www.nasa.gov/audience/formedia/features/MP_Photo_Guidelines.html" rel="nofollow">NASA image use policy.</a></b> <b><a href="http://www.nasa.gov/centers/goddard/home/index.html" rel="nofollow">NASA Goddard Space Flight Center</a></b> enables NASA’s mission through four scientific endeavors: Earth Science, Heliophysics, Solar System Exploration, and Astrophysics. Goddard plays a leading role in NASA’s accomplishments by contributing compelling scientific knowledge to advance the Agency’s mission. <b>Follow us on <a href="http://twitter.com/NASA_GoddardPix" rel="nofollow">Twitter</a></b> <b>Like us on <a href="http://www.facebook.com/pages/Greenbelt-MD/NASA-Goddard/395013845897?ref=tsd" rel="nofollow">Facebook</a></b> <b>Find us on <a href="http://instagram.com/nasagoddard?vm=grid" rel="nofollow">Instagram</a></b>
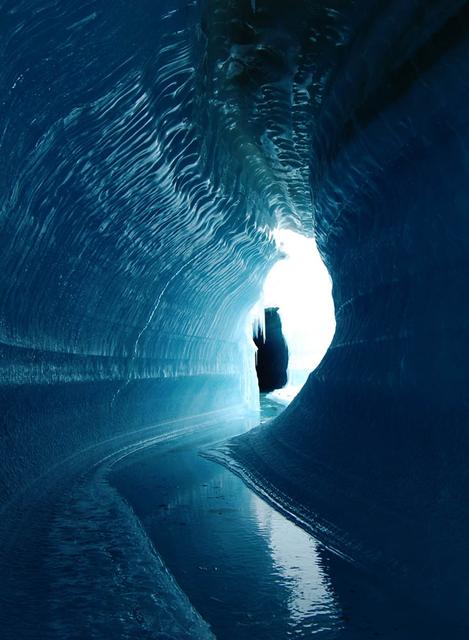
This ice cave in Belcher Glacier (Devon Island, Canada) was formed by melt water flowing within the glacier ice. To learn about the contributions of glaciers to sea level rise, visit: <a href="http://www.nasa.gov/topics/earth/features/glacier-sea-rise.html" rel="nofollow">www.nasa.gov/topics/earth/features/glacier-sea-rise.html</a> Credit: Angus Duncan, University of Saskatchewan <b><a href="http://www.nasa.gov/audience/formedia/features/MP_Photo_Guidelines.html" rel="nofollow">NASA image use policy.</a></b> <b><a href="http://www.nasa.gov/centers/goddard/home/index.html" rel="nofollow">NASA Goddard Space Flight Center</a></b> enables NASA’s mission through four scientific endeavors: Earth Science, Heliophysics, Solar System Exploration, and Astrophysics. Goddard plays a leading role in NASA’s accomplishments by contributing compelling scientific knowledge to advance the Agency’s mission. <b>Follow us on <a href="http://twitter.com/NASA_GoddardPix" rel="nofollow">Twitter</a></b> <b>Like us on <a href="http://www.facebook.com/pages/Greenbelt-MD/NASA-Goddard/395013845897?ref=tsd" rel="nofollow">Facebook</a></b> <b>Find us on <a href="http://instagram.com/nasagoddard?vm=grid" rel="nofollow">Instagram</a></b>
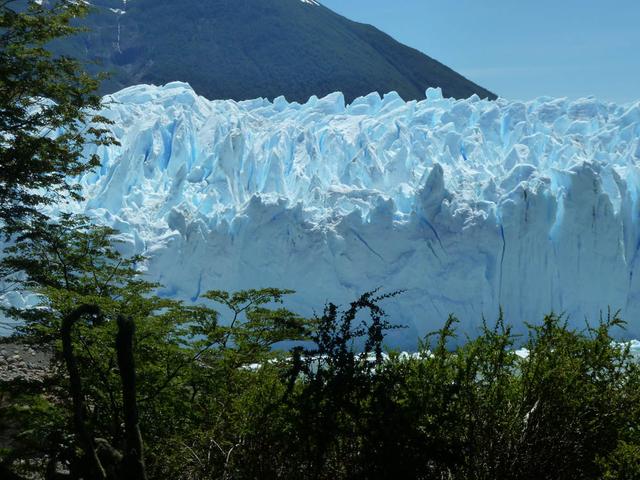
Calving front of the Perito Moreno Glacier (Argentina). Contrary to the majority of the glaciers from the southern Patagonian ice field, the Perito Moreno Glacier is currently stable. It is also one of the most visited glaciers in the world. To learn about the contributions of glaciers to sea level rise, visit: <a href="http://www.nasa.gov/topics/earth/features/glacier-sea-rise.html" rel="nofollow">www.nasa.gov/topics/earth/features/glacier-sea-rise.html</a> Credit: Etienne Berthier, Université de Toulouse <b><a href="http://www.nasa.gov/audience/formedia/features/MP_Photo_Guidelines.html" rel="nofollow">NASA image use policy.</a></b> <b><a href="http://www.nasa.gov/centers/goddard/home/index.html" rel="nofollow">NASA Goddard Space Flight Center</a></b> enables NASA’s mission through four scientific endeavors: Earth Science, Heliophysics, Solar System Exploration, and Astrophysics. Goddard plays a leading role in NASA’s accomplishments by contributing compelling scientific knowledge to advance the Agency’s mission. <b>Follow us on <a href="http://twitter.com/NASA_GoddardPix" rel="nofollow">Twitter</a></b> <b>Like us on <a href="http://www.facebook.com/pages/Greenbelt-MD/NASA-Goddard/395013845897?ref=tsd" rel="nofollow">Facebook</a></b> <b>Find us on <a href="http://instagram.com/nasagoddard?vm=grid" rel="nofollow">Instagram</a></b>
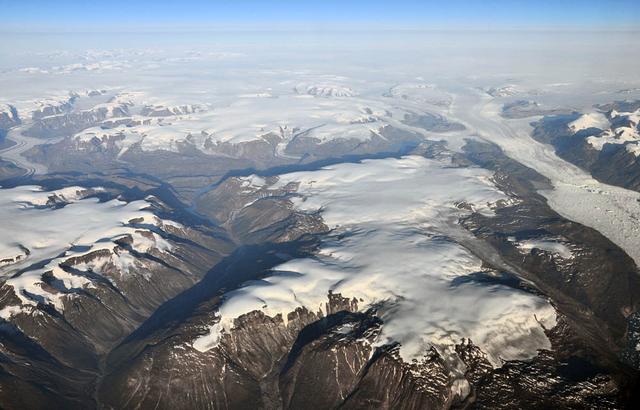
Peripheral glaciers and ice caps (isolated from the main ice sheet, which is seen in the upper right section of the image) in eastern Greenland. To learn about the contributions of glaciers to sea level rise, visit: <a href="http://www.nasa.gov/topics/earth/features/glacier-sea-rise.html" rel="nofollow">www.nasa.gov/topics/earth/features/glacier-sea-rise.html</a> Credit: Frank Paul, University of Zurich <b><a href="http://www.nasa.gov/audience/formedia/features/MP_Photo_Guidelines.html" rel="nofollow">NASA image use policy.</a></b> <b><a href="http://www.nasa.gov/centers/goddard/home/index.html" rel="nofollow">NASA Goddard Space Flight Center</a></b> enables NASA’s mission through four scientific endeavors: Earth Science, Heliophysics, Solar System Exploration, and Astrophysics. Goddard plays a leading role in NASA’s accomplishments by contributing compelling scientific knowledge to advance the Agency’s mission. <b>Follow us on <a href="http://twitter.com/NASA_GoddardPix" rel="nofollow">Twitter</a></b> <b>Like us on <a href="http://www.facebook.com/pages/Greenbelt-MD/NASA-Goddard/395013845897?ref=tsd" rel="nofollow">Facebook</a></b> <b>Find us on <a href="http://instagram.com/nasagoddard?vm=grid" rel="nofollow">Instagram</a></b>
Melt water ponded at surface in the accumulation zone of Columbia Glacier, Alaska, in July 2008. To learn about the contributions of glaciers to sea level rise, visit: <a href="http://www.nasa.gov/topics/earth/features/glacier-sea-rise.html" rel="nofollow">www.nasa.gov/topics/earth/features/glacier-sea-rise.html</a> Credit: W. Tad Pfeffer, University of Colorado at Boulder <b><a href="http://www.nasa.gov/audience/formedia/features/MP_Photo_Guidelines.html" rel="nofollow">NASA image use policy.</a></b> <b><a href="http://www.nasa.gov/centers/goddard/home/index.html" rel="nofollow">NASA Goddard Space Flight Center</a></b> enables NASA’s mission through four scientific endeavors: Earth Science, Heliophysics, Solar System Exploration, and Astrophysics. Goddard plays a leading role in NASA’s accomplishments by contributing compelling scientific knowledge to advance the Agency’s mission. <b>Follow us on <a href="http://twitter.com/NASA_GoddardPix" rel="nofollow">Twitter</a></b> <b>Like us on <a href="http://www.facebook.com/pages/Greenbelt-MD/NASA-Goddard/395013845897?ref=tsd" rel="nofollow">Facebook</a></b> <b>Find us on <a href="http://instagram.com/nasagoddard?vm=grid" rel="nofollow">Instagram</a></b>
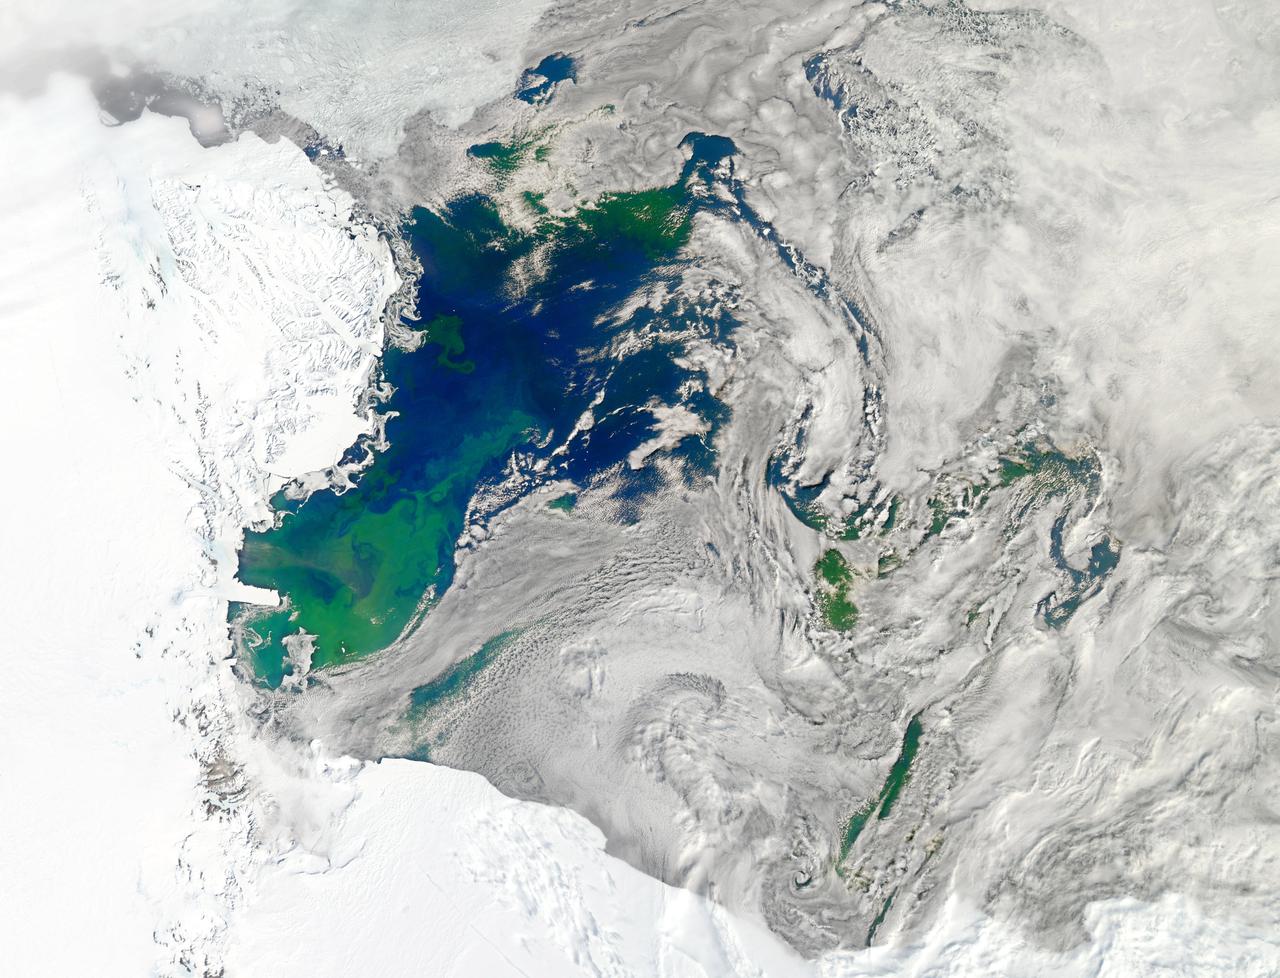
NASA image acquired January 22, 2011 Every southern spring and summer, after the Sun has risen into its 24-hour circuit around the skies of Antarctica, the Ross Sea bursts with life. Floating, microscopic plants, known as phytoplankton, soak up the sunlight and the nutrients stirring in the Southern Ocean and grow into prodigious blooms. Those blooms become a great banquet for krill, fish, penguins, whales, and other marine species who carve out a living in the cool waters of the far south. This true-color image captures such a bloom in the Ross Sea on January 22, 2011, as viewed by the Moderate Resolution Imaging Spectroradiometer (MODIS) on NASA’s Aqua satellite. Bright greens of plant-life have replaced the deep blues of open ocean water. The Ross Sea is a relatively shallow bay in the Antarctic coastline and due south from New Zealand. As the spring weather thaws the sea ice around Antarctica, areas of open water surrounded by ice—polynyas—open up on the continental shelf. In this open water, sunlight provides the fuel and various current systems provide nutrients from deeper waters to form blooms that can stretch 100 to 200 kilometers (60 to 120 miles). These blooms are among the largest in extent and abundance in the world. Scientists have hypothesized that the Modified Circumpolar Deep Water is the engine behind the blooms, stirring up just the right mix of trace metals and minerals from the deep to sustain plankton growth. This month, researchers aboard the U.S. icebreaking ship Nathaniel B. Palmer are cruising in the Ross Sea in search of the signatures of this current system. NASA image courtesy Norman Kuring, Ocean Color Team at NASA Goddard Space Flight Center. Caption by Mike Carlowicz, with information from Hugh Powell, COSEE-NOW. Instrument: Aqua - MODIS Go here to download the full high res file: <a href="http://earthobservatory.nasa.gov/IOTD/view.php?id=48949" rel="nofollow">earthobservatory.nasa.gov/IOTD/view.php?id=48949</a> Credit: <b><a href="http://www.earthobservatory.nasa.gov/" rel="nofollow"> NASA Earth Observatory</a></b> <b><a href="http://www.nasa.gov/audience/formedia/features/MP_Photo_Guidelines.html" rel="nofollow">NASA image use policy.</a></b> <b><a href="http://www.nasa.gov/centers/goddard/home/index.html" rel="nofollow">NASA Goddard Space Flight Center</a></b> enables NASA’s mission through four scientific endeavors: Earth Science, Heliophysics, Solar System Exploration, and Astrophysics. Goddard plays a leading role in NASA’s accomplishments by contributing compelling scientific knowledge to advance the Agency’s mission. <b>Follow us on <a href="http://twitter.com/NASA_GoddardPix" rel="nofollow">Twitter</a></b> <b>Like us on <a href="http://www.facebook.com/pages/Greenbelt-MD/NASA-Goddard/395013845897?ref=tsd" rel="nofollow">Facebook</a></b> <b>Find us on <a href="http://instagrid.me/nasagoddard/?vm=grid" rel="nofollow">Instagram</a></b>
Large blooms of phytoplankton (likely coccolithophores) surrounded the 51-kilometer-long St. Matthew Island in the Bering Sea on October 8, 2014 when the above Aqua-MODIS image was collected. The swirls and eddies of color give some indication of the turbulent nature of these waters. The reflective blooms have been visible from orbit for a few months now. Credit: NASA/Goddard/Aqua/MODIS <b><a href="http://www.nasa.gov/audience/formedia/features/MP_Photo_Guidelines.html" rel="nofollow">NASA image use policy.</a></b> <b><a href="http://www.nasa.gov/centers/goddard/home/index.html" rel="nofollow">NASA Goddard Space Flight Center</a></b> enables NASA’s mission through four scientific endeavors: Earth Science, Heliophysics, Solar System Exploration, and Astrophysics. Goddard plays a leading role in NASA’s accomplishments by contributing compelling scientific knowledge to advance the Agency’s mission. <b>Follow us on <a href="http://twitter.com/NASAGoddardPix" rel="nofollow">Twitter</a></b> <b>Like us on <a href="http://www.facebook.com/pages/Greenbelt-MD/NASA-Goddard/395013845897?ref=tsd" rel="nofollow">Facebook</a></b> <b>Find us on <a href="http://instagram.com/nasagoddard?vm=grid" rel="nofollow">Instagram</a></b>
On July 20, the U.S. Coast Guard Cutter Healy steamed south in the Arctic Ocean toward the edge of the sea ice. The ICESCAPE mission, or "Impacts of Climate on Ecosystems and Chemistry of the Arctic Pacific Environment," is NASA's two-year shipborne investigation to study how changing conditions in the Arctic affect the ocean's chemistry and ecosystems. The bulk of the research takes place in the Beaufort and Chukchi seas in summer 2010 and 2011. Credit: NASA/Kathryn Hansen For updates on the five-week ICESCAPE voyage, visit the mission blog at: go.usa.gov/WwU <b><a href="http://www.nasa.gov/audience/formedia/features/MP_Photo_Guidelines.html" rel="nofollow">NASA image use policy.</a></b> <b><a href="http://www.nasa.gov/centers/goddard/home/index.html" rel="nofollow">NASA Goddard Space Flight Center</a></b> enables NASA’s mission through four scientific endeavors: Earth Science, Heliophysics, Solar System Exploration, and Astrophysics. Goddard plays a leading role in NASA’s accomplishments by contributing compelling scientific knowledge to advance the Agency’s mission. <b>Follow us on <a href="http://twitter.com/NASA_GoddardPix" rel="nofollow">Twitter</a></b> <b>Like us on <a href="http://www.facebook.com/pages/Greenbelt-MD/NASA-Goddard/395013845897?ref=tsd" rel="nofollow">Facebook</a></b> <b>Find us on <a href="http://instagrid.me/nasagoddard/?vm=grid" rel="nofollow">Instagram</a></b>
iss071e462182 (Aug. 9, 2024) --- Barsakelmes Nature Reserve in the Aral Sea in Kazakhstan is pictured from the International Space Station as it orbited 263 miles above the Central Asian nation.
NASA image acquired August 17, 2010 In mid-August 2010, the Northwest Passage was almost—but not quite—free of ice. The ice content in the northern route through the passage (through the Western Parry Channel) was very light, but ice remained in McClure (or M’Clure) Strait. The Moderate Resolution Imaging Spectroradiometer (MODIS) on NASA’s Terra satellite captured this natural-color image on August 17, 2010. Although most of McClure Strait looks perfectly ice-free, immediately west of Prince Patrick Island, a band of sea ice stretches southward across the strait (left edge of the image). The National Snow and Ice Data Center Sea Ice News and Analysis blog reported that even more ice remained in the southern route (through Amundsen’s Passage) of the Northwest Passage in mid-August 2010. Nevertheless, the ice content in the northern route was not only well below the 1968–2000 average, but also nearly a month ahead of the clearing observed in 2007, when Arctic sea ice set a record low. As of mid-August 2010, however, overall sea ice extent was higher than it had been at the same time of year in 2007. Credit: NASA/GSFC/Jeff Schmaltz/MODIS Land Rapid Response Team Caption by Michon Scott. To learn more go to: <a href="http://earthobservatory.nasa.gov/NaturalHazards/view.php?id=45333" rel="nofollow">earthobservatory.nasa.gov/NaturalHazards/view.php?id=45333</a> Instrument: Terra - MODIS <b><a href="http://www.nasa.gov/centers/goddard/home/index.html" rel="nofollow">NASA Goddard Space Flight Center</a></b> is home to the nation's largest organization of combined scientists, engineers and technologists that build spacecraft, instruments and new technology to study the Earth, the sun, our solar system, and the universe. <b>Follow us on <a href="http://twitter.com/NASA_GoddardPix" rel="nofollow">Twitter</a></b> <b>Join us on <a href="http://www.facebook.com/pages/Greenbelt-MD/NASA-Goddard/395013845897?ref=tsd" rel="nofollow">Facebook</a><b> Click here to see more images from <b><a href="#//earthobservatory.nasa.gov/" rel="nofollow"> NASA Goddard’s Earth Observatory</a></b></b></b>
NASA image acquired January 22, 2011 To see a detail of this image go to: <a href="http://www.flickr.com/photos/gsfc/5398237910">www.flickr.com/photos/gsfc/5398237910</a> Every southern spring and summer, after the Sun has risen into its 24-hour circuit around the skies of Antarctica, the Ross Sea bursts with life. Floating, microscopic plants, known as phytoplankton, soak up the sunlight and the nutrients stirring in the Southern Ocean and grow into prodigious blooms. Those blooms become a great banquet for krill, fish, penguins, whales, and other marine species who carve out a living in the cool waters of the far south. This true-color image captures such a bloom in the Ross Sea on January 22, 2011, as viewed by the Moderate Resolution Imaging Spectroradiometer (MODIS) on NASA’s Aqua satellite. Bright greens of plant-life have replaced the deep blues of open ocean water. The Ross Sea is a relatively shallow bay in the Antarctic coastline and due south from New Zealand. As the spring weather thaws the sea ice around Antarctica, areas of open water surrounded by ice—polynyas—open up on the continental shelf. In this open water, sunlight provides the fuel and various current systems provide nutrients from deeper waters to form blooms that can stretch 100 to 200 kilometers (60 to 120 miles). These blooms are among the largest in extent and abundance in the world. Scientists have hypothesized that the Modified Circumpolar Deep Water is the engine behind the blooms, stirring up just the right mix of trace metals and minerals from the deep to sustain plankton growth. This month, researchers aboard the U.S. icebreaking ship Nathaniel B. Palmer are cruising in the Ross Sea in search of the signatures of this current system. NASA image courtesy Norman Kuring, Ocean Color Team at NASA Goddard Space Flight Center. Caption by Mike Carlowicz, with information from Hugh Powell, COSEE-NOW. Instrument: Aqua - MODIS Credit: <b><a href="http://www.earthobservatory.nasa.gov/" rel="nofollow"> NASA Earth Observatory</a></b> <a href="http://earthobservatory.nasa.gov/IOTD/view.php?id=48949" rel="nofollow">earthobservatory.nasa.gov/IOTD/view.php?id=48949</a> <b><a href="http://www.nasa.gov/centers/goddard/home/index.html" rel="nofollow">NASA Goddard Space Flight Center</a></b> enables NASA’s mission through four scientific endeavors: Earth Science, Heliophysics, Solar System Exploration, and Astrophysics. Goddard plays a leading role in NASA’s accomplishments by contributing compelling scientific knowledge to advance the Agency’s mission. <b>Follow us on <a href="http://twitter.com/NASA_GoddardPix" rel="nofollow">Twitter</a></b> <b>Join us on <a href="http://www.facebook.com/pages/Greenbelt-MD/NASA-Goddard/395013845897?ref=tsd" rel="nofollow">Facebook</a></b>
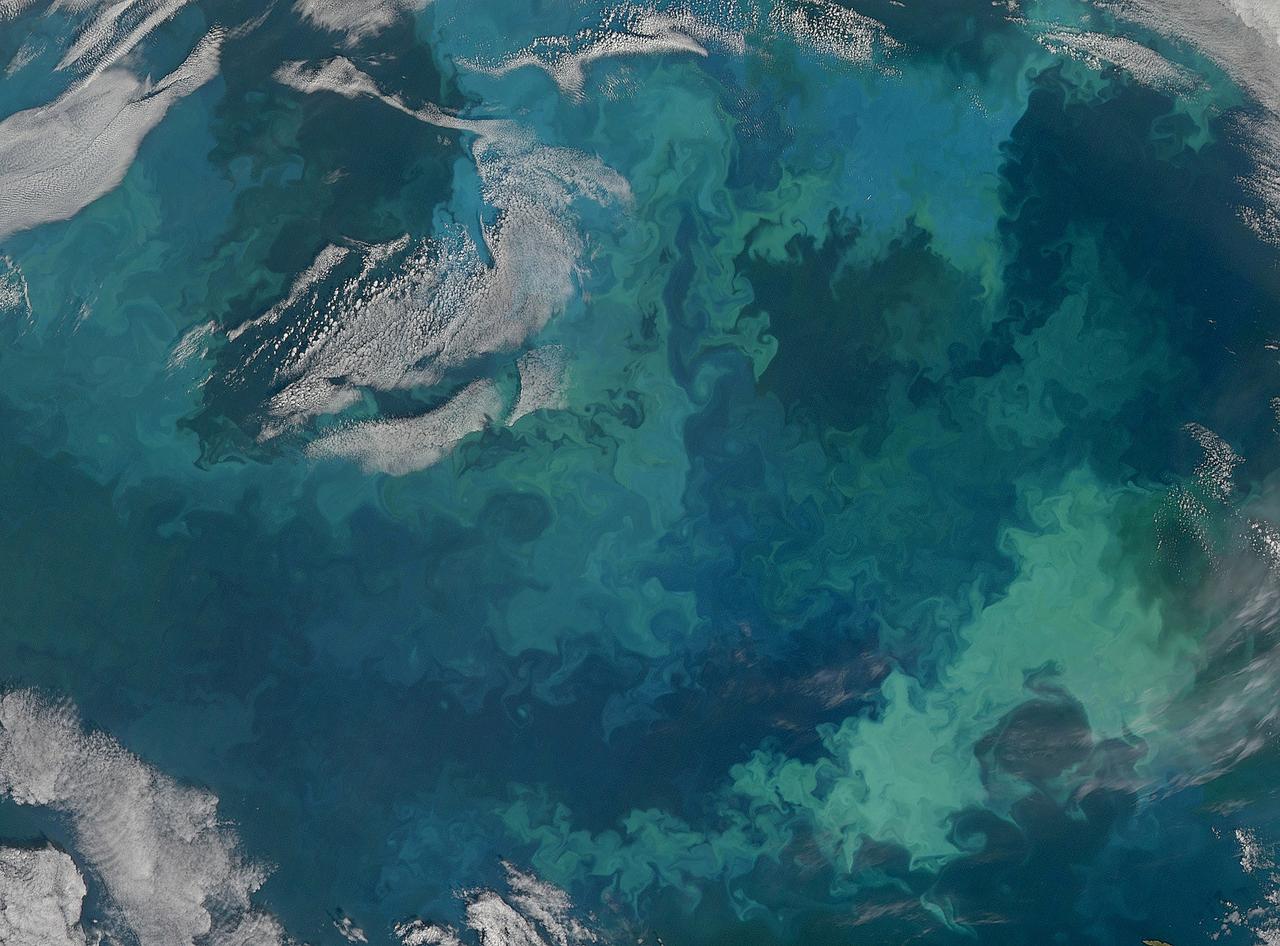
NASA image acquired August 31, 2010 To see the full view of this image go to: <a href="http://www.flickr.com/photos/gsfc/4970549945">www.flickr.com/photos/gsfc/4970549945</a> In this natural-color image from August 31, 2010, the ocean’s canvas swirls with turquoise, teal, navy, and green, the abstract art of the natural world. The colors were painted by a massive phytoplankton bloom made up of millions of tiny, light-reflecting organisms growing in the sunlit surface waters of the Barents Sea. Such blooms peak every August in the Barents Sea. The variations in color are caused by different species and concentrations of phytoplankton. The bright blue colors are probably from coccolithophores, a type of phytoplankton that is coated in a chalky shell that reflects light, turning the ocean a milky turquoise. Coccolithophores dominate the Barents Sea in August. Shades of green are likely from diatoms, another type of phytoplankton. Diatoms usually dominate the Barents Sea earlier in the year, giving way to coccolithophores in the late summer. However, field measurements of previous August blooms have also turned up high concentrations of diatoms. The Barents Sea is a shallow sea sandwiched between the coastline of northern Russia and Scandinavia and the islands of Svalbard, Franz Josef Land, and Novaya Zemlya. Within the shallow basin, currents carrying warm, salty water from the Atlantic collide with currents carrying cold, fresher water from the Arctic. During the winter, strong winds drive the currents and mix the waters. When winter’s sea ice retreats and light returns in the spring, diatoms thrive, typically peaking in a large bloom in late May. The shift between diatoms and coccolithophores occurs as the Barents Sea changes during the summer months. Throughout summer, perpetual light falls on the waters, gradually warming the surface. Eventually, the ocean stratifies into layers, with warm water sitting on top of cooler water. The diatoms deplete most of the nutrients in the surface waters and stop growing. Coccolithophores, on the other hand, do well in warm, nutrient-depleted water with a lot of light. In the Barents Sea, these conditions are strongest in August. The shifting conditions and corresponding change in species lead to strikingly beautiful multicolored blooms such as this one. The Moderate Resolution Imaging Spectroradiometer (MODIS) on NASA’s Aqua satellite acquired this image. NASA image courtesy Norman Kuring, NASA Ocean Color Group. Caption by Holli Riebeek. Instrument: Aqua - MODIS Click here to see more images from <b><a href="#//earthobservatory.nasa.gov/" rel="nofollow"> NASA Goddard’s Earth Observatory</a></b> <b><a href="http://www.nasa.gov/centers/goddard/home/index.html" rel="nofollow">NASA Goddard Space Flight Center</a></b> is home to the nation's largest organization of combined scientists, engineers and technologists that build spacecraft, instruments and new technology to study the Earth, the sun, our solar system, and the universe. <b>Follow us on <a href="http://twitter.com/NASA_GoddardPix" rel="nofollow">Twitter</a></b> <b>Join us on <a href="http://www.facebook.com/pages/Greenbelt-MD/NASA-Goddard/395013845897?ref=tsd" rel="nofollow">Facebook</a></b>

Located off the east coast of Russia, the Sea of Okhotsk stretches down to 45 degrees North latitude, and sea ice forms regularly in the basin. In fact, it is the lowest latitude for seasonal sea ice formation in the world. On January 4, 2015, the Moderate Resolution Imaging Spectroradiometer (MODIS) on NASA’s Terra satellite captured this true-color image of the ice-covered Sea of Okhotsk. Every winter, winds from East Siberia, frigid air temperatures, and a large amount of freshwater flowing out from rivers promote the formation of sea ice in the region. Much of the freshwater comes from the Amur River, one of the ten longest rivers in the world. From year to year, variations in temperature and wind speed can cause large fluctuations in sea ice extent. The sea spans more than 1,500,000 square kilometers (600,000 square miles), and ice cover can spread across 50 to 90 percent of it at its annual peak. On average, that ice persists for 180 days. According to research published in 2014, the region's sea ice has been decreasing over a 34-year period. Annual ice production in the Sea of Okhotsk dropped by more than 11 percent from 1974 to 2008. The researchers suggest that this decline has, at least in part, "led to weakening of the overturning in the North Pacific." Water with less sea ice is fresher, less dense, and unable to sink and circulate as well as salty, dense water. A weakened circulation in the North Pacific has implications for the supply of nutrients, such as iron, that affect biological productivity. Credit: NASA/GSFC/Jeff Schmaltz/MODIS Land Rapid Response Team <b><a href="http://www.nasa.gov/audience/formedia/features/MP_Photo_Guidelines.html" rel="nofollow">NASA image use policy.</a></b> <b><a href="http://www.nasa.gov/centers/goddard/home/index.html" rel="nofollow">NASA Goddard Space Flight Center</a></b> enables NASA’s mission through four scientific endeavors: Earth Science, Heliophysics, Solar System Exploration, and Astrophysics. Goddard plays a leading role in NASA’s accomplishments by contributing compelling scientific knowledge to advance the Agency’s mission. <b>Follow us on <a href="http://twitter.com/NASAGoddardPix" rel="nofollow">Twitter</a></b> <b>Like us on <a href="http://www.facebook.com/pages/Greenbelt-MD/NASA-Goddard/395013845897?ref=tsd" rel="nofollow">Facebook</a></b> <b>Find us on <a href="http://instagram.com/nasagoddard?vm=grid" rel="nofollow">Instagram</a></b>

On April 5, 2015, the Moderate Resolution Imaging Spectroradiometer (MODIS) on NASA’s Terra satellite acquired this natural-color image of sea ice off the coast of East Antarctica’s Princess Astrid Coast. White areas close to the continent are sea ice, while white areas in the northeast corner of the image are clouds. One way to better distinguish ice from clouds is with false-color imagery. In the false-color view of the scene here, ice is blue and clouds are white. The image was acquired after Antarctic sea ice had passed its annual minimum extent (reached on February 20, 2015), and had resumed expansion toward its maximum extent (usually reached in September). Credit: NASA image by Jeff Schmaltz, LANCE/EOSDIS Rapid Response. Caption by Kathryn Hansen via NASA's Earth Observatory Read more: <a href="http://www.nasa.gov/content/sea-ice-off-east-antarcticas-princess-astrid-coast/" rel="nofollow">www.nasa.gov/content/sea-ice-off-east-antarcticas-princes...</a> <b><a href="http://www.nasa.gov/audience/formedia/features/MP_Photo_Guidelines.html" rel="nofollow">NASA image use policy.</a></b> <b><a href="http://www.nasa.gov/centers/goddard/home/index.html" rel="nofollow">NASA Goddard Space Flight Center</a></b> enables NASA’s mission through four scientific endeavors: Earth Science, Heliophysics, Solar System Exploration, and Astrophysics. Goddard plays a leading role in NASA’s accomplishments by contributing compelling scientific knowledge to advance the Agency’s mission. <b>Follow us on <a href="http://twitter.com/NASAGoddardPix" rel="nofollow">Twitter</a></b> <b>Like us on <a href="http://www.facebook.com/pages/Greenbelt-MD/NASA-Goddard/395013845897?ref=tsd" rel="nofollow">Facebook</a></b> <b>Find us on <a href="http://instagrid.me/nasagoddard/?vm=grid" rel="nofollow">Instagram</a></b>
There has been considerable interest in the recent state of Arctic sea ice for scientific research and for operational applications especially along the Northern Sea Route and the Northwest Passage.
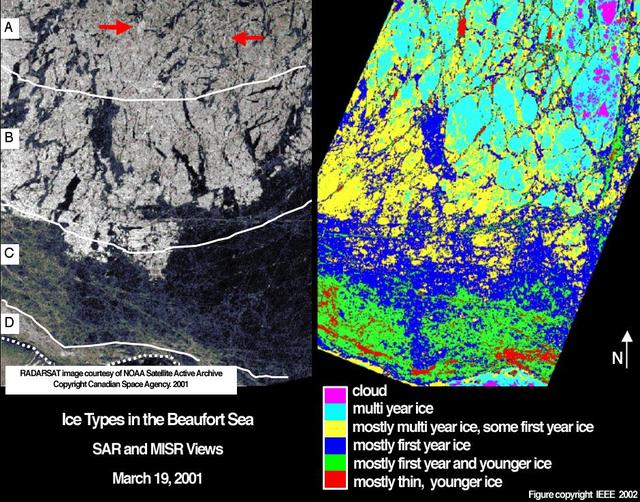
Sea ice in the Beaufort Sea off the north coast of Alaska was classified and mapped in these concurrent images acquired March 19, 2001 by NASA Terra spacecraft.
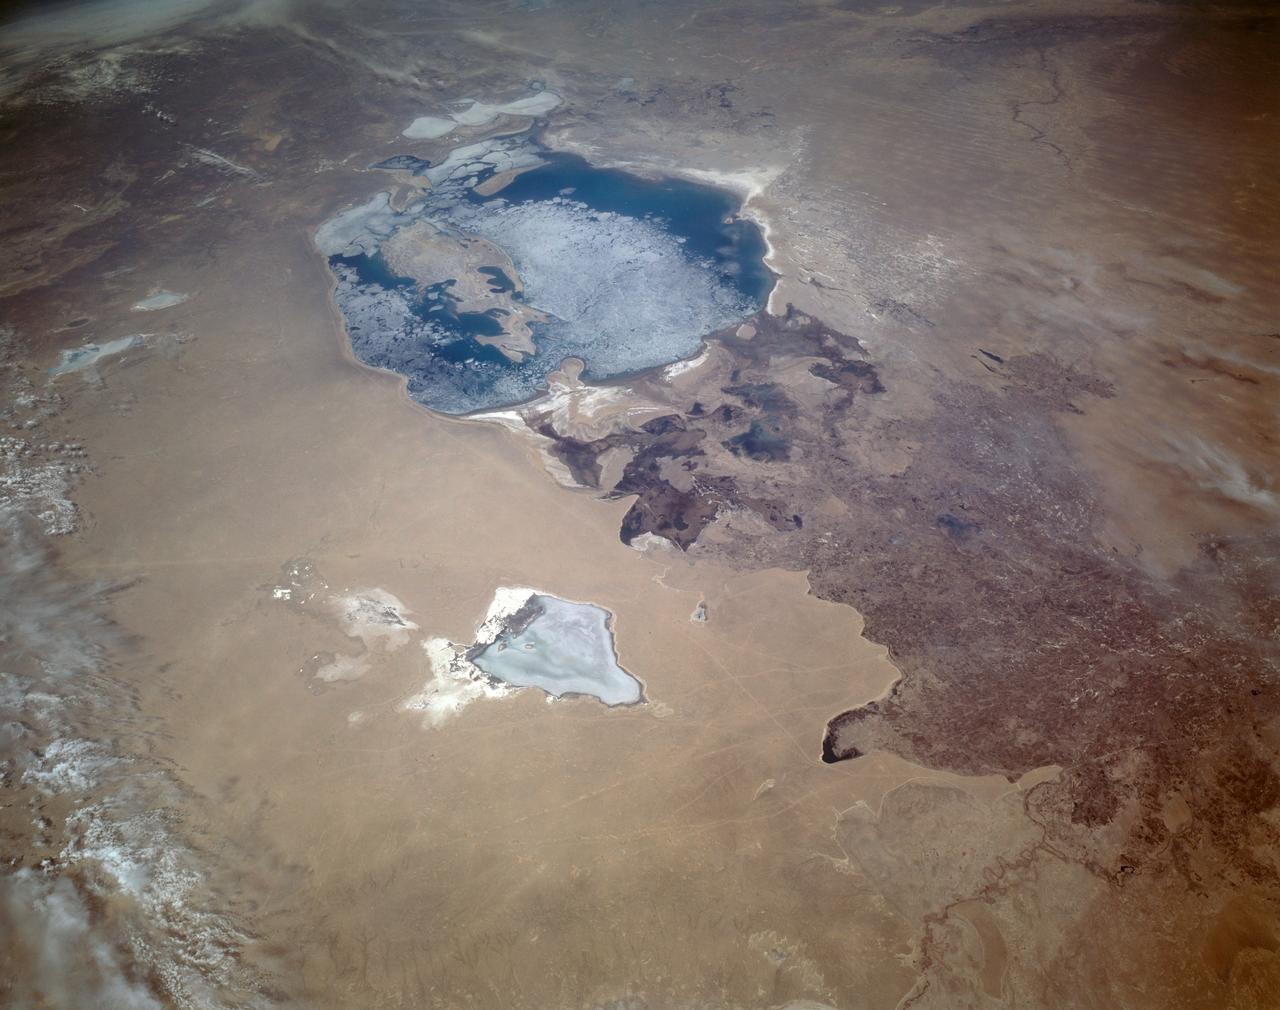
STS059-L22-140 (9-20 April 1994) --- View northeastward across Uzbekastan to the partly-ice-covered Aral Sea and Kazakhstan. The irrigated fan-delta of the Amu Darya extends from the right side of the photograph to end in extensive salt flats at the south end of the sea. The Aral was the fourth-largest inland sea or lake in the world, until diversion and over-use of the river water for irrigation led, in this arid climate, to the sea's decline. Linhof camera.

On February 4, 2014 the Moderate Resolution Imaging Spectroradiometer (MODIS) flying aboard NASA’s Aqua satellite captured a true-color image of sea ice off of western Alaska. In this true-color image, the snow and ice covered land appears bright white while the floating sea ice appears a duller grayish-white. Snow over the land is drier, and reflects more light back to the instrument, accounting for the very bright color. Ice overlying oceans contains more water, and increasing water decreases reflectivity of ice, resulting in duller colors. Thinner ice is also duller. The ocean waters are tinted with green, likely due to a combination of sediment and phytoplankton. Alaska lies to the east in this image, and Russia to the west. The Bering Strait, covered with ice, lies between to two. South of the Bering Strait, the waters are known as the Bering Sea. To the north lies the Chukchi Sea. The bright white island south of the Bering Strait is St. Lawrence Island. Home to just over 1200 people, the windswept island belongs to the United States, but sits closer to Russia than to Alaska. To the southeast of the island a dark area, loosely covered with floating sea ice, marks a persistent polynya – an area of open water surrounded by more frozen sea ice. Due to the prevailing winds, which blow the sea ice away from the coast in this location, the area rarely completely freezes. The ice-covered areas in this image, as well as the Beaufort Sea, to the north, are critical areas for the survival of the ringed seal, a threatened species. The seals use the sea ice, including ice caves, to rear their young, and use the free-floating sea ice for molting, raising the young and breeding. In December 2014, the National Oceanic and Atmospheric Administration (NOAA) proposed that much of this region be set aside as critical, protected habitat for the ringed seal. Credit: NASA/GSFC/Jeff Schmaltz/MODIS Land Rapid Response Team <b><a href="http://www.nasa.gov/audience/formedia/features/MP_Photo_Guidelines.html" rel="nofollow">NASA image use policy.</a></b> <b><a href="http://www.nasa.gov/centers/goddard/home/index.html" rel="nofollow">NASA Goddard Space Flight Center</a></b> enables NASA’s mission through four scientific endeavors: Earth Science, Heliophysics, Solar System Exploration, and Astrophysics. Goddard plays a leading role in NASA’s accomplishments by contributing compelling scientific knowledge to advance the Agency’s mission. <b>Follow us on <a href="http://twitter.com/NASAGoddardPix" rel="nofollow">Twitter</a></b> <b>Like us on <a href="http://www.facebook.com/pages/Greenbelt-MD/NASA-Goddard/395013845897?ref=tsd" rel="nofollow">Facebook</a></b> <b>Find us on <a href="http://instagram.com/nasagoddard?vm=grid" rel="nofollow">Instagram</a></b>
The Operational Land Imager (OLI) on Landsat 8 captured this view of a phytoplankton bloom near Alaska’s Pribilof Islands on Sept. 22, 2014. The Pribilofs are surrounded by nutrient-rich waters in the Bering Sea. The milky green and light blue shading of the water indicates the presence of vast populations of microscopic phytoplankton—mostly coccolithophores, which have calcite scales that appear white in satellite images. Such phytoplankton form the foundation of a tremendously productive habitat for fish and birds. Blooms in the Bering Sea increase significantly in springtime, after winter ice cover retreats and nutrients and freshened water are abundant near the ocean surface. Phytoplankton populations plummet in summertime as the water warms, surface nutrients are depleted by blooms, and the plant-like organisms are depleted by grazing fish, zooplankton, and other marine life. By autumn, storms can stir nutrients back to the surface and cooler waters make better bloom conditions. More information: <a href="http://earthobservatory.nasa.gov/IOTD/view.php?id=85043&eocn=home&eoci=iotd_readmore" rel="nofollow">earthobservatory.nasa.gov/IOTD/view.php?id=85043&eocn...</a> Image Credit: NASA/Landsat 8 <b><a href="http://www.nasa.gov/audience/formedia/features/MP_Photo_Guidelines.html" rel="nofollow">NASA image use policy.</a></b> <b><a href="http://www.nasa.gov/centers/goddard/home/index.html" rel="nofollow">NASA Goddard Space Flight Center</a></b> enables NASA’s mission through four scientific endeavors: Earth Science, Heliophysics, Solar System Exploration, and Astrophysics. Goddard plays a leading role in NASA’s accomplishments by contributing compelling scientific knowledge to advance the Agency’s mission. <b>Follow us on <a href="http://twitter.com/NASAGoddardPix" rel="nofollow">Twitter</a></b> <b>Like us on <a href="http://www.facebook.com/pages/Greenbelt-MD/NASA-Goddard/395013845897?ref=tsd" rel="nofollow">Facebook</a></b> <b>Find us on <a href="http://instagram.com/nasagoddard?vm=grid" rel="nofollow">Instagram</a></b>
Calving front of the Upsala Glacier (Argentina). This glacier has been thinning and retreating at a rapid rate during the last decades – from 2006 to 2010, it receded 43.7 yards (40 meters) per year. During summer 2012, large calving events prevented boat access to the glacier. To learn about the contributions of glaciers to sea level rise, visit: <a href="http://www.nasa.gov/topics/earth/features/glacier-sea-rise.html" rel="nofollow">www.nasa.gov/topics/earth/features/glacier-sea-rise.html</a> Credit: Etienne Berthier, Université de Toulouse <b><a href="http://www.nasa.gov/audience/formedia/features/MP_Photo_Guidelines.html" rel="nofollow">NASA image use policy.</a></b> <b><a href="http://www.nasa.gov/centers/goddard/home/index.html" rel="nofollow">NASA Goddard Space Flight Center</a></b> enables NASA’s mission through four scientific endeavors: Earth Science, Heliophysics, Solar System Exploration, and Astrophysics. Goddard plays a leading role in NASA’s accomplishments by contributing compelling scientific knowledge to advance the Agency’s mission. <b>Follow us on <a href="http://twitter.com/NASA_GoddardPix" rel="nofollow">Twitter</a></b> <b>Like us on <a href="http://www.facebook.com/pages/Greenbelt-MD/NASA-Goddard/395013845897?ref=tsd" rel="nofollow">Facebook</a></b> <b>Find us on <a href="http://instagram.com/nasagoddard?vm=grid" rel="nofollow">Instagram</a></b>
An iceberg embedded in sea ice as seen from the IceBridge DC-8 over the Bellingshausen Sea on Oct. 19, 2012. Credit: NASA / James Yungel NASA's Operation IceBridge is an airborne science mission to study Earth's polar ice. For more information about IceBridge, visit: <a href="http://www.nasa.gov/icebridge" rel="nofollow">www.nasa.gov/icebridge</a> <b><a href="http://www.nasa.gov/audience/formedia/features/MP_Photo_Guidelines.html" rel="nofollow">NASA image use policy.</a></b> <b><a href="http://www.nasa.gov/centers/goddard/home/index.html" rel="nofollow">NASA Goddard Space Flight Center</a></b> enables NASA’s mission through four scientific endeavors: Earth Science, Heliophysics, Solar System Exploration, and Astrophysics. Goddard plays a leading role in NASA’s accomplishments by contributing compelling scientific knowledge to advance the Agency’s mission. <b>Follow us on <a href="http://twitter.com/NASA_GoddardPix" rel="nofollow">Twitter</a></b> <b>Like us on <a href="http://www.facebook.com/pages/Greenbelt-MD/NASA-Goddard/395013845897?ref=tsd" rel="nofollow">Facebook</a></b> <b>Find us on <a href="http://instagrid.me/nasagoddard/?vm=grid" rel="nofollow">Instagram</a></b>
Mosaic image of sea ice in the Beaufort Sea created by the Digital Mapping System (DMS) instrument aboard the IceBridge P-3B. The dark area in the middle of the image is open water seen through a lead, or opening, in the ice. Light blue areas are thick sea ice and dark blue areas are thinner ice formed as water in the lead refreezes. Leads are formed when cracks develop in sea ice as it moves in response to wind and ocean currents. DMS uses a modified digital SLR camera that points down through a window in the underside of the plane, capturing roughly one frame per second. These images are then combined into an image mosaic using specialized computer software. Credit: NASA/DMS <b><a href="http://www.nasa.gov/audience/formedia/features/MP_Photo_Guidelines.html" rel="nofollow">NASA image use policy.</a></b> <b><a href="http://www.nasa.gov/centers/goddard/home/index.html" rel="nofollow">NASA Goddard Space Flight Center</a></b> enables NASA’s mission through four scientific endeavors: Earth Science, Heliophysics, Solar System Exploration, and Astrophysics. Goddard plays a leading role in NASA’s accomplishments by contributing compelling scientific knowledge to advance the Agency’s mission. <b>Follow us on <a href="http://twitter.com/NASA_GoddardPix" rel="nofollow">Twitter</a></b> <b>Like us on <a href="http://www.facebook.com/pages/Greenbelt-MD/NASA-Goddard/395013845897?ref=tsd" rel="nofollow">Facebook</a></b> <b>Find us on <a href="http://instagram.com/nasagoddard?vm=grid" rel="nofollow">Instagram</a></b>
Xanadu: Rivers Flowed onto a Sunless Sea
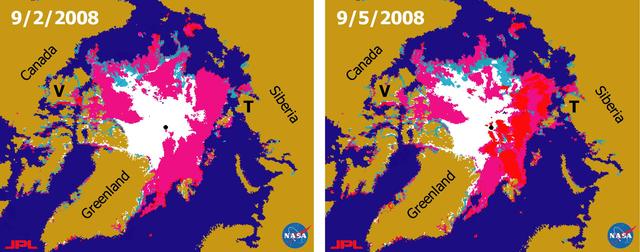
Declining Arctic Sea Ice: 1979-2010
SL4-141-4340 (20 Jan. 1974) --- An oblique view of the southern part of the Sea of Okhotsk, north of Japan, as photographed from the Skylab space station in Earth orbit by one of the Skylab 4 crewmen. The camera used was a hand-held 70mm Hasselblad, and SO-368 medium-speed Ektachrome. NORTH IS AT THE TOP WHEN THE PICTURE IS HELD WITH THE LARGEST LAND MASS AT THE BOTTOM. Most of the land area is Hokkaido Island, Japan. The southern tip of Sakhalin Island (Soviet Union) is in the northwest corner. This photograph was taken to aid in the study of the formation of sea ice. Comparison of these photographs will be made with observations made during a joint USSR-U.S. experiment in the Bering Sea a year earlier. Observations in the Sea of Okhotsk are of interest because the ice has a morphology similar to that of the Bering Sea. Photo credit: NASA
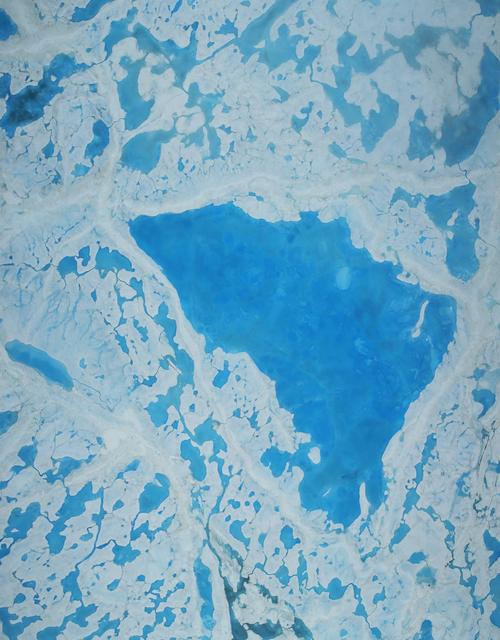
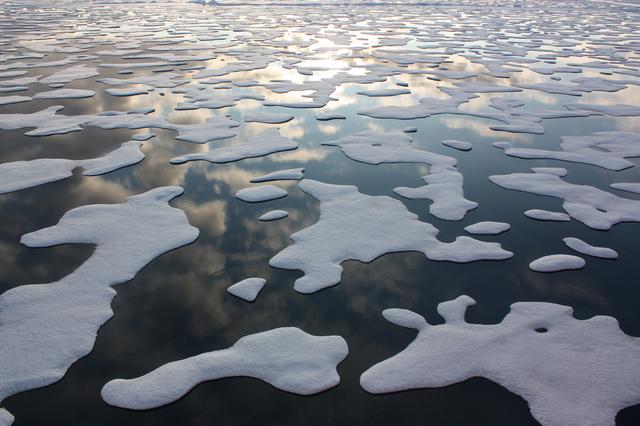
This summer, with sea ice across the Arctic Ocean shrinking to below-average levels, a NASA airborne survey of polar ice just completed its first flights. Its target: aquamarine pools of melt water on the ice surface that may be accelerating the overall sea ice retreat. NASA’s Operation IceBridge completed the first research flight of its new 2016 Arctic summer campaign on July 13. The science flights, which continue through July 25, are collecting data on sea ice in a year following a record-warm winter in the Arctic. Read more: <a href="http://go.nasa.gov/29T6mxc" rel="nofollow">go.nasa.gov/29T6mxc</a> Caption: A large pool of melt water over sea ice, as seen from an Operation IceBridge flight over the Beaufort Sea on July 14, 2016. During this summer campaign, IceBridge will map the extent, frequency and depth of melt ponds like these to help scientists forecast the Arctic sea ice yearly minimum extent in September. Credit: NASA/Operation IceBridge

On July 12, 2011, crew from the U.S. Coast Guard Cutter Healy retrieved a canister dropped by parachute from a C-130, which brought supplies for some mid-mission fixes. The ICESCAPE mission, or "Impacts of Climate on Ecosystems and Chemistry of the Arctic Pacific Environment," is NASA's two-year shipborne investigation to study how changing conditions in the Arctic affect the ocean's chemistry and ecosystems. The bulk of the research takes place in the Beaufort and Chukchi seas in summer 2010 and 2011. Credit: NASA/Kathryn Hansen For updates on the five-week ICESCAPE voyage, visit the mission blog at: go.usa.gov/WwU <b><a href="http://www.nasa.gov/audience/formedia/features/MP_Photo_Guidelines.html" rel="nofollow">NASA image use policy.</a></b> <b><a href="http://www.nasa.gov/centers/goddard/home/index.html" rel="nofollow">NASA Goddard Space Flight Center</a></b> enables NASA’s mission through four scientific endeavors: Earth Science, Heliophysics, Solar System Exploration, and Astrophysics. Goddard plays a leading role in NASA’s accomplishments by contributing compelling scientific knowledge to advance the Agency’s mission. <b>Follow us on <a href="http://twitter.com/NASA_GoddardPix" rel="nofollow">Twitter</a></b> <b>Like us on <a href="http://www.facebook.com/pages/Greenbelt-MD/NASA-Goddard/395013845897?ref=tsd" rel="nofollow">Facebook</a></b> <b>Find us on <a href="http://instagrid.me/nasagoddard/?vm=grid" rel="nofollow">Instagram</a></b>
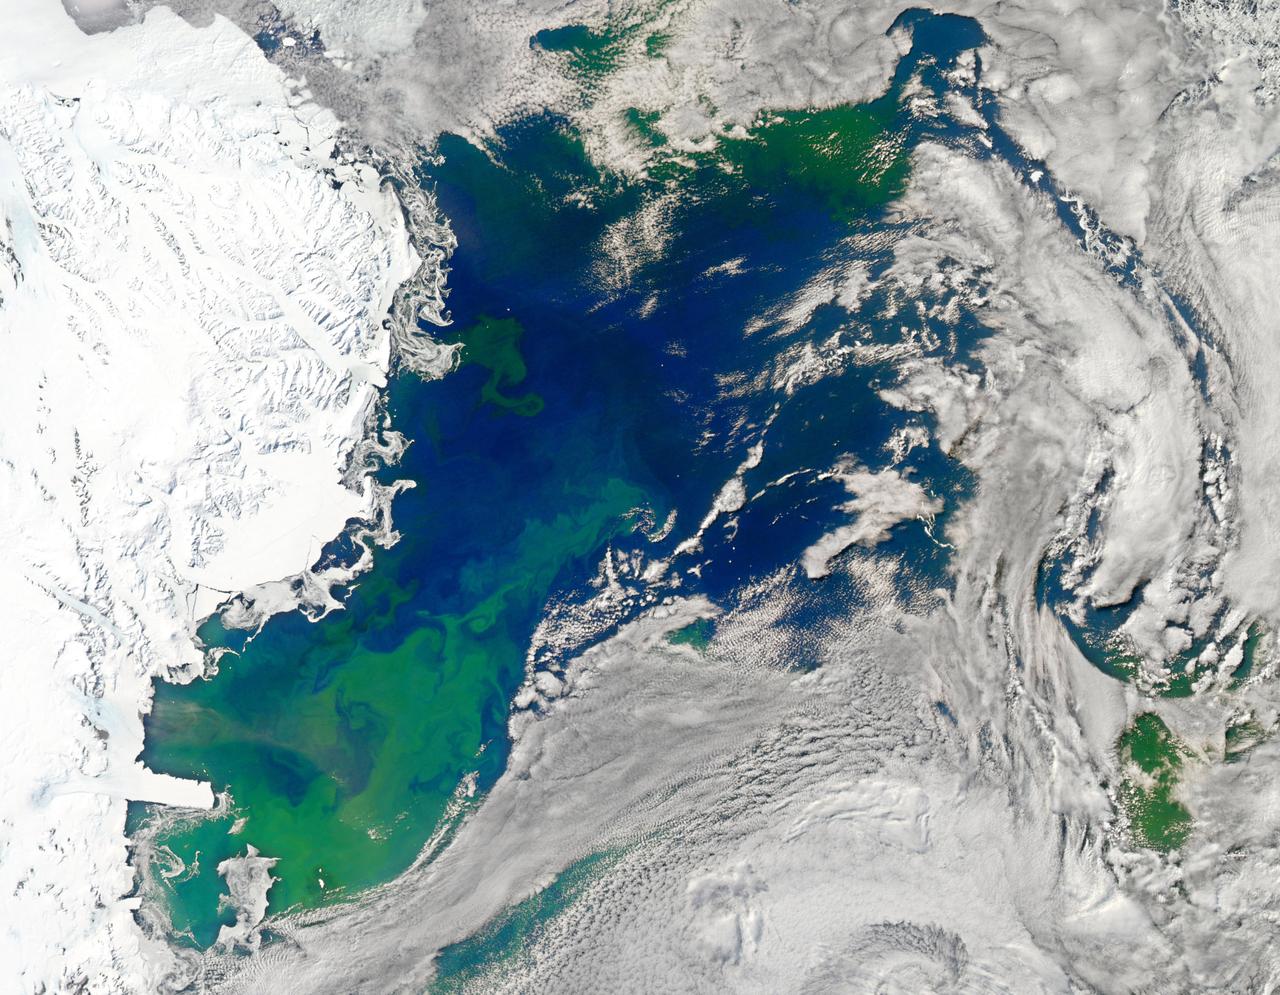
NASA image acquired January 22, 2011 To view the full image go to: <a href="http://www.flickr.com/photos/gsfc/5397636843">www.flickr.com/photos/gsfc/5397636843</a> Every southern spring and summer, after the Sun has risen into its 24-hour circuit around the skies of Antarctica, the Ross Sea bursts with life. Floating, microscopic plants, known as phytoplankton, soak up the sunlight and the nutrients stirring in the Southern Ocean and grow into prodigious blooms. Those blooms become a great banquet for krill, fish, penguins, whales, and other marine species who carve out a living in the cool waters of the far south. This true-color image captures such a bloom in the Ross Sea on January 22, 2011, as viewed by the Moderate Resolution Imaging Spectroradiometer (MODIS) on NASA’s Aqua satellite. Bright greens of plant-life have replaced the deep blues of open ocean water. The Ross Sea is a relatively shallow bay in the Antarctic coastline and due south from New Zealand. As the spring weather thaws the sea ice around Antarctica, areas of open water surrounded by ice—polynyas—open up on the continental shelf. In this open water, sunlight provides the fuel and various current systems provide nutrients from deeper waters to form blooms that can stretch 100 to 200 kilometers (60 to 120 miles). These blooms are among the largest in extent and abundance in the world. Scientists have hypothesized that the Modified Circumpolar Deep Water is the engine behind the blooms, stirring up just the right mix of trace metals and minerals from the deep to sustain plankton growth. This month, researchers aboard the U.S. icebreaking ship Nathaniel B. Palmer are cruising in the Ross Sea in search of the signatures of this current system. NASA image courtesy Norman Kuring, Ocean Color Team at NASA Goddard Space Flight Center. Caption by Mike Carlowicz, with information from Hugh Powell, COSEE-NOW. Instrument: Aqua - MODIS For more info go to: <a href="http://earthobservatory.nasa.gov/IOTD/view.php?id=48949" rel="nofollow">earthobservatory.nasa.gov/IOTD/view.php?id=48949</a> Credit: <b><a href="http://www.earthobservatory.nasa.gov/" rel="nofollow"> NASA Earth Observatory</a></b> <b><a href="http://www.nasa.gov/centers/goddard/home/index.html" rel="nofollow">NASA Goddard Space Flight Center</a></b> enables NASA’s mission through four scientific endeavors: Earth Science, Heliophysics, Solar System Exploration, and Astrophysics. Goddard plays a leading role in NASA’s accomplishments by contributing compelling scientific knowledge to advance the Agency’s mission. <b>Follow us on <a href="http://twitter.com/NASA_GoddardPix" rel="nofollow">Twitter</a></b> <b>Join us on <a href="http://www.facebook.com/pages/Greenbelt-MD/NASA-Goddard/395013845897?ref=tsd" rel="nofollow">Facebook</a></b>
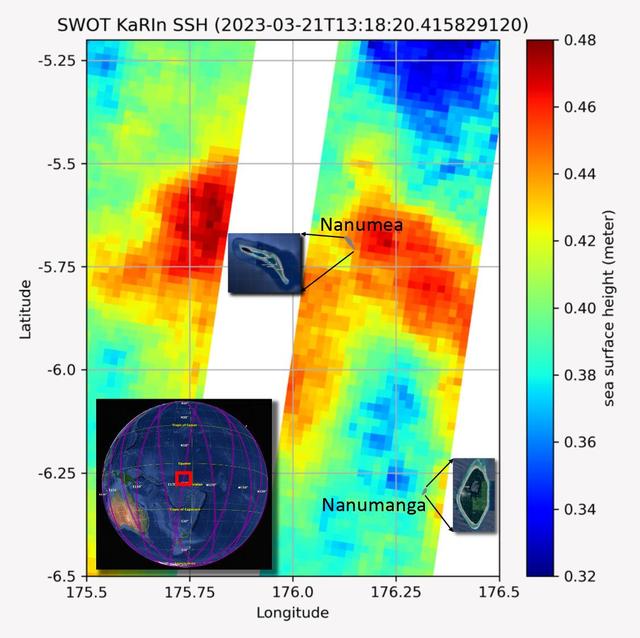
The recently launched Surface Water and Ocean Topography (SWOT) mission collected data on sea levels around two of the inhabited islands of Tuvalu, a nation in the South Pacific Ocean that has been threatened with sea level rise that substantially exceeds the global average. The image shows two areas of red that indicate higher than normal sea levels around two of Tuvalu's inhabited islands, Nanumanga and Nanumea. The higher sea levels were likely caused by internal tides or circular currents called eddies. The SWOT data illuminates for the first time these small ocean features that, when they occur on top of rising sea levels, can lead to episodic flooding along coastlines. The Tuvalu data was collected March 21, 2023. Rising seas are a direct consequence of climate change. On a global scale, the combination of warming ocean waters and ice melt from glaciers and ice sheets is leading to sea level rise that is occurring at an ever-increasing rate. The current rate of rise is more than 0.15 inches (4 millimeters) per year, an increase from 0.08 inches (2 millimeters) per year in 1993. This seemingly small increase holds great significance for coastal communities that have seen more than a century of persistent sea level rise. The gap between the average high tide and flooding conditions has narrowed, and coastal impacts driven by sea level rise have increased in frequency and severity in recent years. This is particularly true for low-lying island nations like Tuvalu, located about 620 miles (1,000 kilometers) north of Fiji. Sea level rise does not occur at the same rate everywhere across the globe, and can be exacerbated by natural ocean fluctuations that occur over time periods from years to decades. For Tuvalu, the amount of sea level rise has been substantially higher than the global average over the past three decades. The amount of rise, when coupled with Tuvalu's low land elevations, places the country increasingly under threat. In the near term, sea level rise will combine with naturally occurring ocean variability and storms to exacerbate events like coastal flooding. Monitoring and understanding sea level change is critical for Tuvalu and other low-lying island nations. Launched on Dec. 16, 2022, from Vandenberg Space Force Base in central California, SWOT collected the Tuvalu sea level data during a period of commissioning, calibration, and validation. Engineers are checking out the performance of the satellite's systems and science instruments before the planned start of science operations in summer 2023. https://photojournal.jpl.nasa.gov/catalog/PIA25777
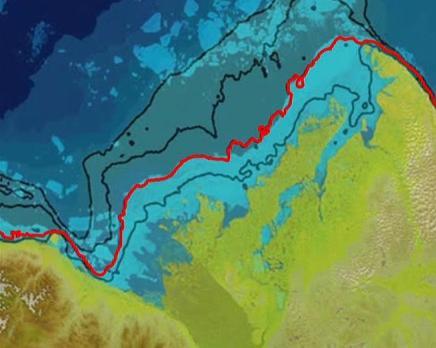
This frame from a NASA MODIS animation depicts warming sea surface temperatures in the Arctic Beaufort Sea after warm waters from Canada Mackenzie River broke through a shoreline sea ice barrier in summer 2012, enhancing the melting of sea ice.

An iceberg trapped in sea ice in the Amundsen Sea, seen from the IceBridge DC-8 during the Getz 07 mission on Oct. 27. Credit: NASA / Maria-Jose Vinas NASA's Operation IceBridge is an airborne science mission to study Earth's polar ice. For more information about IceBridge, visit: <a href="http://www.nasa.gov/icebridge" rel="nofollow">www.nasa.gov/icebridge</a> <b><a href="http://www.nasa.gov/audience/formedia/features/MP_Photo_Guidelines.html" rel="nofollow">NASA image use policy.</a></b> <b><a href="http://www.nasa.gov/centers/goddard/home/index.html" rel="nofollow">NASA Goddard Space Flight Center</a></b> enables NASA’s mission through four scientific endeavors: Earth Science, Heliophysics, Solar System Exploration, and Astrophysics. Goddard plays a leading role in NASA’s accomplishments by contributing compelling scientific knowledge to advance the Agency’s mission. <b>Follow us on <a href="http://twitter.com/NASA_GoddardPix" rel="nofollow">Twitter</a></b> <b>Like us on <a href="http://www.facebook.com/pages/Greenbelt-MD/NASA-Goddard/395013845897?ref=tsd" rel="nofollow">Facebook</a></b> <b>Find us on <a href="http://instagrid.me/nasagoddard/?vm=grid" rel="nofollow">Instagram</a></b>

Low-lying clouds over sea ice on the Bellingshausen Sea. Credit: NASA / Maria-Jose Vinas NASA's Operation IceBridge is an airborne science mission to study Earth's polar ice. For more information about IceBridge, visit: <a href="http://www.nasa.gov/icebridge" rel="nofollow">www.nasa.gov/icebridge</a> <b><a href="http://www.nasa.gov/audience/formedia/features/MP_Photo_Guidelines.html" rel="nofollow">NASA image use policy.</a></b> <b><a href="http://www.nasa.gov/centers/goddard/home/index.html" rel="nofollow">NASA Goddard Space Flight Center</a></b> enables NASA’s mission through four scientific endeavors: Earth Science, Heliophysics, Solar System Exploration, and Astrophysics. Goddard plays a leading role in NASA’s accomplishments by contributing compelling scientific knowledge to advance the Agency’s mission. <b>Follow us on <a href="http://twitter.com/NASA_GoddardPix" rel="nofollow">Twitter</a></b> <b>Like us on <a href="http://www.facebook.com/pages/Greenbelt-MD/NASA-Goddard/395013845897?ref=tsd" rel="nofollow">Facebook</a></b> <b>Find us on <a href="http://instagrid.me/nasagoddard/?vm=grid" rel="nofollow">Instagram</a></b>

Over the past 30 years, global average sea level has risen a total of 3.6 inches (9.1 centimeters), as indicated in this graphic, which is based on sea level measurements (in blue) from five successive satellites starting with the U.S.-French TOPEX/Poseidon mission in 1993. The solid red line shows the trajectory of sea level rise from 1993 to 2022, while the dotted red line shows the increase sea level into the future. Researchers can take the solid red line and calculate the rate of sea level rise, which was 0.08 inches (0.20 centimeters) per year in 1993 and doubled to 0.17 inches (0.44 centimeters) per year by 2022. The dotted red line shows that by 2040, sea levels may rise by an additional 3.66 inches (9.3 cm) above 2022 levels. The trajectory shown in the solid and dotted red line is based on work by the NASA Sea Level Change Team and the Ocean Surface Topography Science Team. https://photojournal.jpl.nasa.gov/catalog/PIA25775
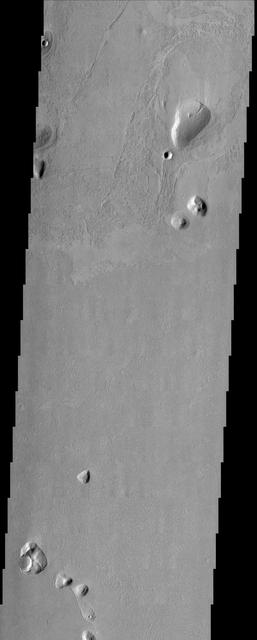
Islands of older high-standing terrain rise above a sea of relatively young, platy lava flows between two of the largest volcanoes in the solar system in this image from NASA Mars Odyssey spacecraft.
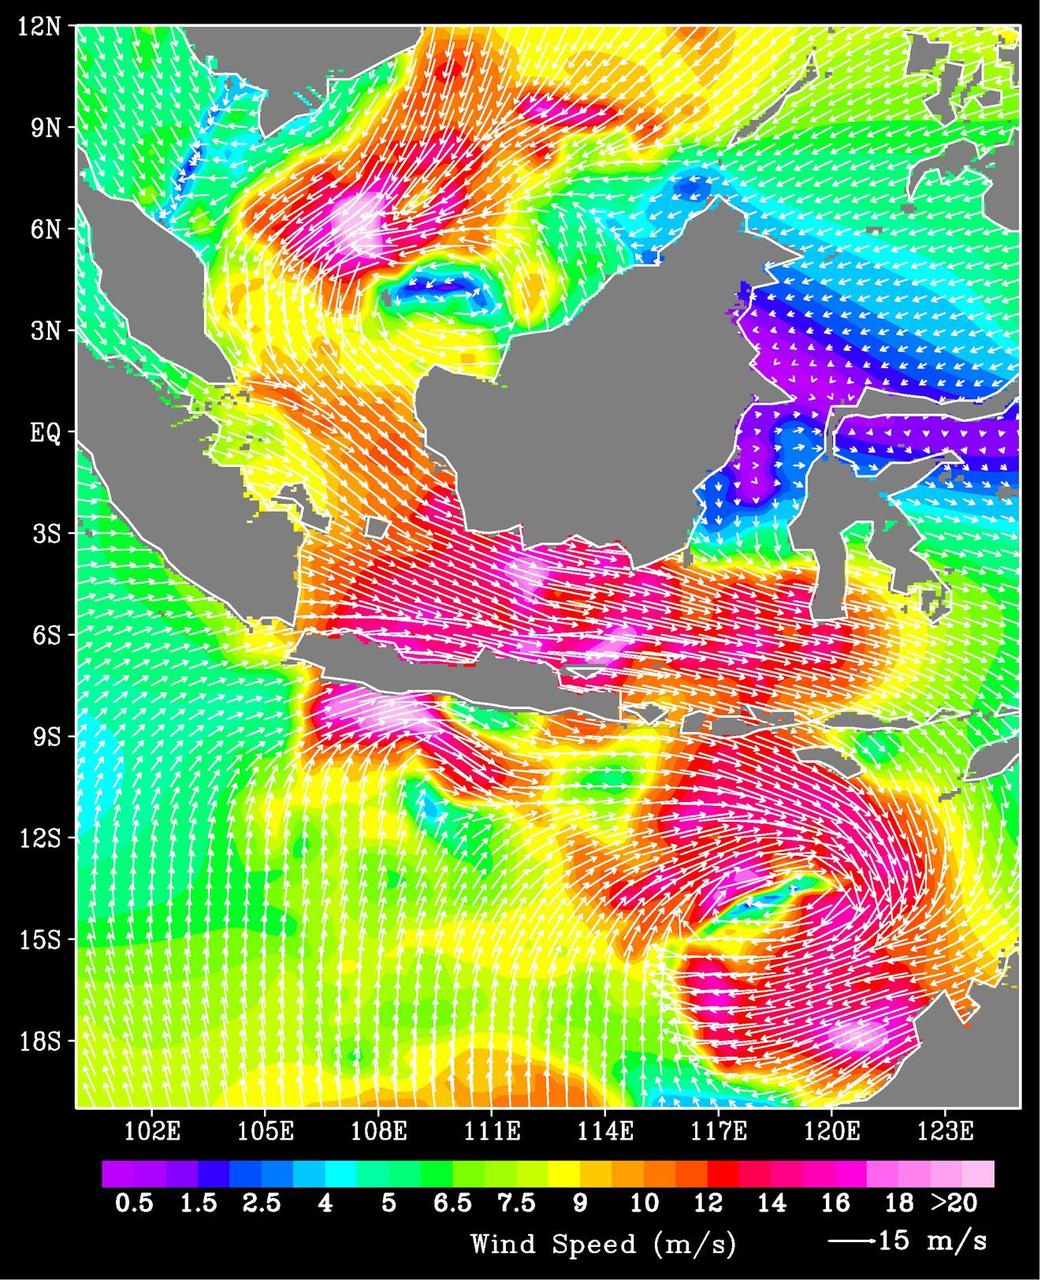
A ferry carrying more than 600 passengers sank in the Java Sea between the island of Java and Borneo just before midnight on December 29, 2006, during high winds and rough seas.
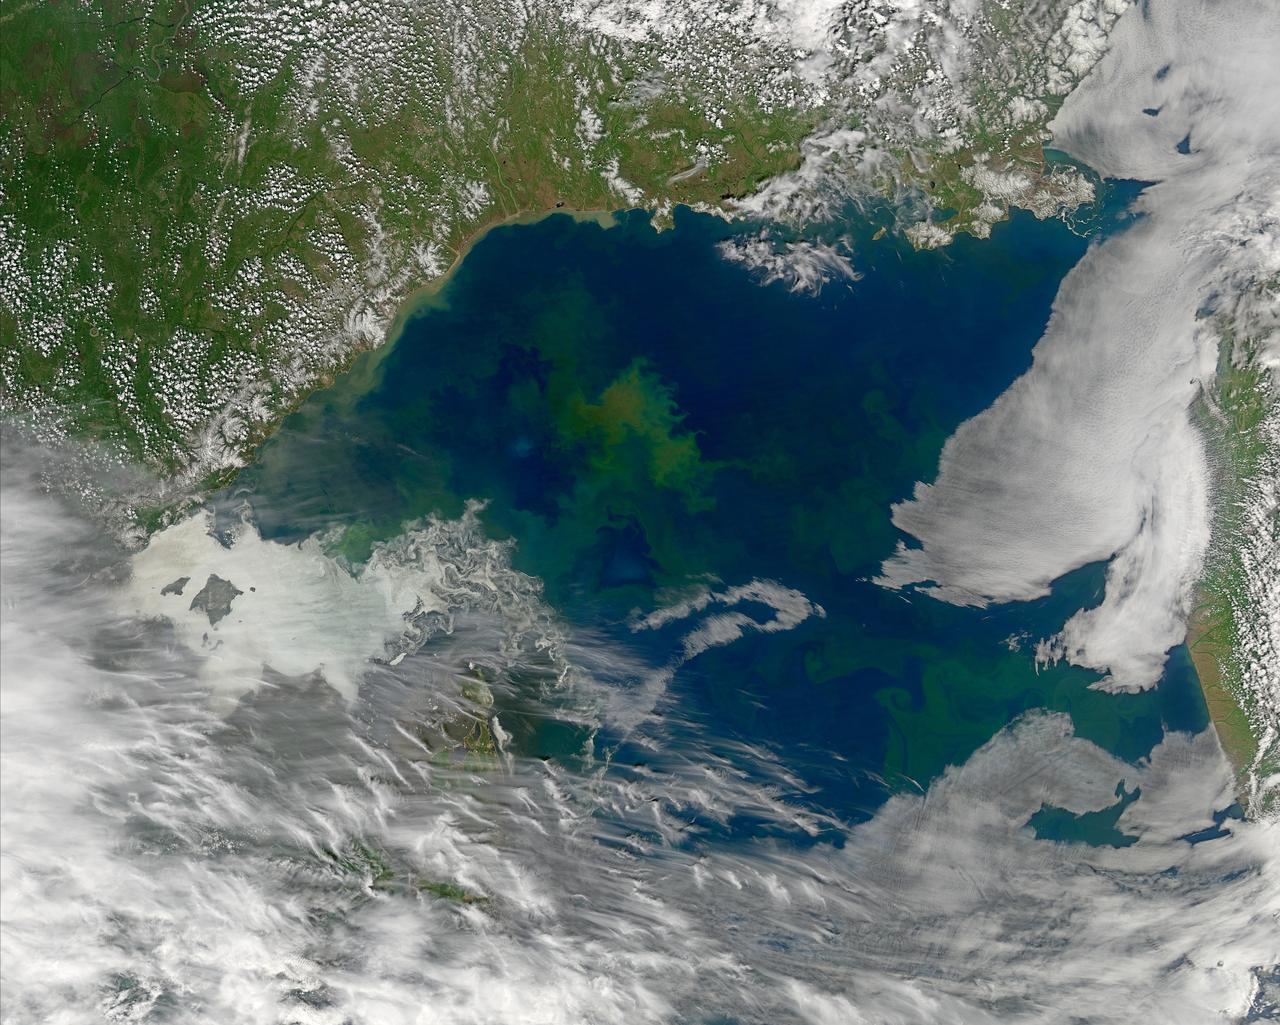
Differently colored waters in the Sea of Okhotsk on June 12, 2013 suggest differences in phytoplankton community structure from one location to the next. The ocean color community would eventually like to use remotely sensed data, such as are shown in the above Aqua-MODIS image, to better understand global phytoplankton diversity. Credit: NASA/MODIS/Aqua <b><a href="http://www.nasa.gov/audience/formedia/features/MP_Photo_Guidelines.html" rel="nofollow">NASA image use policy.</a></b> <b><a href="http://www.nasa.gov/centers/goddard/home/index.html" rel="nofollow">NASA Goddard Space Flight Center</a></b> enables NASA’s mission through four scientific endeavors: Earth Science, Heliophysics, Solar System Exploration, and Astrophysics. Goddard plays a leading role in NASA’s accomplishments by contributing compelling scientific knowledge to advance the Agency’s mission. <b>Follow us on <a href="http://twitter.com/NASA_GoddardPix" rel="nofollow">Twitter</a></b> <b>Like us on <a href="http://www.facebook.com/pages/Greenbelt-MD/NASA-Goddard/395013845897?ref=tsd" rel="nofollow">Facebook</a></b> <b>Find us on <a href="http://instagram.com/nasagoddard?vm=grid" rel="nofollow">Instagram</a></b>
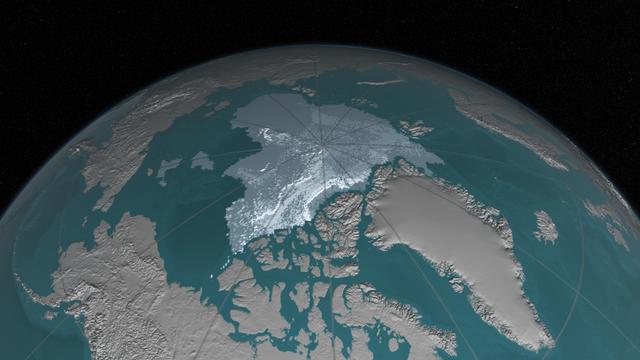
Arctic sea ice, the vast sheath of frozen seawater floating on the Arctic Ocean and its neighboring seas, has been hit with a double whammy over the past decades: as its extent shrunk, the oldest and thickest ice has either thinned or melted away, leaving the sea ice cap more vulnerable to the warming ocean and atmosphere. “What we’ve seen over the years is that the older ice is disappearing,” said Walt Meier, a sea ice researcher at NASA’s Goddard Space Flight Center in Greenbelt, Maryland. “This older, thicker ice is like the bulwark of sea ice: a warm summer will melt all the young, thin ice away but it can’t completely get rid of the older ice. But this older ice is becoming weaker because there’s less of it and the remaining old ice is more broken up and thinner, so that bulwark is not as good as it used to be.” Read more: <a href="http://go.nasa.gov/2dPJ9zT" rel="nofollow">go.nasa.gov/2dPJ9zT</a> <b><a href="http://www.nasa.gov/audience/formedia/features/MP_Photo_Guidelines.html" rel="nofollow">NASA image use policy.</a></b> <b><a href="http://www.nasa.gov/centers/goddard/home/index.html" rel="nofollow">NASA Goddard Space Flight Center</a></b> enables NASA’s mission through four scientific endeavors: Earth Science, Heliophysics, Solar System Exploration, and Astrophysics. Goddard plays a leading role in NASA’s accomplishments by contributing compelling scientific knowledge to advance the Agency’s mission. <b>Follow us on <a href="http://twitter.com/NASAGoddardPix" rel="nofollow">Twitter</a></b> <b>Like us on <a href="http://www.facebook.com/pages/Greenbelt-MD/NASA-Goddard/395013845897?ref=tsd" rel="nofollow">Facebook</a></b> <b>Find us on <a href="http://instagrid.me/nasagoddard/?vm=grid" rel="nofollow">Instagram</a></b>

This poster highlights NASA JPL missions that provide important inputs to research in sea level rise and variability -- key measures of ocean circulation and global climate change.
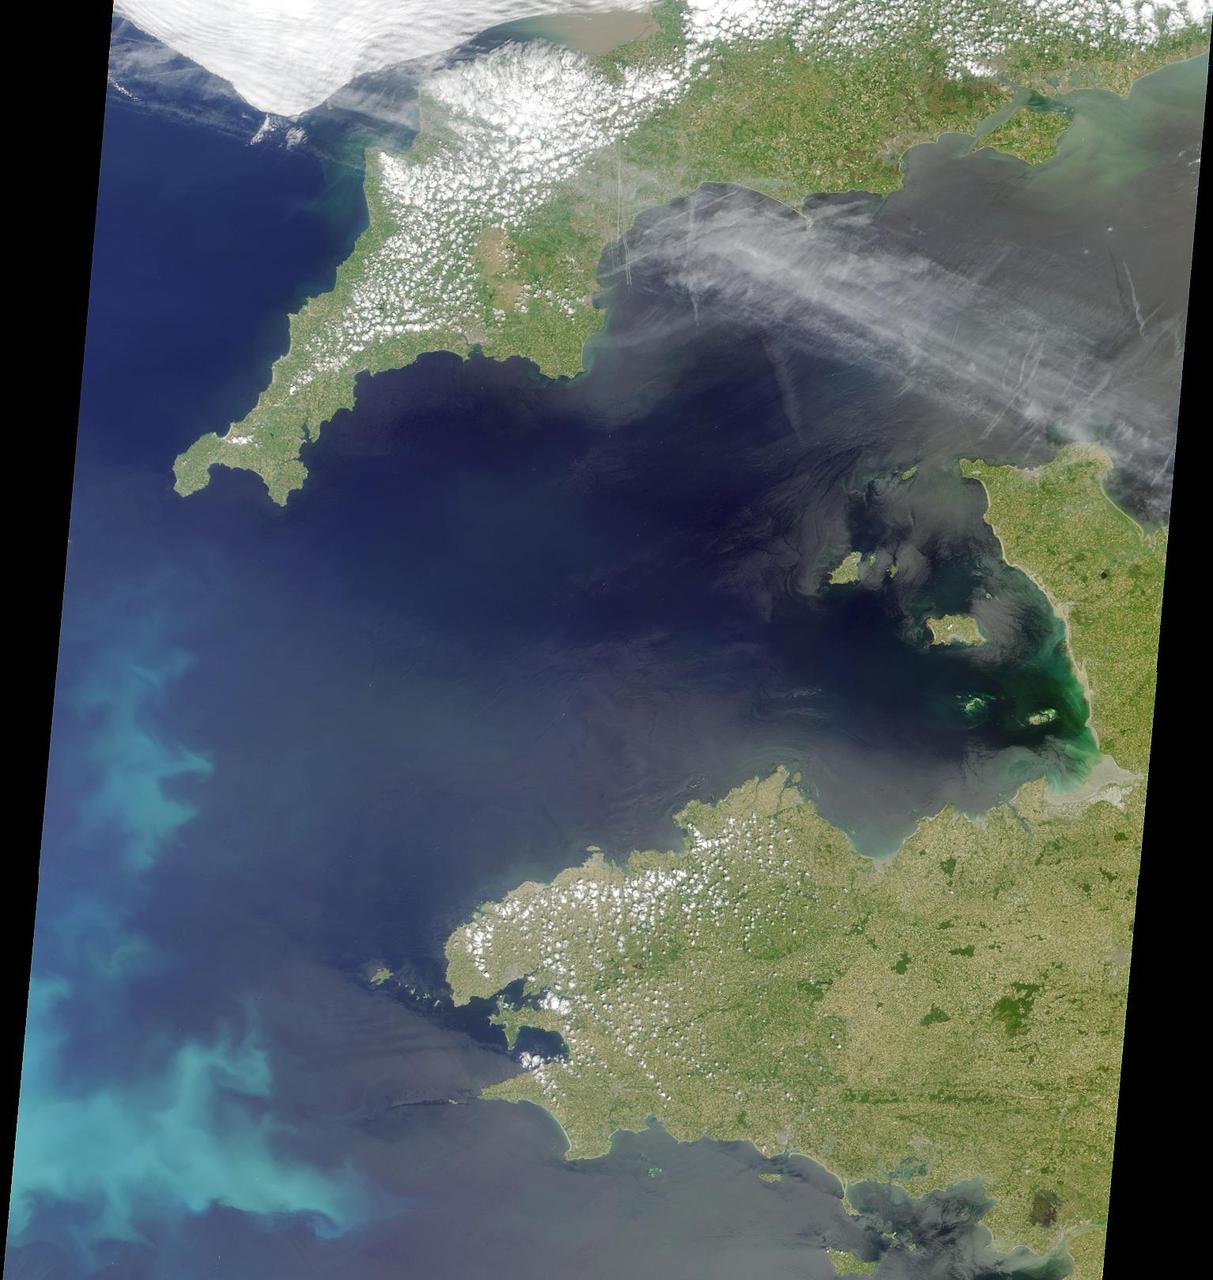
This image is a natural-color view of the Celtic Sea and English Channel regions, and was acquired by NASA Terra satellite on June 4, 2001 during Terra orbit 7778.
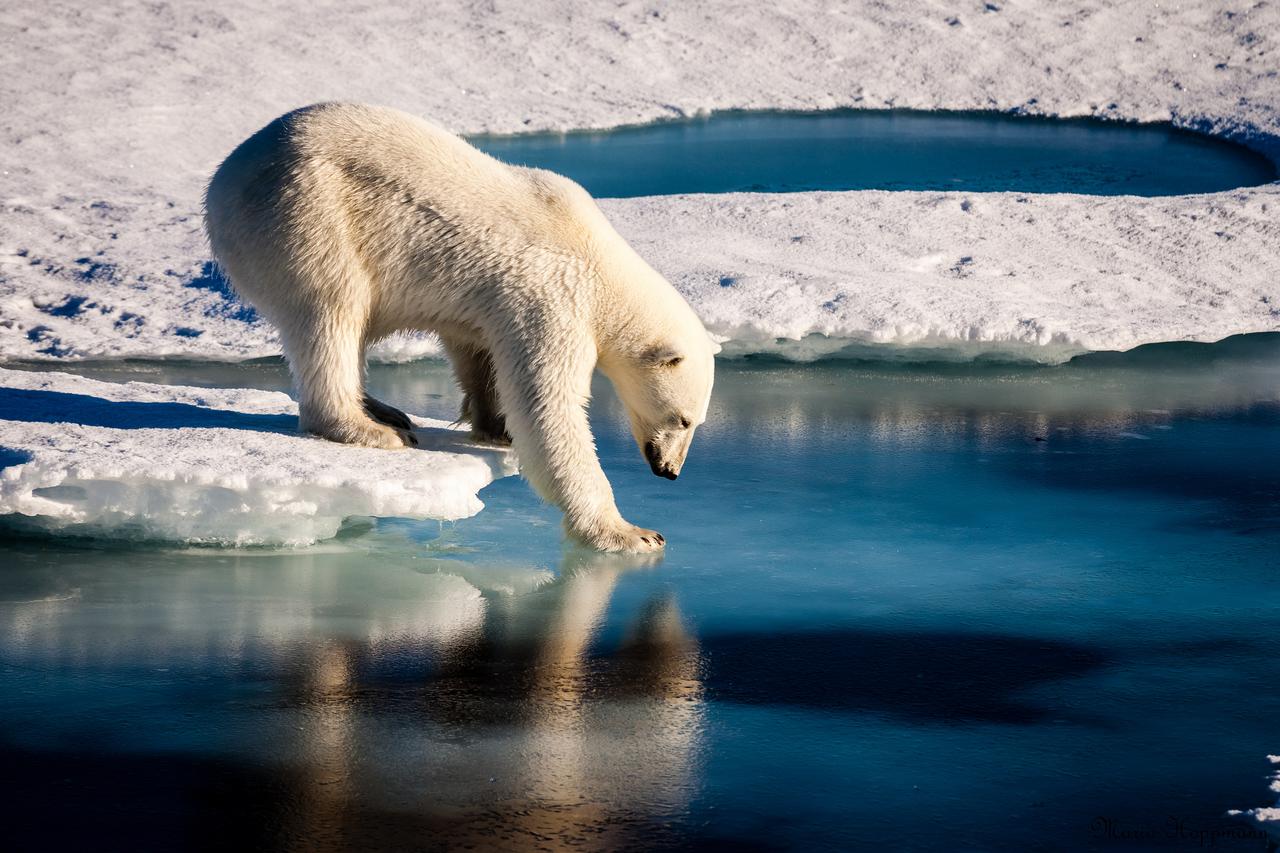
Polar bears already face shorter ice seasons - limiting prime hunting and breeding opportunities. Nineteen separate polar bear subpopulations live throughout the Arctic, spending their winters and springs roaming on sea ice and hunting. The bears have evolved mainly to eat seals, which provide necessary fats and nutrients in the harsh Arctic environment. Polar bears can't outswim their prey, so instead they perch on the ice as a platform and ambush seals at breathing holes or break through the ice to access their dens. The total number of ice-covered days declined at the rate of seven to 19 days per decade between 1979 and 2014. The decline was even greater in the Barents Sea and the Arctic basin. Sea ice concentration during the summer months — an important measure because summertime is when some subpopulations are forced to fast on land — also declined in all regions, by 1 percent to 9 percent per decade. Read more: <a href="http://go.nasa.gov/2cIZSSc" rel="nofollow">go.nasa.gov/2cIZSSc</a> Photo credit: Mario Hoppmann
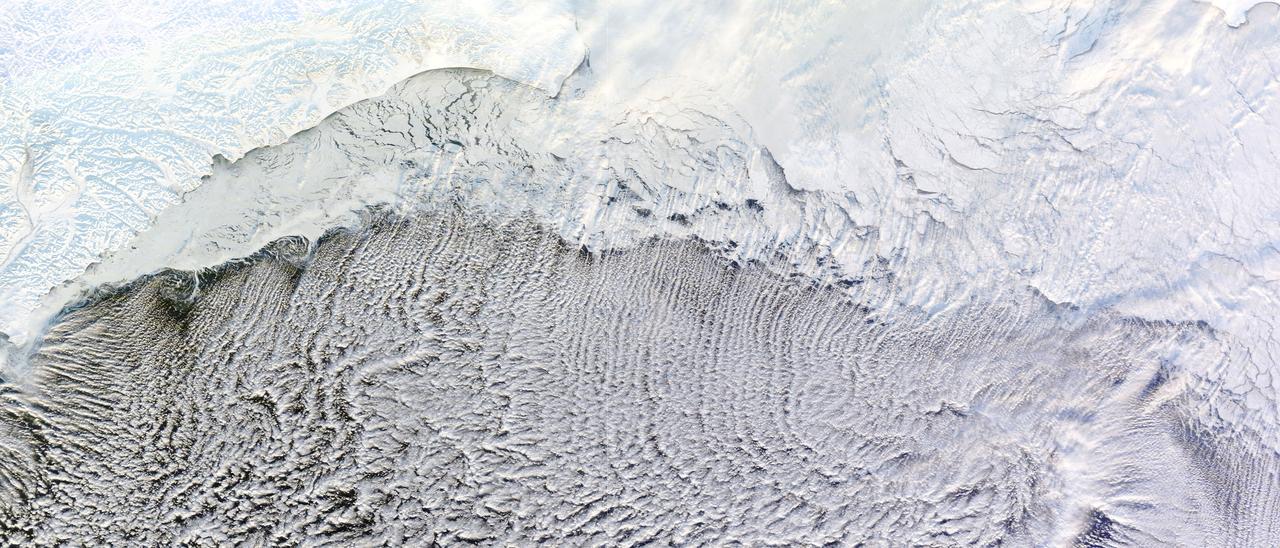
NASA image captured January 4, 2012 Most of us prefer our winter roads free of ice, but one kind of road depends on it: a cloud street. Such streets formed over the Bering Sea in early January 2012, thanks to snow and ice blanketing the nearby land, and sea ice clinging to the shore. The Moderate Resolution Imaging Spectroradiometer (MODIS) on NASA’s Terra satellite captured this natural-color image of the cloud streets on January 4, 2012. Air blowing over frigid ice then warmer ocean water can lead to the development of parallel cylinders of spinning air. Above the upward cycle of these cylinders (rising air), small clouds form. Along the downward cycle (descending air), skies are clear. The resulting cloud formations resemble streets. This image shows that some of the cloud streets begin over the sea ice, but most of the clouds hover over the open ocean water. These streets are not perfectly straight, but curve to the east and west after passing over the sea ice. By lining up along the prevailing wind direction, the tiny clouds comprising the streets indicate the wind patterns around the time of their formation. NASA images courtesy LANCE/EOSDIS MODIS Rapid Response Team at NASA GSFC. Caption by Michon Scott. Instrument: Terra - MODIS Credit: <b><a href="http://www.earthobservatory.nasa.gov/" rel="nofollow"> NASA Earth Observatory</a></b> <b><a href="http://www.nasa.gov/audience/formedia/features/MP_Photo_Guidelines.html" rel="nofollow">NASA image use policy.</a></b> <b><a href="http://www.nasa.gov/centers/goddard/home/index.html" rel="nofollow">NASA Goddard Space Flight Center</a></b> enables NASA’s mission through four scientific endeavors: Earth Science, Heliophysics, Solar System Exploration, and Astrophysics. Goddard plays a leading role in NASA’s accomplishments by contributing compelling scientific knowledge to advance the Agency’s mission. <b>Follow us on <a href="http://twitter.com/NASA_GoddardPix" rel="nofollow">Twitter</a></b> <b>Like us on <a href="http://www.facebook.com/pages/Greenbelt-MD/NASA-Goddard/395013845897?ref=tsd" rel="nofollow">Facebook</a></b> <b>Find us on <a href="http://instagrid.me/nasagoddard/?vm=grid" rel="nofollow">Instagram</a></b>
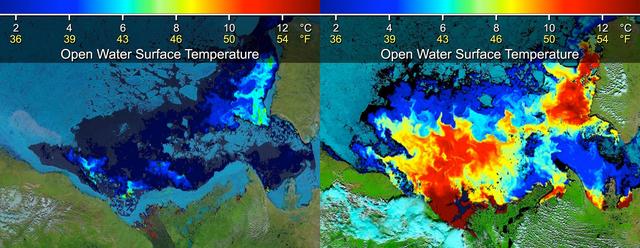
Beaufort Sea surface temperatures where Canada Mackenzie River discharges into the Arctic Ocean, measured by NASA MODIS instrument; warm river waters had broken through a shoreline sea ice barrier to enhance sea ice melt.

This graph shows the rise in global mean sea level from 1993 to 2023 based on data from a series of five international satellites. The solid red line indicates the trajectory of this increase, which has more than doubled over the three decades. The dotted red line projects future sea level rise. The relatively large jump in sea level from 2022 to 2023, a rise of about 0.3 inches (0.76 centimeters), is due mostly to a warming climate and the development of a strong El Niño. The 2022-2023 rise is equivalent to draining a quarter of Lake Superior into the ocean over the course of a year. This NASA-led analysis is based on a sea level data set featuring more than 30 years of satellite observations, starting with the U.S.-French TOPEX/Poseidon mission, which launched in 1992. The Sentinel-6 Michael Freilich mission, which launched in November 2020, is the latest in the series of satellites that have contributed to this sea level record. https://photojournal.jpl.nasa.gov/catalog/PIA26183
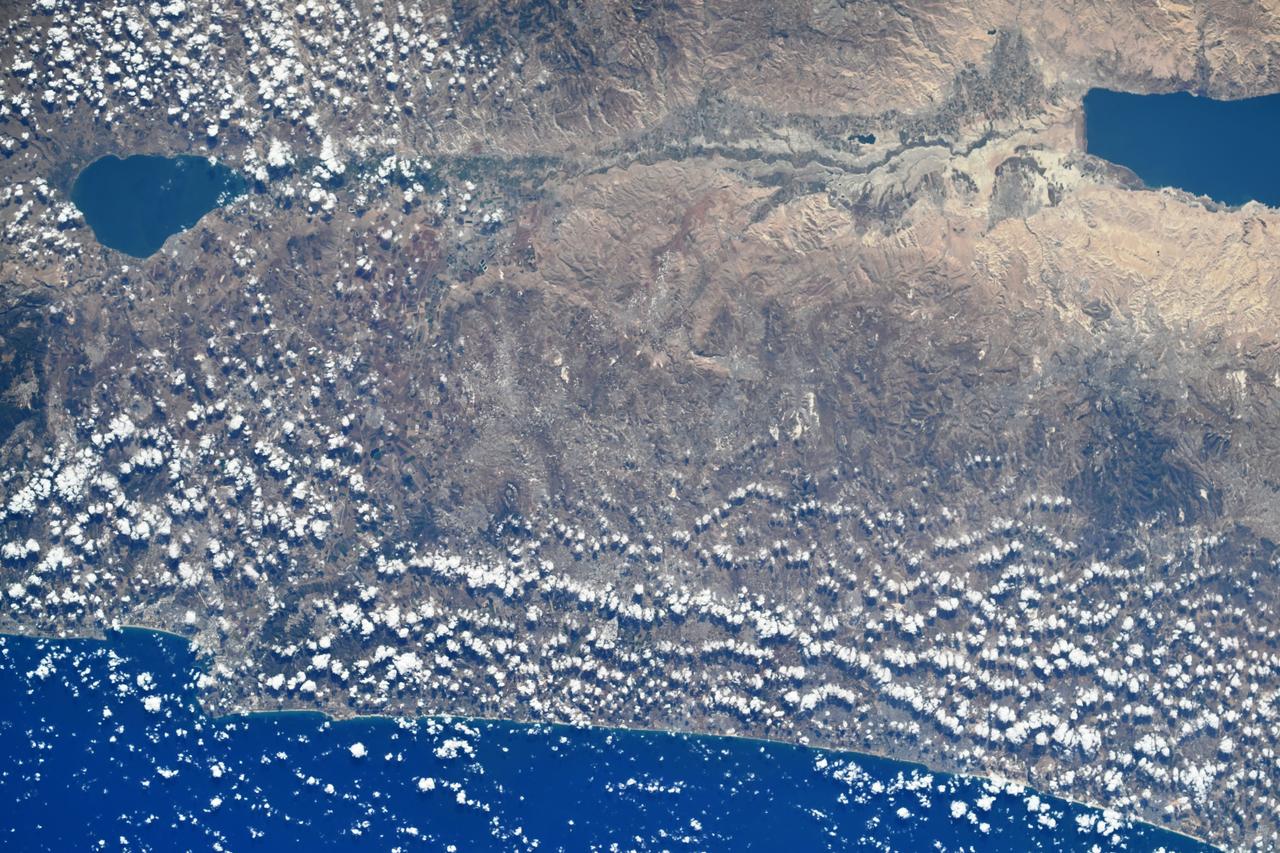
iss073e0425936 (Aug. 7, 2025) --- From left to right, the Sea of Galilee—the world’s lowest freshwater lake—and the Dead Sea—the lowest saltwater lake—are connected by the Jordan River in Israel. At the bottom of the image, the Mediterranean coastline is visible from the International Space Station as it orbited 260 miles above Earth. Credit: Roscosmos
Former NASA astronaut Mike Massimino participates in a panel discussion titled "The Big Picture", Saturday, Aug. 5, 2017 at the Intrepid Sea, Air & Space Museum in New York City. Photo Credit: (NASA/Bill Ingalls)
The space shuttle Enterprise is seen shortly after the grand opening of the Space Shuttle Pavilion at the Intrepid Sea, Air & Space Museum on Thursday, July 19, 2012 in New York. Photo Credit: (NASA/Bill Ingalls)

Former NASA astronaut Mike Massimino participates in a panel discussion titled "The Big Picture", Saturday, Aug. 5, 2017 at the Intrepid Sea, Air & Space Museum in New York City. Photo Credit: (NASA/Bill Ingalls)
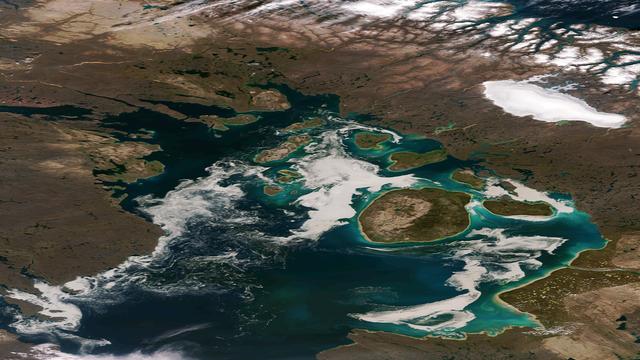
The remnants of sea ice along the Northwestern Passage in northern Canada are seen swirling with the blue green of phytoplankton in this image from the Suomi NPP VIIRS sensor, acquired on August 11, 2013. NASA/NOAA <b><a href="http://www.nasa.gov/audience/formedia/features/MP_Photo_Guidelines.html" rel="nofollow">NASA image use policy.</a></b> <b><a href="http://www.nasa.gov/centers/goddard/home/index.html" rel="nofollow">NASA Goddard Space Flight Center</a></b> enables NASA’s mission through four scientific endeavors: Earth Science, Heliophysics, Solar System Exploration, and Astrophysics. Goddard plays a leading role in NASA’s accomplishments by contributing compelling scientific knowledge to advance the Agency’s mission. <b>Follow us on <a href="http://twitter.com/NASA_GoddardPix" rel="nofollow">Twitter</a></b> <b>Like us on <a href="http://www.facebook.com/pages/Greenbelt-MD/NASA-Goddard/395013845897?ref=tsd" rel="nofollow">Facebook</a></b> <b>Find us on <a href="http://instagram.com/nasagoddard?vm=grid" rel="nofollow">Instagram</a></b>
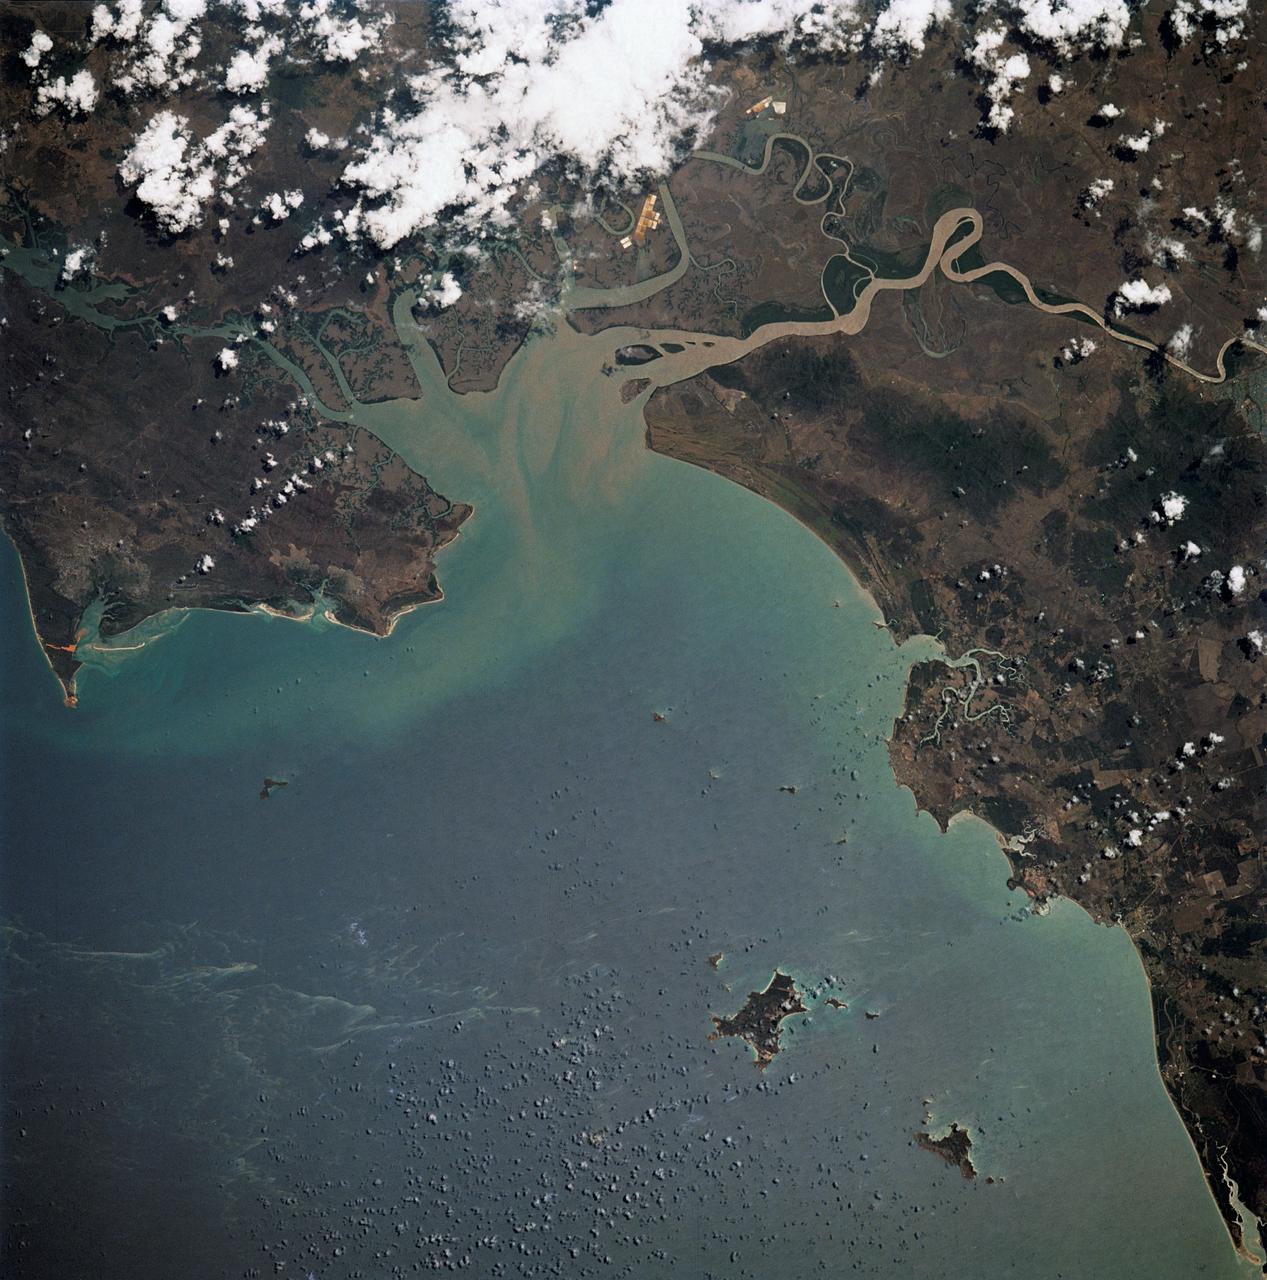
STS032-520-014 (9-20 Jan. 1990) --- STS-32 astronauts took this 70mm scene showing phytoplankton oralgal bloom in the northwest Coral Sea. The Western Coral Sea and the Great Barrier Reef waters offshore Queensland, Australia are the sites of some of the larger concentrations or "blooms" of phytoplankton and algae in the open ocean. In the instance illustrated here, the leading edge of a probable concentration of algae or phytoplankton is seen as a light irregular line and sheen between the offshore Great Barrier Reef and the Queensland coast. Previous phytoplankton concentrations in this area have been reported by ships at sea as having formed floating mats as thick as two meters. This picture was used by the STS-32 astronauts at their Jan. 30, 1990 post-flight press conference.
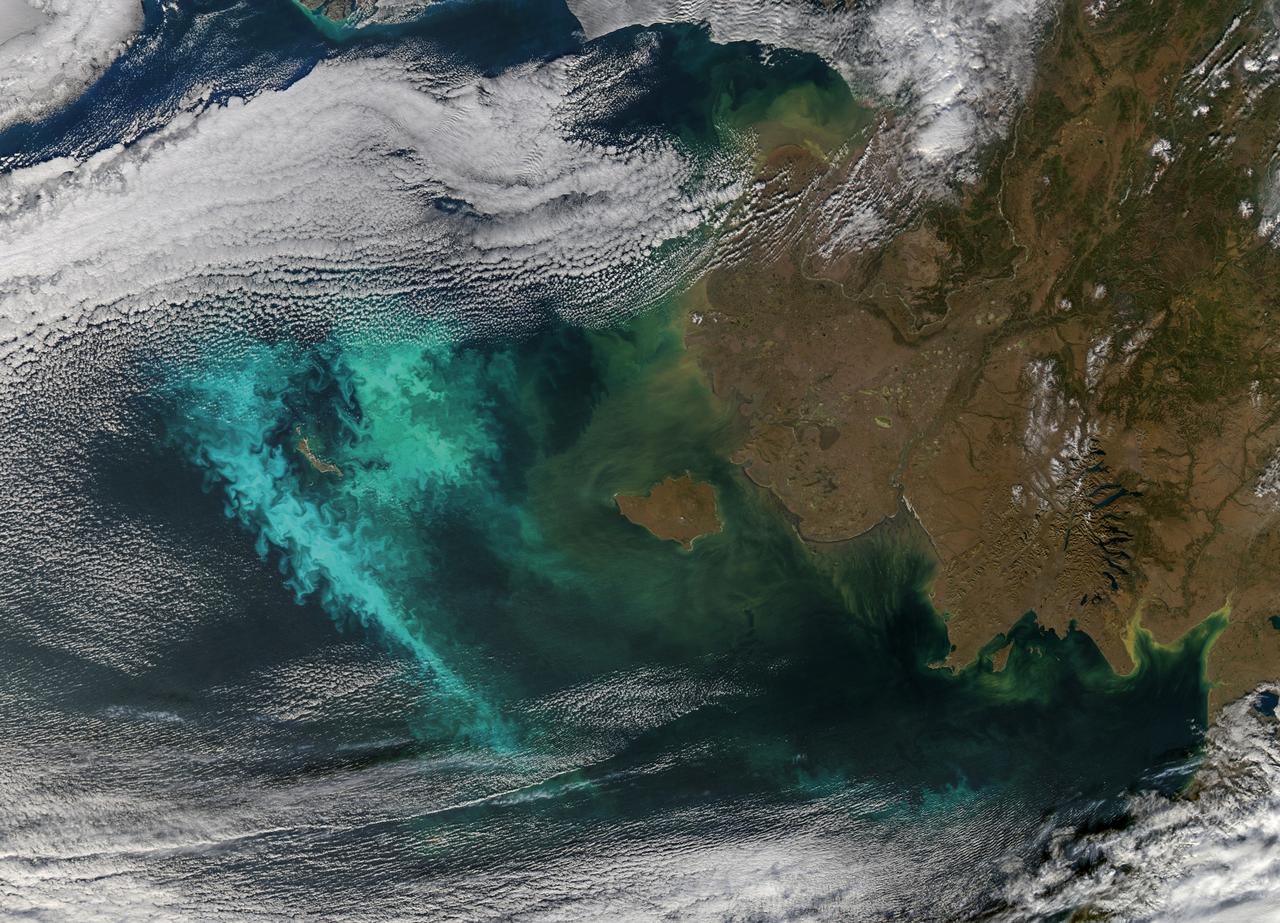
Large blooms of phytoplankton (likely coccolithophores) surrounded the 51-kilometer-long St. Matthew Island in the Bering Sea on October 8, 2014 when the above Aqua-MODIS image was collected. The swirls and eddies of color give some indication of the turbulent nature of these waters. The reflective blooms have been visible from orbit for a few months now. Credit: NASA/Goddard/Aqua/MODIS <b><a href="http://www.nasa.gov/audience/formedia/features/MP_Photo_Guidelines.html" rel="nofollow">NASA image use policy.</a></b> <b><a href="http://www.nasa.gov/centers/goddard/home/index.html" rel="nofollow">NASA Goddard Space Flight Center</a></b> enables NASA’s mission through four scientific endeavors: Earth Science, Heliophysics, Solar System Exploration, and Astrophysics. Goddard plays a leading role in NASA’s accomplishments by contributing compelling scientific knowledge to advance the Agency’s mission. <b>Follow us on <a href="http://twitter.com/NASAGoddardPix" rel="nofollow">Twitter</a></b> <b>Like us on <a href="http://www.facebook.com/pages/Greenbelt-MD/NASA-Goddard/395013845897?ref=tsd" rel="nofollow">Facebook</a></b> <b>Find us on <a href="http://instagram.com/nasagoddard?vm=grid" rel="nofollow">Instagram</a></b>
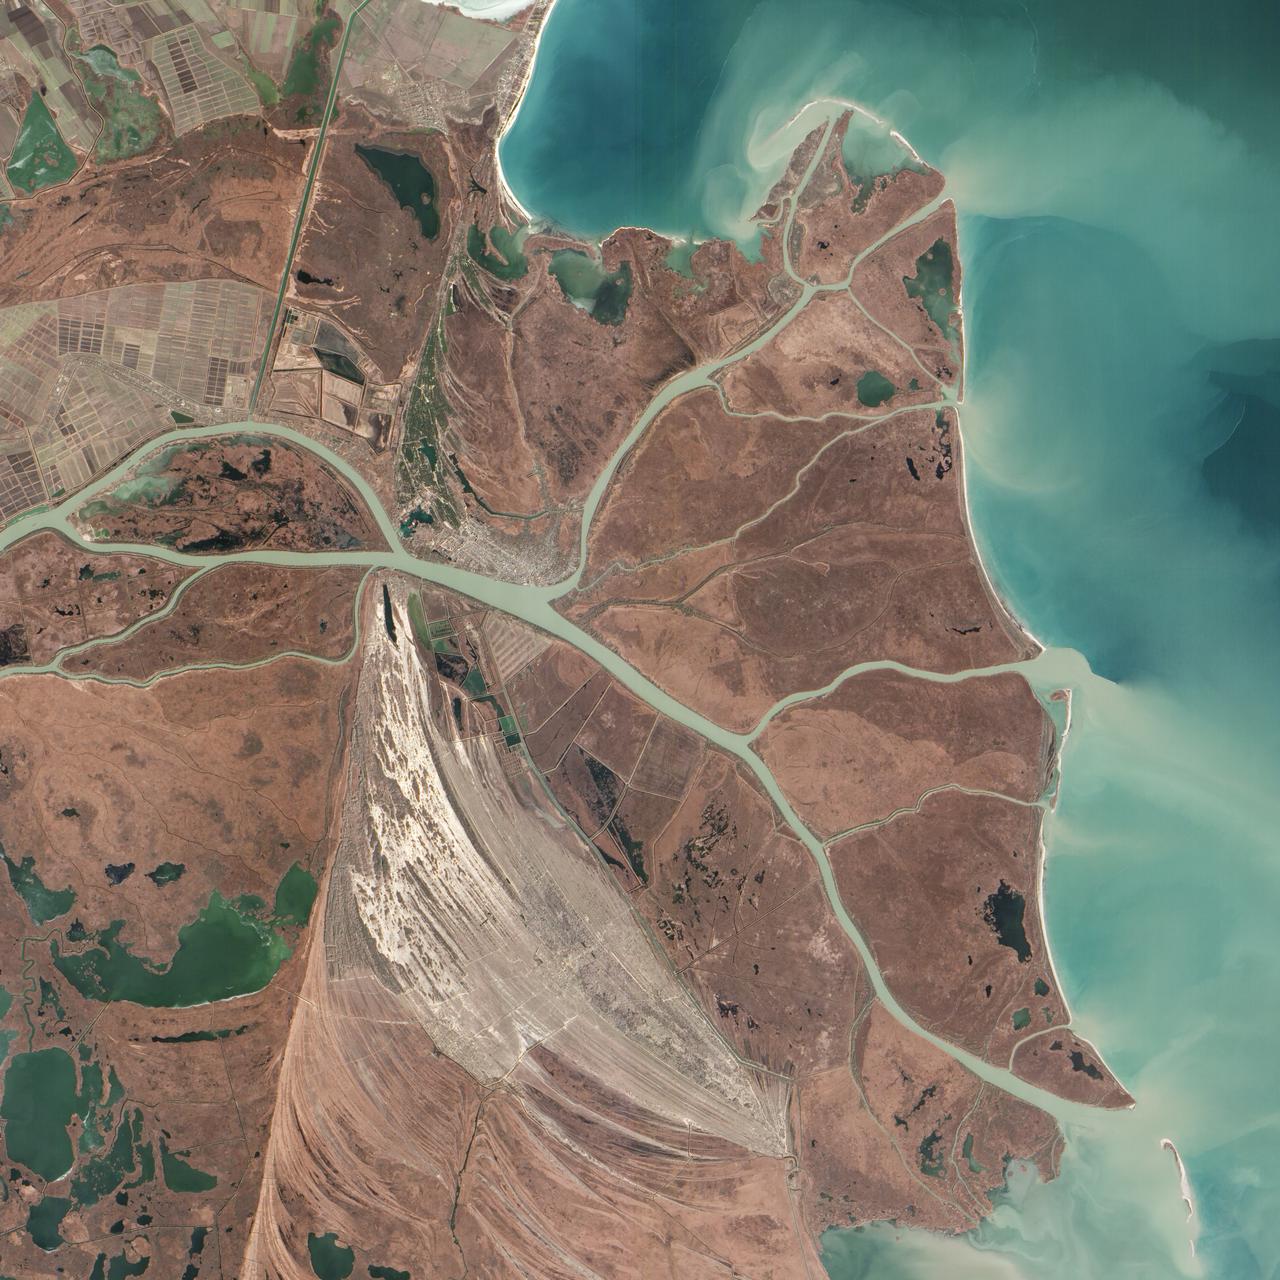
Acquired February 5, 2013 The Danube River is the largest in the European Union, its watershed draining 801,463 square kilometers (309,447 square miles) of land across 19 countries. Where that great river reaches the Black Sea, a remarkable delta has formed—the “Everglades” of Europe. The Danube Delta is home to more than 300 species of bird and 45 species of freshwater fish. The Danube Delta has been home to human settlements since the end of the Stone Age (the Neolithic Period), and the ancient Greeks, Romans, and Byzantines all built trading ports and military outposts along this coast. Today, the border between Romania and Ukraine cuts through the northern part of the delta. The area is a United Nations World Heritage Site, both for its natural and human history, and for the traditional maritime culture that persists in its marshes. All the while, the landscape has been shaped and re-shaped by nature and man. The image above was acquired on February 5, 2013, by the Advanced Land Imager (ALI) on NASA’s Earth Observing-1 (EO-1) satellite. The Danube Delta has a number of lobes formed over the past several thousand years, and this image is focused largely on the northernmost Chilia (or Kilia) lobe. It is the youngest section of the delta—somewhere between 300 to 400 years old—and lies mostly within Ukraine. Much of the land in the image above is officially considered part of the Danube Biosphere Reserve. Near the center of the image, the small city of Vylkove is known as the “Ukranian Venice,” due to its canals. To the lower left, the older Sulina lobe of the delta stretches to the south and further inland into Romania. White and brown curved lines reveal beach ridges and former shorelines, with the whiter ridges composed almost entirely of pure quartz sand in high dunes. To the east of the ridges, most of the landscape is flat marshland that is mostly brown in the barren days of winter. The Bystroye Canal through the center of the Chilia lobe has been the subject of heated debate over the past two decades. Over the centuries, damming and channeling of the Danube throughout Europe has reduced its water flow and sediment load to roughly 30 percent of what it once was, according to coastal geologist Liviu Giosan of the Woods Hole Oceanographic Institution. In recent years, the Ukrainian government has dredged some delta channels (including Bystroye) and proposed extensive dredging of others in order to provide navigational channels for large ships. Proponents argue for the economic needs of water transportation routes. Opponents note that deeper, faster channels mean less mud and sand is deposited in the delta; in some places, more is carried away by swifter currents. Both affect the sensitive ecosystems and the ability of the delta to restore itself and grow. In a 2012 report led by Giosan, scientists noted that the shape, water chemistry, and biology of Danube Delta was being altered long before the modern Industrial Era. Land use practices—particularly farming and forest clearing—added significant amounts of nutrients into the water and reduced salinity in the Black Sea, changing the dominant species of phytoplankton and sending a ripple of effects through the entire food web. NASA Earth Observatory image by Jesse Allen and Robert Simmon, using EO-1 ALI data provided courtesy of the NASA EO-1 team and the U.S. Geological Survey. Caption by Mike Carlowicz. Instrument: EO-1 - ALI More info: <a href="http://earthobservatory.nasa.gov/IOTD/view.php?id=80459" rel="nofollow">earthobservatory.nasa.gov/IOTD/view.php?id=80459</a> Credit: <b><a href="http://www.earthobservatory.nasa.gov/" rel="nofollow"> NASA Earth Observatory</a></b> <b><a href="http://www.nasa.gov/audience/formedia/features/MP_Photo_Guidelines.html" rel="nofollow">NASA image use policy.</a></b> <b><a href="http://www.nasa.gov/centers/goddard/home/index.html" rel="nofollow">NASA Goddard Space Flight Center</a></b> enables NASA’s mission through four scientific endeavors: Earth Science, Heliophysics, Solar System Exploration, and Astrophysics. Goddard plays a leading role in NASA’s accomplishments by contributing compelling scientific knowledge to advance the Agency’s mission. <b>Follow us on <a href="http://twitter.com/NASA_GoddardPix" rel="nofollow">Twitter</a></b> <b>Like us on <a href="http://www.facebook.com/pages/Greenbelt-MD/NASA-Goddard/395013845897?ref=tsd" rel="nofollow">Facebook</a></b> <b>Find us on <a href="http://instagram.com/nasagoddard?vm=grid" rel="nofollow">Instagram</a></b>
NASA image acquired September 24, 2012 City lights at night are a fairly reliable indicator of where people live. But this isn’t always the case, and the Korean Peninsula shows why. As of July 2012, South Korea’s population was estimated at roughly 49 million people, and North Korea’s population was estimated at about half that number. But where South Korea is gleaming with city lights, North Korea has hardly any lights at all—just a faint glimmer around Pyongyang. On September 24, 2012, the Visible Infrared Imaging Radiometer Suite (VIIRS) on the Suomi NPP satellite captured this nighttime view of the Korean Peninsula. This imagery is from the VIIRS “day-night band,” which detects light in a range of wavelengths from green to near-infrared and uses filtering techniques to observe signals such as gas flares, auroras, wildfires, city lights, and reflected moonlight. The wide-area image shows the Korean Peninsula, parts of China and Japan, the Yellow Sea, and the Sea of Japan. The white inset box encloses an area showing ship lights in the Yellow Sea. Many of the ships form a line, as if assembling along a watery border. Following the 1953 armistice ending the Korean War, per-capita income in South Korea rose to about 17 times the per-capital income level of North Korea, according to the U.S. Central Intelligence Agency. Worldwide, South Korea ranks 12th in electricity production, and 10th in electricity consumption, per 2011 estimates. North Korea ranks 71st in electricity production, and 73rd in electricity consumption, per 2009 estimates. NASA Earth Observatory image by Jesse Allen and Robert Simmon, using VIIRS Day-Night Band data from the Suomi National Polar-orbiting Partnership. Suomi NPP is the result of a partnership between NASA, the National Oceanic and Atmospheric Administration, and the Department of Defense. Caption by Michon Scott. Instrument: Suomi NPP - VIIRS Credit: <b><a href="http://www.earthobservatory.nasa.gov/" rel="nofollow"> NASA Earth Observatory</a></b> <b>Click here to view all of the <a href="http://earthobservatory.nasa.gov/Features/NightLights/" rel="nofollow"> Earth at Night 2012 images </a></b> <b>Click here to <a href="http://earthobservatory.nasa.gov/NaturalHazards/view.php?id=79796" rel="nofollow"> read more </a> about this image </b> <b><a href="http://www.nasa.gov/audience/formedia/features/MP_Photo_Guidelines.html" rel="nofollow">NASA image use policy.</a></b> <b><a href="http://www.nasa.gov/centers/goddard/home/index.html" rel="nofollow">NASA Goddard Space Flight Center</a></b> enables NASA’s mission through four scientific endeavors: Earth Science, Heliophysics, Solar System Exploration, and Astrophysics. Goddard plays a leading role in NASA’s accomplishments by contributing compelling scientific knowledge to advance the Agency’s mission. <b>Follow us on <a href="http://twitter.com/NASA_GoddardPix" rel="nofollow">Twitter</a></b> <b>Like us on <a href="http://www.facebook.com/pages/Greenbelt-MD/NASA-Goddard/395013845897?ref=tsd" rel="nofollow">Facebook</a></b> <b>Find us on <a href="http://instagram.com/nasagoddard?vm=grid" rel="nofollow">Instagram</a></b>
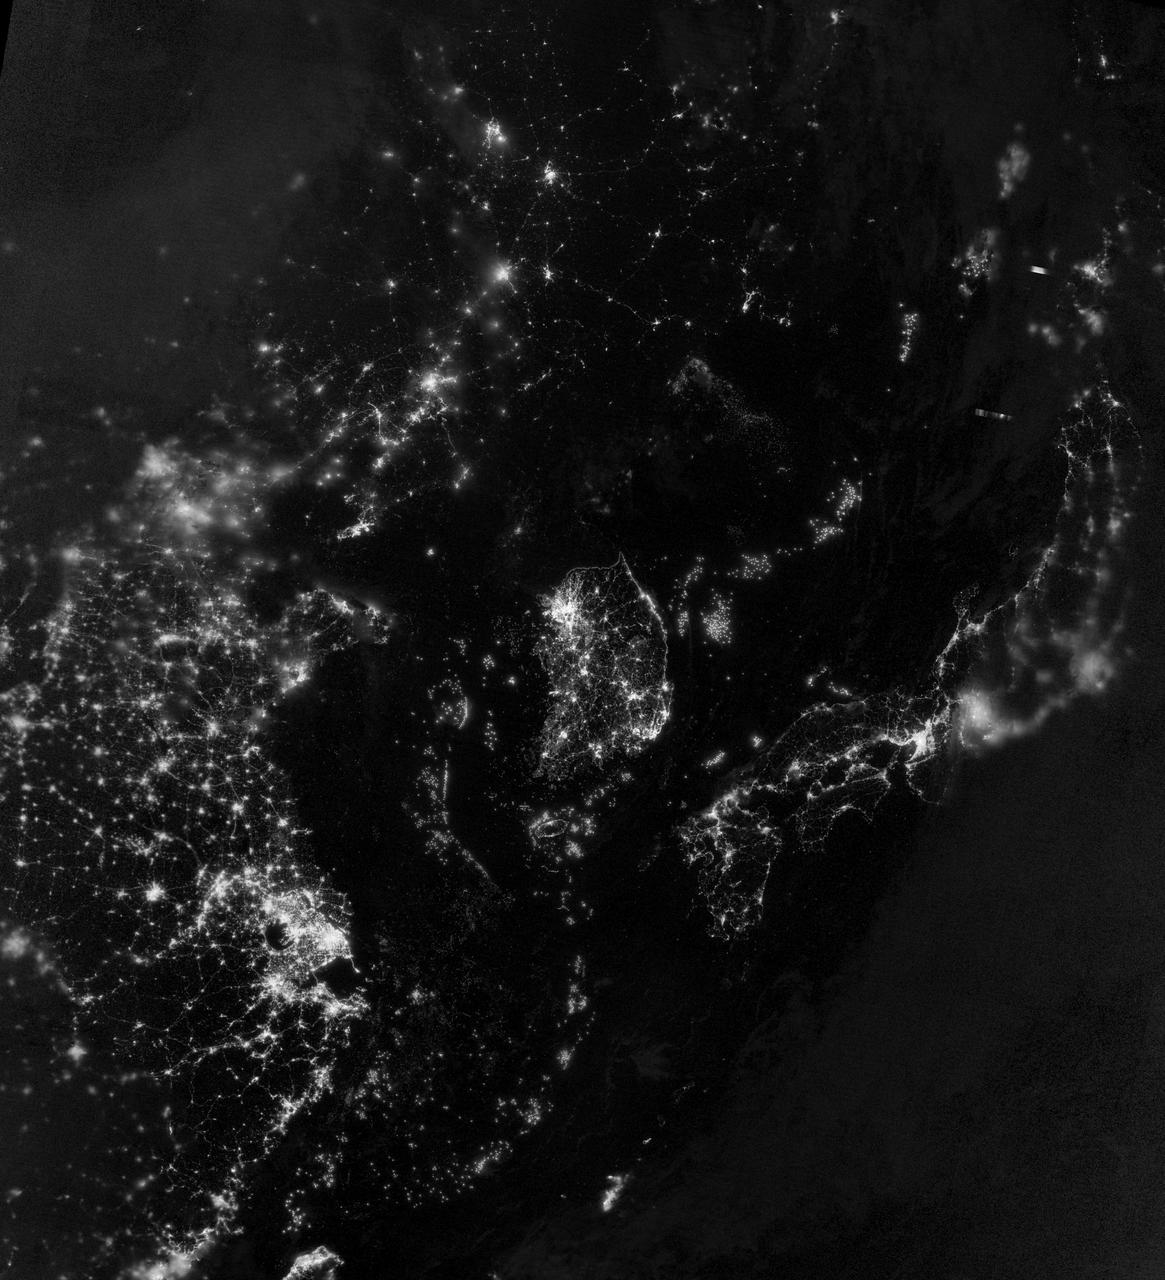
NASA image acquired September 24, 2012 City lights at night are a fairly reliable indicator of where people live. But this isn’t always the case, and the Korean Peninsula shows why. As of July 2012, South Korea’s population was estimated at roughly 49 million people, and North Korea’s population was estimated at about half that number. But where South Korea is gleaming with city lights, North Korea has hardly any lights at all—just a faint glimmer around Pyongyang. On September 24, 2012, the Visible Infrared Imaging Radiometer Suite (VIIRS) on the Suomi NPP satellite captured this nighttime view of the Korean Peninsula. This imagery is from the VIIRS “day-night band,” which detects light in a range of wavelengths from green to near-infrared and uses filtering techniques to observe signals such as gas flares, auroras, wildfires, city lights, and reflected moonlight. The wide-area image shows the Korean Peninsula, parts of China and Japan, the Yellow Sea, and the Sea of Japan. The white inset box encloses an area showing ship lights in the Yellow Sea. Many of the ships form a line, as if assembling along a watery border. Following the 1953 armistice ending the Korean War, per-capita income in South Korea rose to about 17 times the per-capital income level of North Korea, according to the U.S. Central Intelligence Agency. Worldwide, South Korea ranks 12th in electricity production, and 10th in electricity consumption, per 2011 estimates. North Korea ranks 71st in electricity production, and 73rd in electricity consumption, per 2009 estimates. NASA Earth Observatory image by Jesse Allen and Robert Simmon, using VIIRS Day-Night Band data from the Suomi National Polar-orbiting Partnership. Suomi NPP is the result of a partnership between NASA, the National Oceanic and Atmospheric Administration, and the Department of Defense. Caption by Michon Scott. Instrument: Suomi NPP - VIIRS Credit: <b><a href="http://www.earthobservatory.nasa.gov/" rel="nofollow"> NASA Earth Observatory</a></b> <b>Click here to view all of the <a href="http://earthobservatory.nasa.gov/Features/NightLights/" rel="nofollow"> Earth at Night 2012 images </a></b> <b>Click here to <a href="http://earthobservatory.nasa.gov/NaturalHazards/view.php?id=79796" rel="nofollow"> read more </a> about this image </b> <b><a href="http://www.nasa.gov/audience/formedia/features/MP_Photo_Guidelines.html" rel="nofollow">NASA image use policy.</a></b> <b><a href="http://www.nasa.gov/centers/goddard/home/index.html" rel="nofollow">NASA Goddard Space Flight Center</a></b> enables NASA’s mission through four scientific endeavors: Earth Science, Heliophysics, Solar System Exploration, and Astrophysics. Goddard plays a leading role in NASA’s accomplishments by contributing compelling scientific knowledge to advance the Agency’s mission. <b>Follow us on <a href="http://twitter.com/NASA_GoddardPix" rel="nofollow">Twitter</a></b> <b>Like us on <a href="http://www.facebook.com/pages/Greenbelt-MD/NASA-Goddard/395013845897?ref=tsd" rel="nofollow">Facebook</a></b> <b>Find us on <a href="http://instagram.com/nasagoddard?vm=grid" rel="nofollow">Instagram</a></b>
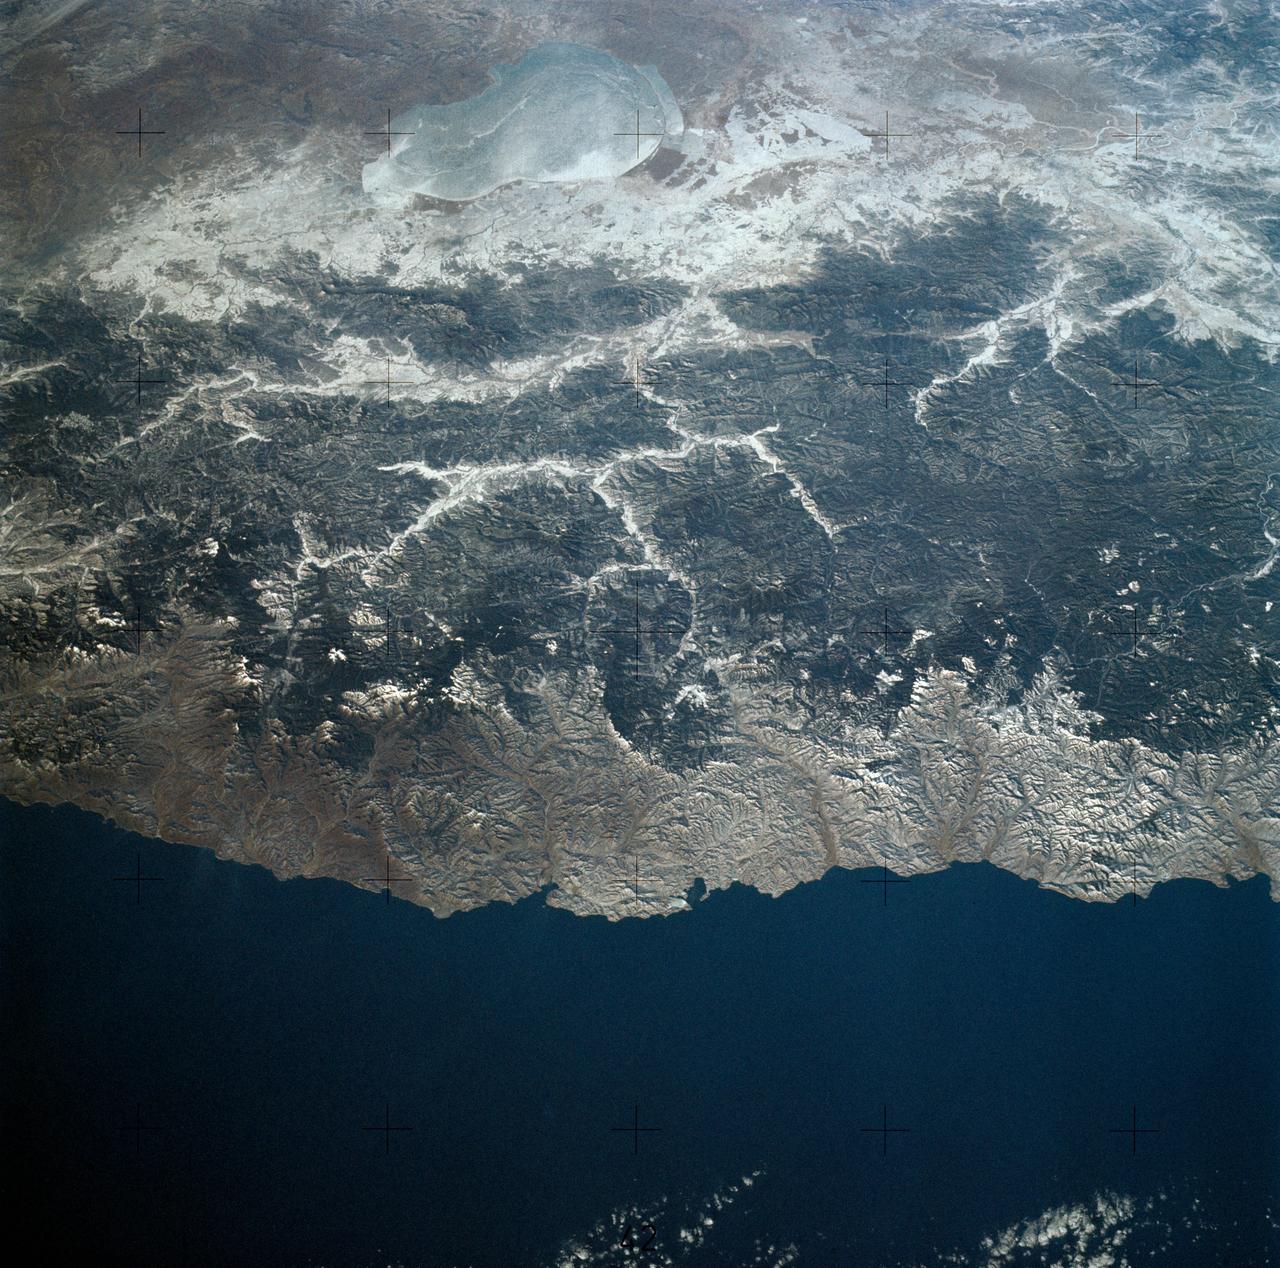
SL4-140-4110 (January 1974) --- View of the USSR, Siberia area from Skylab 4. Other areas seen are Ozero, Kanka, Ussiriysk, the Sea of Japan and Kavalerovo (45.5N, 135.5E). Photo credit: NASA
Staring at the Sea, Staring at the Sand. The smooth, rolling terrain in this high resolution image from NASA MESSENGER spacecraft looks almost like sand dunes or ripples on a beach.
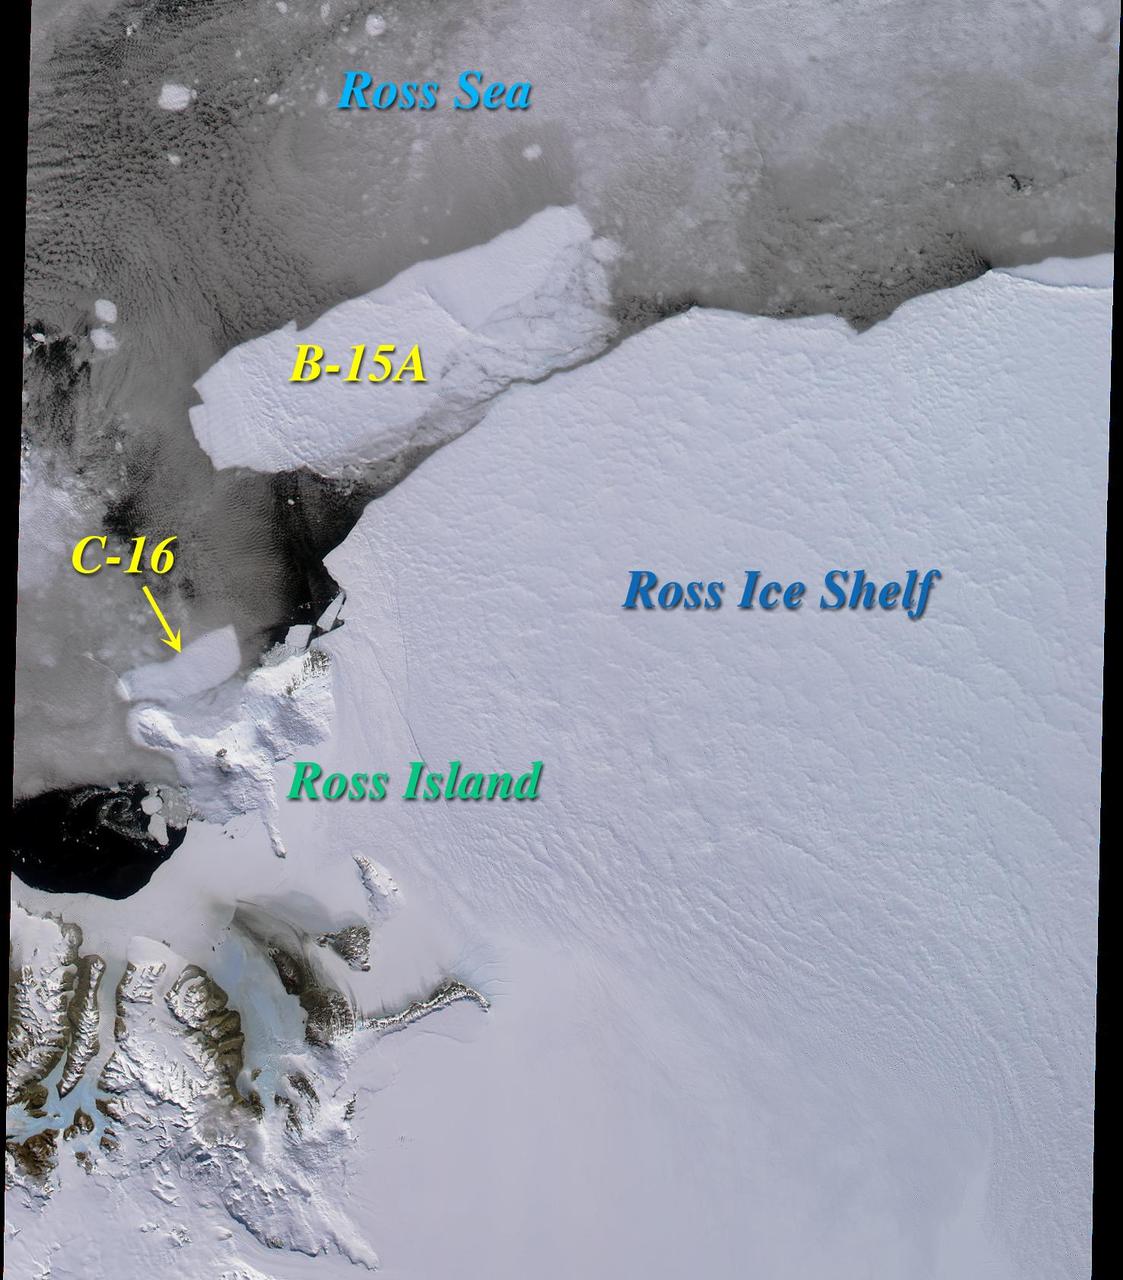
Two large icebergs, designated B-15A and C-16, captured by NASA Terra satellite, are of the Ross Ice Shelf and Ross Sea in Antarctica, acquired on December 10, 2000 during Terra orbit 5220, show
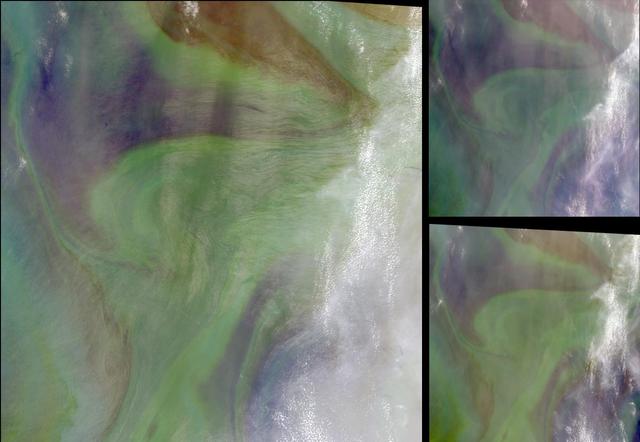
In the Arabian Sea, sunlight and nutrients has fueled a startling occurrence of colorful phytoplankton and bacterial assemblages, which is captured in these natural color images from NASA Terra spacecraft October 2, 2004.
![NASA researchers have new [sic] insights into the mysteries of Arctic sea ice, thanks to the unique abilities of Canada Radarsat satellite.](https://images-assets.nasa.gov/image/PIA02971/PIA02971~thumb.jpg)
NASA researchers have new [sic] insights into the mysteries of Arctic sea ice, thanks to the unique abilities of Canada Radarsat satellite.

Wonders in the Antarctic Sea and Sky NASA aircraft and scientists have returned to the United States after a short ice-surveying mission to #Antarctica. Despite having only a week of flying time, the team returned with crucial scientific data and a trove of spectacular aerial photographs. The flights over Antarctica were part of Operation #IceBridge, a multi-year mission to monitor conditions in Antarctica and the Arctic until a new ice-monitoring satellite, ICESat-2, launches in 2016. ICESat-1 was decommissioned in 2009, and IceBridge aircraft have been flying ever since. Laser altimeter and radar data are the primary products of the mission, but IceBridge project scientist Michael Studinger almost always has his digital camera ready as well. On November 24, 2013, he took this photograph of a multi-layered lenticular cloud hovering near Mount Discovery, a volcano about 70 kilometers (44 miles) southwest of McMurdo. Lenticular #clouds are a type of wave cloud. They usually form when a layer of air near the surface encounters a topographic barrier, gets pushed upward, and flows over it as a series of atmospheric gravity waves. Lenticular clouds form at the crest of the waves, where the air is coolest and water vapor is most likely to condense into cloud droplets. The bulging sea ice in the foreground is a pressure ridge, which formed when separate ice floes collided and piled up on each other. Read more: <a href="http://1.usa.gov/18lXIQS" rel="nofollow">1.usa.gov/18lXIQS</a> Photograph courtesy of Michael Studinger. Caption by Adam Voiland of NASA's Earth Observatory. <b><a href="http://www.nasa.gov/audience/formedia/features/MP_Photo_Guidelines.html" rel="nofollow">NASA image use policy.</a></b> <b><a href="http://www.nasa.gov/centers/goddard/home/index.html" rel="nofollow">NASA Goddard Space Flight Center</a></b> enables NASA’s mission through four scientific endeavors: Earth Science, Heliophysics, Solar System Exploration, and Astrophysics. Goddard plays a leading role in NASA’s accomplishments by contributing compelling scientific knowledge to advance the Agency’s mission. <b>Follow us on <a href="http://twitter.com/NASA_GoddardPix" rel="nofollow">Twitter</a></b> <b>Like us on <a href="http://www.facebook.com/pages/Greenbelt-MD/NASA-Goddard/395013845897?ref=tsd" rel="nofollow">Facebook</a></b> <b>Find us on <a href="http://instagram.com/nasagoddard?vm=grid" rel="nofollow">Instagram</a></b>
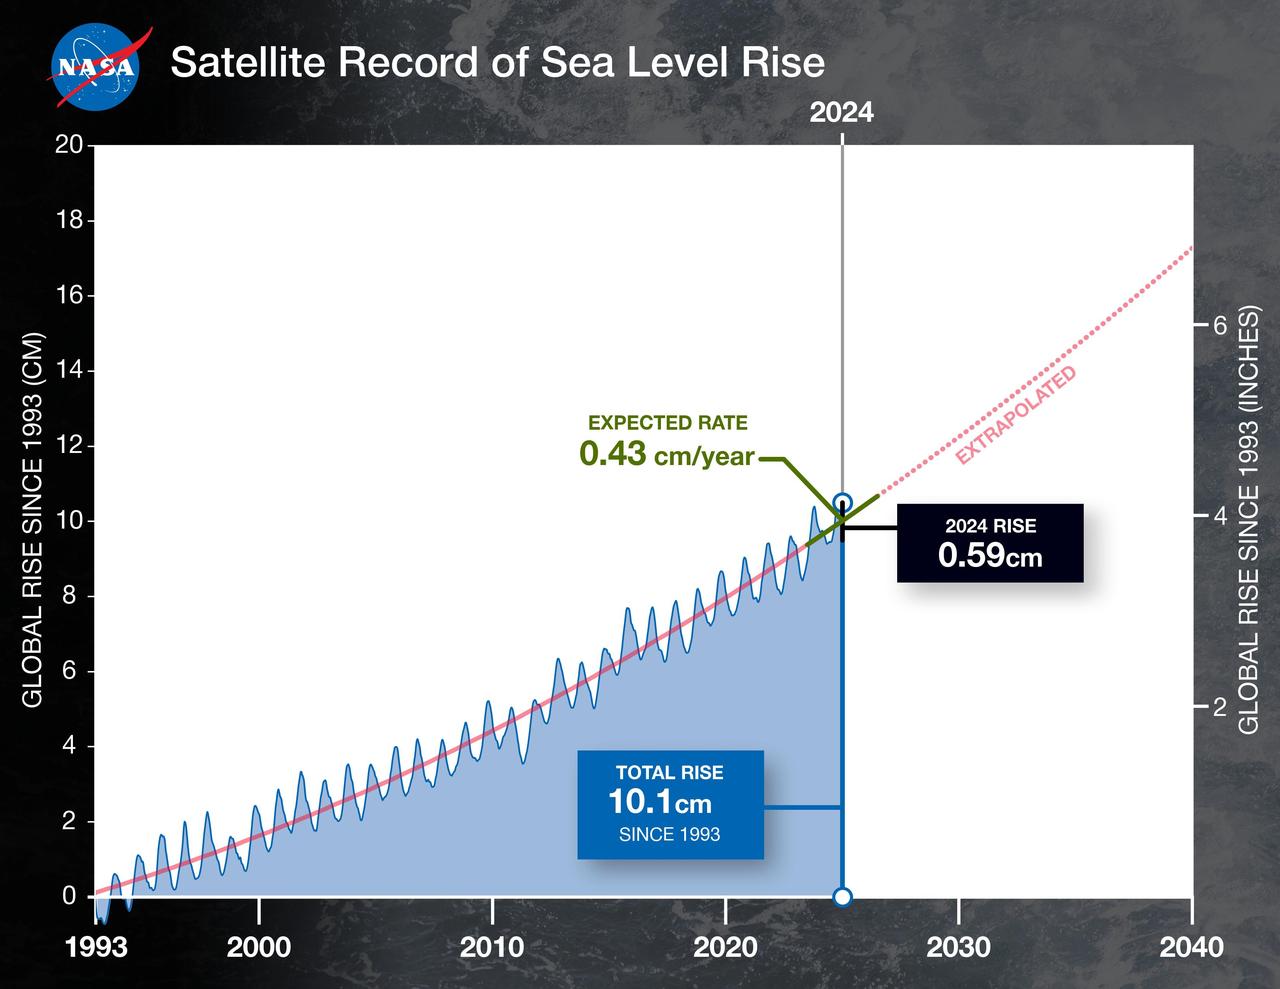
This graph shows the rise in global mean sea level from 1993 to 2024 based on data from a series of five international satellites. The solid red line indicates the trajectory of this increase, which has more than doubled over the three decades. The dotted red line projects future sea level rise. Global sea level rose faster than expected in 2024 due mostly to ocean water expanding as it warms, or thermal expansion. According to a NASA-led analysis, last year's rate of rise was 0.23 inches (0.59 centimeters) per year, compared to the expected rate of 0.17 inches (0.43 centimeters) per year. In recent years, about two-thirds of sea level rise was due to the addition of water from land into the ocean by melting ice sheets and glaciers. About a third came from thermal expansion of seawater. But in 2024, those contributions flipped, with two-thirds of sea level rise coming from thermal expansion. This NASA-led analysis is based on a sea level dataset featuring more than 30 years of satellite observations, starting with the U.S.-French TOPEX/Poseidon mission, which launched in 1992. The Sentinel-6 Michael Freilich mission, which launched in November 2020, is the latest in the series of satellites that have contributed to this sea level record. https://photojournal.jpl.nasa.gov/catalog/PIA26189
Honeybee Robotics co-founder and chairman Stephen Gorevan participates in a panel discussion titled "The Big Picture", Saturday, Aug. 5, 2017 at the Intrepid Sea, Air & Space Museum in New York City. Photo Credit: (NASA/Bill Ingalls)
Former NASA Astronaut and Enterprise Commander Joe Engle looks at an exhibit in the Intrepid Sea, Air & Space Museum's Space Shuttle Pavilion where the space shuttle Enterprise is on Thursday, July 19, 2012 in New York. Photo Credit: (NASA/Bill Ingalls)
NASA James Webb Space Telescope systems engineer Mike Menzel, participates in a panel discussion titled "The Big Picture", Saturday, Aug. 5, 2017 at the Intrepid Sea, Air & Space Museum in New York City. Photo Credit: (NASA/Bill Ingalls)
Signage points the way to NASA exhibits at the Intrepid Space & Science Festival, Saturday, Aug. 5, 2017 held at the Intrepid Sea, Air & Space Museum in New York City. The week-long festival featured talks, films and cutting-edge displays showcasing NASA technology. Photo Credit: (NASA/Bill Ingalls)

SpaceX Director of space operations and former NASA astronaut Garret Reisman participates in a panel discussion titled "The Big Picture", Saturday, Aug. 5, 2017 at the Intrepid Sea, Air & Space Museum in New York City. Photo Credit: (NASA/Bill Ingalls)
NASA exhibits line Pier 86 during the Intrepid Space & Science Festival, Saturday, Aug. 5, 2017 held at the Intrepid Sea, Air & Space Museum in New York City. The week-long festival featured talks, films and cutting-edge displays showcasing NASA technology. Photo Credit: (NASA/Bill Ingalls)
NASA James Webb Space Telescope systems engineer Mike Menzel, center, participates in a panel discussion titled "The Big Picture", Saturday, Aug. 5, 2017 at the Intrepid Sea, Air & Space Museum in New York City. Photo Credit: (NASA/Bill Ingalls)

NASA exhibits line Pier 86 during the Intrepid Space & Science Festival, Saturday, Aug. 5, 2017 held at the Intrepid Sea, Air & Space Museum in New York City. The week-long festival featured talks, films and cutting-edge displays showcasing NASA technology. Photo Credit: (NASA/Bill Ingalls)
This Spaceborne Imaging Radar-C/X-band Synthetic Aperture Radar color composite shows a portion of the Weddell Sea, which is adjacent to the continent of Antarctica. The image shows extensive coverage of first-year sea ice mixtures and patches of open water inside the ice margin. The image covers a 100 kilometer by 30 kilometer (62 mile by 18.5 mile) region of the southern ocean, centered at approximately 57 degrees south latitude and 3 degrees east longitude, which was acquired on October 3, 1994. Data used to create this image were obtained using the L-band (horizontally transmitted and vertically received) in red; the L-band (horizontally transmitted and received) in green; and the C-band (horizontally transmitted and received) in blue. The sea ice, which appears rust-brown in the image, is composed of loosely packed floes from approximately 1 meter to 2 meters (3 feet to 6.5 feet) thick and ranging from 1 meter to 20 meters (3 feet to 65.5 feet) in diameter. Large patches of open water, shown as turquoise blue, are scattered throughout the area, which is typical for ice margins experiencing off-ice winds. The thin, well-organized lines clearly visible in the ice pack are caused by radar energy reflected by floes riding the crest of ocean swells. The wispy, black features seen throughout the image represent areas where new ice is forming. Sea ice, because it acts as an insulator, reduces the loss of heat between the relatively warm ocean and cold atmosphere. This interaction is an important component of the global climate system. Because of the unique combination of winds, currents and temperatures found in this region, ice can extend many hundreds of kilometers north of Antarctica each winter, which classifies the Weddell Sea as one of nature's greatest ice-making engines. During the formation of sea ice, great quantities of salt are expelled from the frozen water. The salt increases the density of the upper layer of sea water, which then sinks to great depths. Oceanographers believe this process forms most of the oceans' deep water. Sea ice covering all of the southern oceans, including the Weddell Sea, typically reaches its most northerly extent in about September. As periods of daylight become gradually longer in the Southern Hemisphere, ice formation stops and the ice edge retreats southward. By February, most of the sea ice surrounding Antarctica disappears. Imaging radar is extremely useful for studying the polar regions because of the long periods of darkness and extensive cloud cover. The multiple frequencies of the SIR-C/X-SAR instruments allow further study into ways of improving the separation of the various thickness ranges of sea ice, which are vital to understanding the heat balance in the ice, ocean and atmospheric system. http://photojournal.jpl.nasa.gov/catalog/PIA01737