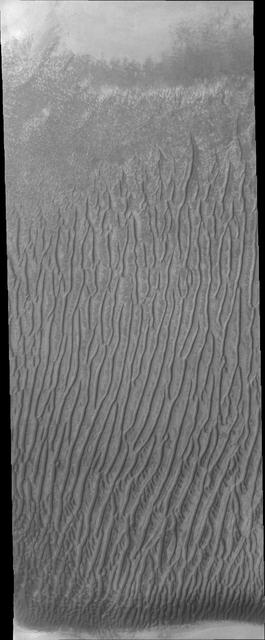
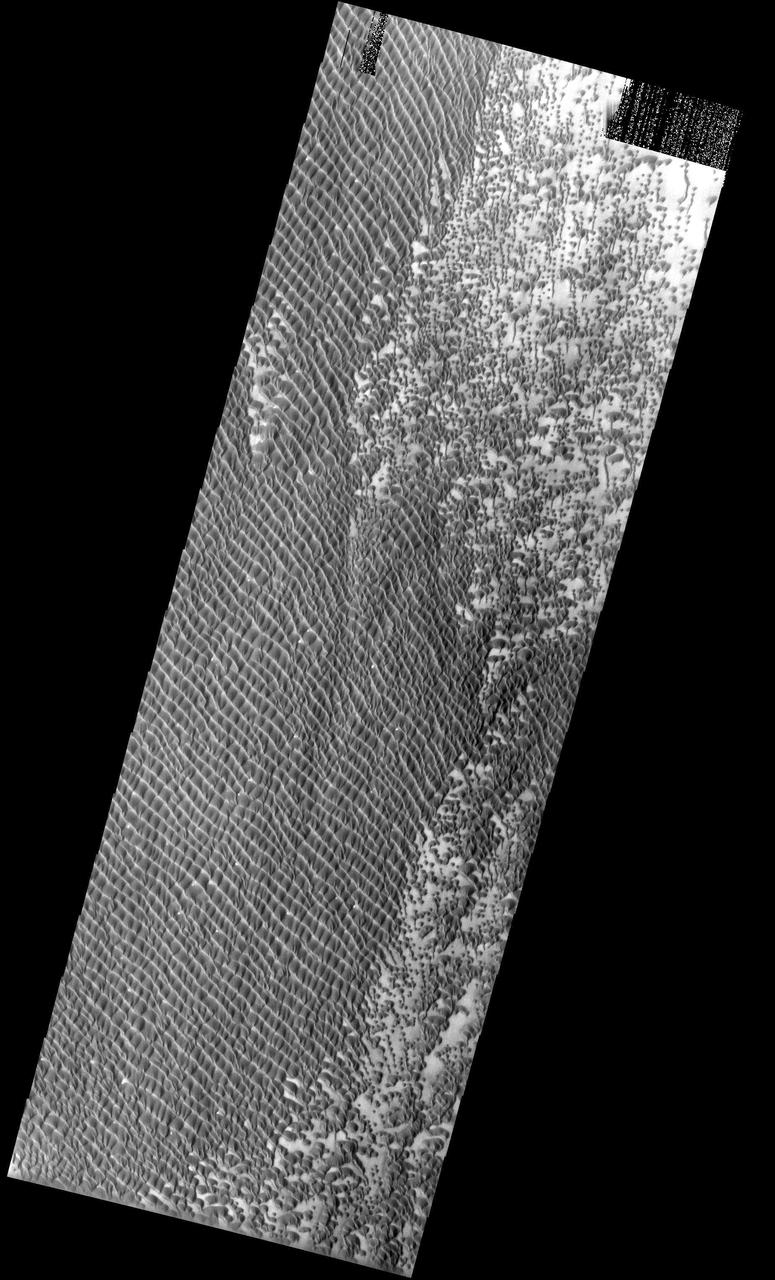
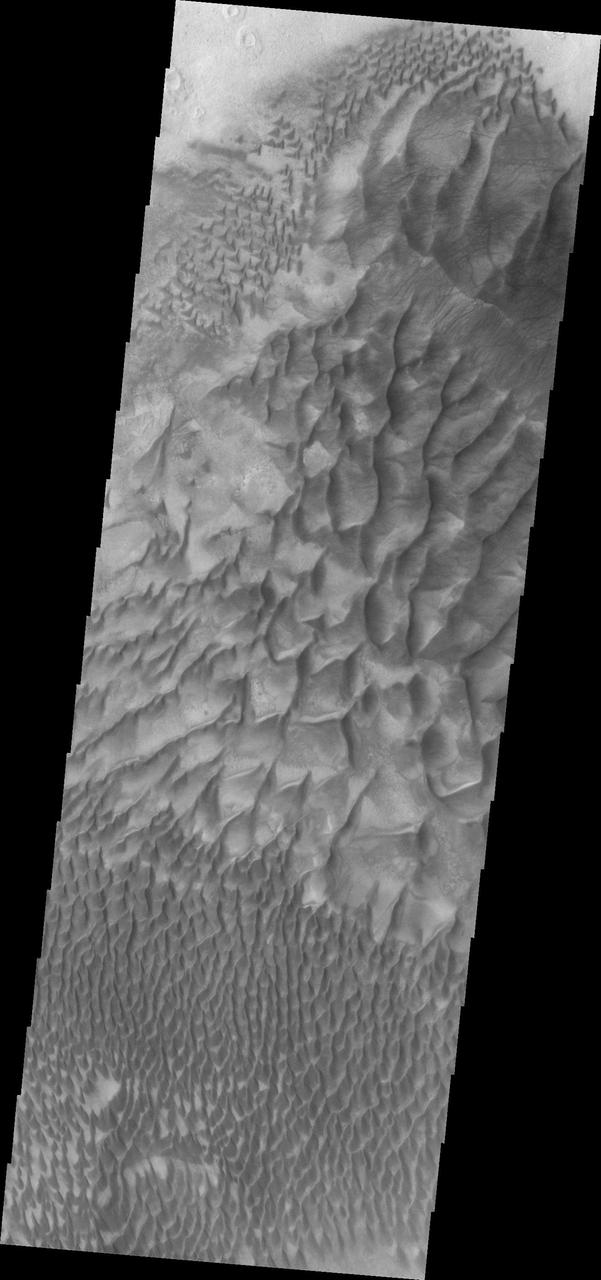
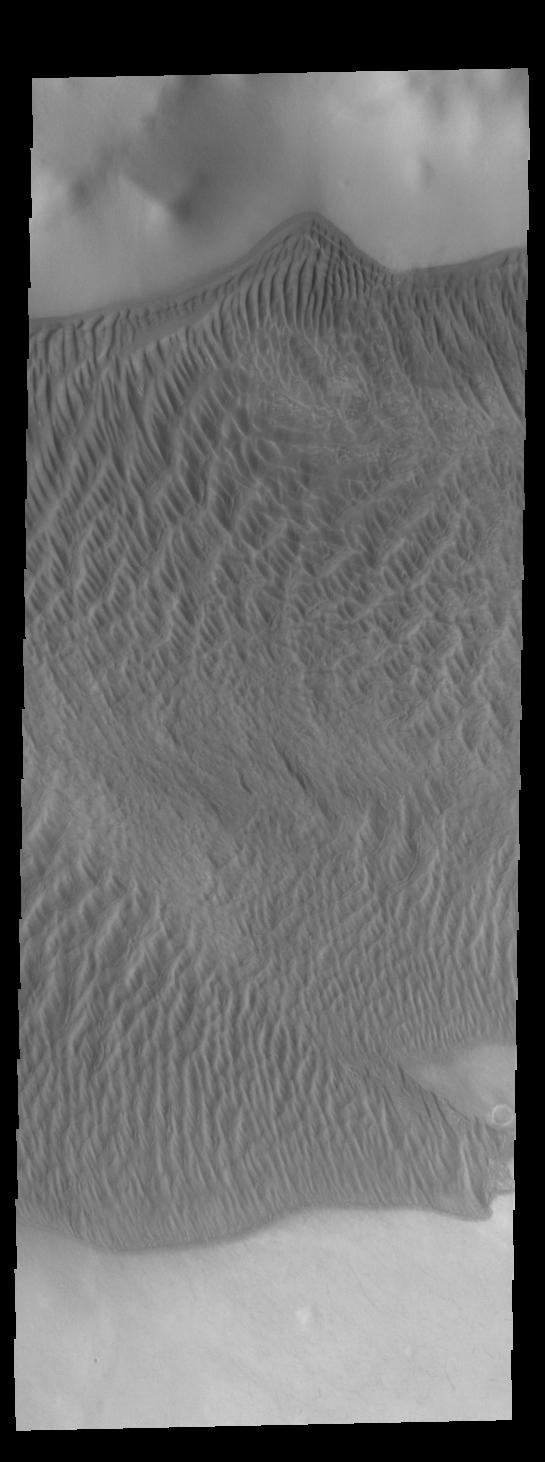
Ganges Chasma Sand Sheet
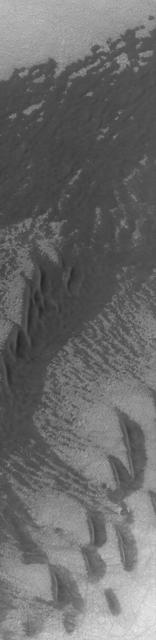
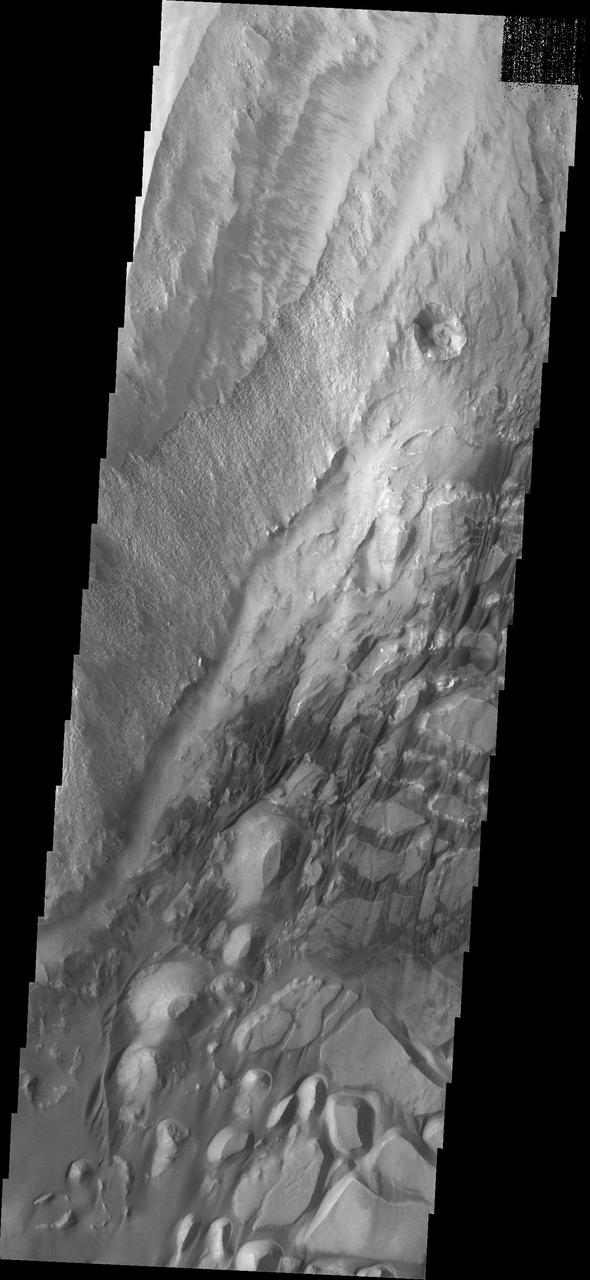
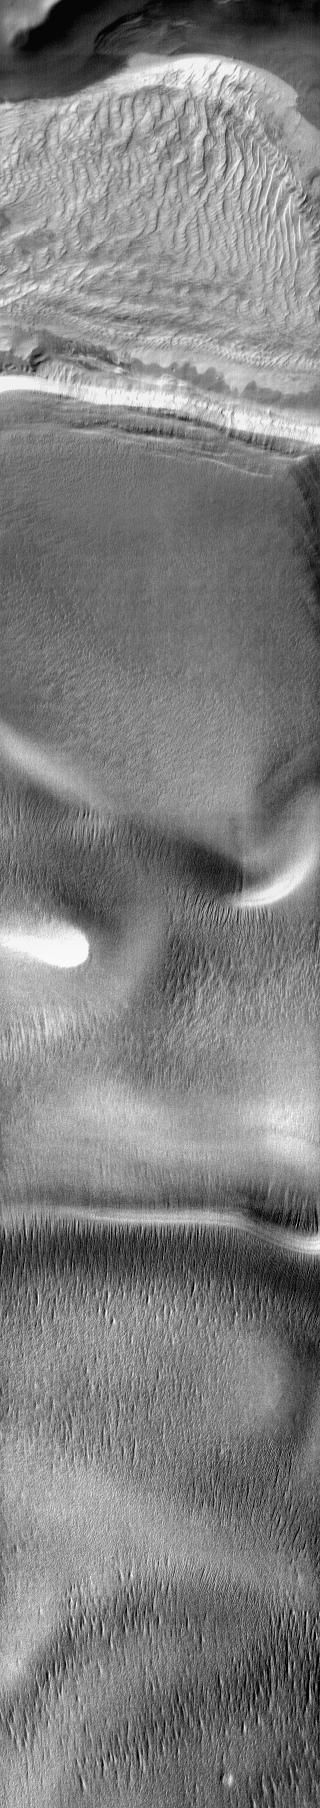
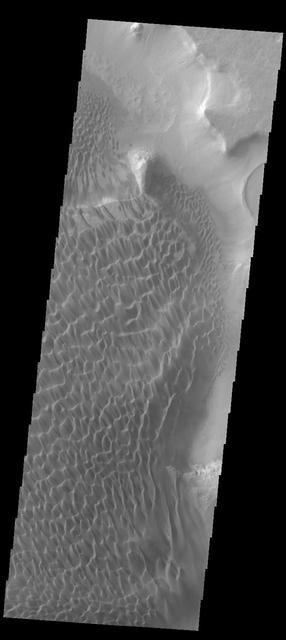
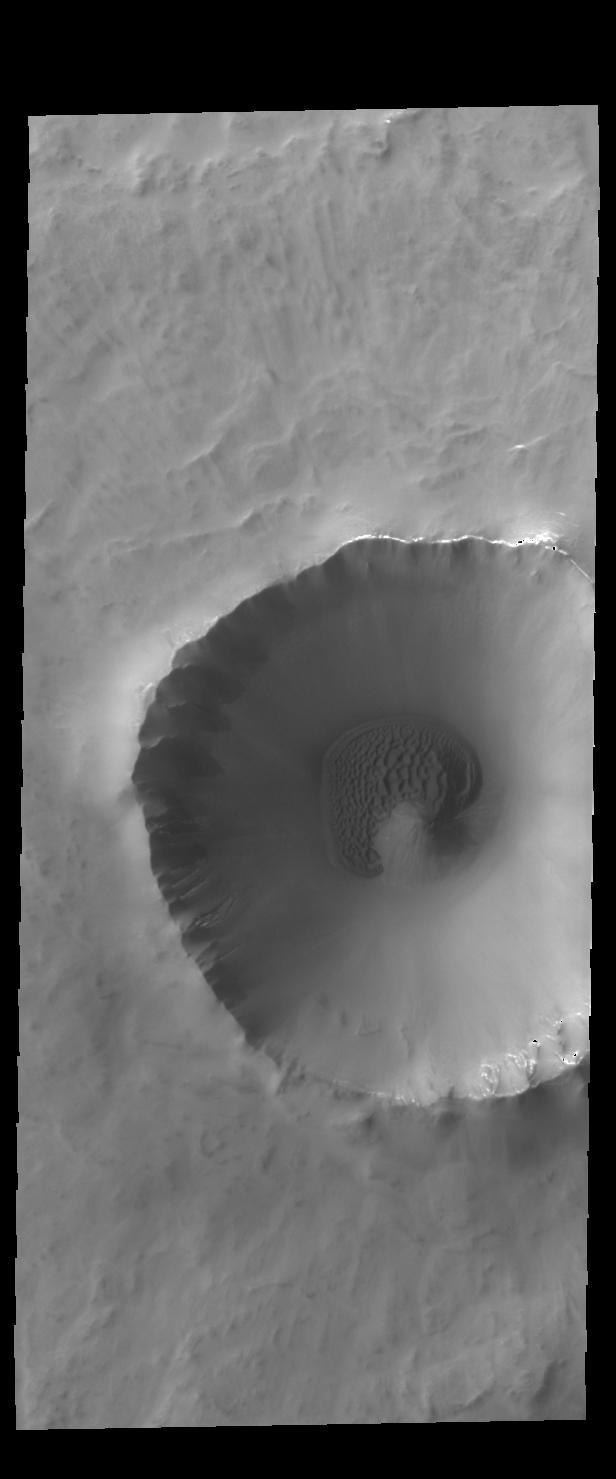
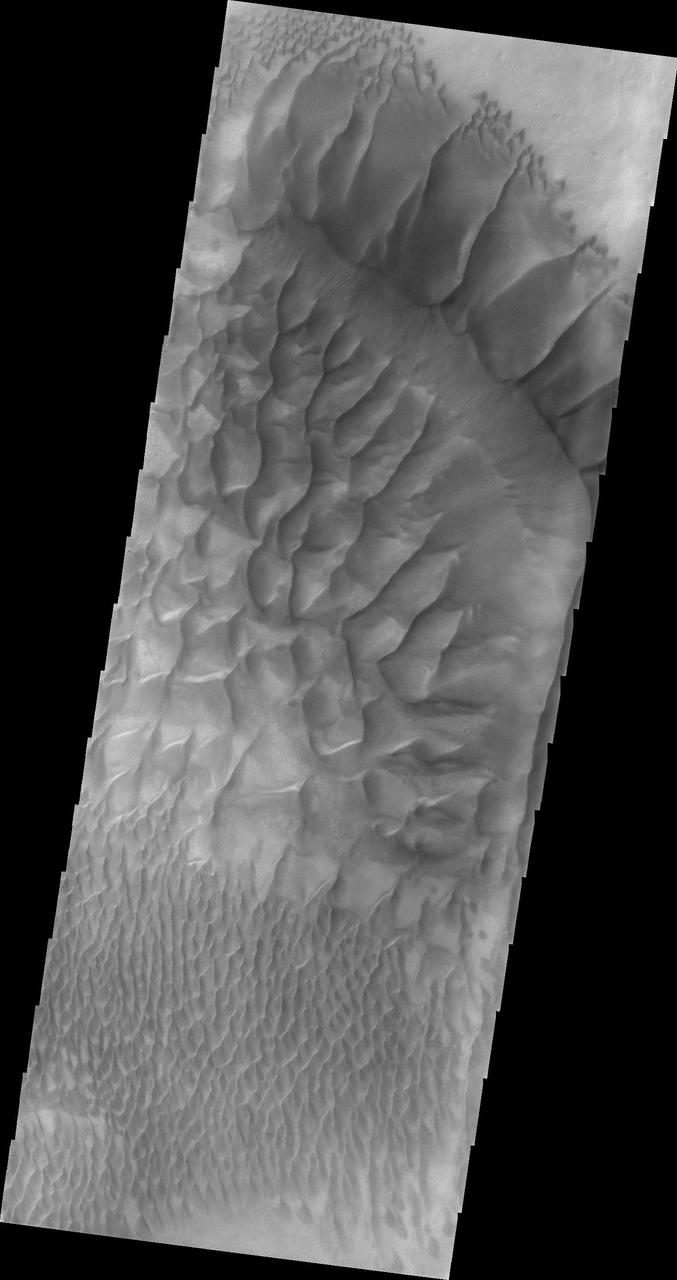
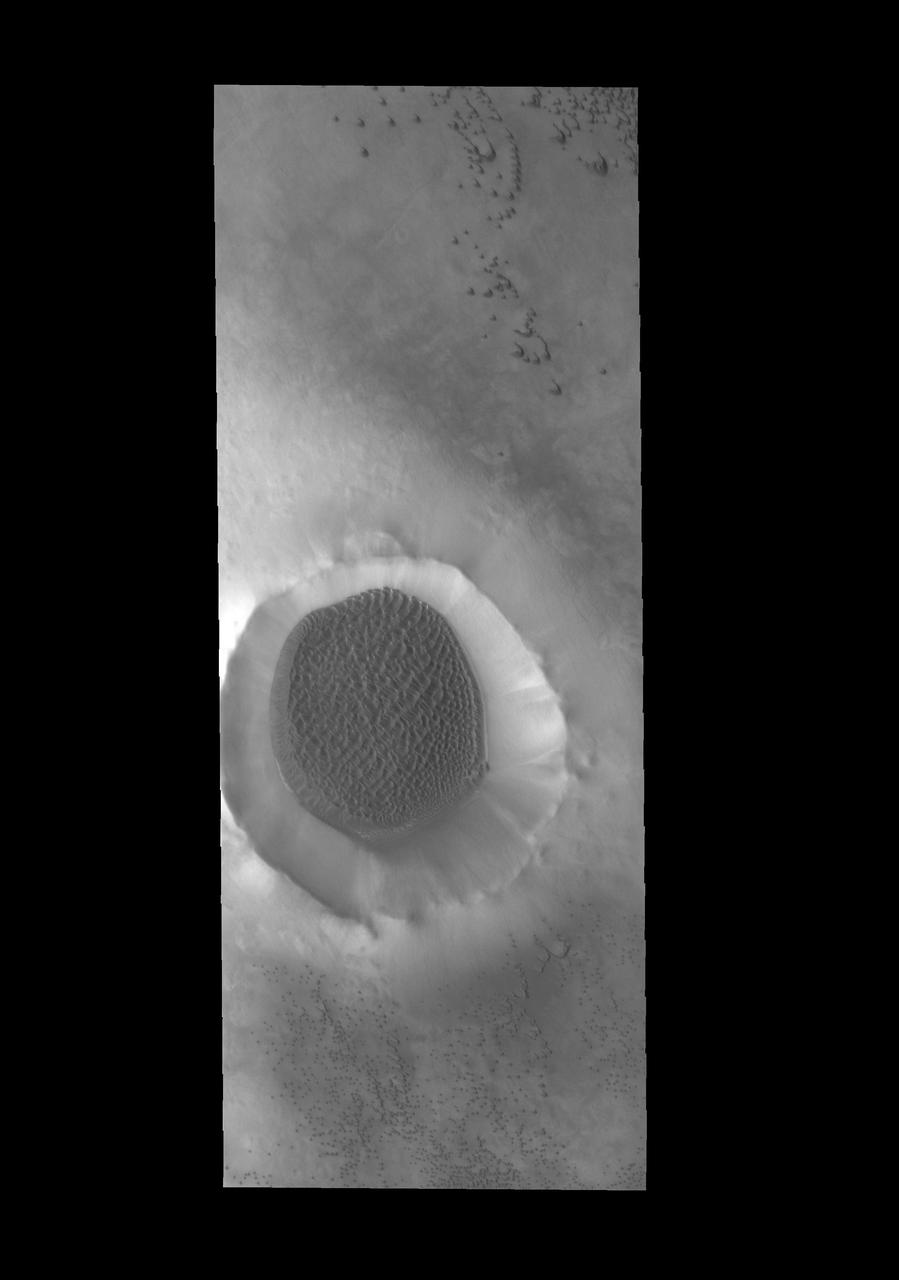
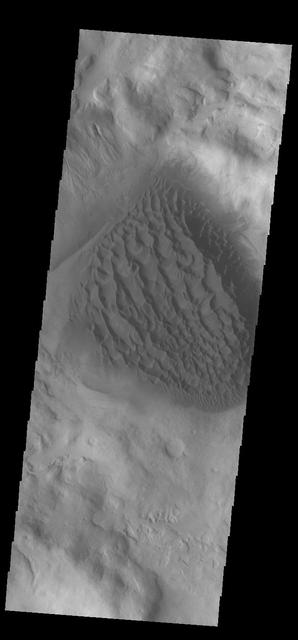
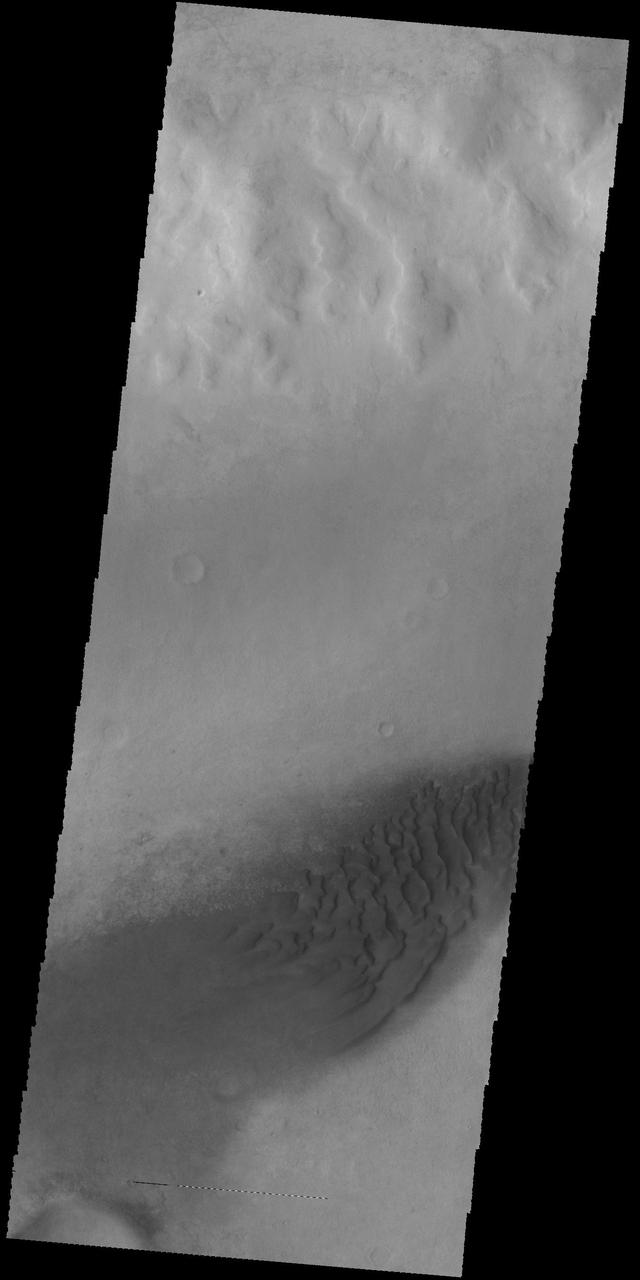
Sand Sheet on Crater Floor
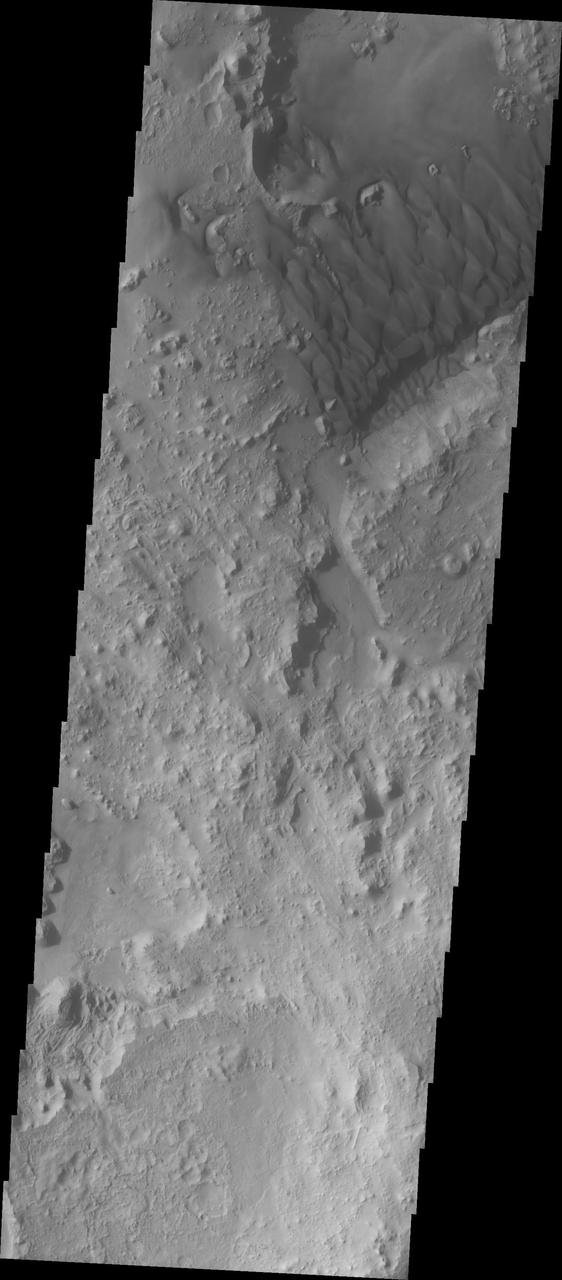
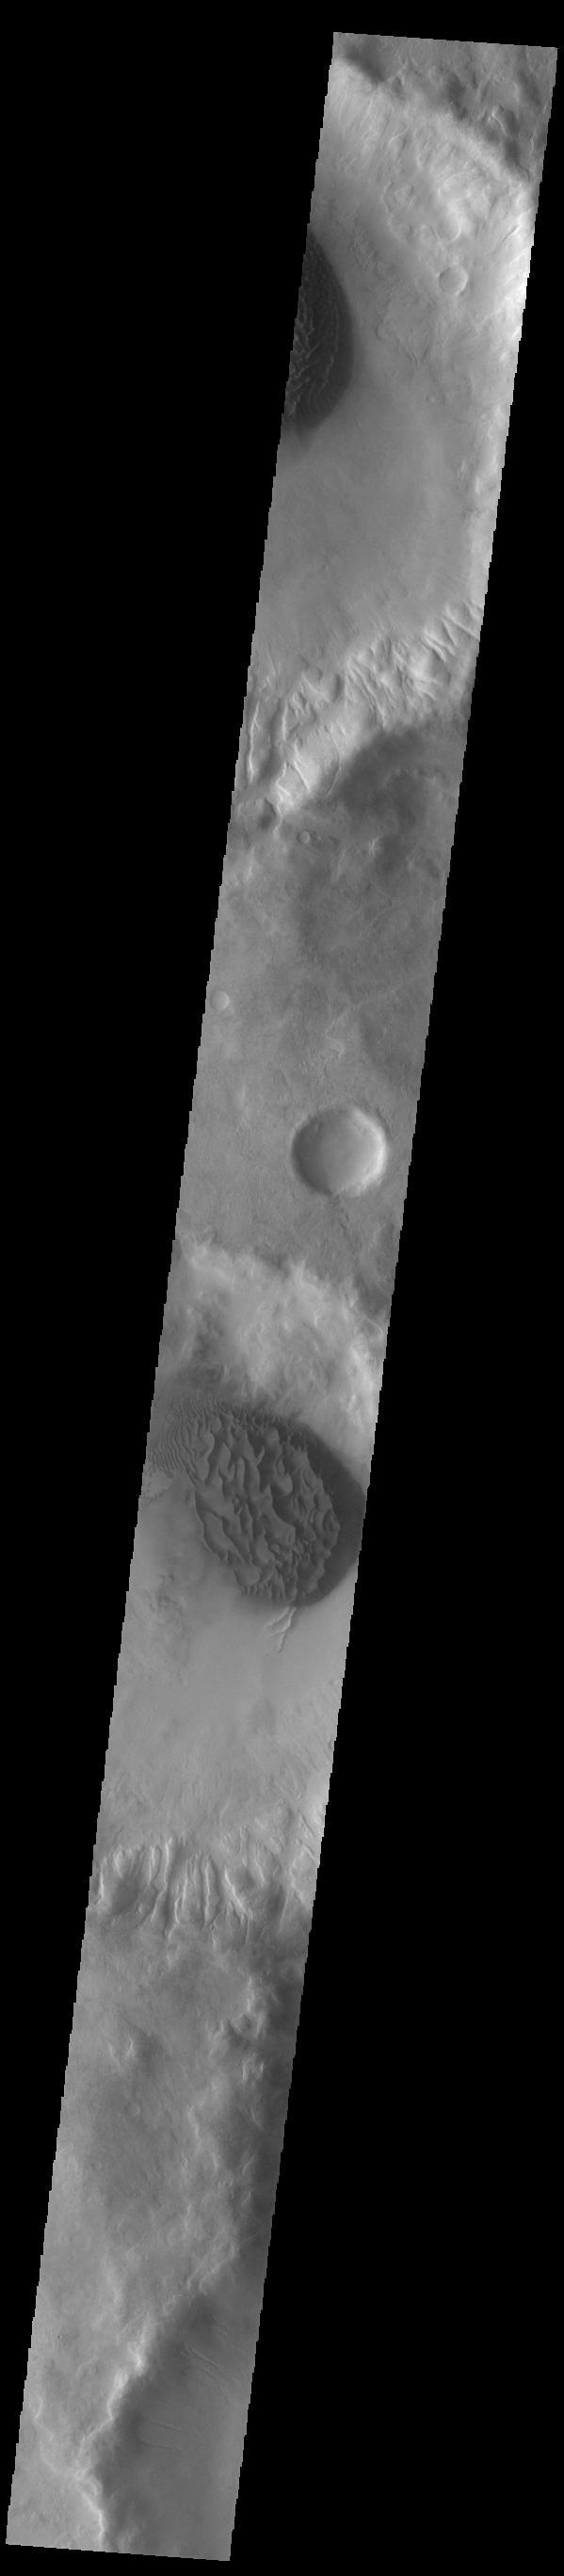
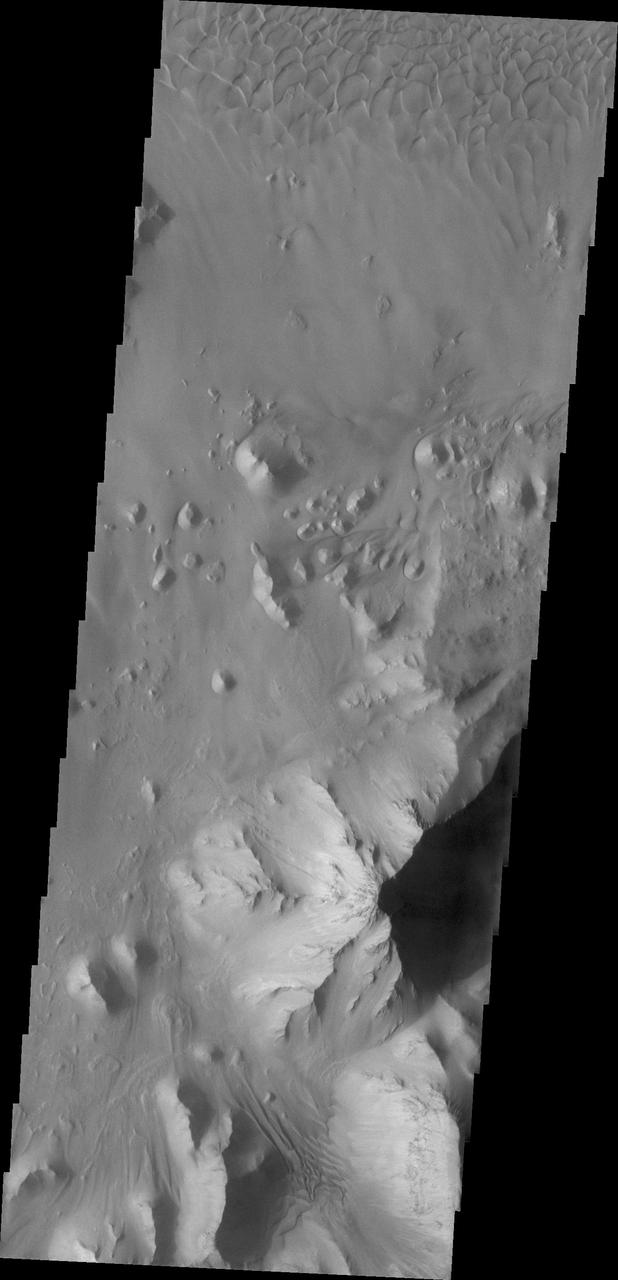
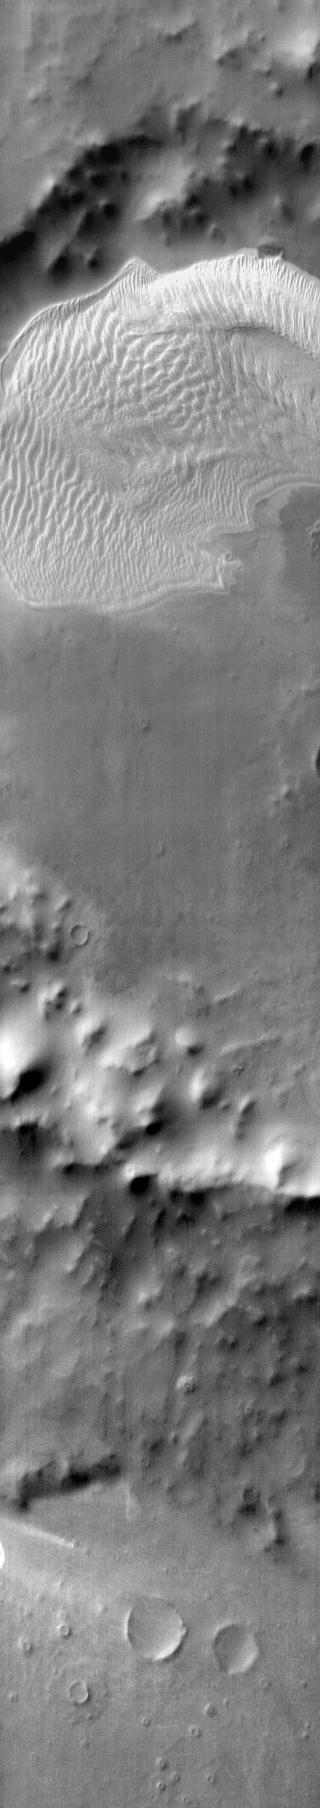
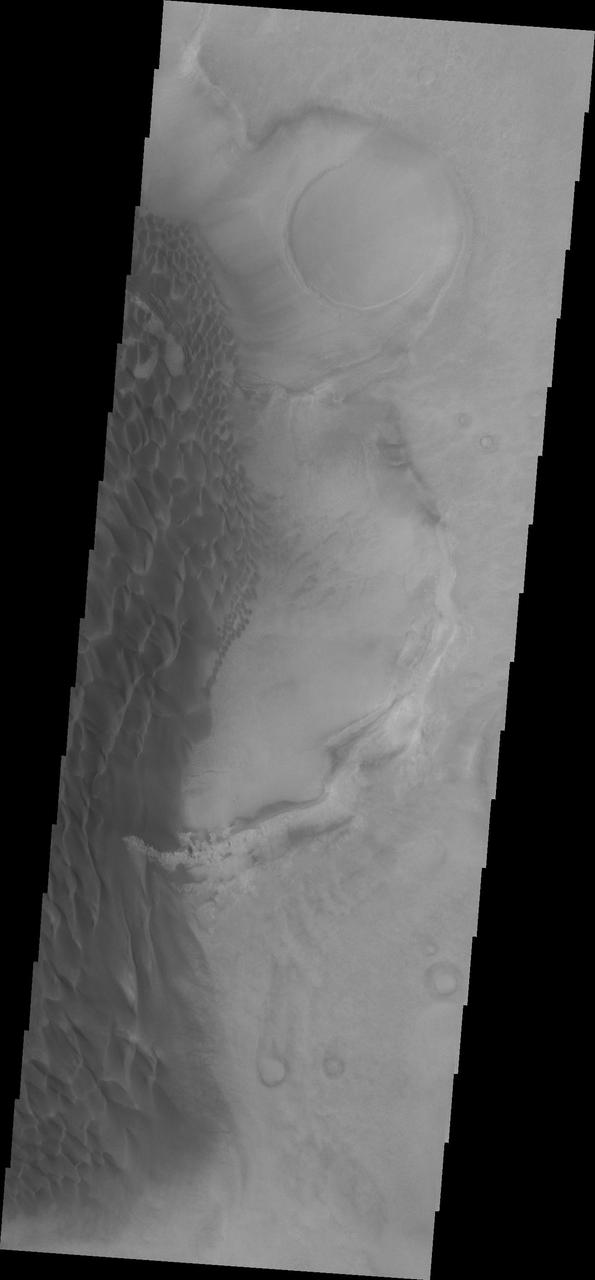
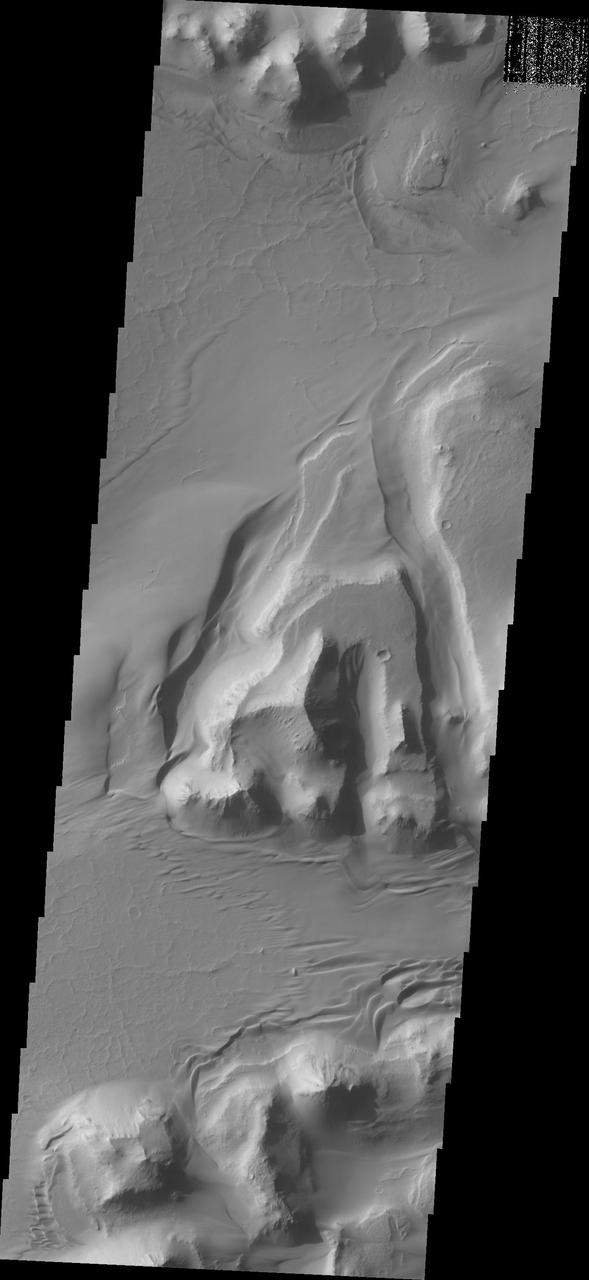
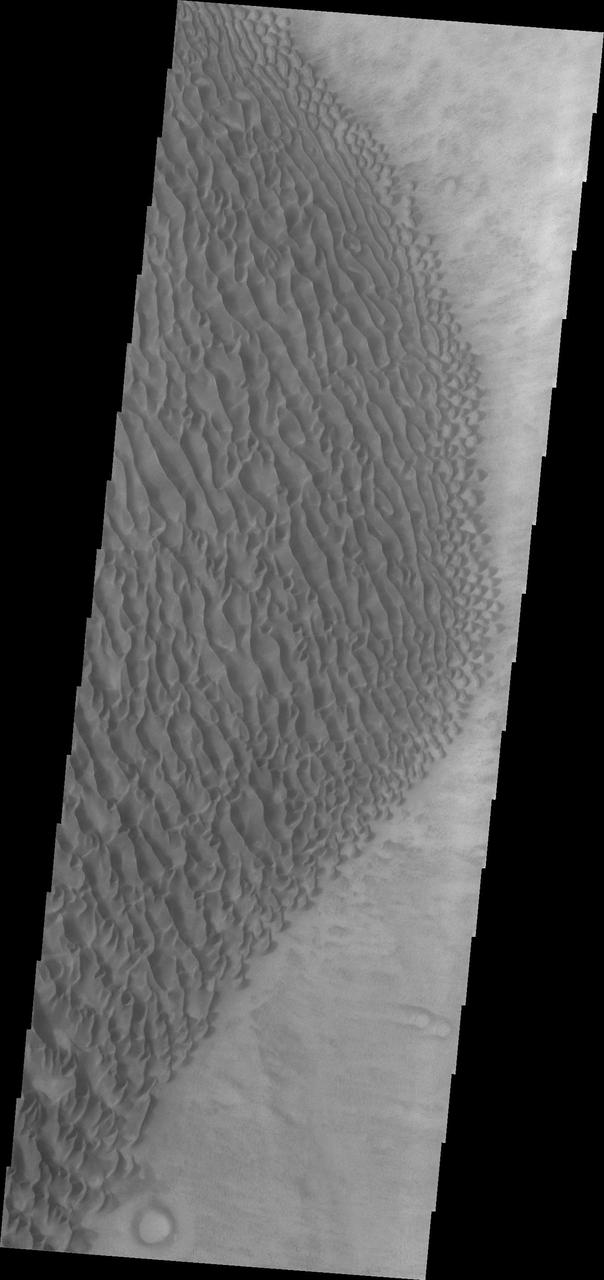
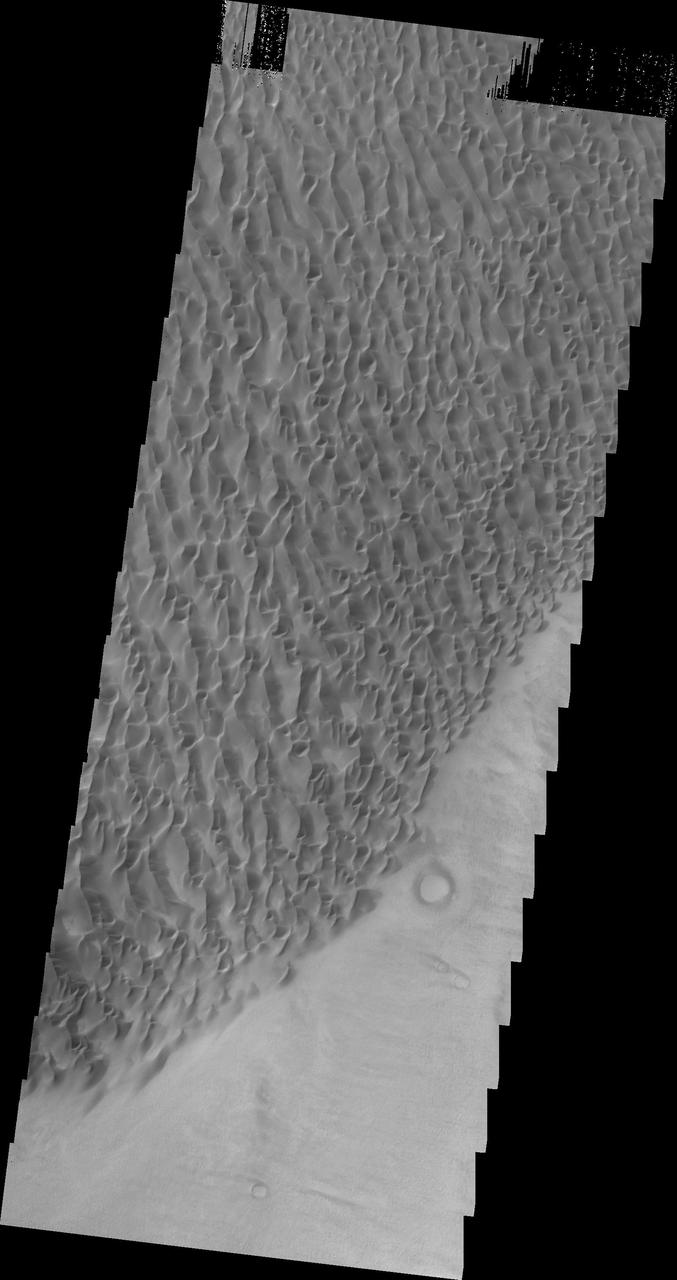
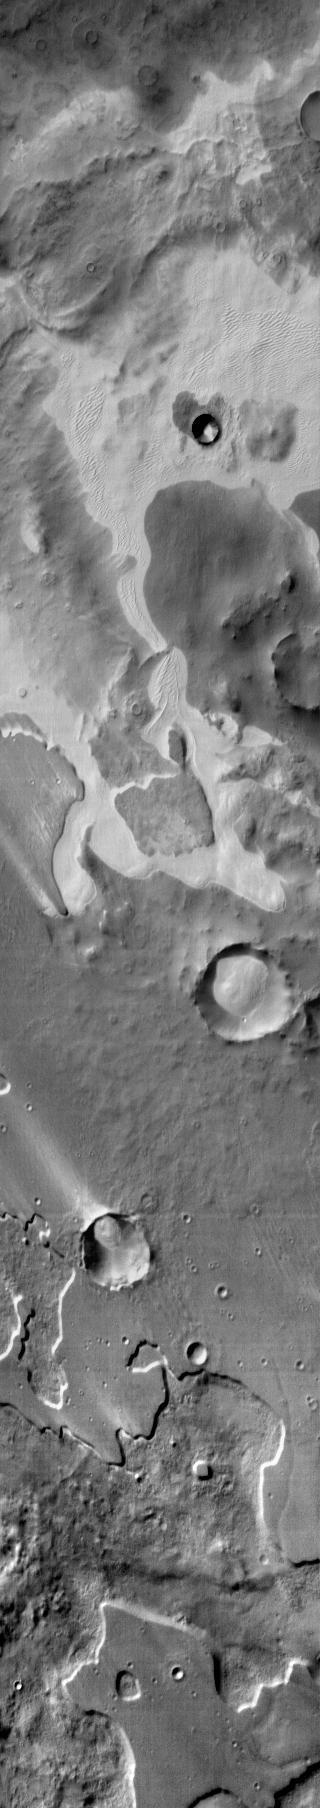
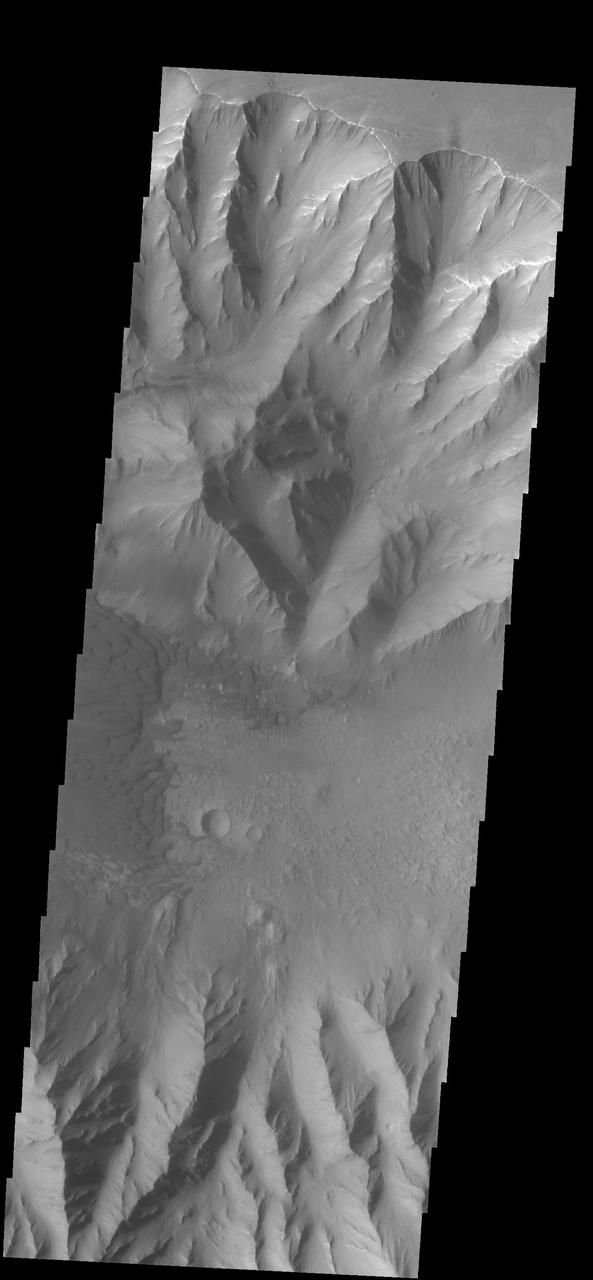
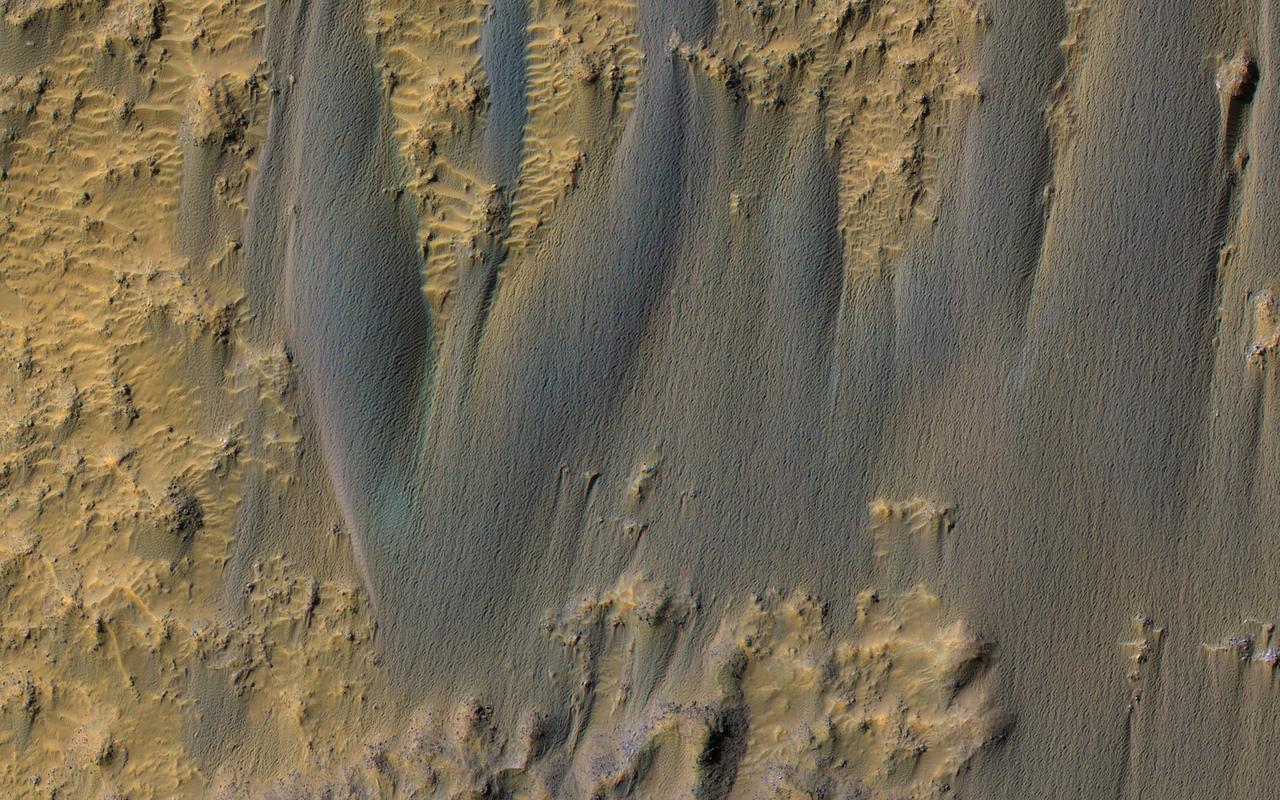
Sand Sheet and Dunes
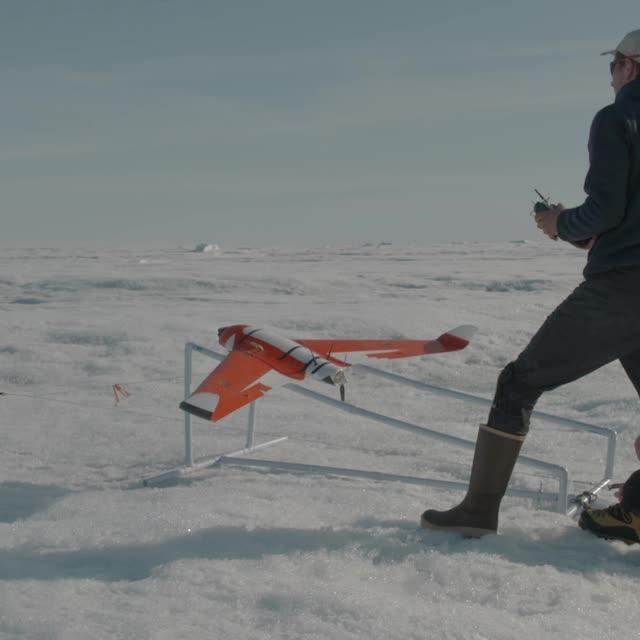
At 1 p.m. EDT (10 a.m. PDT) on Friday, Aug. 28, NASA's Goddard Space Flight Center in Greenbelt, Maryland, will host a live TV program about agency research into how and why the massive Greenland ice sheet is changing. The event features scientists actively conducting field work in Greenland, along with extensive video footage of their work performed over this summer. Panelists include: Tom Wagner (cryosphere program scientist with NASA's Earth Science Division), Laurence Smith (chair of the University of California, Los Angeles Department of Geography), Mike Bevis (professor of geodynamics at Ohio State University in Columbus), Sophie Nowicki (physical scientist at Goddard), and Josh Willis (JPL). The Friday program will air live on NASA TV and stream online at: <a href="http://www.nasa.gov/nasatv" rel="nofollow">www.nasa.gov/nasatv</a>. To ask questions via social media during the televised event, use the hashtag #askNASA. <b><a href="http://www.nasa.gov/audience/formedia/features/MP_Photo_Guidelines.html" rel="nofollow">NASA image use policy.</a></b> <b><a href="http://www.nasa.gov/centers/goddard/home/index.html" rel="nofollow">NASA Goddard Space Flight Center</a></b> enables NASA’s mission through four scientific endeavors: Earth Science, Heliophysics, Solar System Exploration, and Astrophysics. Goddard plays a leading role in NASA’s accomplishments by contributing compelling scientific knowledge to advance the Agency’s mission. <b>Follow us on <a href="http://twitter.com/NASAGoddardPix" rel="nofollow">Twitter</a></b> <b>Like us on <a href="http://www.facebook.com/pages/Greenbelt-MD/NASA-Goddard/395013845897?ref=tsd" rel="nofollow">Facebook</a></b> <b>Find us on <a href="http://instagrid.me/nasagoddard/?vm=grid" rel="nofollow">Instagram</a></b>
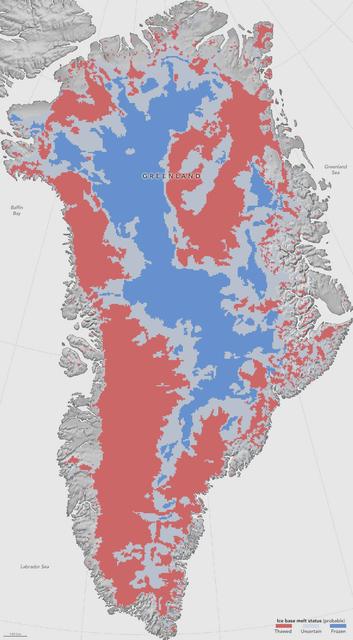
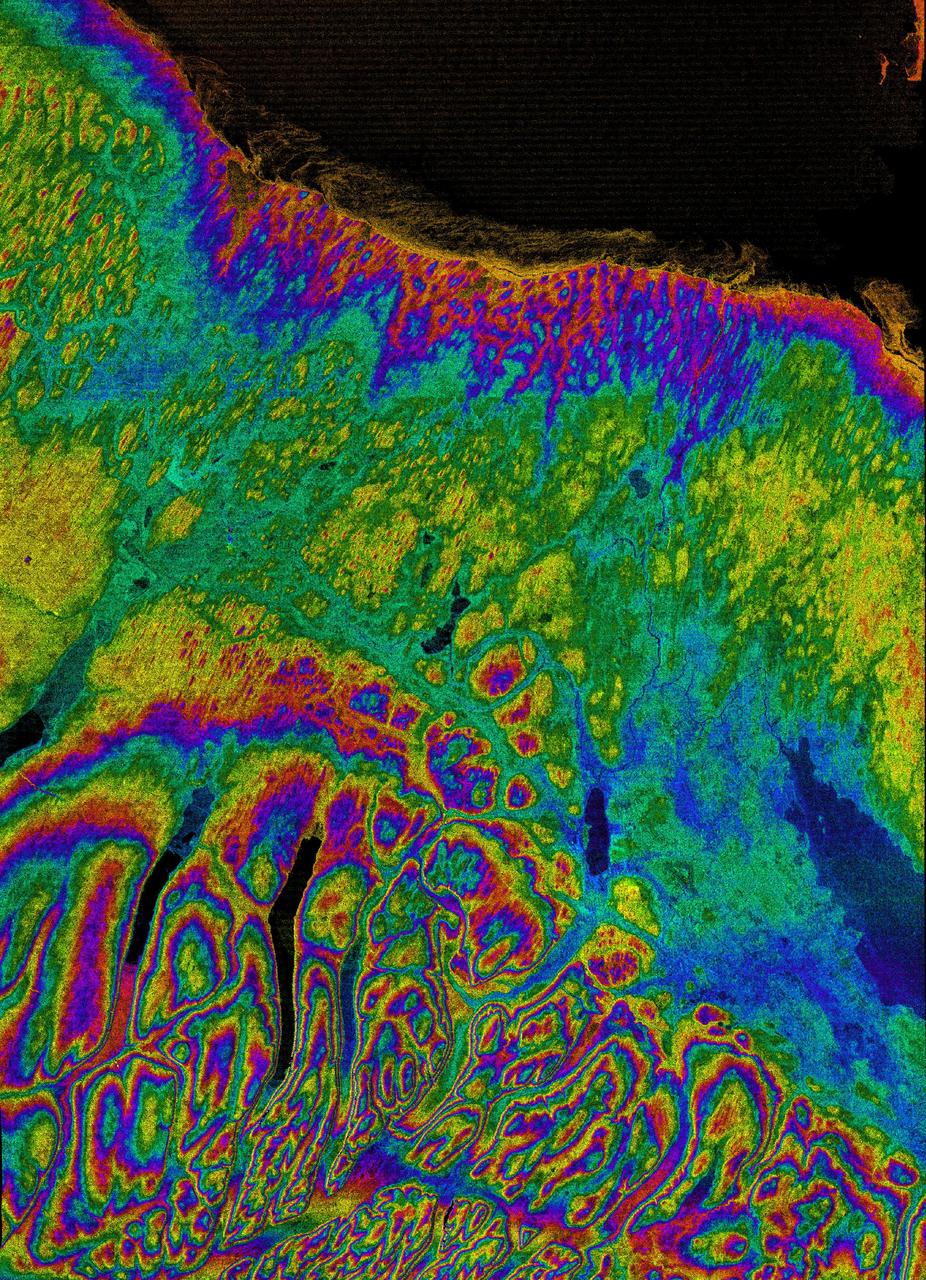
NASA researchers have helped produce the first map showing what parts of the bottom of the massive Greenland Ice Sheet are thawed – key information in better predicting how the ice sheet will react to a warming climate. Greenland’s thick ice sheet insulates the bedrock below from the cold temperatures at the surface, so the bottom of the ice is often tens of degrees warmer than at the top, because the ice bottom is slowly warmed by heat coming from the Earth’s depths. Knowing whether Greenland’s ice lies on wet, slippery ground or is anchored to dry, frozen bedrock is essential for predicting how this ice will flow in the future, But scientists have very few direct observations of the thermal conditions beneath the ice sheet, obtained through fewer than two dozen boreholes that have reached the bottom. Now, a new study synthesizes several methods to infer the Greenland Ice Sheet’s basal thermal state –whether the bottom of the ice is melted or not– leading to the first map that identifies frozen and thawed areas across the whole ice sheet. Map caption: This first-of-a-kind map, showing which parts of the bottom of the Greenland Ice Sheet are likely thawed (red), frozen (blue) or still uncertain (gray), will help scientists better predict how the ice will flow in a warming climate. Credit: NASA Earth Observatory/Jesse Allen Read more: <a href="http://go.nasa.gov/2avKgl2" rel="nofollow">go.nasa.gov/2avKgl2</a> <b><a href="http://www.nasa.gov/audience/formedia/features/MP_Photo_Guidelines.html" rel="nofollow">NASA image use policy.</a></b> <b><a href="http://www.nasa.gov/centers/goddard/home/index.html" rel="nofollow">NASA Goddard Space Flight Center</a></b> enables NASA’s mission through four scientific endeavors: Earth Science, Heliophysics, Solar System Exploration, and Astrophysics. Goddard plays a leading role in NASA’s accomplishments by contributing compelling scientific knowledge to advance the Agency’s mission. <b>Follow us on <a href="http://twitter.com/NASAGoddardPix" rel="nofollow">Twitter</a></b> <b>Like us on <a href="http://www.facebook.com/pages/Greenbelt-MD/NASA-Goddard/395013845897?ref=tsd" rel="nofollow">Facebook</a></b> <b>Find us on <a href="http://instagrid.me/nasagoddard/?vm=grid" rel="nofollow">Instagram</a></b>
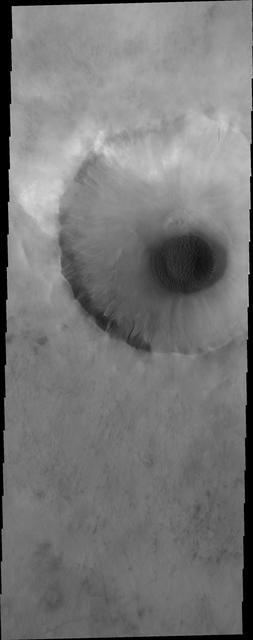
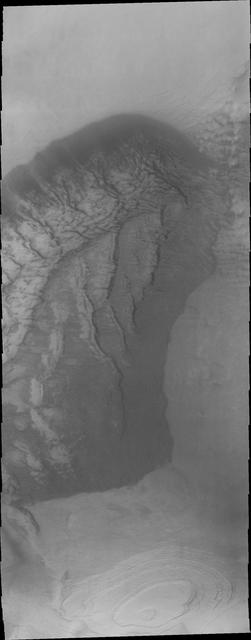
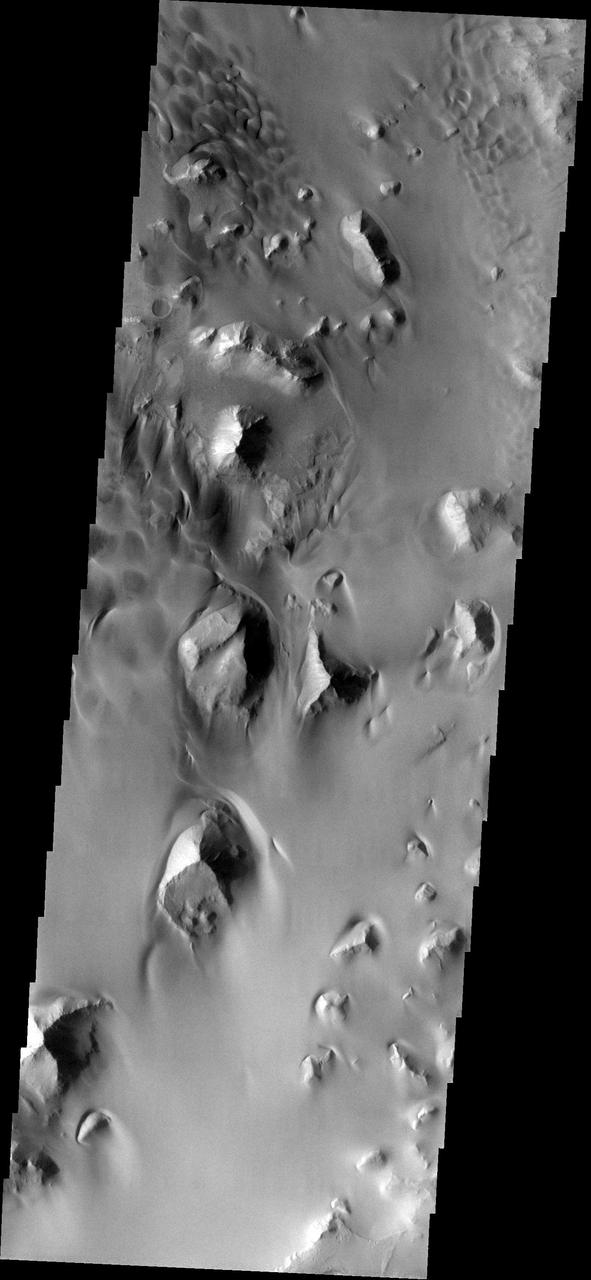
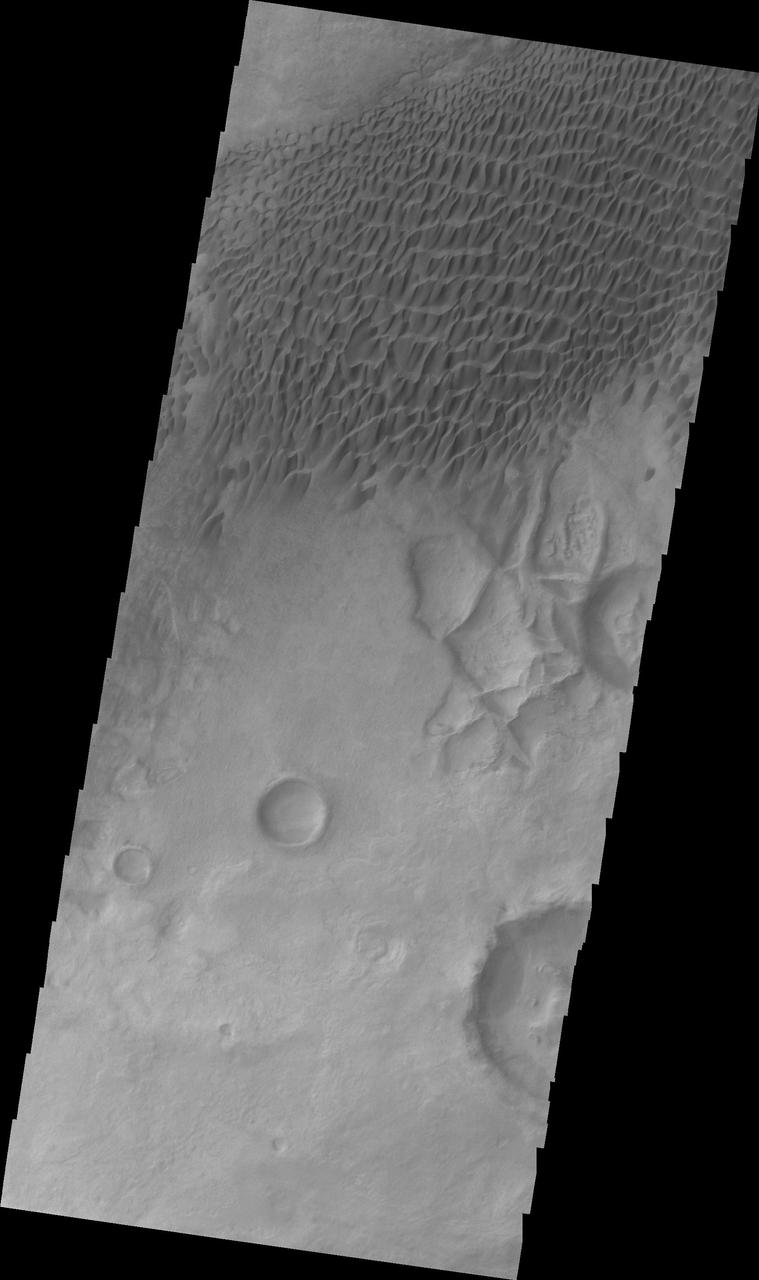
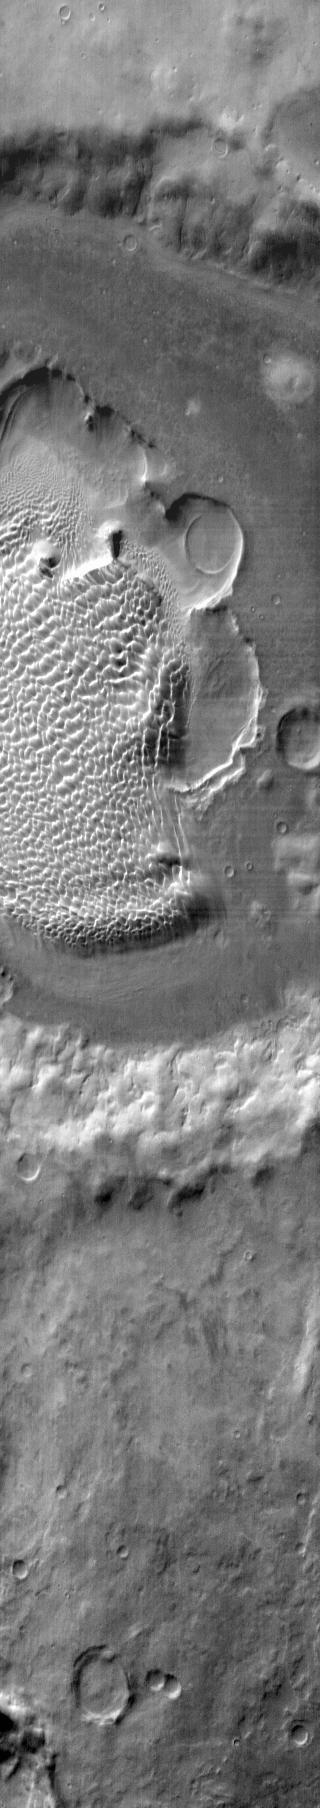
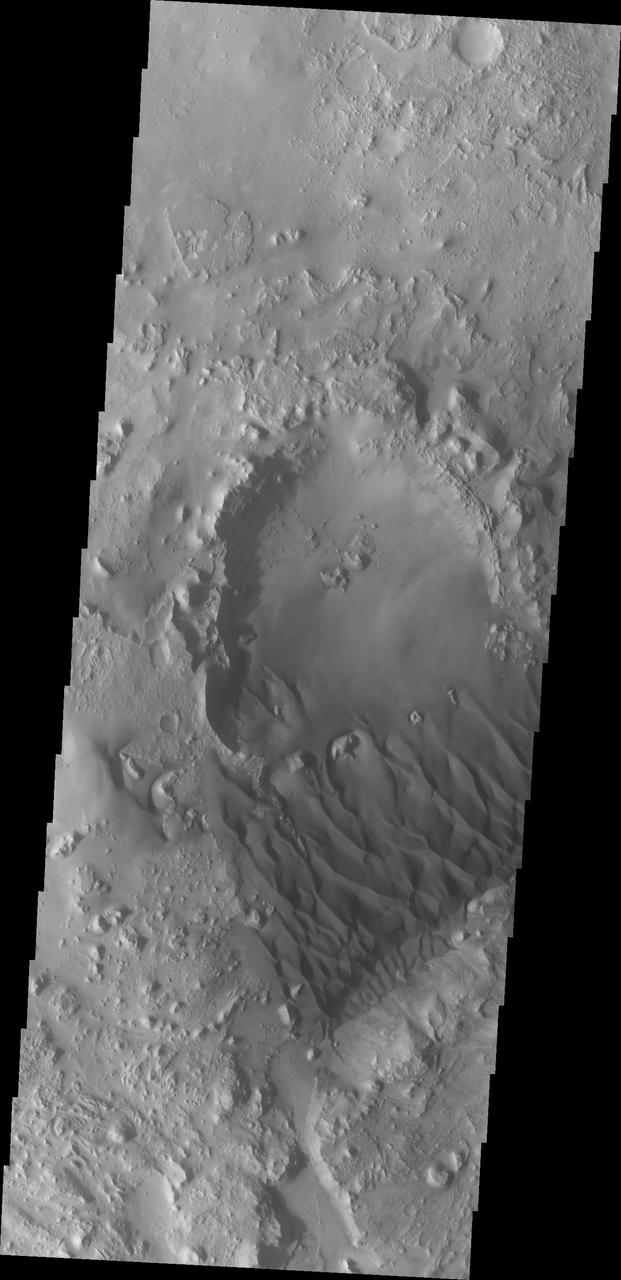
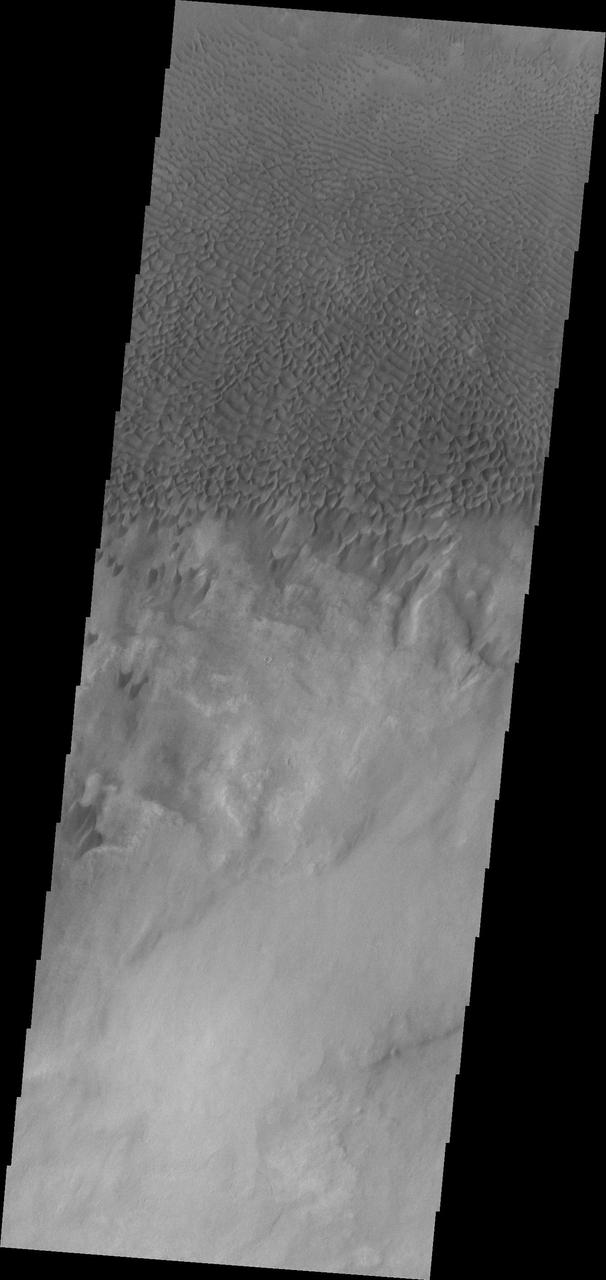
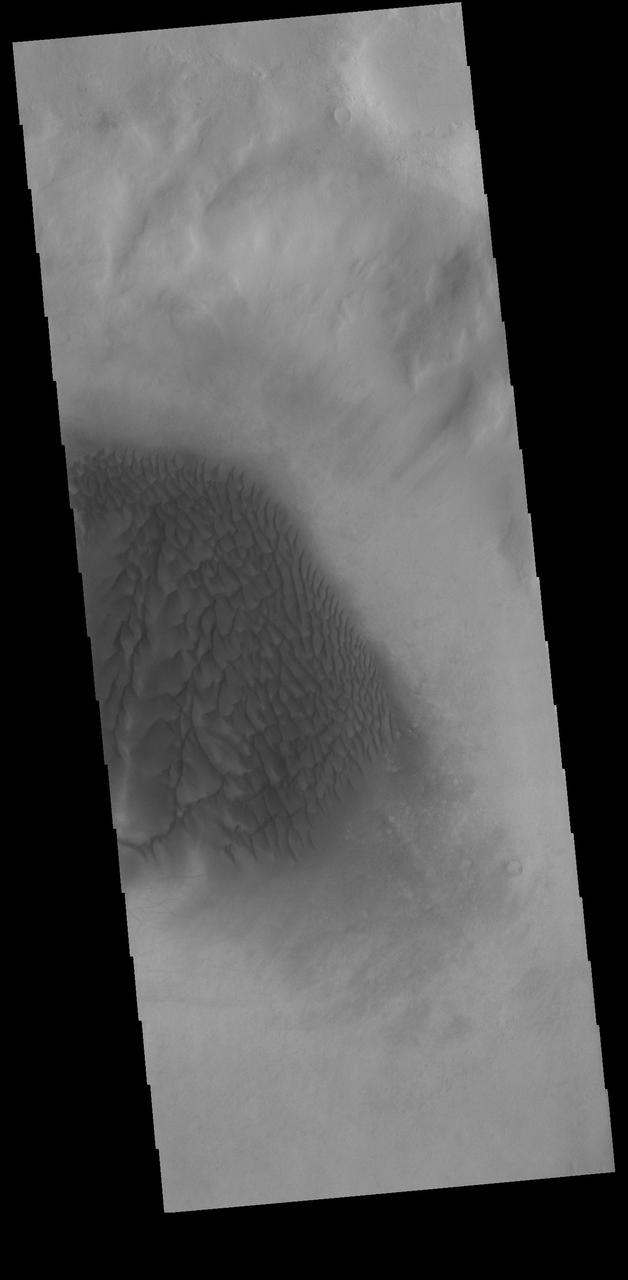
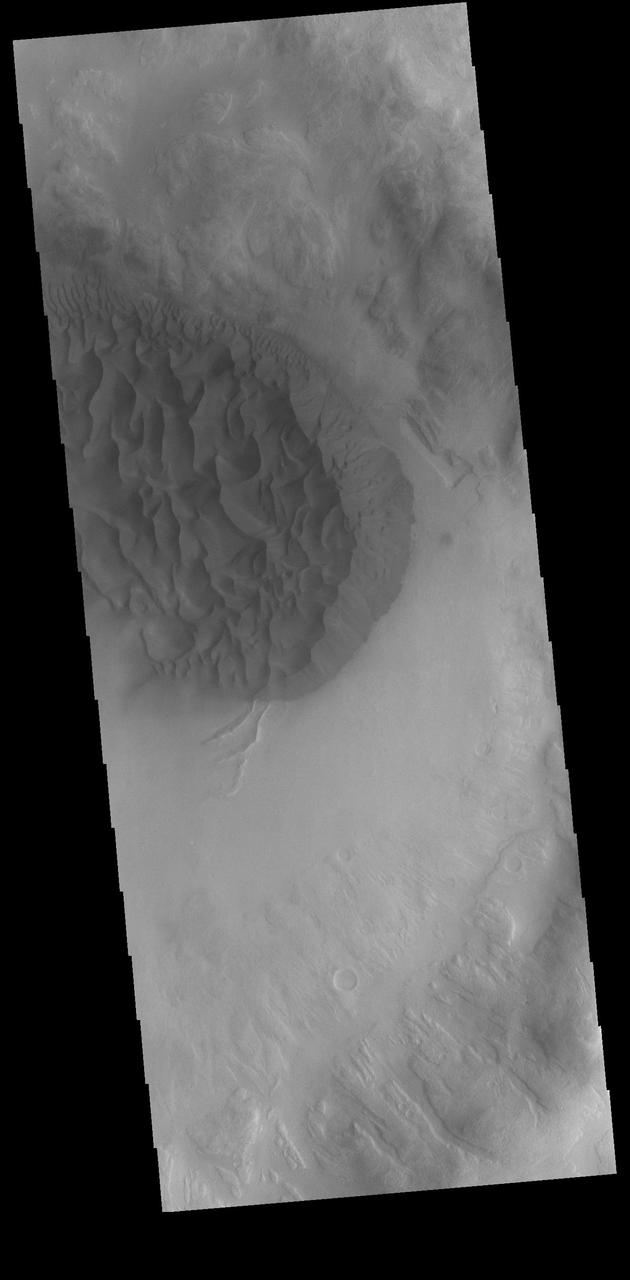
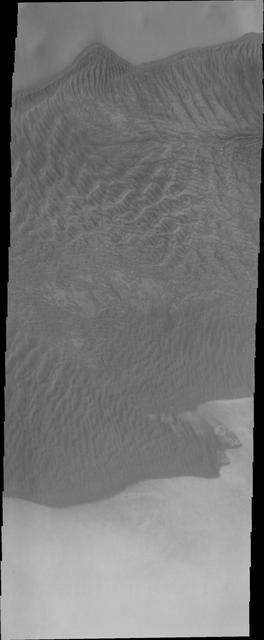
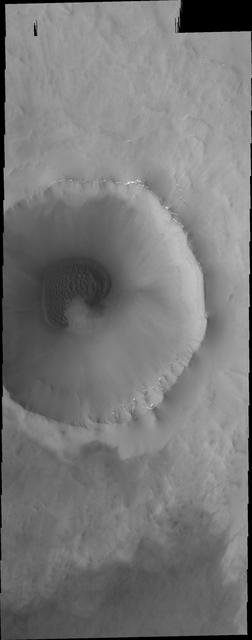
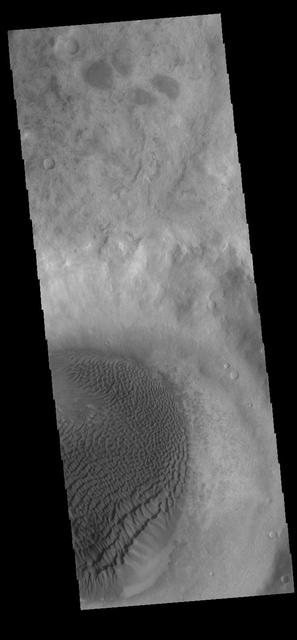
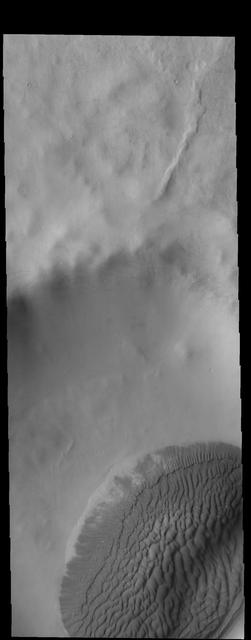
This image from NASA 2001 Mars Odyssey spacecraft shows the floor of this unnamed crater in the northern lowlands is partially filled by a sand sheet with surface dune forms.
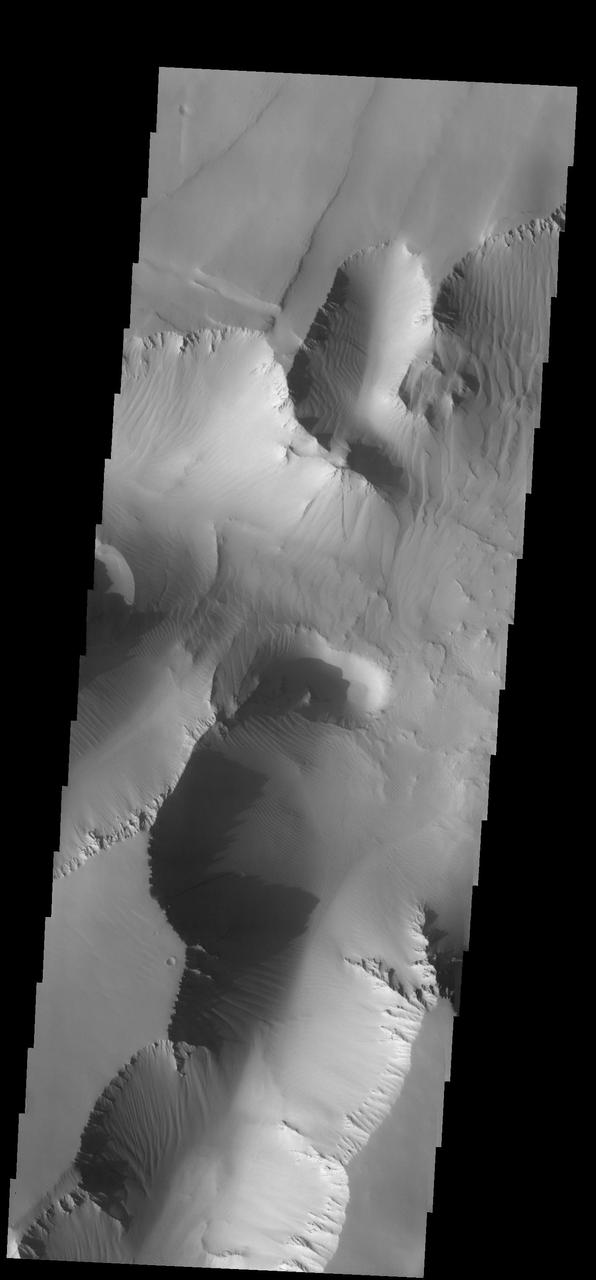
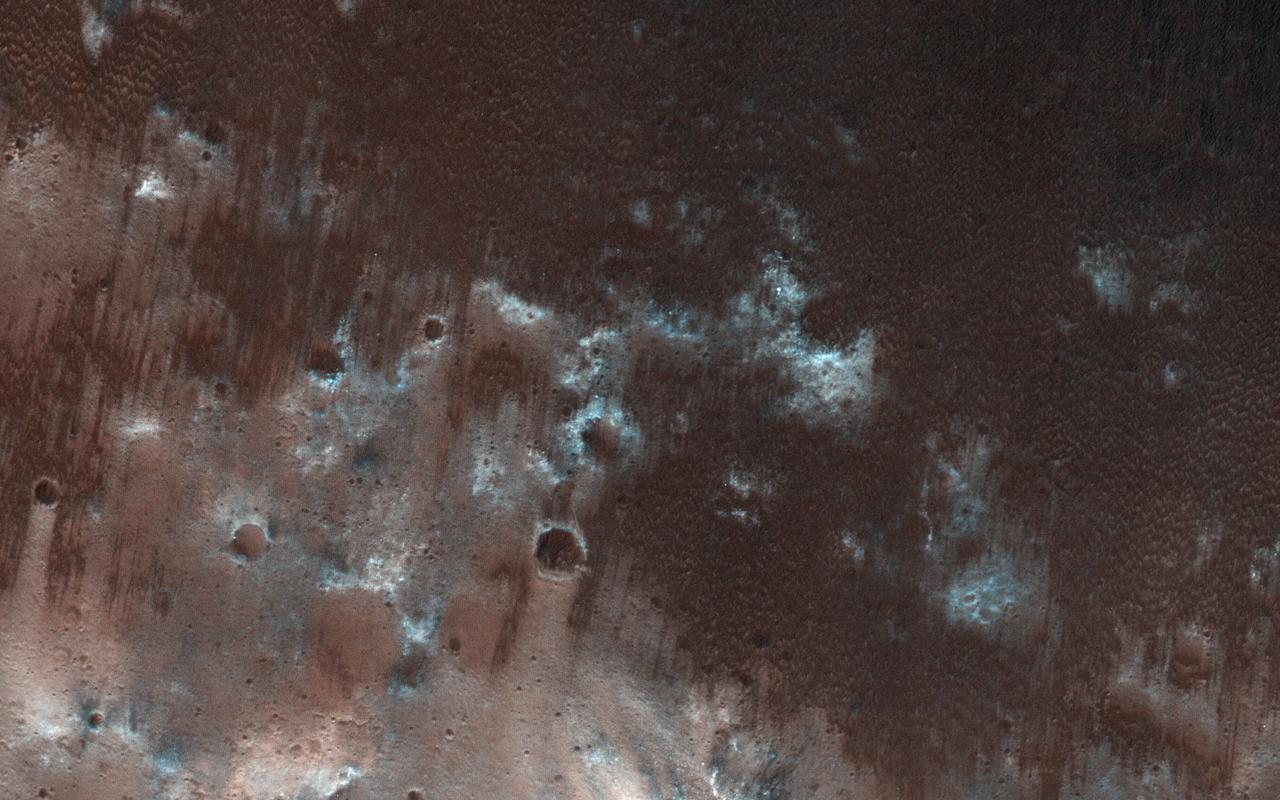
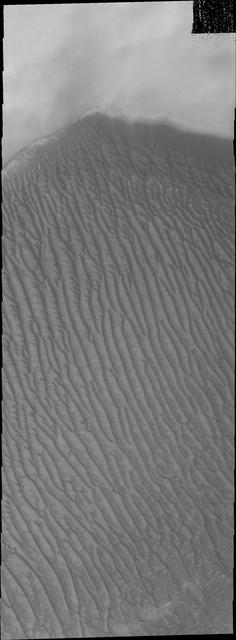
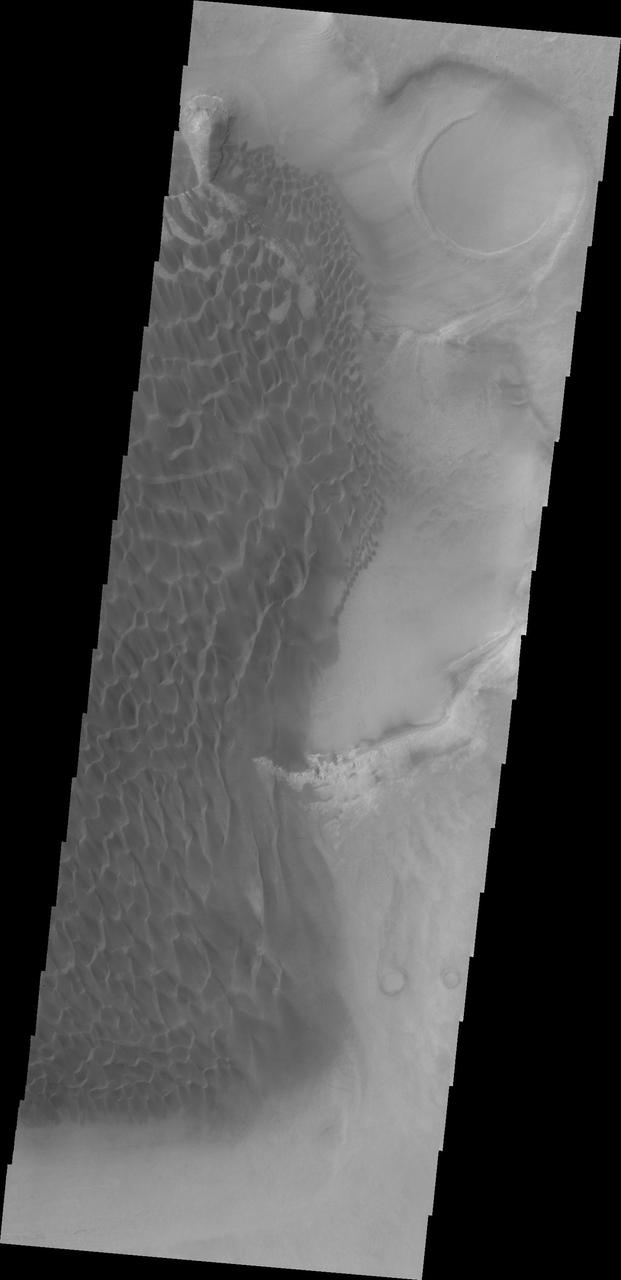
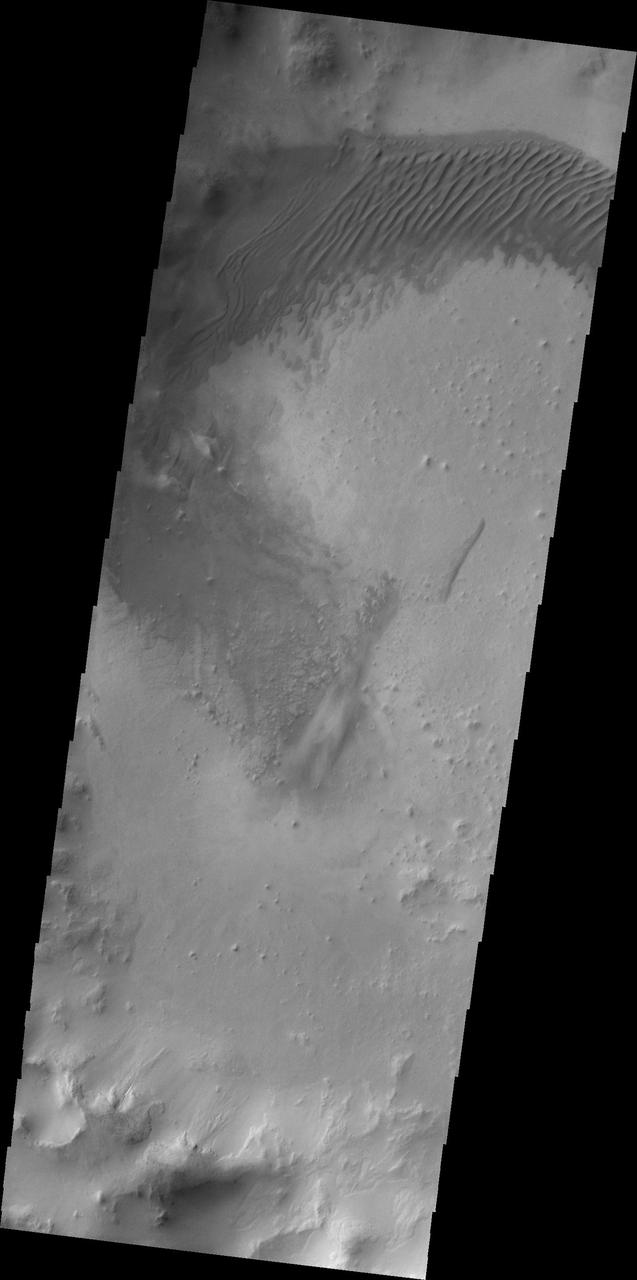
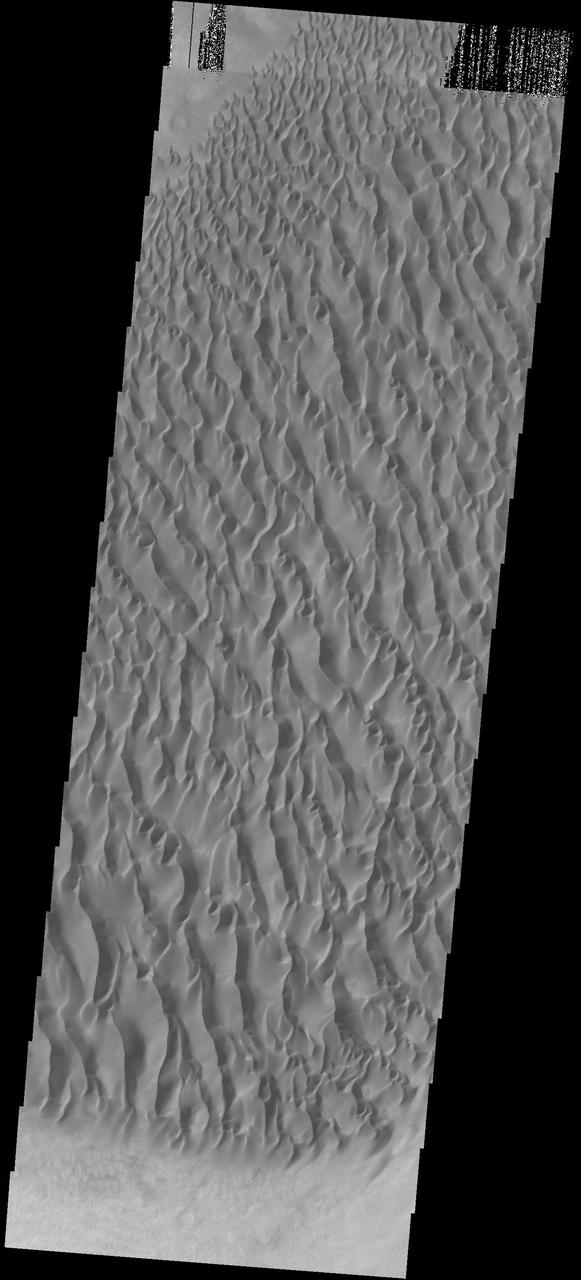
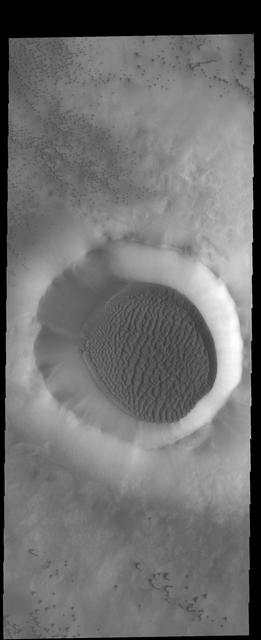
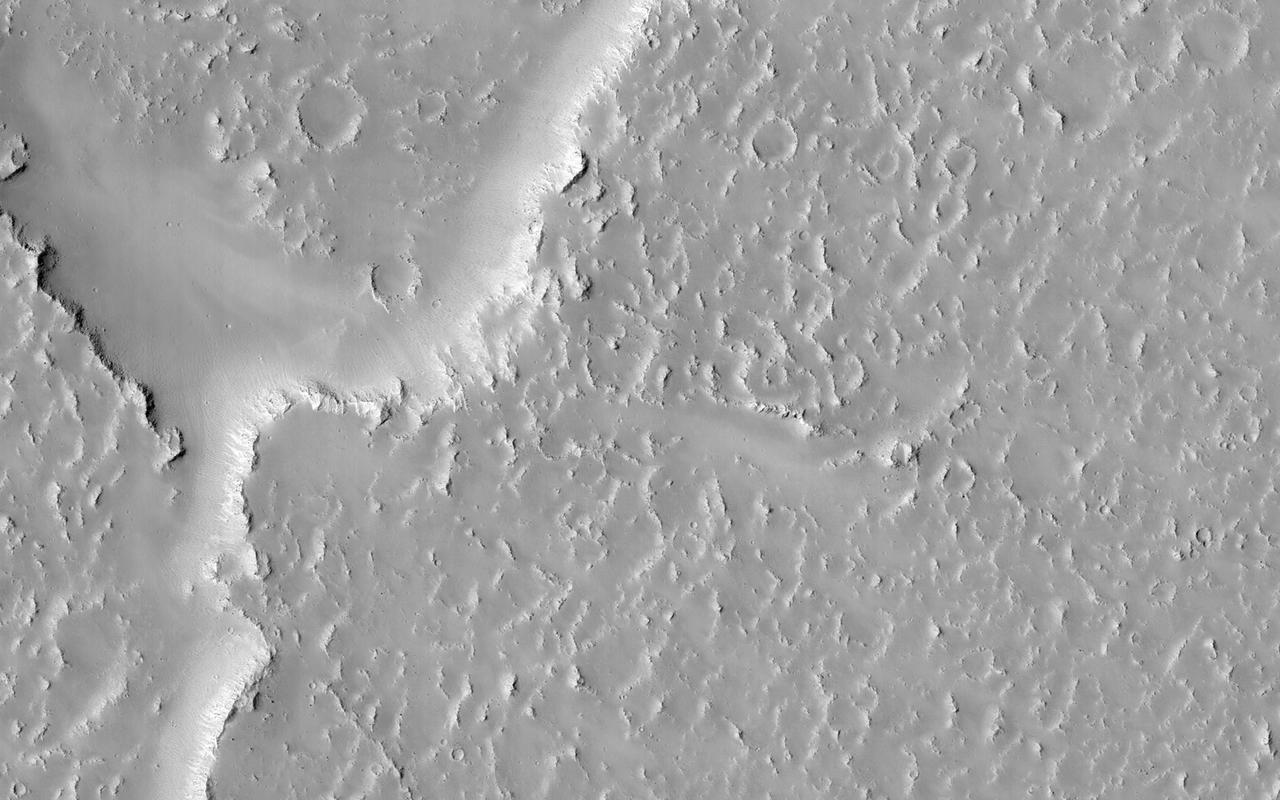
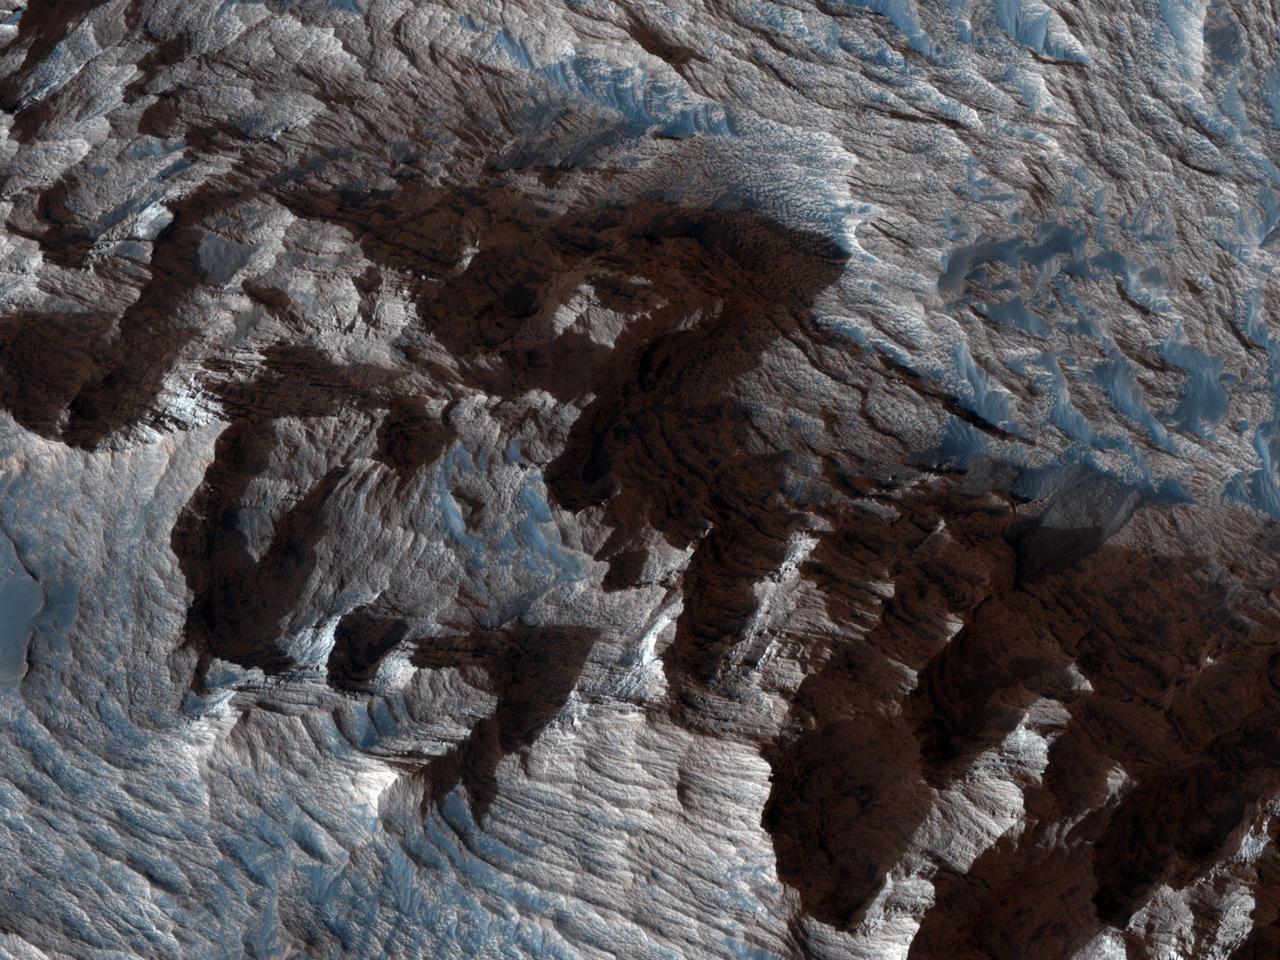
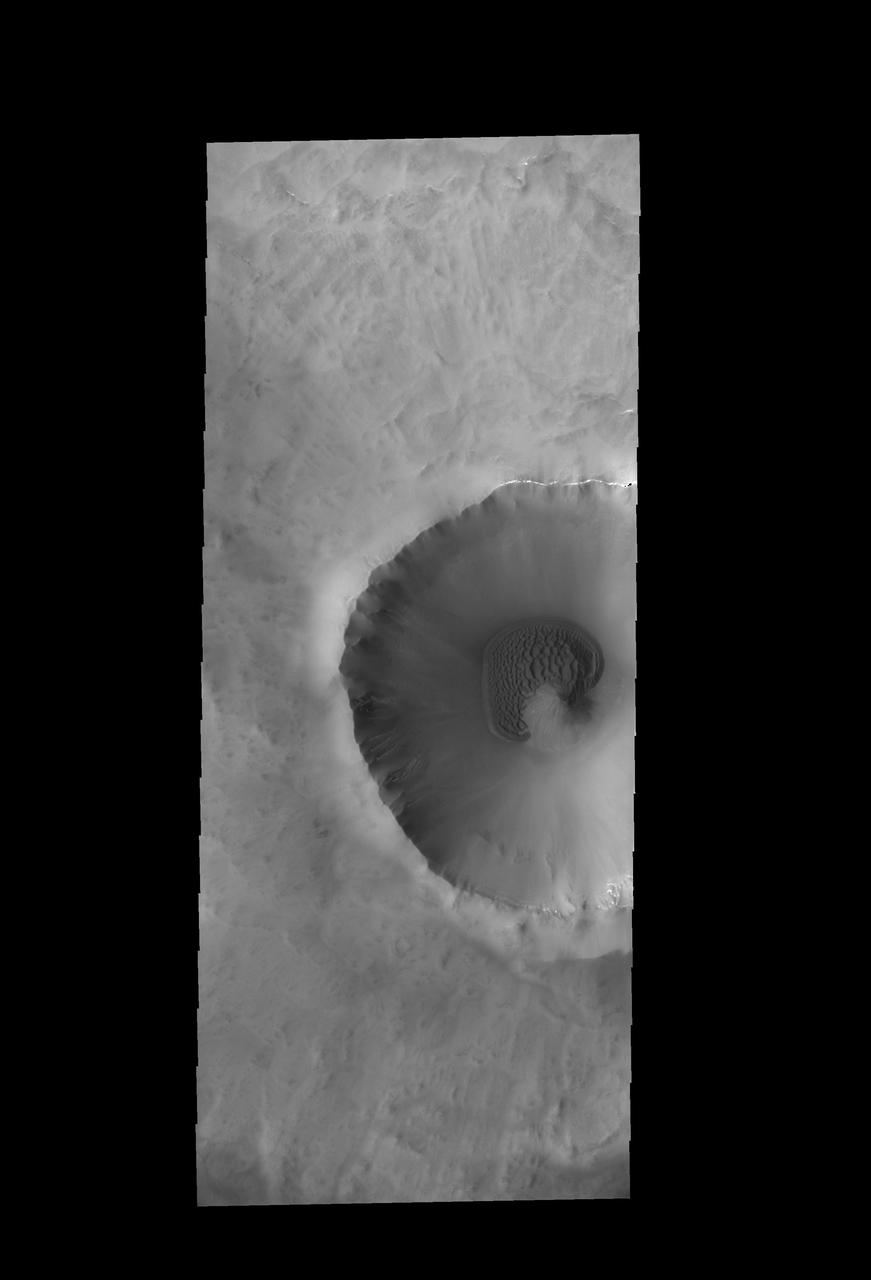
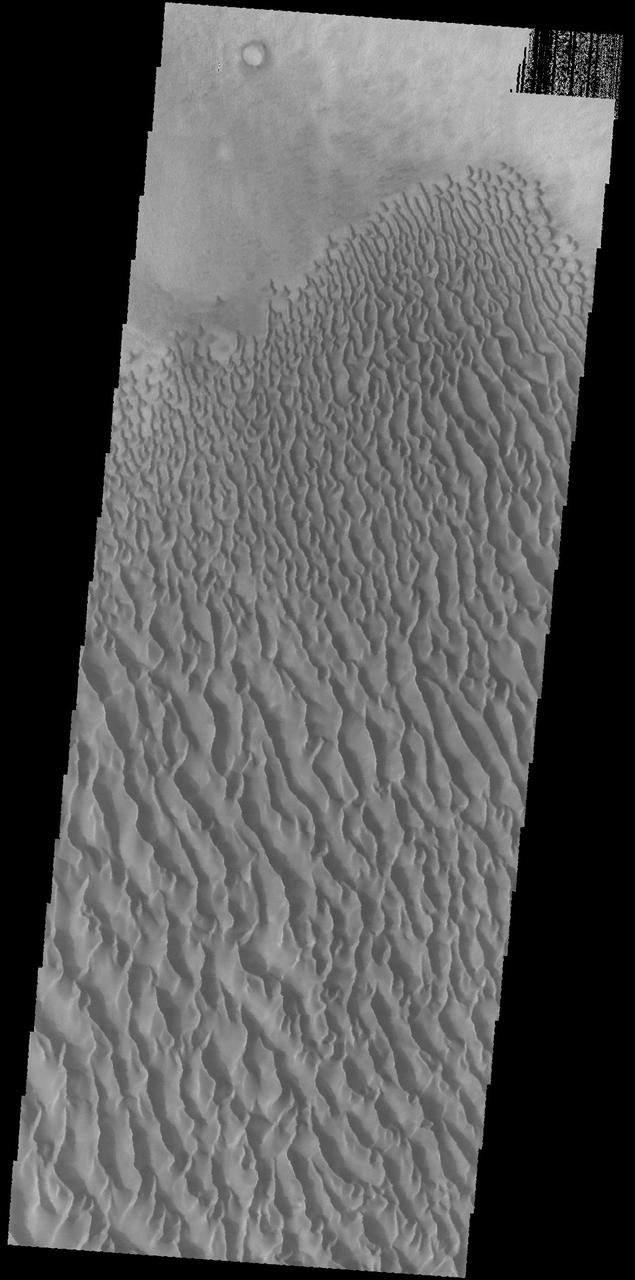
![NASA's Mars Reconnaissance Orbiter (MRO) captured this crater featuring sand dunes and sand sheets on its floor. What are sand sheets? Snow fall on Earth is a good example of sand sheets: when it snows, the ground gets blanketed with up to a few meters of snow. The snow mantles the ground and "mimics" the underlying topography. Sand sheets likewise mantle the ground as a relatively thin deposit. This kind of environment has been monitored by HiRISE since 2007 to look for movement in the ripples covering the dunes and sheets. This is how scientists who study wind-blown sand can track the amount of sand moving through the area and possibly where the sand came from. Using the present environment is crucial to understanding the past: sand dunes, sheets, and ripples sometimes become preserved as sandstone and contain clues as to how they were deposited The map is projected here at a scale of 25 centimeters (9.8 inches) per pixel. [The original image scale is 25 centimeters (9.8 inches) per pixel (with 1 x 1 binning); objects on the order of 75 centimeters (29.5 inches) across are resolved.] North is up. https://photojournal.jpl.nasa.gov/catalog/PIA21757](https://images-assets.nasa.gov/image/PIA21757/PIA21757~medium.jpg)
NASA's Mars Reconnaissance Orbiter (MRO) captured this crater featuring sand dunes and sand sheets on its floor. What are sand sheets? Snow fall on Earth is a good example of sand sheets: when it snows, the ground gets blanketed with up to a few meters of snow. The snow mantles the ground and "mimics" the underlying topography. Sand sheets likewise mantle the ground as a relatively thin deposit. This kind of environment has been monitored by HiRISE since 2007 to look for movement in the ripples covering the dunes and sheets. This is how scientists who study wind-blown sand can track the amount of sand moving through the area and possibly where the sand came from. Using the present environment is crucial to understanding the past: sand dunes, sheets, and ripples sometimes become preserved as sandstone and contain clues as to how they were deposited The map is projected here at a scale of 25 centimeters (9.8 inches) per pixel. [The original image scale is 25 centimeters (9.8 inches) per pixel (with 1 x 1 binning); objects on the order of 75 centimeters (29.5 inches) across are resolved.] North is up. https://photojournal.jpl.nasa.gov/catalog/PIA21757
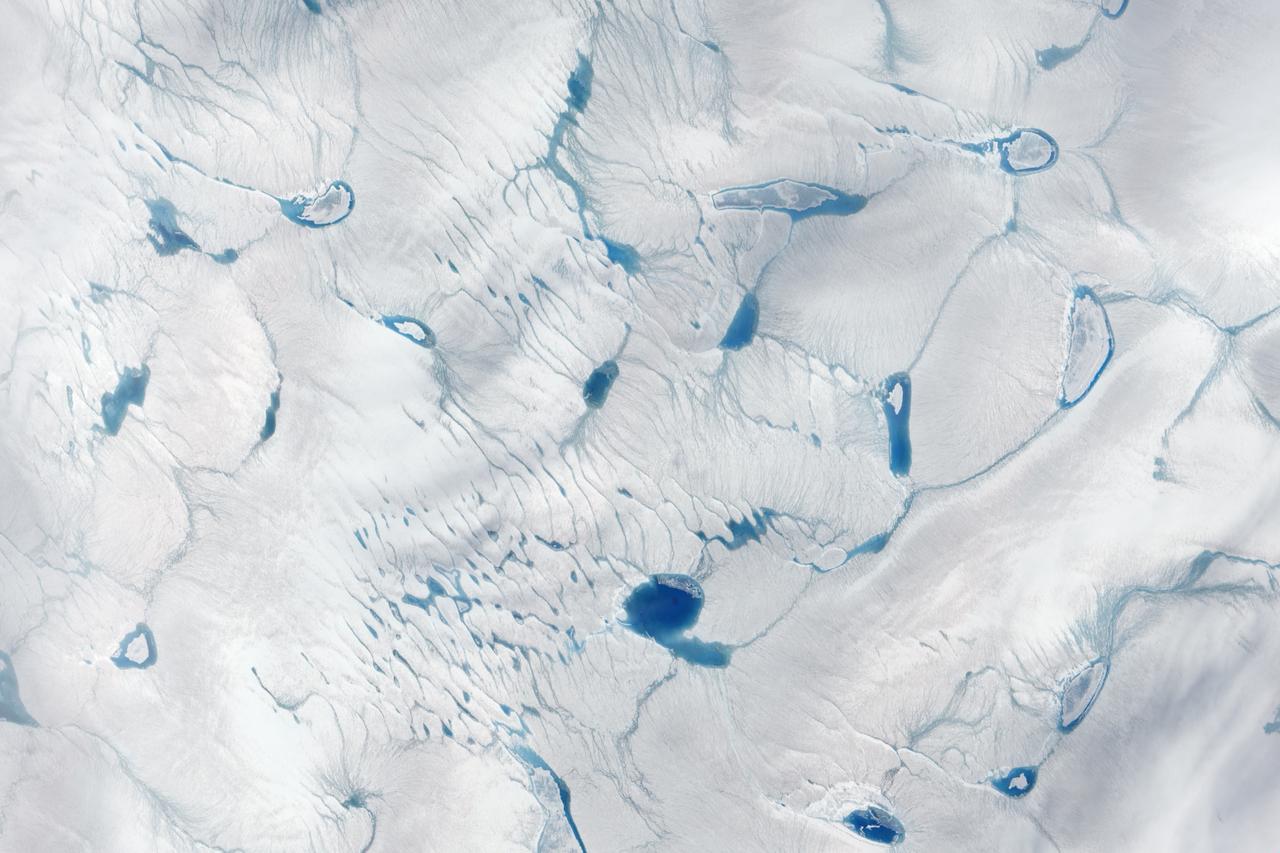
On June 15, 2016, the Advanced Land Imager (ALI) on NASA’s Earth Observing-1 satellite acquired a natural-color image of an area just inland from the coast of southwestern Greenland (120 kilometers southeast of Ilulisat and 500 kilometers north-northeast of Nuuk). According to Marco Tedesco, a professor at Columbia University’s Lamont Doherty Earth Observatory, melting in this area began relatively early in April but was not sustained. It started up again in May and grew into the watery June scene pictured above. Surface melt can directly contribute to sea level rise via runoff. It can also force its way through crevasses to the base of a glacier, temporarily speeding up ice flow and indirectly contributing to sea level rise. Also, ponding of meltwater can “darken” the ice sheet’s surface and lead to further melting. Read more: <a href="https://earthobservatory.nasa.gov/IOTD/view.php?id=88288" rel="nofollow">earthobservatory.nasa.gov/IOTD/view.php?id=88288</a> Credit: NASA Earth Observatory image by Jesse Allen, using EO-1 ALI data provided courtesy of the NASA EO-1 team <b><a href="http://www.nasa.gov/audience/formedia/features/MP_Photo_Guidelines.html" rel="nofollow">NASA image use policy.</a></b> <b><a href="http://www.nasa.gov/centers/goddard/home/index.html" rel="nofollow">NASA Goddard Space Flight Center</a></b> enables NASA’s mission through four scientific endeavors: Earth Science, Heliophysics, Solar System Exploration, and Astrophysics. Goddard plays a leading role in NASA’s accomplishments by contributing compelling scientific knowledge to advance the Agency’s mission. <b>Follow us on <a href="http://twitter.com/NASAGoddardPix" rel="nofollow">Twitter</a></b> <b>Like us on <a href="http://www.facebook.com/pages/Greenbelt-MD/NASA-Goddard/395013845897?ref=tsd" rel="nofollow">Facebook</a></b> <b>Find us on <a href="http://instagrid.me/nasagoddard/?vm=grid" rel="nofollow">Instagram</a></b>
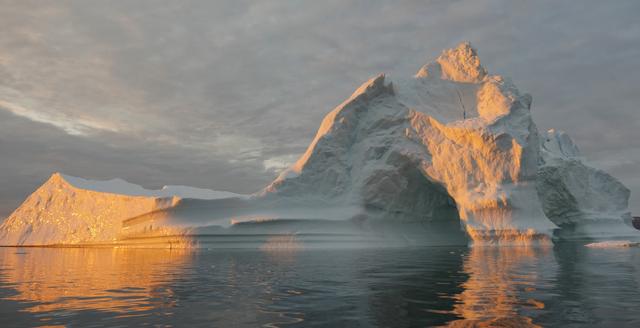
Sea level rise is a natural consequence of the warming of our planet. We know this from basic physics. When water heats up, it expands. So when the ocean warms, sea level rises. When ice is exposed to heat, it melts. And when ice on land melts and water runs into the ocean, sea level rises. For thousands of years, sea level has remained relatively stable and human communities have settled along the planet’s coastlines. But now Earth’s seas are rising. Globally, sea level has risen about eight inches since the beginning of the 20th century and more than two inches in the last 20 years alone. All signs suggest that this rise is accelerating. Read more: <a href="http://go.nasa.gov/1heZn29" rel="nofollow">go.nasa.gov/1heZn29</a> Caption: An iceberg floats in Disko Bay, near Ilulissat, Greenland, on July 24, 2015. The massive Greenland ice sheet is shedding about 300 gigatons of ice a year into the ocean, making it the single largest source of sea level rise from melting ice. Credits: NASA/Saskia Madlener <b><a href="http://www.nasa.gov/audience/formedia/features/MP_Photo_Guidelines.html" rel="nofollow">NASA image use policy.</a></b> <b><a href="http://www.nasa.gov/centers/goddard/home/index.html" rel="nofollow">NASA Goddard Space Flight Center</a></b> enables NASA’s mission through four scientific endeavors: Earth Science, Heliophysics, Solar System Exploration, and Astrophysics. Goddard plays a leading role in NASA’s accomplishments by contributing compelling scientific knowledge to advance the Agency’s mission. <b>Follow us on <a href="http://twitter.com/NASAGoddardPix" rel="nofollow">Twitter</a></b> <b>Like us on <a href="http://www.facebook.com/pages/Greenbelt-MD/NASA-Goddard/395013845897?ref=tsd" rel="nofollow">Facebook</a></b> <b>Find us on <a href="http://instagrid.me/nasagoddard/?vm=grid" rel="nofollow">Instagram</a></b>

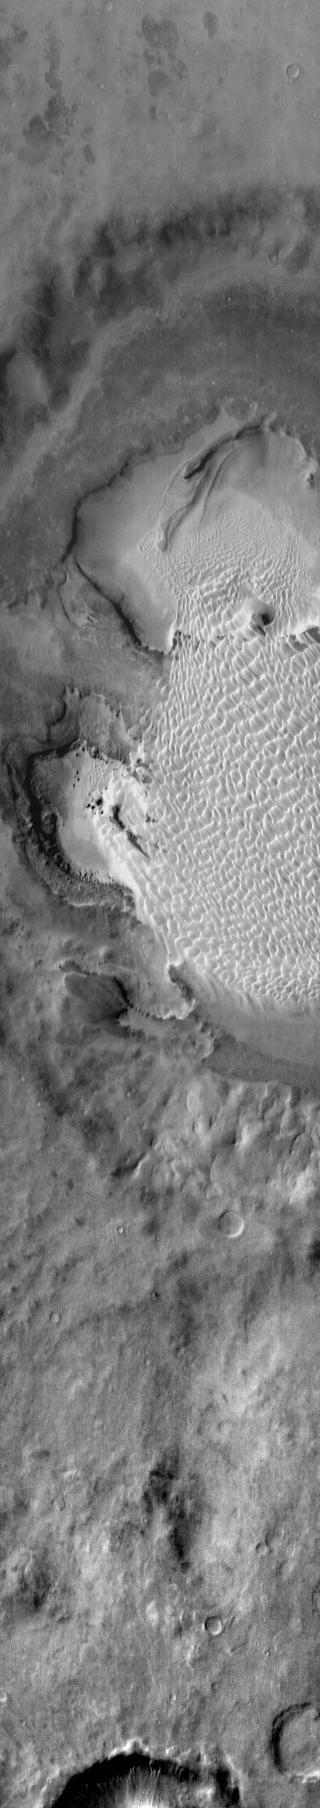
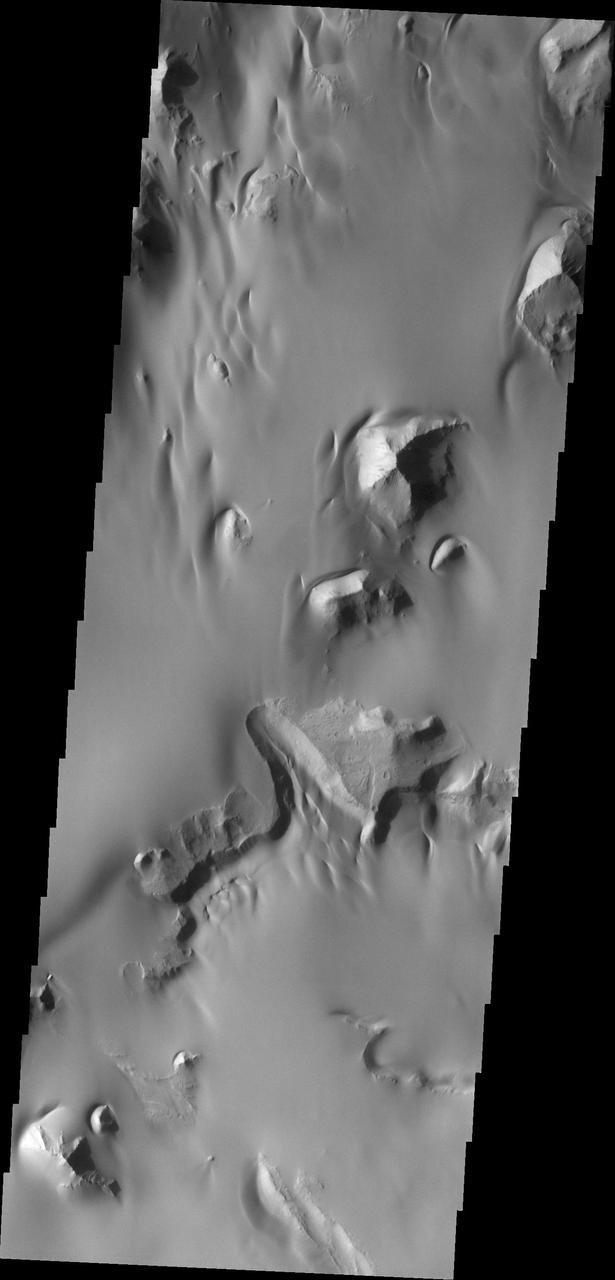
This daytime 2001 Mars Odyssey image of Promethei Terra shows bright dune sheets on the floor of two unnamed craters.
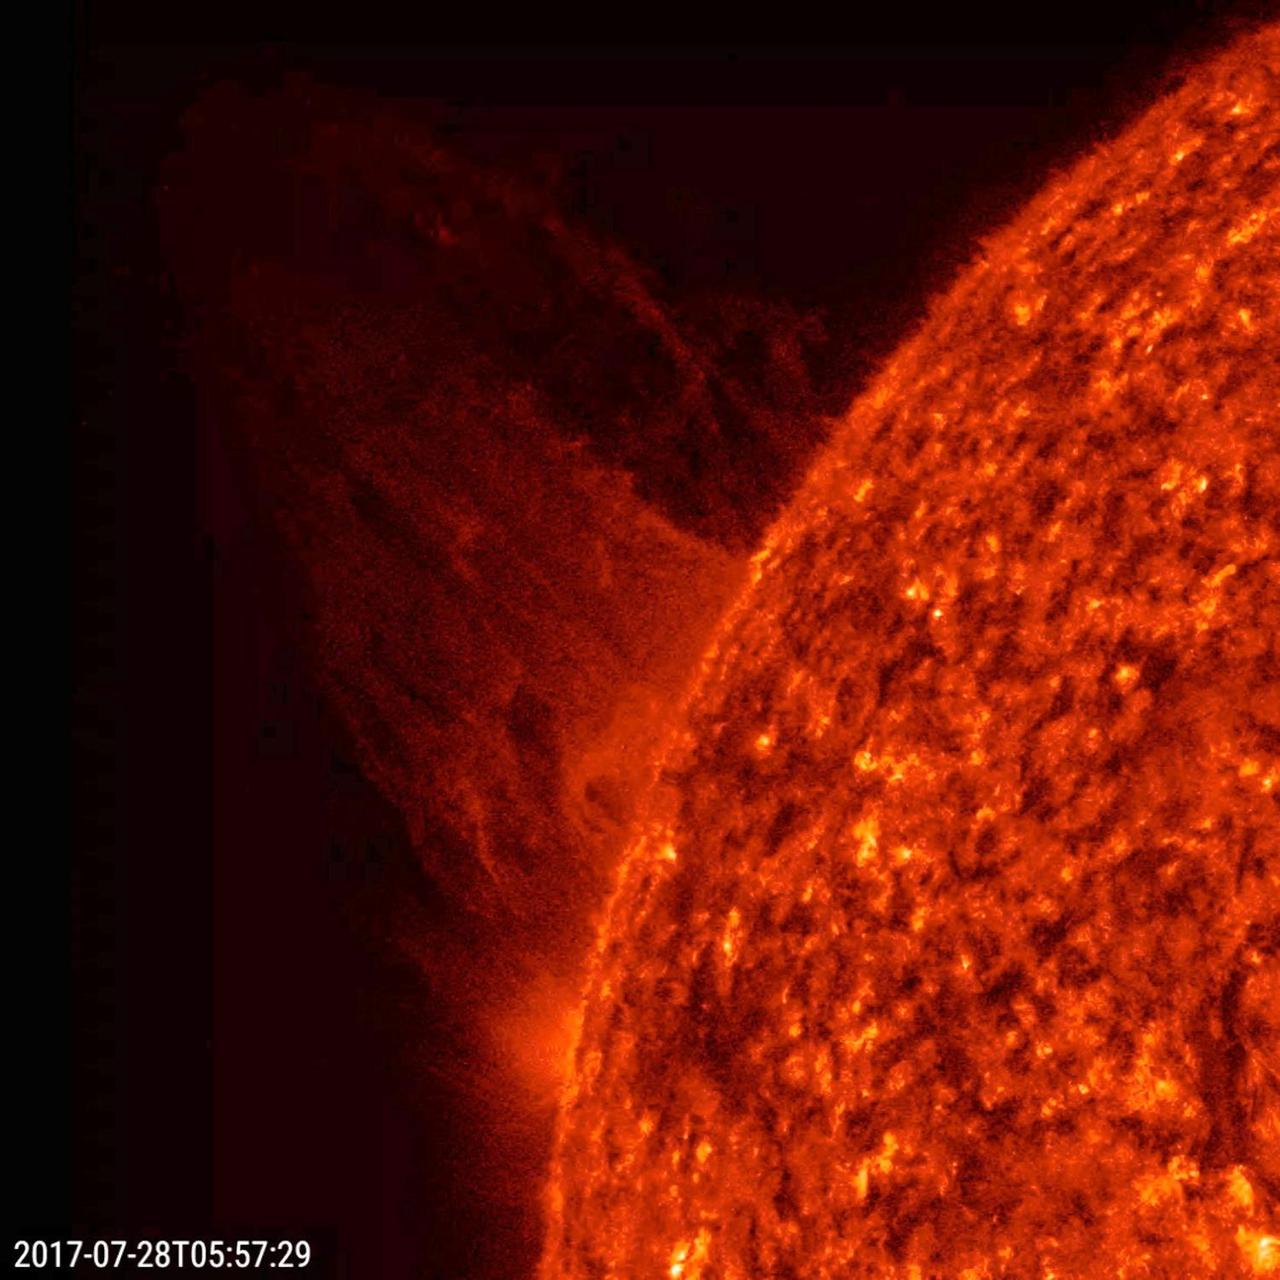
A sheet of plasma blasted out into space from just behind the edge of the sun (July 28, 2017). While some material escaped into space, a portion of it was unable to break the pull of gravity and the magnetic forces nearby and can be seen falling back to the sun. The 3.5 hours of action was captured in a wavelength of extreme ultraviolet light. https://photojournal.jpl.nasa.gov/catalog/PIA21866
Peering into the thousands of frozen layers inside Greenland’s ice sheet is like looking back in time. Each layer provides a record of what Earth’s climate was like at the dawn of civilization, or during the last ice age, or during an ancient period of warmth similar to the one we experience today. Scientists using ice-penetrating radar data collected by NASA’s Operation IceBridge and earlier airborne campaigns have built the first-ever comprehensive map of layers deep inside the Greenland Ice Sheet. View the full video: <a href="http://youtu.be/u0VbPE0TOtQ" rel="nofollow">youtu.be/u0VbPE0TOtQ</a> Credit: NASA’s Goddard Space Flight Center <b><a href="http://www.nasa.gov/audience/formedia/features/MP_Photo_Guidelines.html" rel="nofollow">NASA image use policy.</a></b> <b><a href="http://www.nasa.gov/centers/goddard/home/index.html" rel="nofollow">NASA Goddard Space Flight Center</a></b> enables NASA’s mission through four scientific endeavors: Earth Science, Heliophysics, Solar System Exploration, and Astrophysics. Goddard plays a leading role in NASA’s accomplishments by contributing compelling scientific knowledge to advance the Agency’s mission. <b>Follow us on <a href="http://twitter.com/NASAGoddardPix" rel="nofollow">Twitter</a></b> <b>Like us on <a href="http://www.facebook.com/pages/Greenbelt-MD/NASA-Goddard/395013845897?ref=tsd" rel="nofollow">Facebook</a></b> <b>Find us on <a href="http://instagram.com/nasagoddard?vm=grid" rel="nofollow">Instagram</a></b>
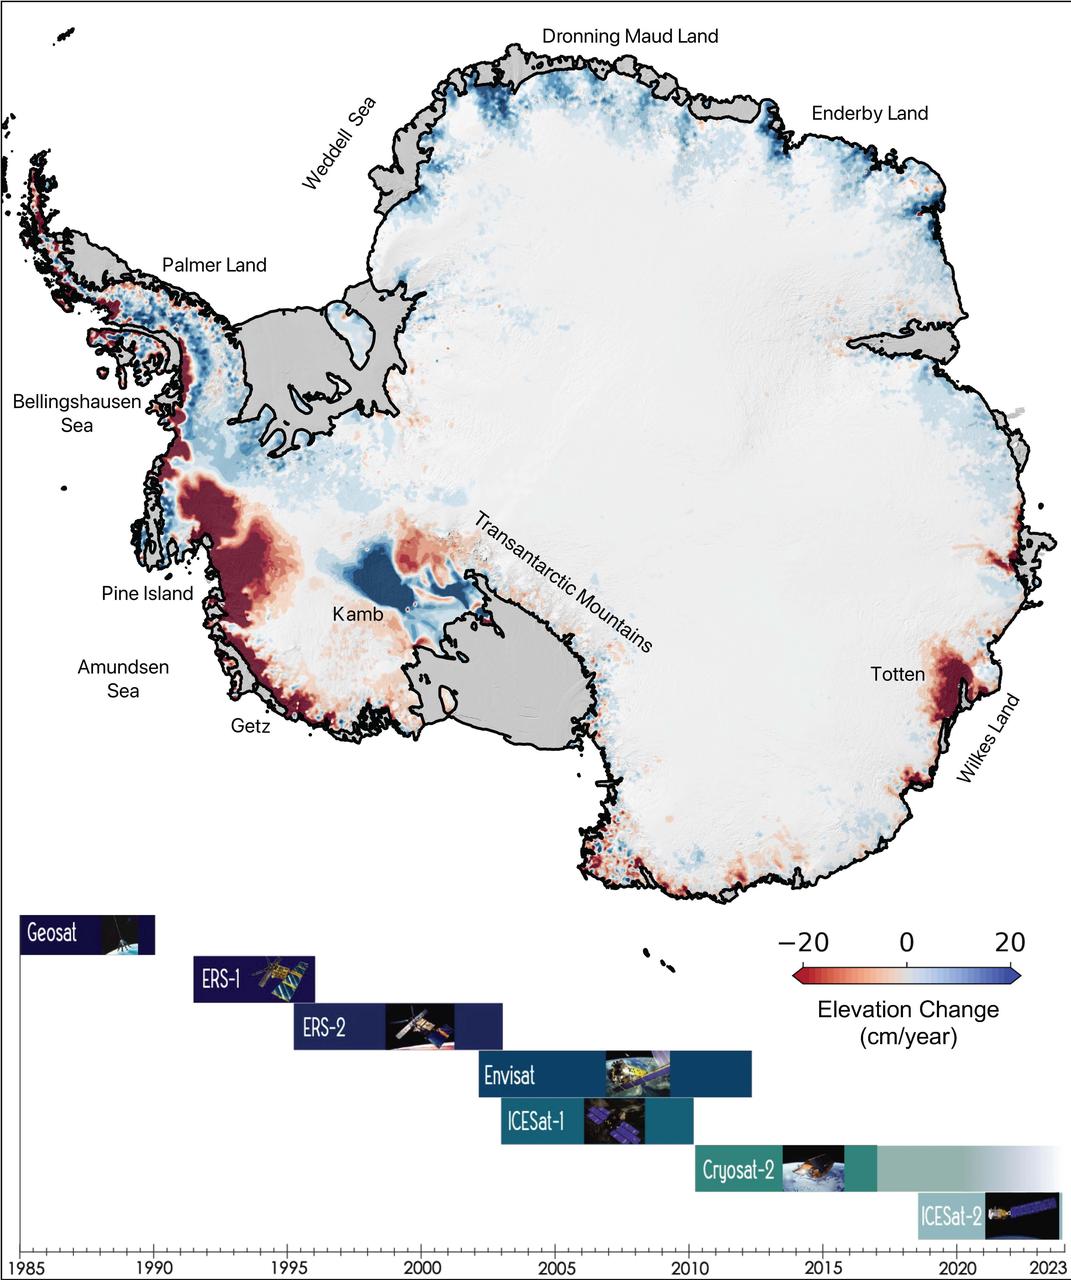
This map of Antarctica shows the changes in the elevation of the Antarctic ice sheet from 1985 through 2021. The map is part of a study, published in Earth System Science Data, conducted by researchers at NASA's Jet Propulsion Laboratory in Southern California. Ice height diminishes (shown in red) as the ice sheet melts by contact with ocean water; ice height rises (shown in blue) where accumulation exceeds ice loss. Ice shelves are shown in gray. The Pine Island and Thwaites glaciers in West Antarctica (the dark red spots on the left side of the map) are the largest areas of rapid ice loss. The stagnant Kamb Ice Stream (the dark blue area at middle-left) is the only major site of rapid accumulation as ice continues to push in from the interior but no longer flows out to an ice shelf. The image summarizes a new data set of monthly high-resolution "snapshots" of ice change. The satellite altimetry missions that supplied data for the study are listed in the timeline at the bottom of the image: Geosat (U.S. Navy), ERS-1 and ERS-2 (ESA, or European Space Agency), Envisat (ESA), ICESat-1 (NASA), Cryosat-2 (ESA), and ICESat-2 (NASA). https://photojournal.jpl.nasa.gov/catalog/PIA24990

NASA's IceBridge, an airborne survey of polar ice, flew over the Helheim/Kangerdlugssuaq region of Greenland on Sept. 11, 2016. This photograph from the flight captures Greenland's Steenstrup Glacier, with the midmorning sun glinting off of the Denmark Strait in the background. IceBridge completed the final flight of the summer campaign to observe the impact of the summer melt season on the ice sheet on Sept. 16. The IceBridge flights, which began on Aug. 27, are mostly repeats of lines that the team flew in early May, so that scientists can observe changes in ice elevation between the spring and late summer. For this short, end-of-summer campaign, the IceBridge scientists flew aboard an HU-25A Guardian aircraft from NASA's Langley Research Center in Hampton, Virginia. Credit: NASA/John Sonntag <b><a href="http://www.nasa.gov/audience/formedia/features/MP_Photo_Guidelines.html" rel="nofollow">NASA image use policy.</a></b> <b><a href="http://www.nasa.gov/centers/goddard/home/index.html" rel="nofollow">NASA Goddard Space Flight Center</a></b> enables NASA’s mission through four scientific endeavors: Earth Science, Heliophysics, Solar System Exploration, and Astrophysics. Goddard plays a leading role in NASA’s accomplishments by contributing compelling scientific knowledge to advance the Agency’s mission. <b>Follow us on <a href="http://twitter.com/NASAGoddardPix" rel="nofollow">Twitter</a></b> <b>Like us on <a href="http://www.facebook.com/pages/Greenbelt-MD/NASA-Goddard/395013845897?ref=tsd" rel="nofollow">Facebook</a></b> <b>Find us on <a href="http://instagrid.me/nasagoddard/?vm=grid" rel="nofollow">Instagram</a></b>
This 2001 Mars Odyssey image of Jeans Crater shows a sand sheet with dune forms and a layered region to the south of the sand sheet.
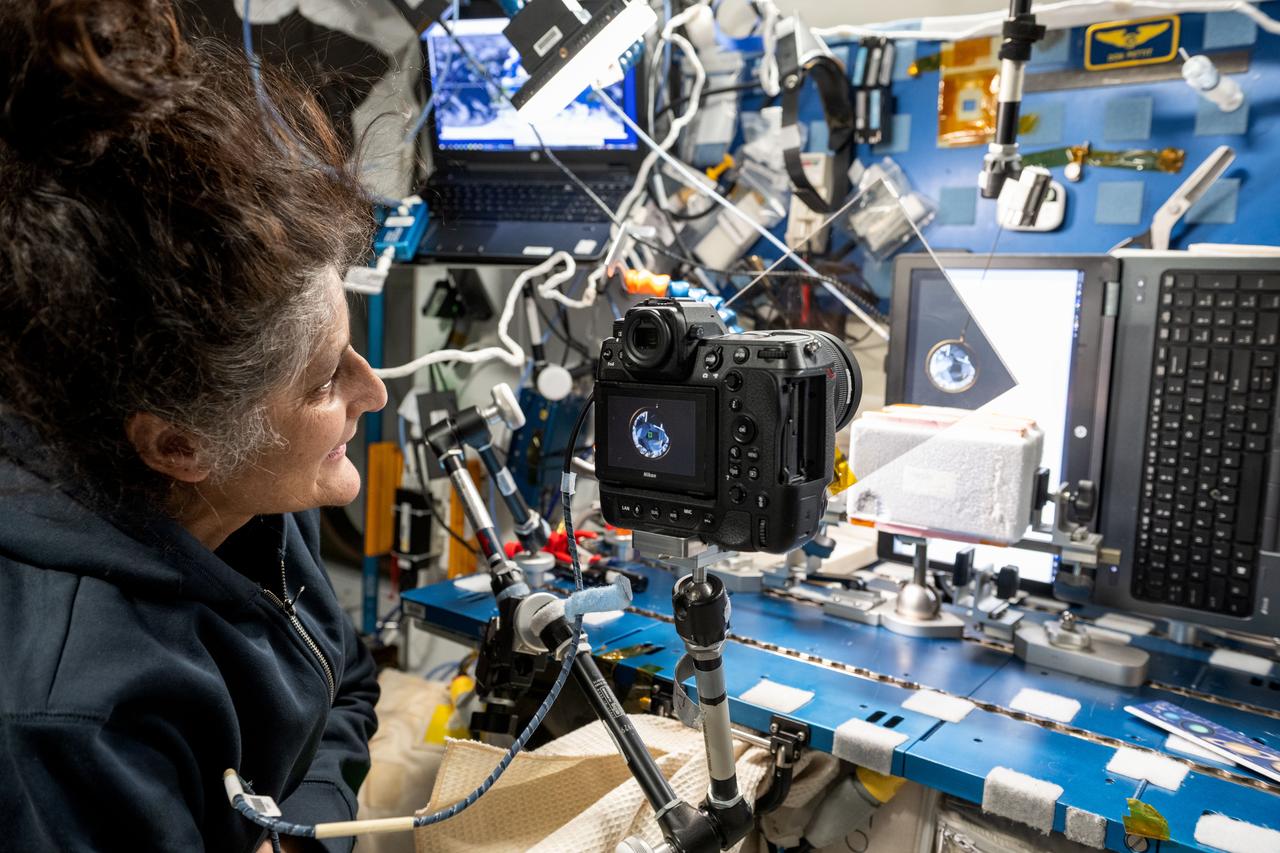
iss072e098117 (Oct. 24, 2024) --- NASA astronaut and Expedition 72 Commander Suni Williams photographs ice crystals forming inside a sheet of water using surface tension to stay attached to a ring in microgravity.

STS064-23-025 (9-20 Sept. 1994) --- With scissors in hand, astronaut Jerry M. Linenger, STS-64 mission specialist, prepares to cut off a lengthy sheet of correspondence from ground controllers. Called the Thermal Imaging Printing System (TIPS), the message center occupies a stowage locker on the space shuttle Discovery's middeck. Astronaut L. Blaine Hammond, pilot, retrieves a clothing item from a nearby locker. Photo credit: NASA or National Aeronautics and Space Administration

iss049e035512 (10/14/2016) --- NASA astronaut Kate Rubins during Microbe IV Sampling Sheet and White Tube Collection in the Japanese Experiment Module (JEM) Pressurized Module (JPM). The JAXA KIBO Utilization scenario, studies the relationship between humans and microbes in space habitation environments, which are critical for success in long-duration missions. Credit: JAXA/Takuya Onishi
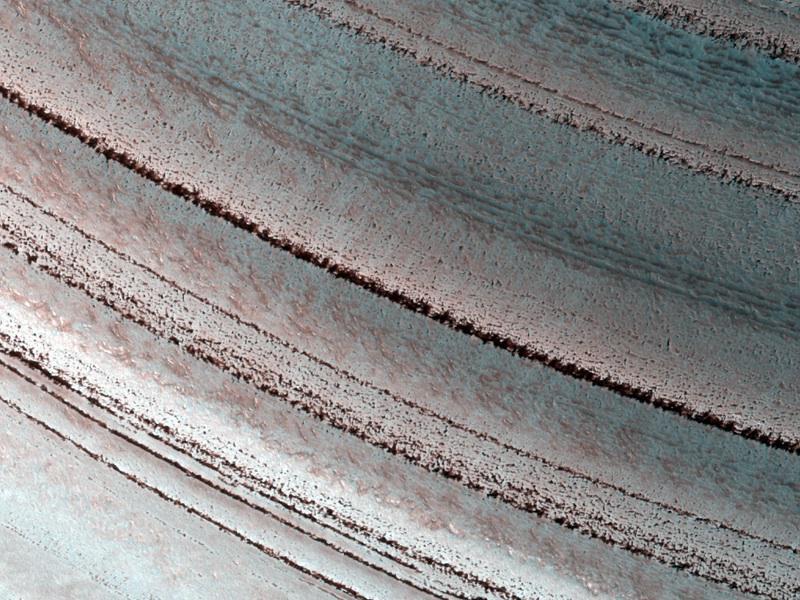
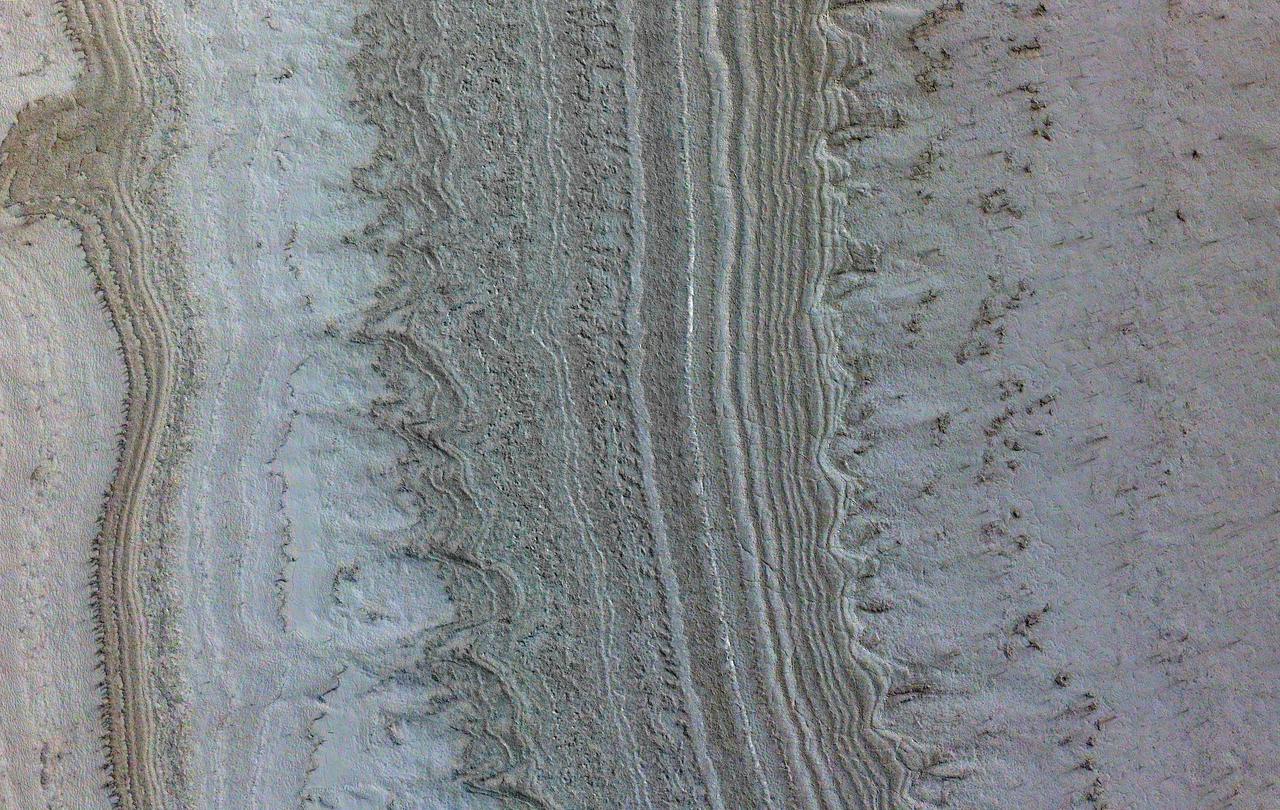
The Martian north polar layered deposits are an ice sheet much like the Greenland ice sheet on the Earth in this image from NASA Mars Reconnaissance Orbiter. This Martian ice sheet contains many layers that record variations in the Martian climate.
This large sand sheet and dune field is located on the floor of Juventae Chasma
Sand sheets cover most of the walls and floors of this part of Noctis Labyrinthus
Linear duneforms are found on the sand dune sheet on the floor of Richardson Crater.
This sand sheet and dune field occurs on the floor of Candor Chasma
This VIS image shows sand sheets in two unnamed craters located in Noachis Terra. Both sand sheets have dune forms on the surface of the sand sheet. These craters are close to Matara Crater, which also contains a large sand sheet with surface dune forms. Orbit Number: 84572 Latitude: -48.5416 Longitude: 34.0463 Instrument: VIS Captured: 2021-01-06 22:34 https://photojournal.jpl.nasa.gov/catalog/PIA24414
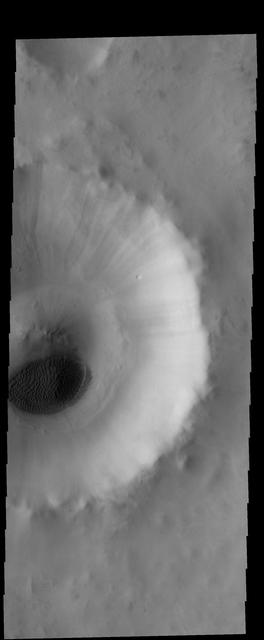
This image from NASA Mars Odyssey spacecraft is a sand sheet with surface dune forms filling part of the floor of this unnamed crater. Many craters in the northern plains of Vastitas Borealis contain sand sheets.
This VIS image shows part of the large sand sheet within Proctor Crater. The surface of the sand sheet hosts dune forms. Orbit Number: 65317 Latitude: -47.7498 Longitude: 30.1831 Instrument: VIS Captured: 2016-09-04 01:02 http://photojournal.jpl.nasa.gov/catalog/PIA21153
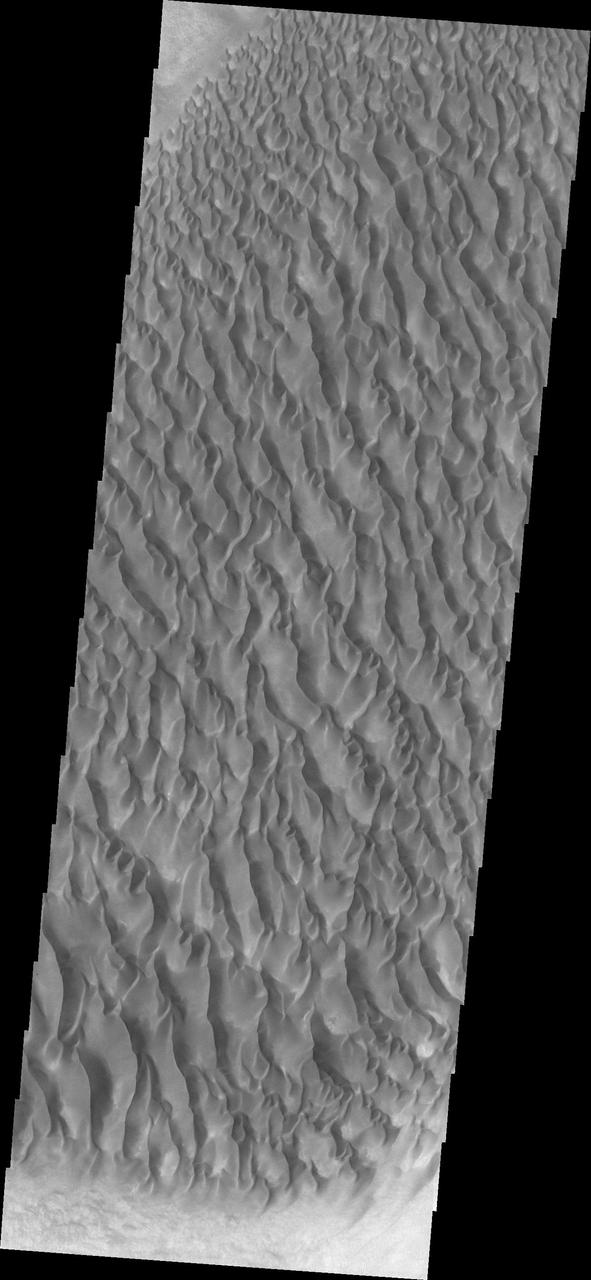
This view from NASA's Mars Reconnaissance Orbiter shows the downwind stretches of a sand sheet in central part of the much larger Herschel Crater. This sandy province began kilometers upwind in a string of barchan sand dunes. As the north-to-south blowing wind weakened downwind, it could no longer fashion the sand into dunes but rather into amorphously-shaped sand sheets. While perhaps not awe-inspiringly beautiful, sand sheets can tell us about Mars' current and past environmental conditions as a piece of the puzzle for understanding habitability. Having dunes upwind of sheets is the opposite situation Earth has, where upwind sand sheets evolve downwind into sand dunes. This mystery is receiving ongoing research to to understand these sandy differences between Earth and Mars. https://photojournal.jpl.nasa.gov/catalog/PIA21933
A large sand sheet with surface dune forms is located on the floor of this crater near the south pole. The polar cap rests against the southern part of the sand sheet. The dune appears bright in this daytime 2001 Mars Odyssey THEMIS IR image.

The Thurston Island calving front off of western Antarctica as seen from the window of NASA's DC-8 on Nov. 5, 2014. Image Credit: NASA/Jim Yungel NASA’s Operation IceBridge collected some rare images on a flight out of Punta Arenas, Chile on Nov. 5, 2014, on a science flight over western Antarctica dubbed Ferrigno-Alison-Abbott 01. The crew snapped a few shots of a calving front of the Antarctic ice sheet. This particular flight plan was designed to collect data on changes in ice elevation along the coast near the Ferrigno and Alison ice streams, on the Abbot Ice Shelf, and grounded ice along the Eights Coast.

A sea of icebergs float near the Thurston Island calving front off of western Antarctica as seen on the IceBridge flight on Nov. 5, 2014. Image Credit: NASA/Jim Yungel NASA’s Operation IceBridge collected some rare images on a flight out of Punta Arenas, Chile on Nov. 5, 2014, on a science flight over western Antarctica dubbed Ferrigno-Alison-Abbott 01. The crew snapped a few shots of a calving front of the Antarctic ice sheet. This particular flight plan was designed to collect data on changes in ice elevation along the coast near the Ferrigno and Alison ice streams, on the Abbot Ice Shelf, and grounded ice along the Eights Coast.

A small hole in the clouds revealed newly formed sea ice in the Bellingshausen Sea next to an ice berg on Nov. 5, 2014 flight. Image Credit: NASA/Digital Mapping System NASA’s Operation IceBridge collected some rare images on a flight out of Punta Arenas, Chile on Nov. 5, 2014, on a science flight over western Antarctica dubbed Ferrigno-Alison-Abbott 01. The crew snapped a few shots of a calving front of the Antarctic ice sheet. This particular flight plan was designed to collect data on changes in ice elevation along the coast near the Ferrigno and Alison ice streams, on the Abbot Ice Shelf, and grounded ice along the Eights Coast.

Snow is blown off of the Thurston Island calving front off of western Antarctica as seen on the IceBridge flight on Nov. 5, 2014. Image Credit: NASA/Jim Yungel NASA’s Operation IceBridge collected some rare images on a flight out of Punta Arenas, Chile on Nov. 5, 2014, on a science flight over western Antarctica dubbed Ferrigno-Alison-Abbott 01. The crew snapped a few shots of a calving front of the Antarctic ice sheet. This particular flight plan was designed to collect data on changes in ice elevation along the coast near the Ferrigno and Alison ice streams, on the Abbot Ice Shelf, and grounded ice along the Eights Coast.

Mountain peaks through the ice cover on Thurston Island off of western Antarctica as seen on the IceBridge flight on Nov. 5, 2014. Image Credit: NASA/Jim Yungel NASA’s Operation IceBridge collected some rare images on a flight out of Punta Arenas, Chile on Nov. 5, 2014, on a science flight over western Antarctica dubbed Ferrigno-Alison-Abbott 01. The crew snapped a few shots of a calving front of the Antarctic ice sheet. This particular flight plan was designed to collect data on changes in ice elevation along the coast near the Ferrigno and Alison ice streams, on the Abbot Ice Shelf, and grounded ice along the Eights Coast.

NASA’s Operation IceBridge collected some rare images on a flight out of Punta Arenas, Chile on Nov. 5, 2014, on a science flight over western Antarctica dubbed Ferrigno-Alison-Abbott 01. Following a routine calibration pass over Punta Arenas airport, the NASA DC-8 overflew the USS Constellation which is being towed for demolition after 53 yeas of service. The crew then snapped a few shots of a calving front of the Antarctic ice sheet. This particular flight plan was designed to collect data on changes in ice elevation along the coast near the Ferrigno and Alison ice streams, on the Abbot Ice Shelf, and grounded ice along the Eights Coast.
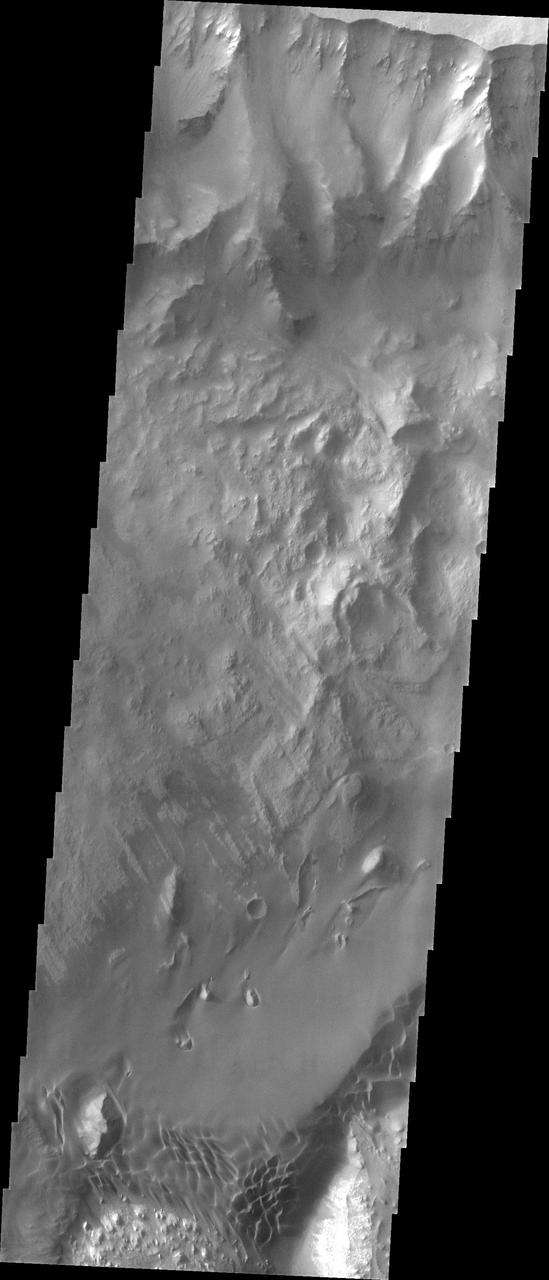
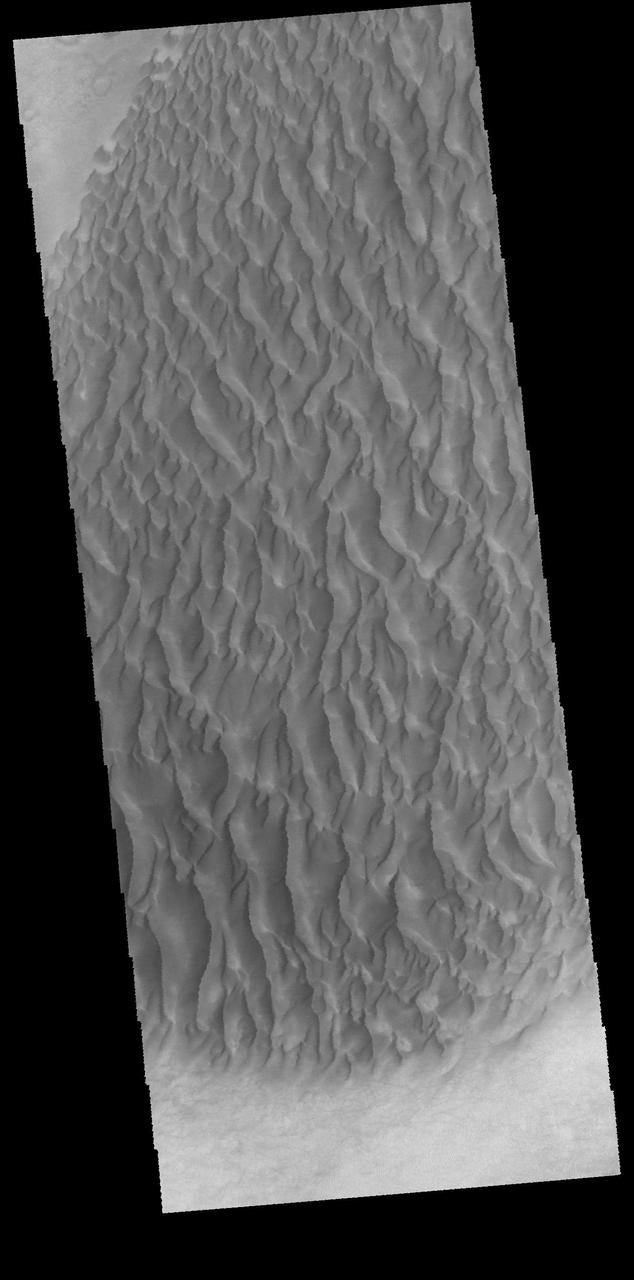
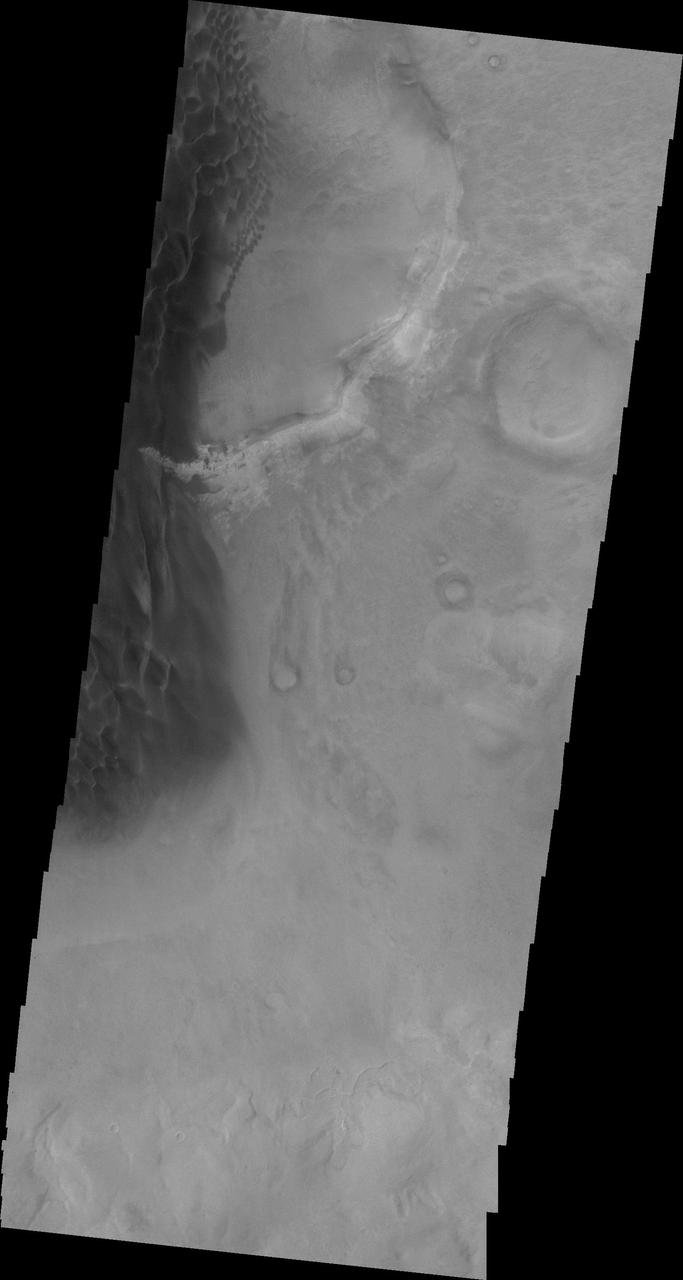
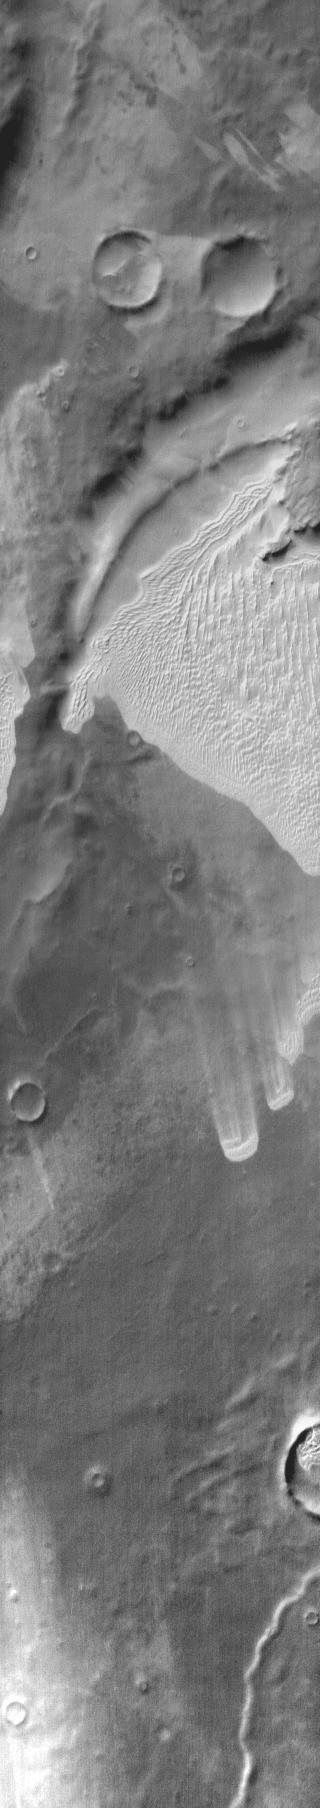
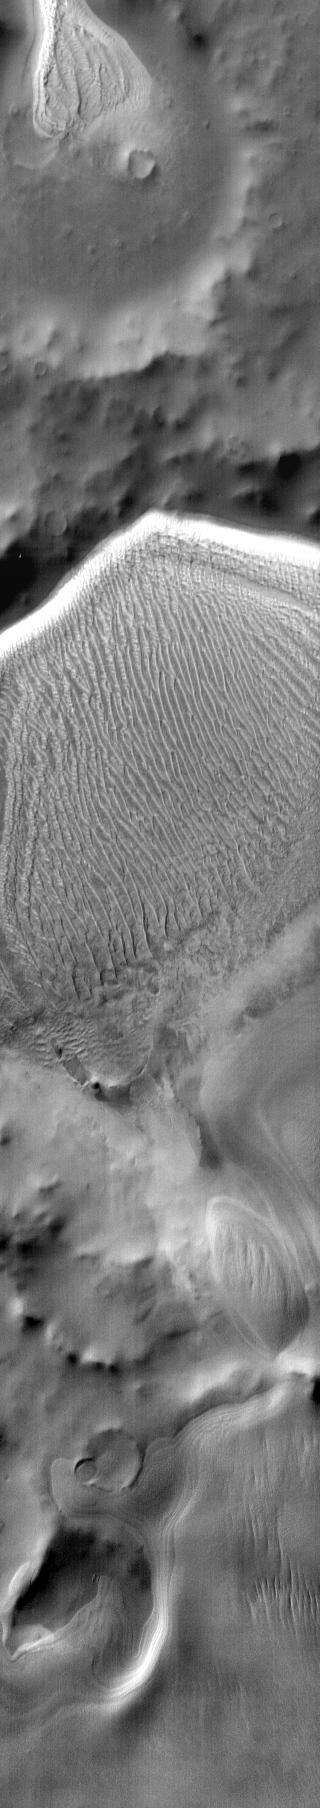
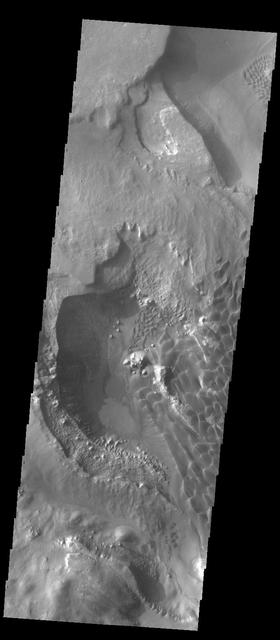
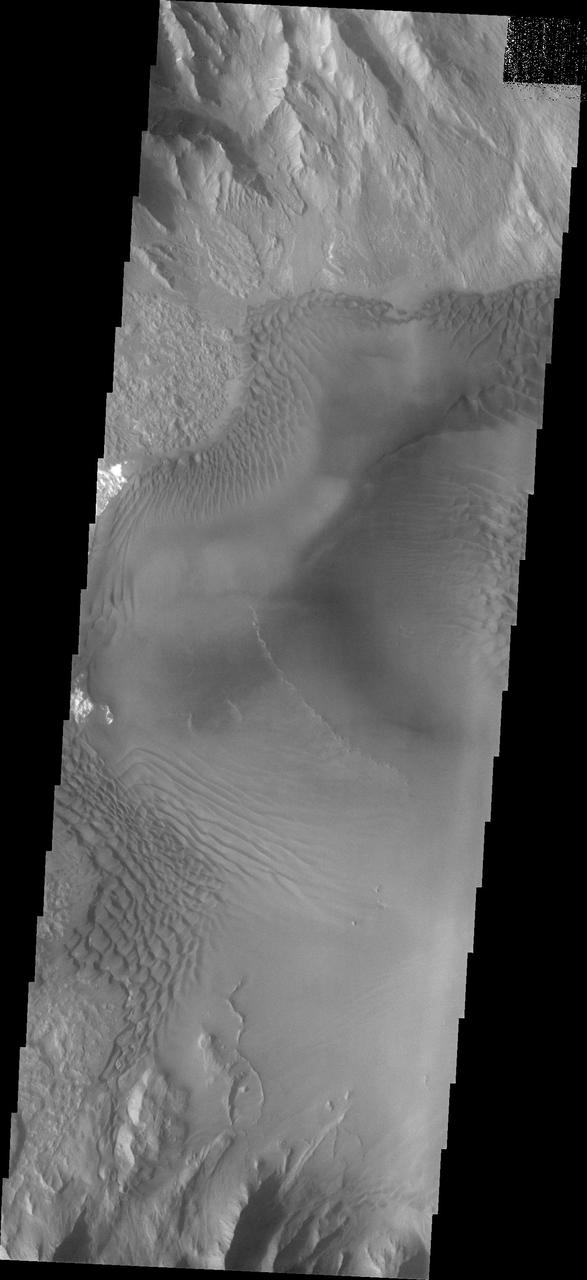
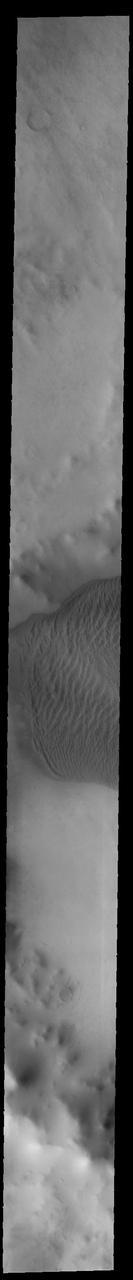
This image from NASA 2001 Mars Odyssey spacecraft shows part of the floor of Ganges Chasma, including part of a sand sheet.
This 2001 Mars Odyssey image shows the eastern margin of the sand sheet and dune field on the floor of Rabe Crater.
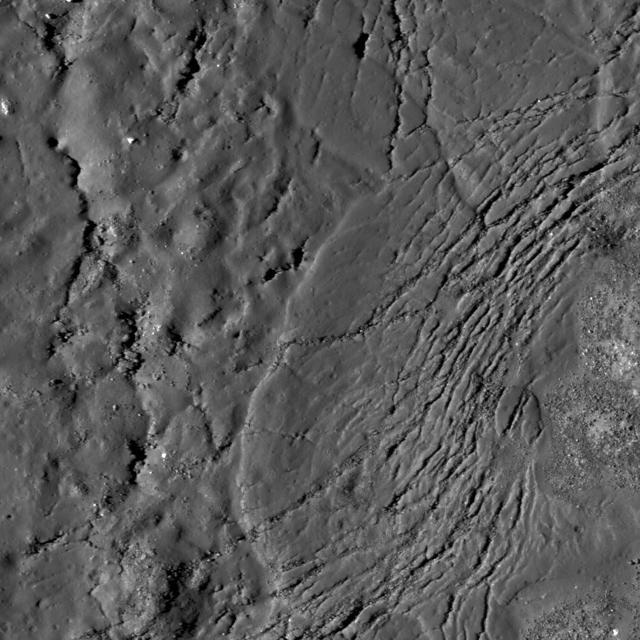
Cracks form in the impact melt sheet on the floor of Necho Crater in this image taken by NASA Lunar Reconnaissance Orbiter.
This image shows part of the sand sheet and dunes on the floor of Rabe Crater as seen by NASA 2001 Mars Odyssey spacecraft.
This daytime infrared image shows the large sand sheet on the floor of Charlier Crater. The brightness is due to the warmth of the sand during the day.
This 2001 Mars Odyssey image shows an extensive sand sheet near the south polar cap.
This image from NASA 2001 Mars Odyssey shows a sand sheet with dune forms located northeast of Douglass Crater.
The sand sheet and dune forms in this image from NASA Mars Odyssey spacecraft are located on the floor of Rabe Crater.

The sand sheet and dunes in this image, taken by NASA 2001 Mars Odyssey spacecraft, are located on the floor of Juventae Chasma.
This 2001 Mars Odyssey image shows the sand sheet with surface dune forms located on the floor of Richardson Crater.
This image from NASA 2001 Mars Odyssey shows the sand sheet with dune forms located on the floor of Rabe Crater.
This image from NASA 2001 Mars Odyssey spacecraft shows part of the sand sheet and dunes on the floor of Rabe Crater.
The floor of Proctor Crater is host to this sand sheet and its surface dune forms in this image captured by NASA Mars Odyssey.
This daytime infrared image shows the majority of the sand sheet and dune forms within Richardson Crater.
This image captured by NASA 2001 Mars Odyssey spacecraft shows part of the sand sheet and dunes on the floor of Rabe Crater.
This image from NASA Mars Odyssey shows a sand sheet with dune forms on its surface.
A sand sheet and dune forms are present on the floor of Capri Chasmain this image from NASA 2001 Mars Odyssey spacecraft.
The dunes in this unnamed crater in Aonia Terra are coalescing into a sand sheet in this image from NASA 2001 Mars Odyssey spacecraft.
Dunes forms top this sand sheet in the plains of Aonia Terra in this image captured by NASA Mars Odyssey.
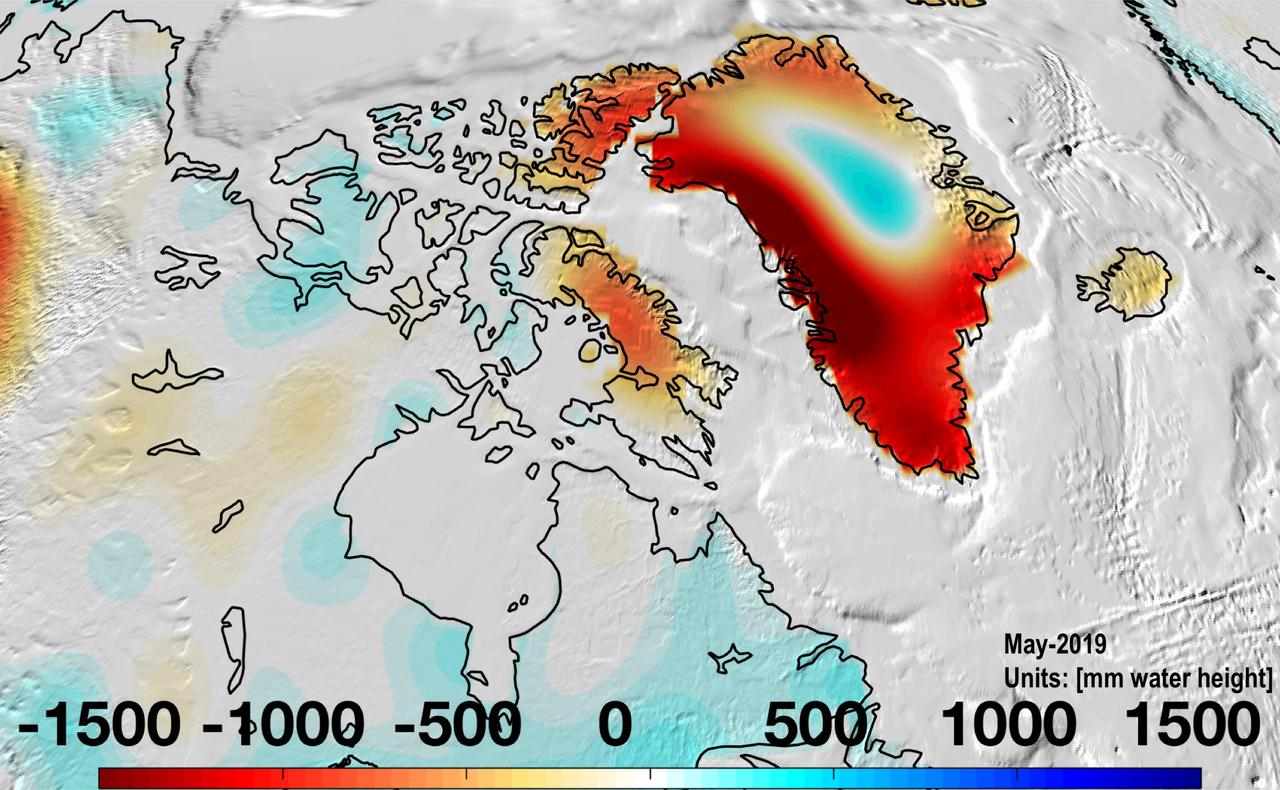
Almost all of Greenland continued to lose mass in May 2019 as the ice sheet continues to melt. https://photojournal.jpl.nasa.gov/catalog/PIA23340

Speakers Bureau Annual Award Ceremony : People in photo are: Lenwood Clark, Christine Darden, Doug Dwoyer, Thayer Sheets, Paul Holloway, Cathy Schauer, Charles Blankenship, Irwin Schauer
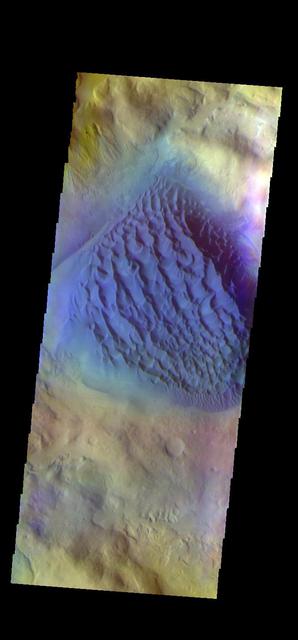
The THEMIS VIS camera contains 5 filters. The data from different filters can be combined in multiple ways to create a false color image. These false color images may reveal subtle variations of the surface not easily identified in a single band image. Today's false color image shows the large sand sheet on the floor of Matara Crater. The top of the sand sheet has been sculpted by the wind, creating dune forms. Matara Crater is 48km (30 miles) in diameter and is located in Noachis Terra. Orbit Number: 75438 Latitude: -49.5195 Longitude: 34.6327 Instrument: VIS Captured: 2018-12-16 19:39 https://photojournal.jpl.nasa.gov/catalog/PIA24603
This image captured by NASA 2001 Mars Odyssey spacecraft shows part of the large sand sheet and sand dunes on the floor of Proctor Crater.
This image from NASA Mars Odyssey spacecraft shows relatively dark coarse grained material forming individual dunes coalescing into a relatively uniform sand sheet.
This image captured by NASA 2001 Mars Odyssey spacecraft shows a sand sheet with surface dune forms located on the floor of an unnamed crater in Vastitas Borealis.
This image from NASA 2001 Mars Odyssey spacecraft shows part of the large sand sheet and surface dune forms on the floor of Proctor Crater.
This image of the floor of Proctor Crater, taken by NASA 2001 Mars Odyssey spacecraft, shows part of the sand sheet and dune forms that are located there.
Dunes on the floor of Russell Crater vary from individual dunes, to a large hook shaped, towering sand sheet as seen by NASA Mars Odyssey.
This image from NASA 2001 Mars Odyssey spacecraft shows part of the large sand sheet and dune forms on the floor of Russell Crater.

This image of Baltisk Crater shows a sand sheet on the crater floor and channels dissecting the outer rim as seen by NASA 2001 Mars Odyssey spacecraft.
An extensive sand sheet and dunes are located within Pityusa Patera. This daytime infrared image shows that the sand is relatively warmer than the surrounding materials.
A large sand sheet with surface dune forms covers the floor of this unnamed northern crater, as shown in this image captured by NASA 2001 Mars Odyssey spacecraft.
Dune forms cover the top of this sand sheet on the floor of Juventae Chasma, a chasma north of the Valles Marineris canyon system in this image from NASA Mars Odyssey.
A sand sheet with surface dune forms covers the floor of this unnamed crater near the north pole. This image was taken by NASA 2001 Mars Odyssey spacecraft.
This image captured by NASA 2001 Mars Odyssey spacecraft shows part of the floor of Coprates Chasma, including a large sand sheet and smaller dunes.
Today's VIS image shows the floor of Matara Crater. A large sand sheet dominates the floor of this crater located in Noachis Terra. The top of the sand sheet has been sculpted by the wind, creating dune forms. Matara Crater is 48km (30 miles) in diameter. Orbit Number: 84859 Latitude: -49.6428 Longitude: 34.4725 Instrument: VIS Captured: 2021-01-30 13:42 https://photojournal.jpl.nasa.gov/catalog/PIA24720

This figure is a line drawing of the J-2 engine with callouts of the major components and the engine characteristics.
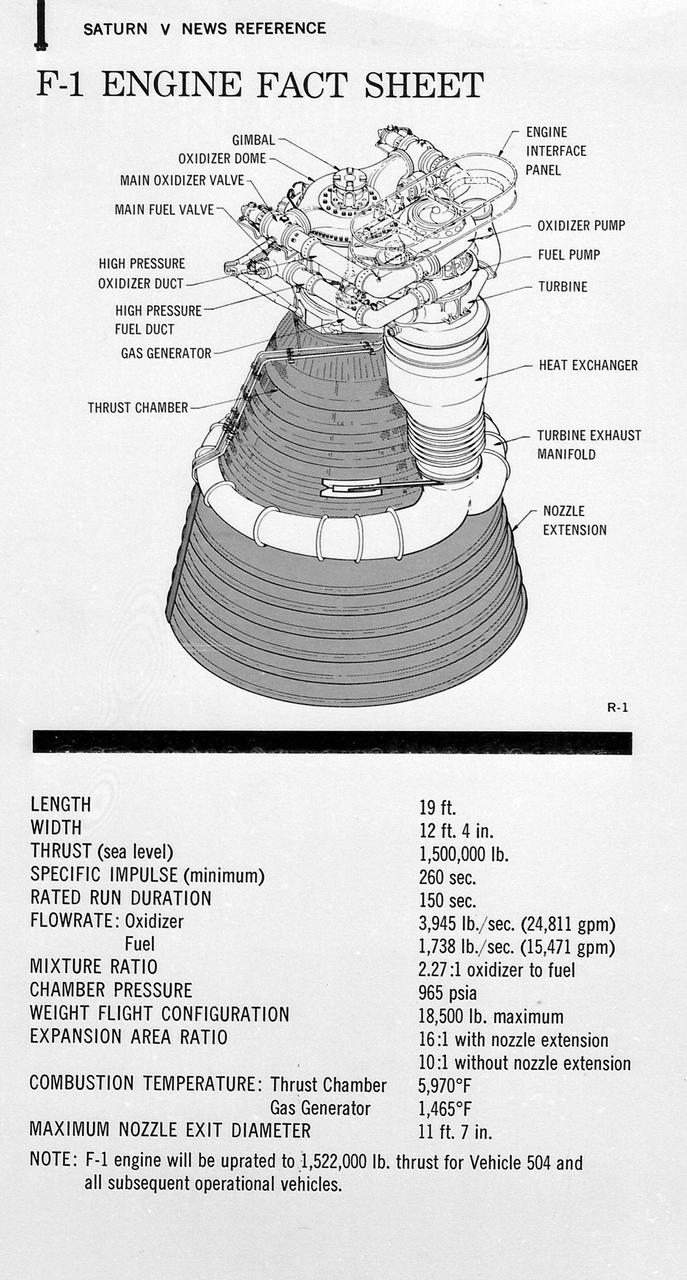
This figure is a drawing of the F-1 engine with callouts of the major components and the engine characteristics.
Active sand dunes are common on Mars, and have a variety of surface textures. The "braided" texture visible here may be typical of dunes that are transitioning into sand sheets. https://photojournal.jpl.nasa.gov/catalog/PIA23674
Today's VIS image shows the sand deposit on the floor of Matara Crater. The deposit is thick enough to hide the underlying crater floor creating a sheet of sand. Upon this sheet of sand the wind has created dune forms. Matara Crater is located in Noachis Terra. Orbit Number: 75438 Latitude: -49.5195 Longitude: 34.6327 Instrument: VIS Captured: 2018-12-16 19:39 https://photojournal.jpl.nasa.gov/catalog/PIA23034
Today's VIS image shows a sand sheet with surface dunes forms on the floor of an unnamed crater in Noachis Terra. Orbit Number: 74596 Latitude: -52.0302 Longitude: 33.4965 Instrument: VIS Captured: 2018-10-08 11:42 https://photojournal.jpl.nasa.gov/catalog/PIA22858
This VIS image shows a sand sheet with surface dune forms on the floor of an unnamed crater in Noachis Terra. Orbit Number: 82070 Latitude: -48.8906 Longitude: 34.114 Instrument: VIS Captured: 2020-06-14 22:47 https://photojournal.jpl.nasa.gov/catalog/PIA24121
A sand sheet with surface dune forms covers part of the floor of this unnamed crater, as shown in this image from NASA 2001 Mars Odyssey spacecraft. This crater is located in Acidalia Planitia.
This daytime infrared image of Rabe Crater illustrates the warming effect of the sun on sand. The extensive sand sheet and dunes of Rabe crater appear bright in the infrared indicating they are warmer than the surrounding floor and plains materials.
Lava flows south of Arsia Mons in Daedalia Planum transition from younger flows with elongated, sinuous morphologies to the northeast, to older, broader lobes and sheet flows to the southwest. This image is from NASA Mars Reconnaissance Orbiter.
This VIS image of Charlier Crater sand sheet was taken at the same time as yesterday THEMIS IR image. In this image the dunes are darker than the surroundings, unlike yesterday thermal image.
This image shows the northern part of central New York State, a landscape sculpted by the ice sheets of the last ice age. Lake Ontario runs across the top of the image.
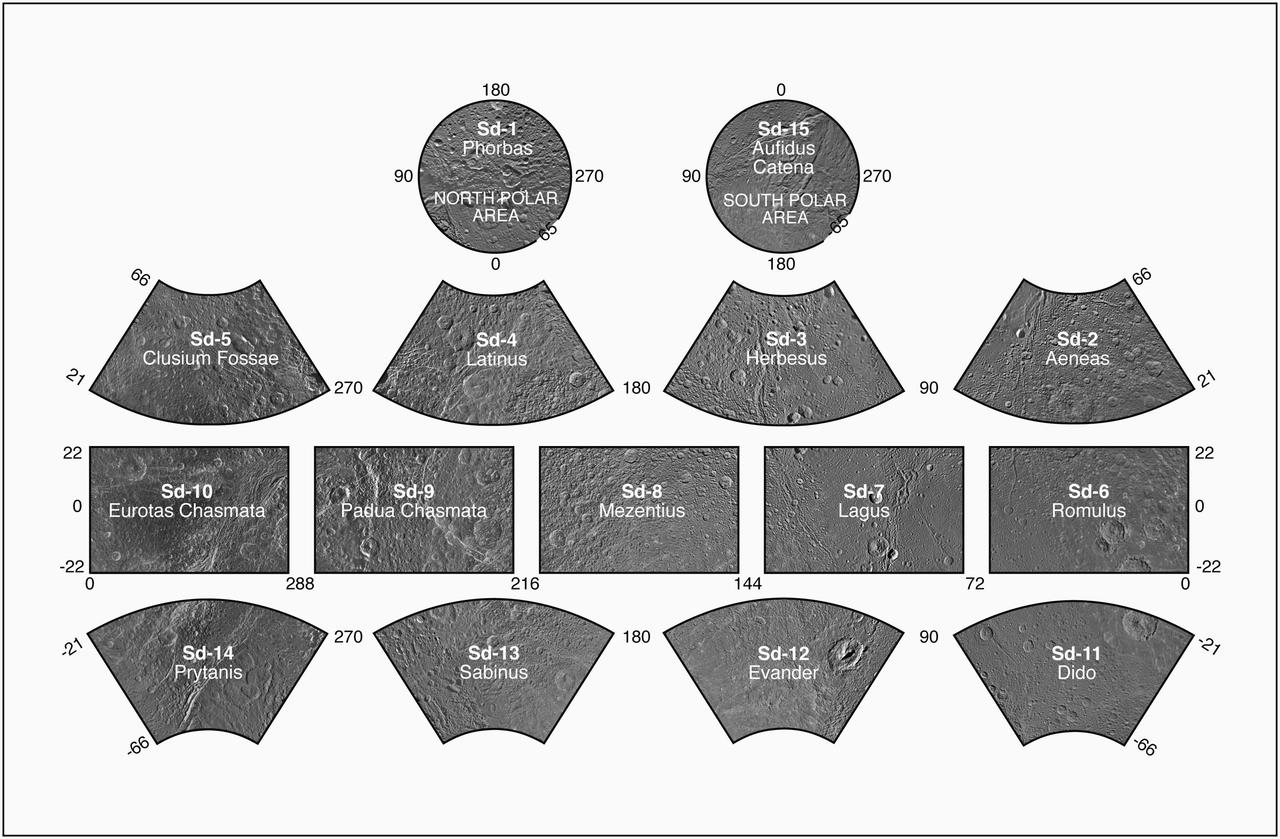
The latest version of a complete set of cartographic map sheets from a high-resolution Dione atlas was released today by the Cassini Imaging Team. Full photomosaic maps are available at the Photojournal.
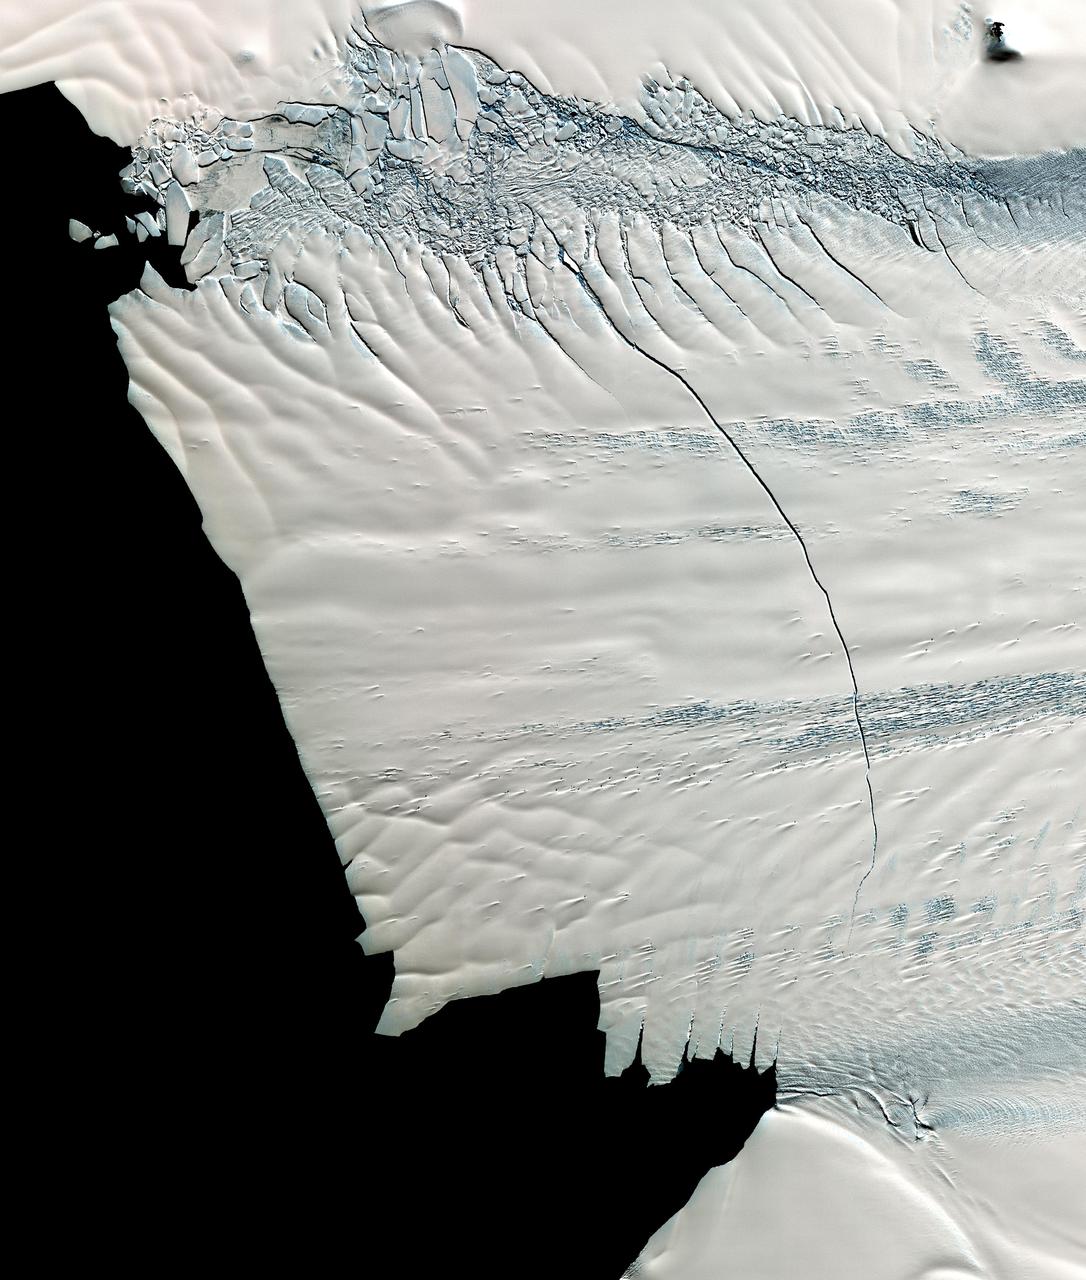
This image from NASA Terra spacecraft shows a massive crack across the Pine Island Glacier, a major ice stream that drains the West Antarctic Ice Sheet. Eventually, the crack will extend all the way across the glacier.
This image from NASA Mars Reconnaissance Orbiter shows an area of layered deposits in Candor Chasma. Sheets and dunes of dark-toned sand cover the light-toned, layered bedrock.
This image from NASA Mars Odyssey is an unnamed crater in the far northern lowlands containing a sand sheet with dune forms on its floor. Many craters this close to the pole contain similar dune fields.
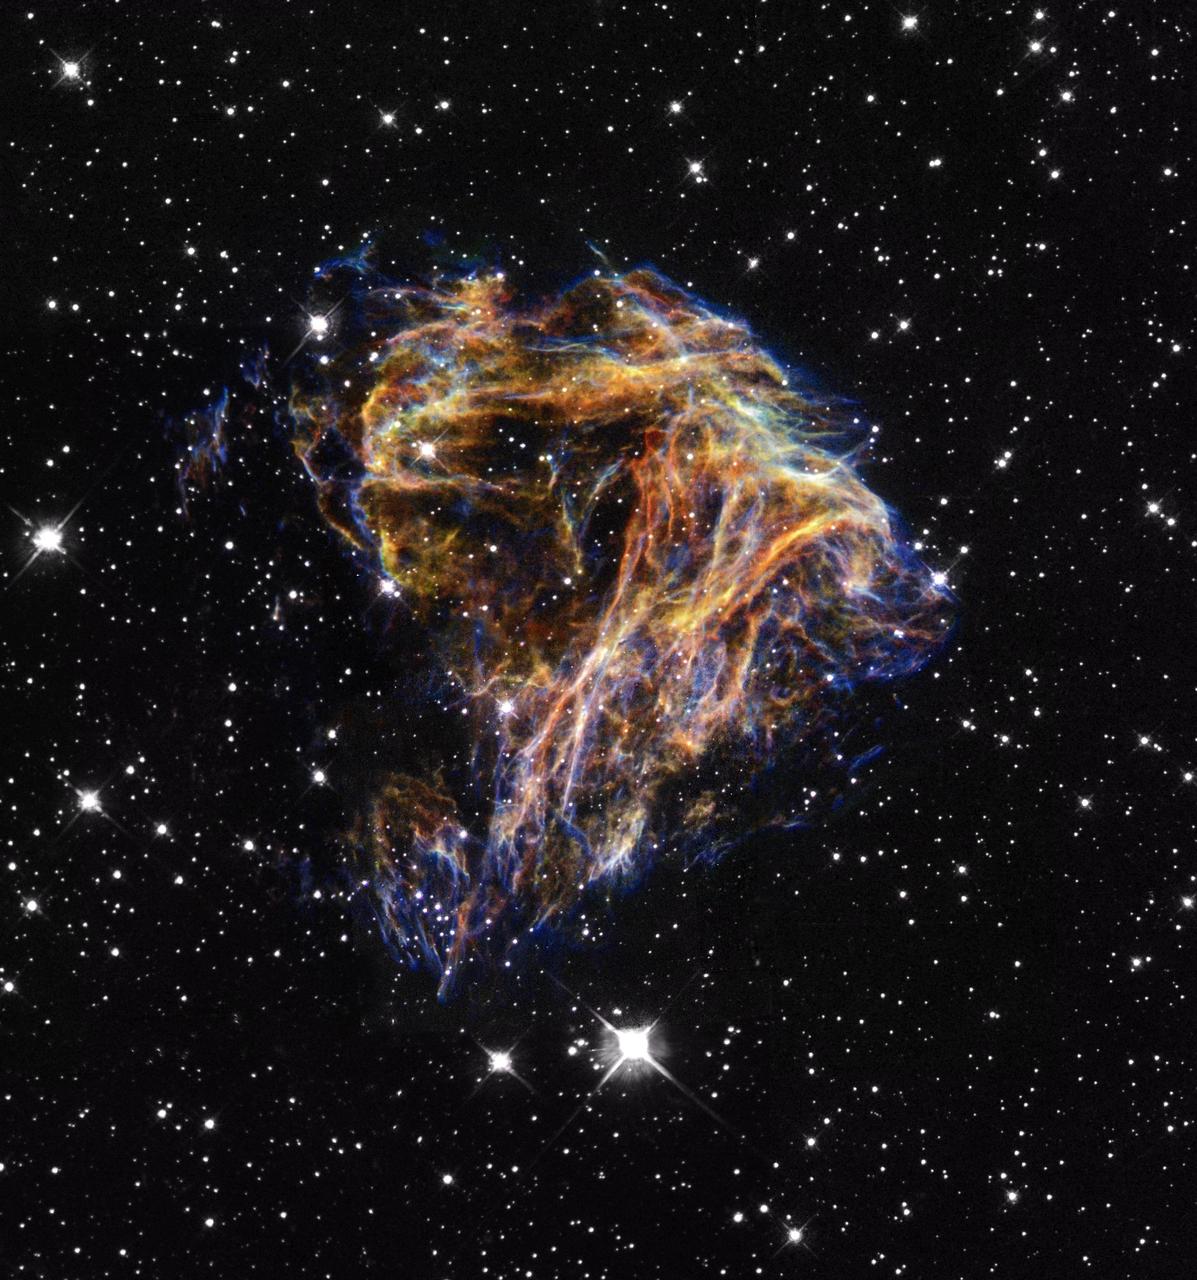
Resembling sparks from a fireworks display, this image taken by a JPL camera onboard NASA Hubble Space Telescope shows delicate filaments that are sheets of debris from a stellar explosion in the nearby Large Magellanic Cloud galaxy.
The amount of sand in this region of Juventae Chasma has coalesced into a sand sheet, rather than individual dune forms. Wind continues to sculpt the sand around high standing hills in this image from NASA Mars Odyssey.
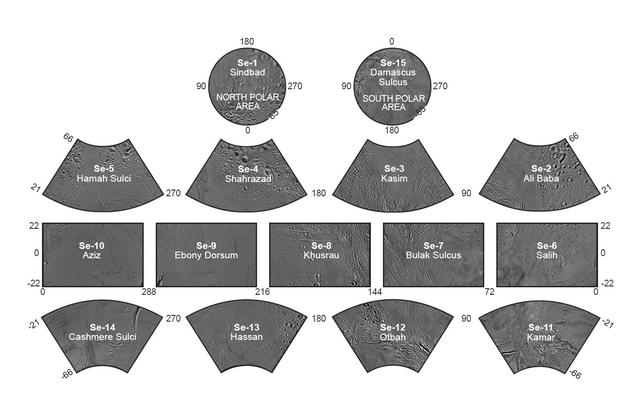
This map sheet covers a 15-series image set covering the entire surface of Enceladus. The map data was acquired by NASA Cassini imaging experiment. Individual images can be viewed via the Photojournal.
This image captured by NASA 2001 Mars Odyssey spacecraft shows a sand sheet with a surface dune form, which partly surrounds the central peak of this unnamed crater near the north pole.
This image taken by NASA's Mars Reconnaissance Orbiter (MRO) shows ice sheets at Mars' south pole. The spacecraft detected clays near this ice; scientists have proposed such clays are the source of radar reflections that have been previously interpreted as liquid water using data from the ESA (European Space Agency) Mars Express orbiter. Flying 186 miles (300 kilometers) above the Martian surface, MRO used its High-Resolution Imaging Science Experiment (HiRISE) camera to study the ice sheets while using its Compact Reconnaissance Imaging Spectrometer (CRISM) to map out clay minerals near the ice. https://photojournal.jpl.nasa.gov/catalog/PIA24763
This VIS image shows a portion of a sand sheet with surface dune forms on the floor of an unnamed crater in Noachis Terra. Orbit Number: 67200 Latitude: -45.445 Longitude: 36.7847 Instrument: VIS Captured: 2017-02-06 04:11 https://photojournal.jpl.nasa.gov/catalog/PIA21522
Today's VIS image shows a sand sheet with surface dune forms on the floor of an unnamed crater in Terra Cimmeria. Orbit Number: 67171 Latitude: -64.7606 Longitude: 158.647 Instrument: VIS Captured: 2017-02-03 18:44 https://photojournal.jpl.nasa.gov/catalog/PIA21521
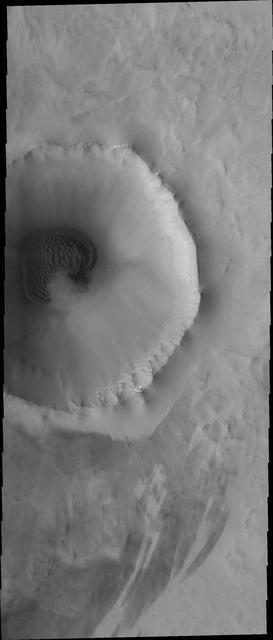
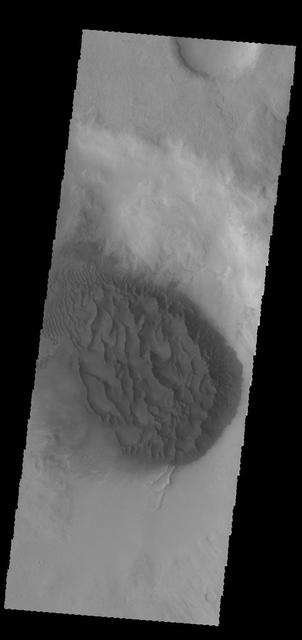
This image captured by NASA's 2001 Mars Odyssey spacecraft shows a portion of the dune sheet and other dune forms on the floor of Proctor Crater. Orbit Number: 67406 Latitude: -47.2898 Longitude: 30.5462 Instrument: VIS Captured: 2017-02-23 03:04 https://photojournal.jpl.nasa.gov/catalog/PIA21657
This image captured by NASA 2001 Mars Odyssey spacecraft shows a large sand sheet with surface dune forms on the floor of an unnamed crater in Noachis Terra. Orbit Number: 58336 Latitude: -48.6161 Longitude: 34.0534 Instrument: VIS Captured: 2015-02-07 02:22 http://photojournal.jpl.nasa.gov/catalog/PIA19275
This VIS image shows part of the large sand sheet with surface dune forms on the floor of Charlier Crater in Terra Sirenum. Orbit Number: 91804 Latitude: -68.028 Longitude: 190.573 Instrument: VIS Captured: 2022-08-25 10:08 https://photojournal.jpl.nasa.gov/catalog/PIA25644
This image captured by NASA 2001 Mars Odyssey spacecraft shows part of the large sand sheet with surface dune forms on the floor of Charlier Crater in Terra Sirenum. Orbit Number: 67288 Latitude: -68.1351 Longitude: 191.161 Instrument: VIS Captured: 2017-02-13 09:50 https://photojournal.jpl.nasa.gov/catalog/PIA21526
This image captured by NASA 2001 Mars Odyssey spacecraft shows part of the floor of an unnamed crater in Noachis Terra. The floor contains a sand sheet with dune forms. Orbit Number: 59110 Latitude: -51.6718 Longitude: 26.1336 Instrument: VIS Captured: 2015-04-11 19:58 http://photojournal.jpl.nasa.gov/catalog/PIA19478
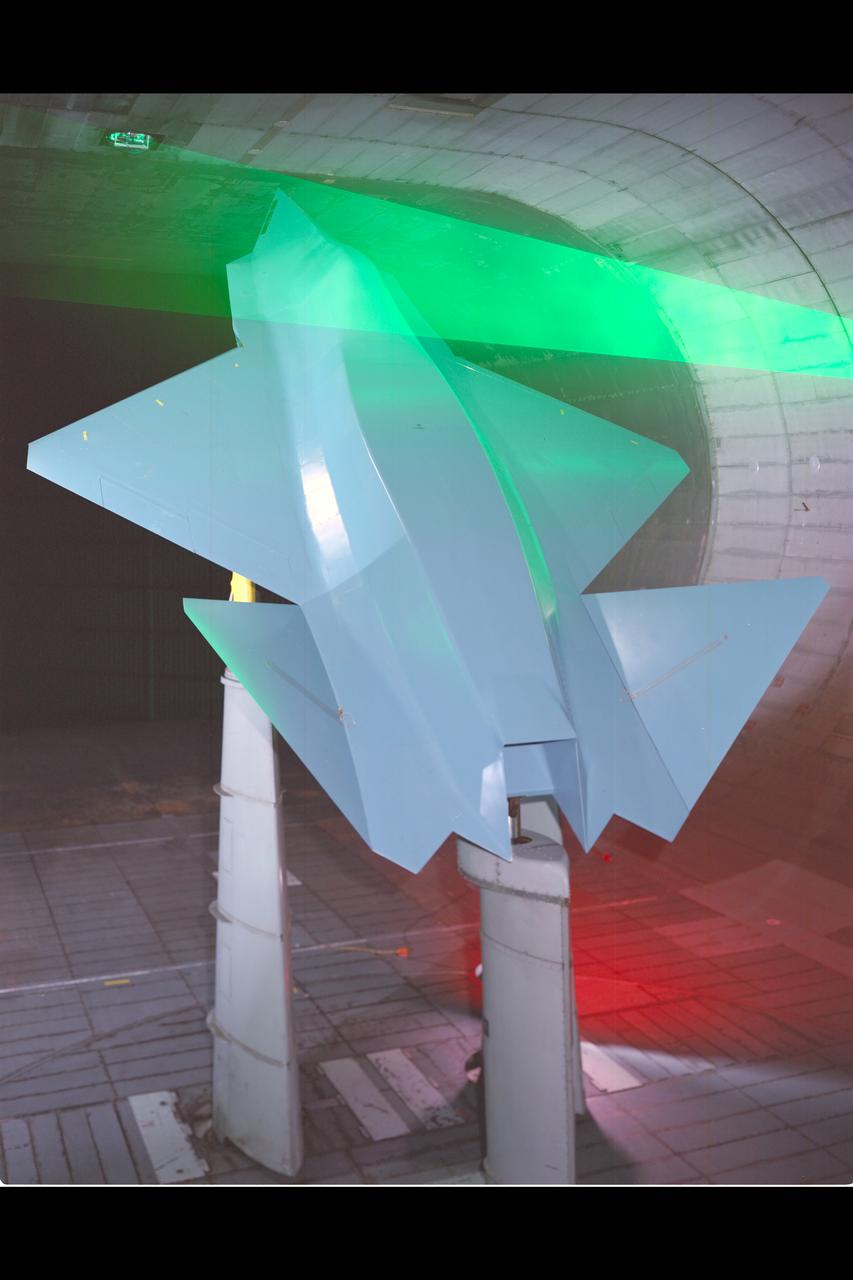
55% SHARC model in 40x80ft w.t. test-597 with laser sheet
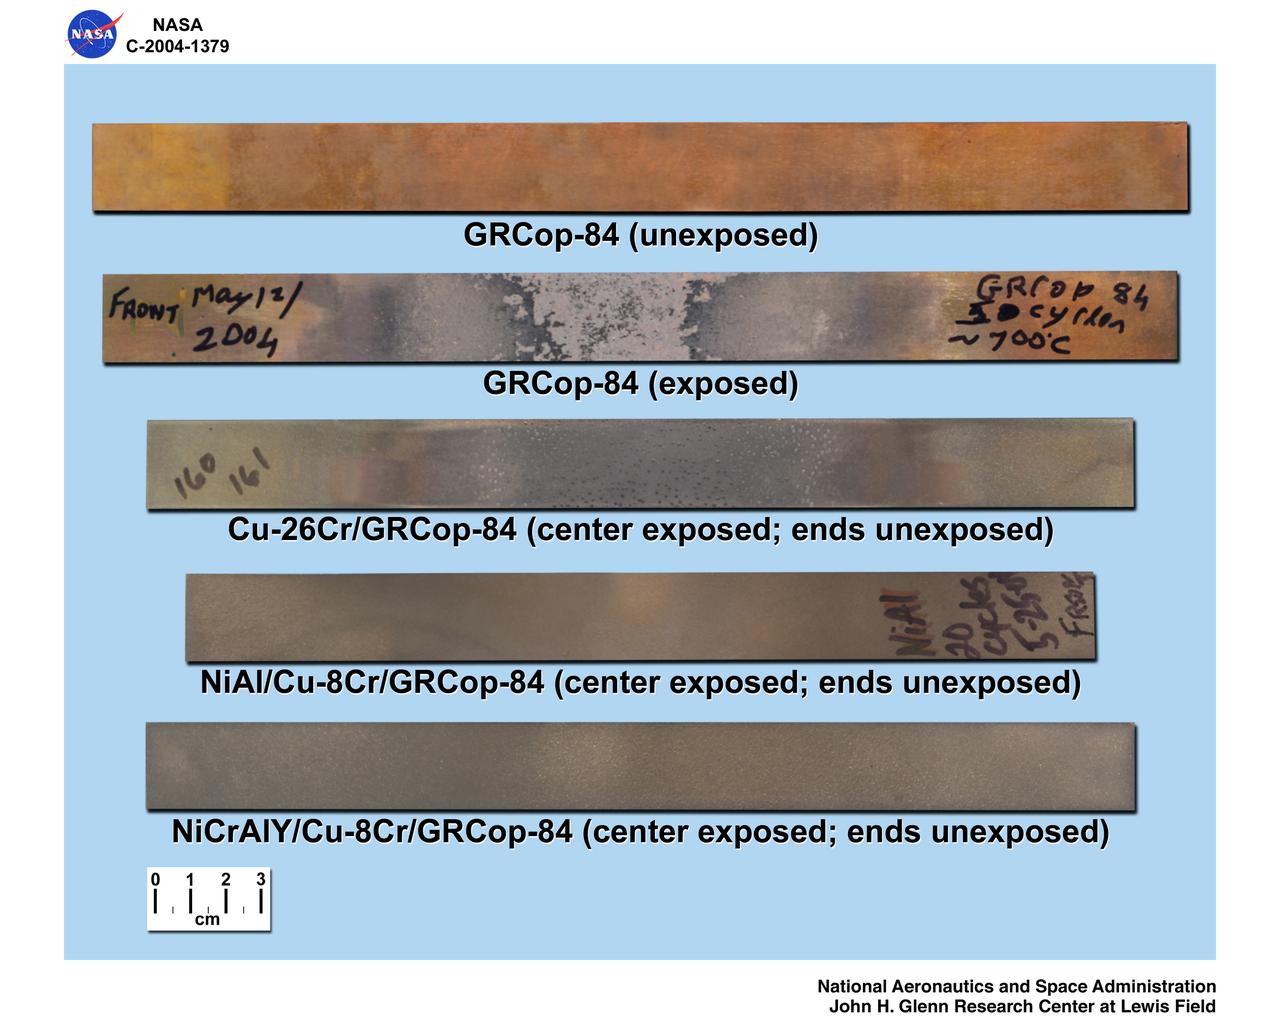
Quare Rig exposed coated and uncoated GRCop-84 sheet specimens
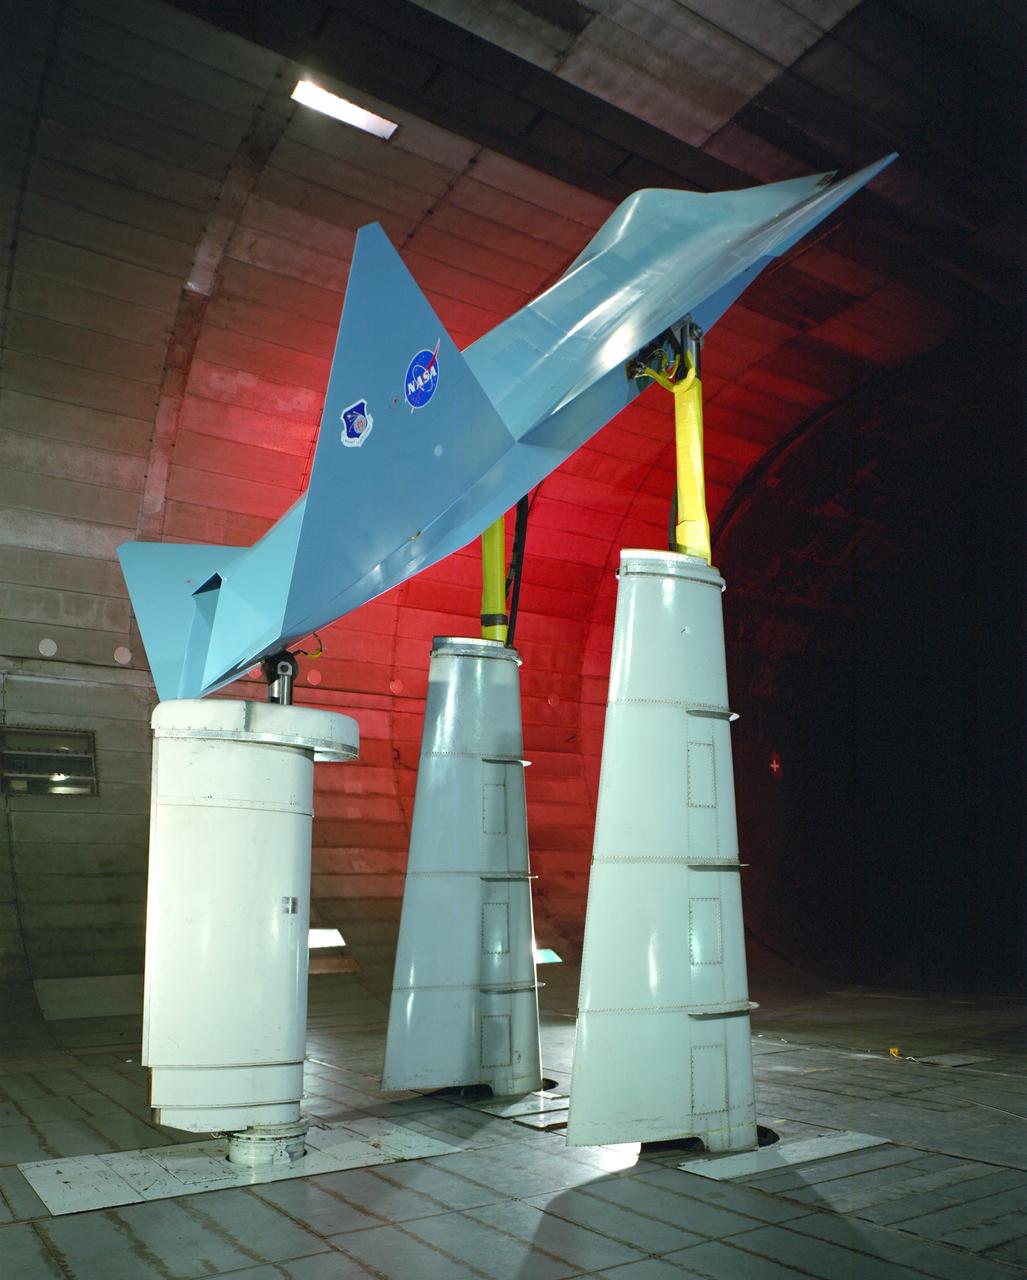
55% SHARC model in 40x80ft w.t. test-597 with laser sheet