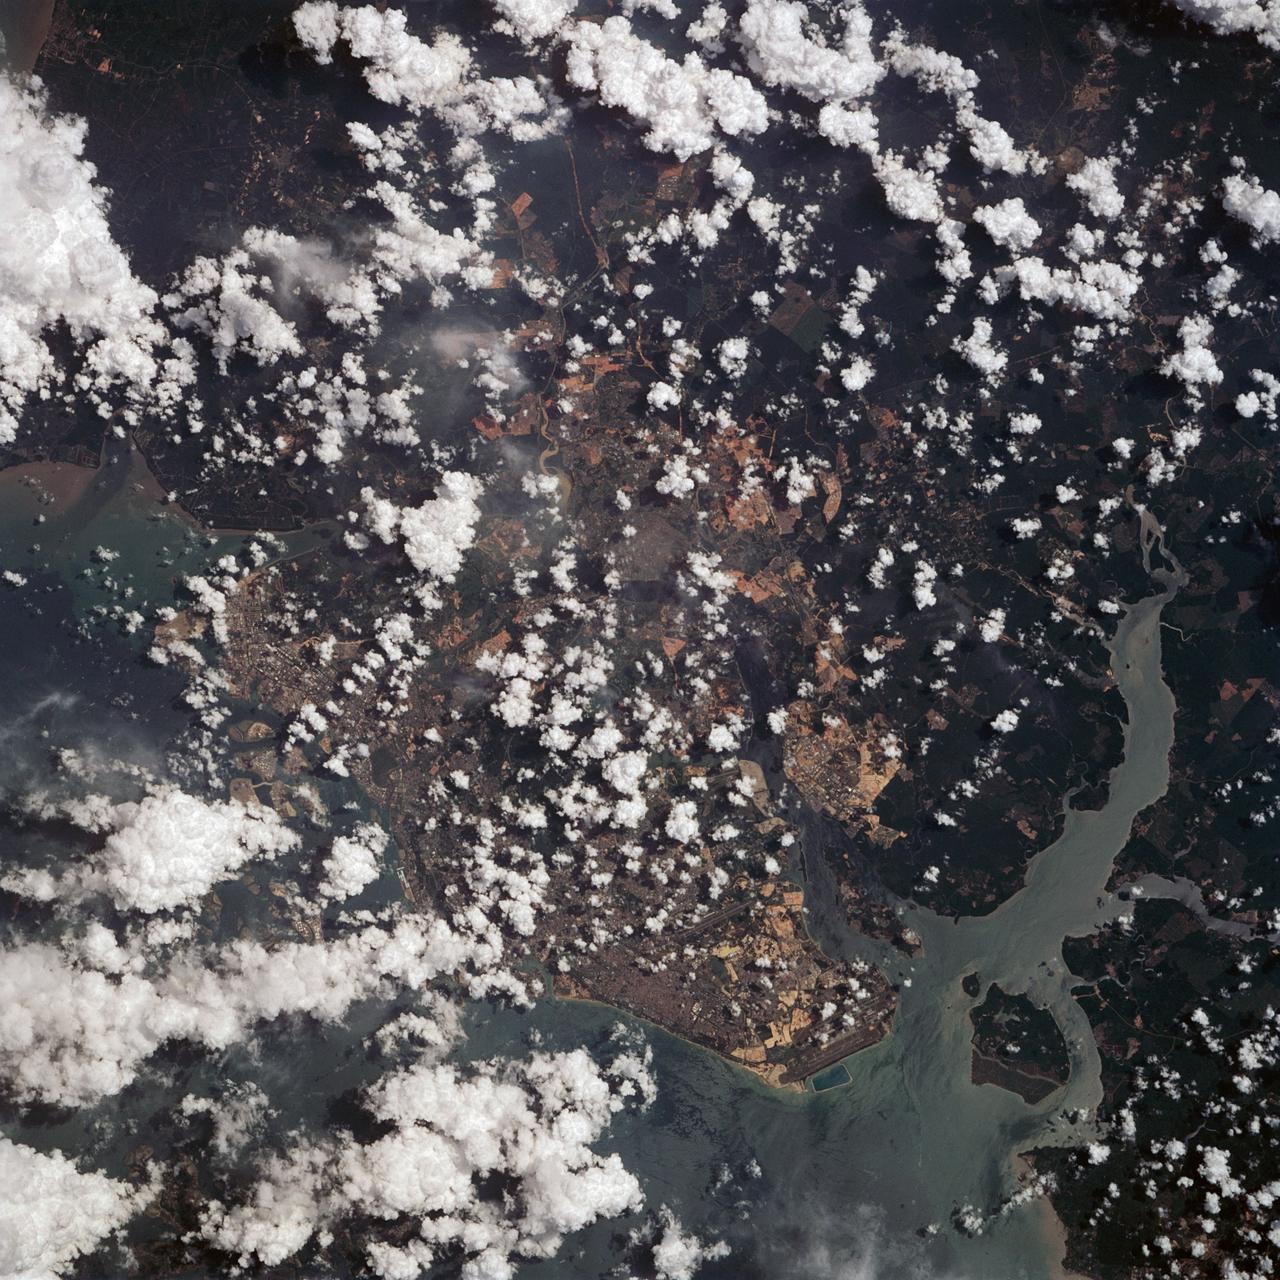
This view of the Malay Peninsula shows the city state of Singapore, Malaysia (1.5N, 104.0E) with all its urban, industrial and commercial land use areas. Singapore is located at the south tip of the Malay peninsula separated by the Johor Strait. The prosporous island state, once Asia's major trade center, is now highly industrialized despite its small size and its ideal location has made this island a hub of trade, shipping and service industries.
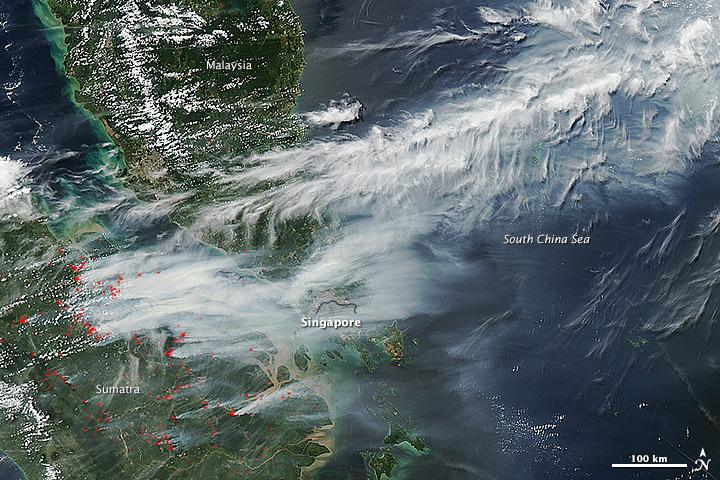
On June 19, 2013, NASA’s Aqua satellite captured a striking image of smoke billowing from illegal wildfires on the Indonesian island of Sumatra. The smoke blew east toward southern Malaysia and Singapore, and news media reported that thick clouds of haze had descended on Singapore, pushing pollution levels to record levels. Singapore’s primary measure of pollution, the Pollutant Standards Index (PSI)—a uniform measure of key pollutants similar to the Air Quality Index (AQI) used by the U.S. Environmental Protection Agency—spiked to 371 on the afternoon of June 20, 2013, the highest level ever recorded. The previous record occurred in 1997, when the index hit 226. Health experts consider any level above 300 to be “hazardous” to human health. Levels above 200 are considered “very unhealthy.” The image above was captured by the Moderate Resolution Imaging Spectroradiometer (MODIS), an instrument that observes the entire surface of Earth’s every 1 to 2 days. The image was captured during the afternoon at 6:30 UTC (2:30 p.m. local time). Though local laws prohibit it, farmers in Sumatra often burn forests during the dry season to prepare soil for new crops. The BBC reported that Singapore’s Prime Minister Lee Hsien Loong warned that the haze could “easily last for several weeks and quite possibly longer until the dry season ends in Sumatra.” NASA image by Jeff Schmaltz, LANCE/EOSDIS Rapid Response. Caption by Adam Voiland. Credit: <b><a href="http://www.earthobservatory.nasa.gov/" rel="nofollow"> NASA Earth Observatory</a></b> Instrument: Aqua - MODIS <b><a href="http://www.nasa.gov/audience/formedia/features/MP_Photo_Guidelines.html" rel="nofollow">NASA image use policy.</a></b> <b><a href="http://www.nasa.gov/centers/goddard/home/index.html" rel="nofollow">NASA Goddard Space Flight Center</a></b> enables NASA’s mission through four scientific endeavors: Earth Science, Heliophysics, Solar System Exploration, and Astrophysics. Goddard plays a leading role in NASA’s accomplishments by contributing compelling scientific knowledge to advance the Agency’s mission. <b>Follow us on <a href="http://twitter.com/NASA_GoddardPix" rel="nofollow">Twitter</a></b> <b>Like us on <a href="http://www.facebook.com/pages/Greenbelt-MD/NASA-Goddard/395013845897?ref=tsd" rel="nofollow">Facebook</a></b> <b>Find us on <a href="http://instagram.com/nasagoddard?vm=grid" rel="nofollow">Instagram</a></b>
On June 19, 2013, NASA’s Aqua satellite captured a striking image of smoke billowing from illegal wildfires on the Indonesian island of Sumatra. The smoke blew east toward southern Malaysia and Singapore, and news media reported that thick clouds of haze had descended on Singapore, pushing pollution levels to record levels. Singapore’s primary measure of pollution, the Pollutant Standards Index (PSI)—a uniform measure of key pollutants similar to the Air Quality Index (AQI) used by the U.S. Environmental Protection Agency—spiked to 371 on the afternoon of June 20, 2013, the highest level ever recorded. The previous record occurred in 1997, when the index hit 226. Health experts consider any level above 300 to be “hazardous” to human health. Levels above 200 are considered “very unhealthy.” The image above was captured by the Moderate Resolution Imaging Spectroradiometer (MODIS), an instrument that observes the entire surface of Earth’s every 1 to 2 days. The image was captured during the afternoon at 6:30 UTC (2:30 p.m. local time). Though local laws prohibit it, farmers in Sumatra often burn forests during the dry season to prepare soil for new crops. The BBC reported that Singapore’s Prime Minister Lee Hsien Loong warned that the haze could “easily last for several weeks and quite possibly longer until the dry season ends in Sumatra.” NASA image by Jeff Schmaltz, LANCE/EOSDIS Rapid Response. Caption by Adam Voiland. Credit: <b><a href="http://www.earthobservatory.nasa.gov/" rel="nofollow"> NASA Earth Observatory</a></b> Instrument: Aqua - MODIS <b><a href="http://www.nasa.gov/audience/formedia/features/MP_Photo_Guidelines.html" rel="nofollow">NASA image use policy.</a></b> <b><a href="http://www.nasa.gov/centers/goddard/home/index.html" rel="nofollow">NASA Goddard Space Flight Center</a></b> enables NASA’s mission through four scientific endeavors: Earth Science, Heliophysics, Solar System Exploration, and Astrophysics. Goddard plays a leading role in NASA’s accomplishments by contributing compelling scientific knowledge to advance the Agency’s mission. <b>Follow us on <a href="http://twitter.com/NASA_GoddardPix" rel="nofollow">Twitter</a></b> <b>Like us on <a href="http://www.facebook.com/pages/Greenbelt-MD/NASA-Goddard/395013845897?ref=tsd" rel="nofollow">Facebook</a></b> <b>Find us on <a href="http://instagram.com/nasagoddard?vm=grid" rel="nofollow">Instagram</a></b>
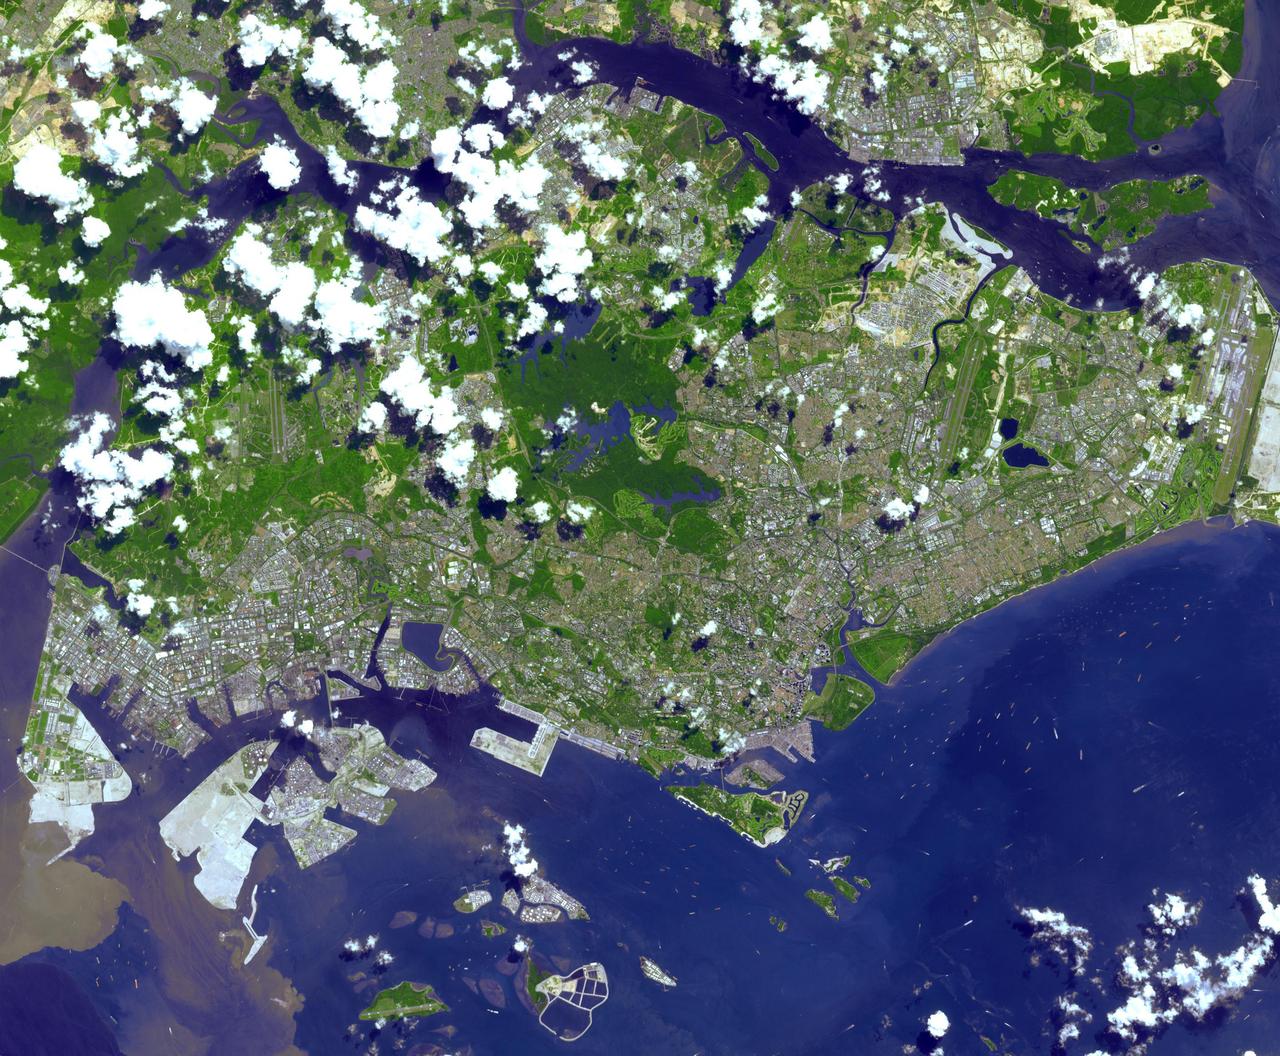
This image from NASA Terra spacecraft is of the Republic of Singapore, a city-state off the southern tip of the Malay Peninsula. An island country made up of 63 islands, the country is largely urbanized with very little rain forest left.
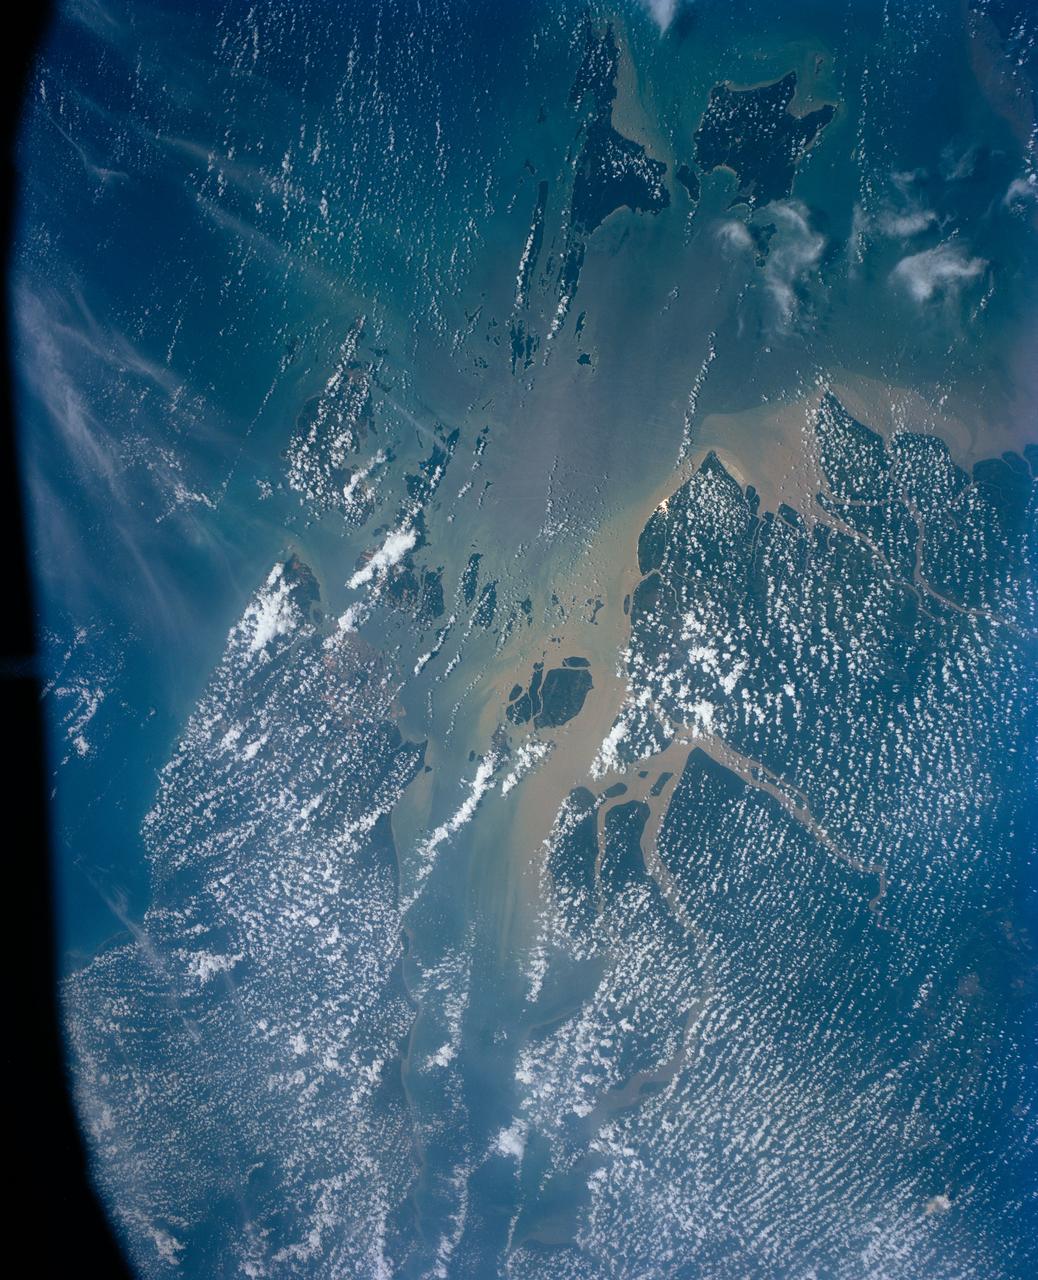
This view shows the area around Northeastern Sumatra, Indonesia (1.0N, 104.0E). The city of Singapore and the Singapore Strait is in the center at the southern tip of the Malay Peninsula. The Singapore Strait is the eastern extension of the Strait of Malacca and separates the Malay Peninsula from Sumatra. Large sediment plumes from the rivers attest to the local soil erosion and industrial dumping ofd wastes.
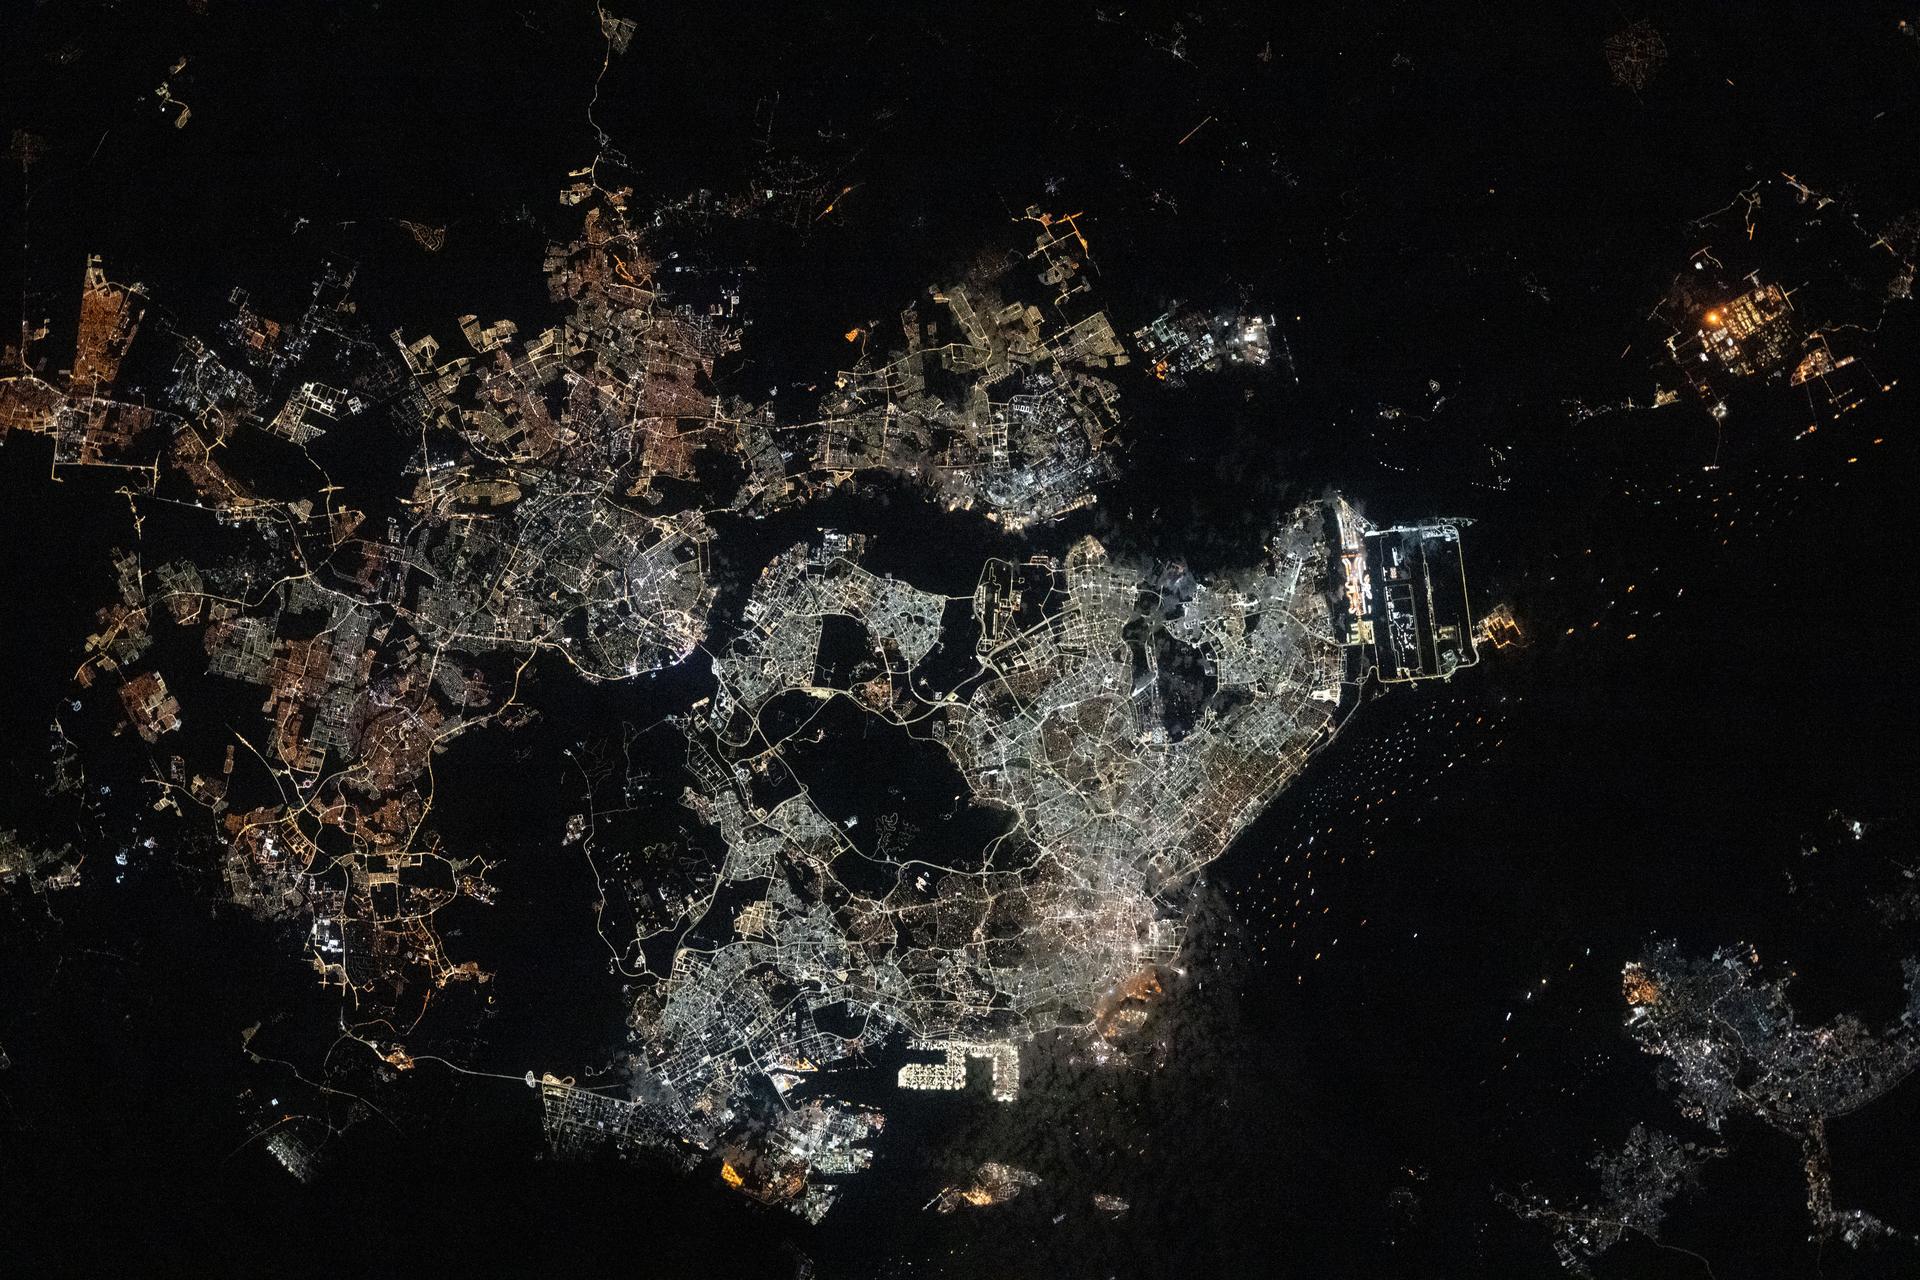
iss073e0763866 (Sept. 21, 2025) --- The Southeast Asian city-state of Singapore (center), separated from Johor Bahru, Malaysia (left), by the Johor Strait, is pictured at approximately 12:34 a.m. from the International Space Station as it orbited 260 miles above. Singapore Changi Airport (right center) sits along the Straits of Singapore and features the world’s tallest indoor waterfall and a forest with over 2,000 trees and 100,000 shrubs. The bright rectangular area at bottom center is Pasir Panjang Terminal, designed to accommodate some of the world’s largest container vessels.
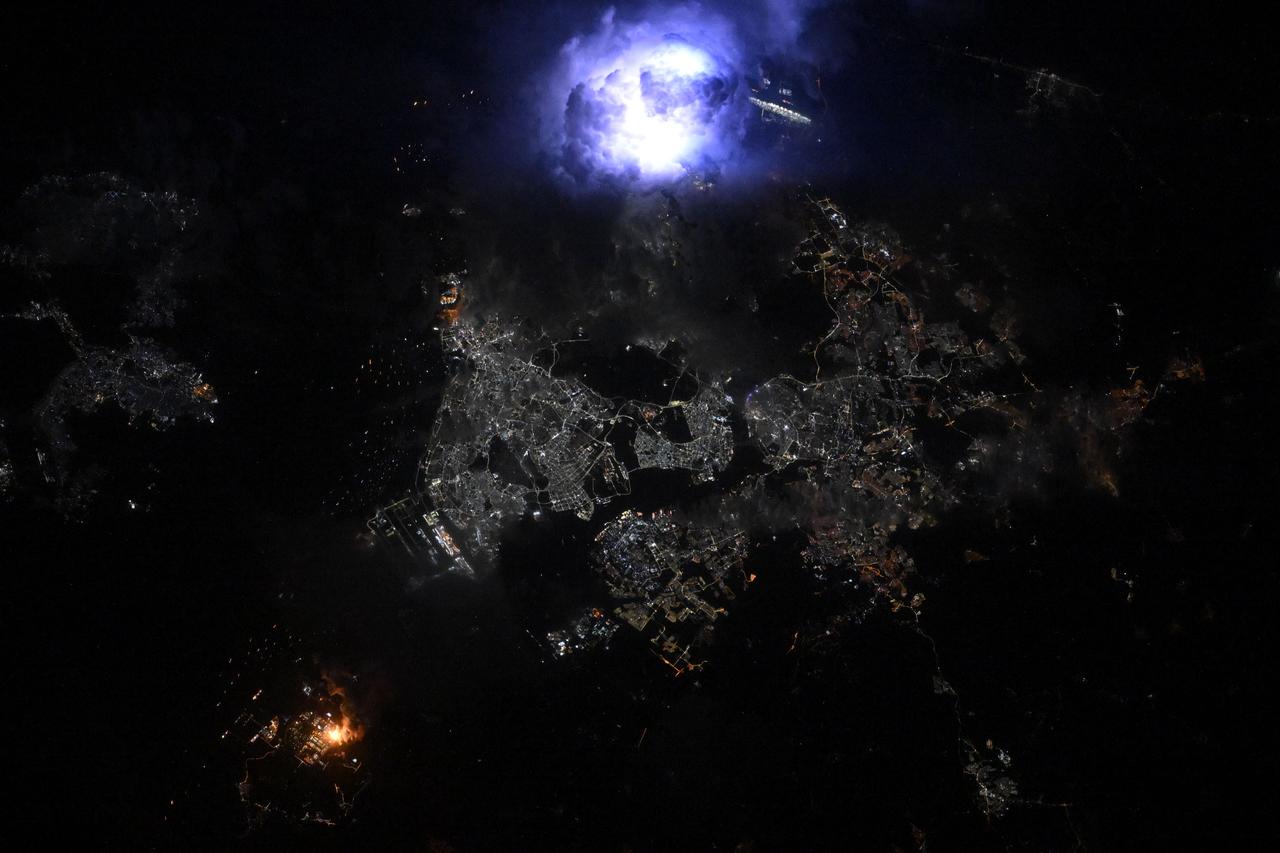
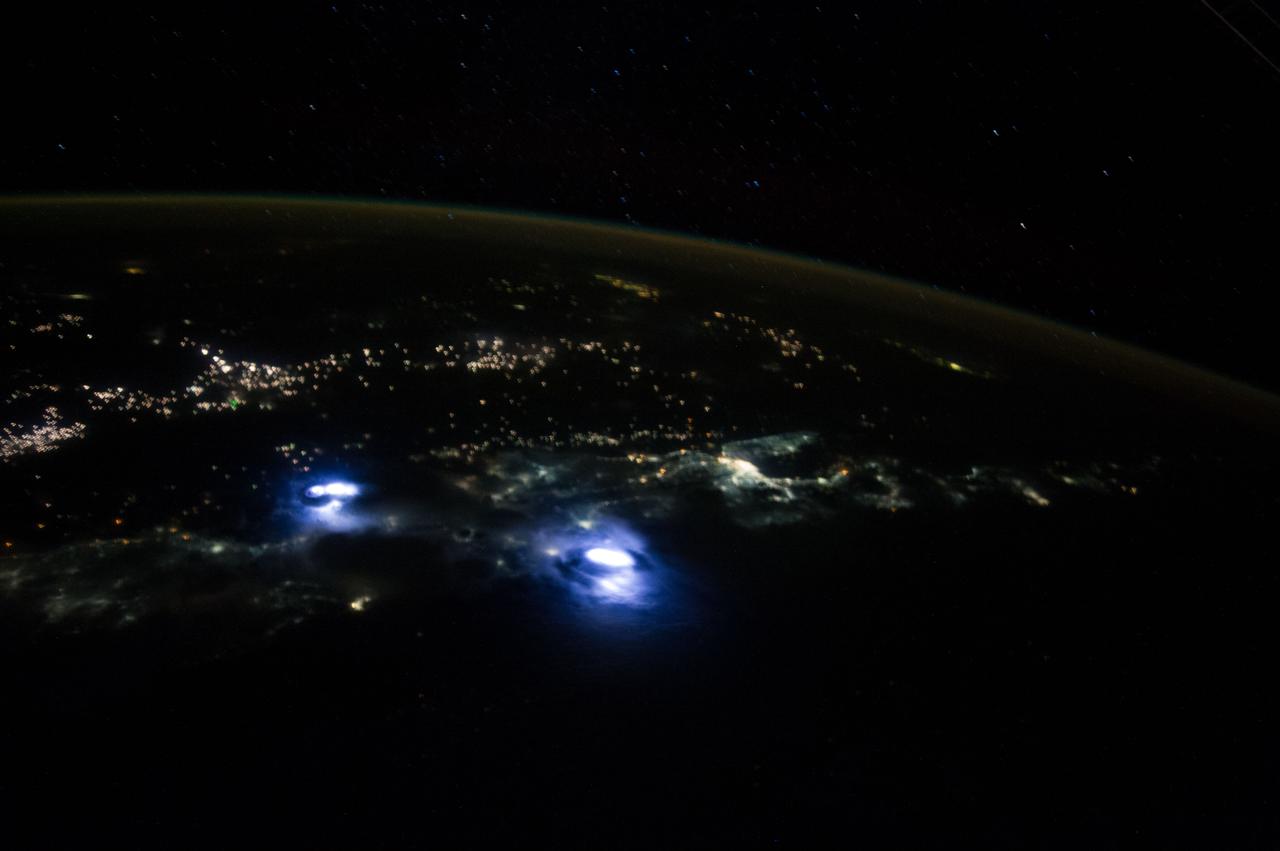
iss073e0300048 (June 15, 2025) --- Lightning (top center) is captured striking and illuminating the clouds during a storm over the Southeast Asian city-state of Singapore separated from the Malaysian city of Johor Bahru by the Johor Strait. Singapore's population is just over 6 million while Johor Bahru's is nearly 860,000. The International Space Station was orbiting 259 miles above the South China Sea at approximately 3:18 a.m. local time when this photograph was taken.
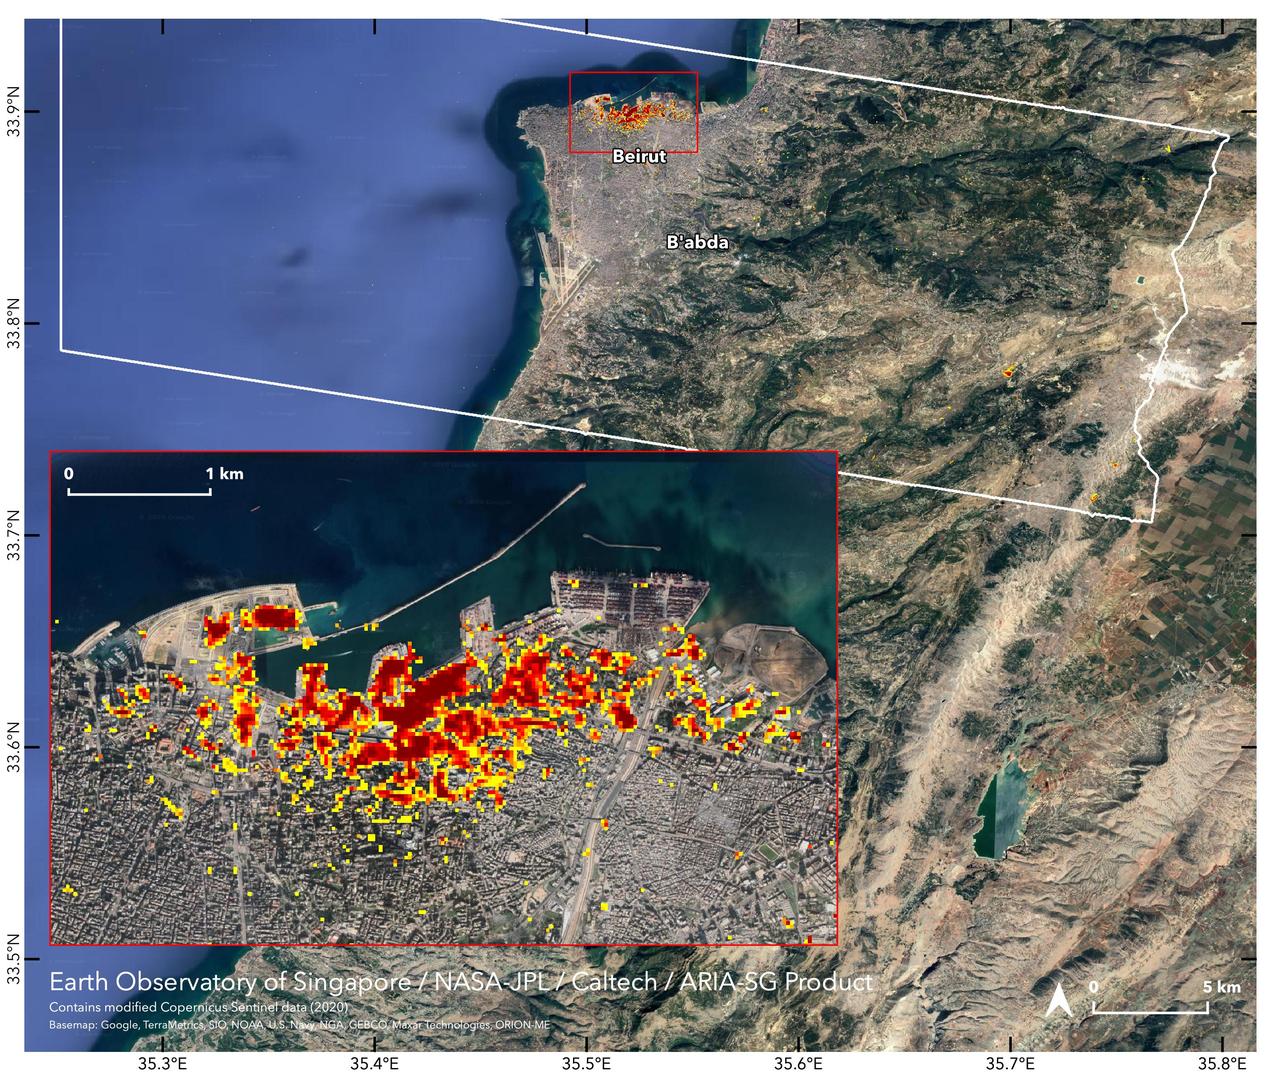
NASA's ARIA team, in collaboration with the Earth Observatory of Singapore, used satellite data to map the extent of likely damage following a massive explosion in Beirut. Dark red pixels represent the most severe damage. Areas in orange are moderately damaged, and areas in yellow are likely to have sustained somewhat less damage. Each colored pixel represents an area of 30 meters (33 yards). https://photojournal.jpl.nasa.gov/catalog/PIA23692
Earth observation taken during a night pass by the Expedition 40 crew aboard the International Space Station (ISS). Folder lists this as: night approach to Singapore.

The Advanced Rapid Imaging and Analysis (ARIA) team at NASA's Jet Propulsion Laboratory in Pasadena, California, in collaboration with the Earth Observatory of Singapore (EOS), created this flood map depicting areas of the Bahamas that are likely flooded (shown by light blue pixels) as a result of Hurricane Dorian. The map was derived from synthetic aperture radar (SAR) data acquired on Sept. 2, 2019, by the European Union's Copernicus Sentinel-1 satellites operated by the European Space Agency (ESA). The map covers an area of 109 miles by 106 miles (176 kilometers by 170 kilometers) shown by the large red polygon. Each pixel measures about 32 yards (30 meters) across. This map can be used as guidance to identify areas that are likely flooded, and may be less reliable over urban and vegetated areas. The image contains modified Copernicus Sentinel data (2019) processed by ESA and analyzed by NASA, JPL-Caltech, ARIA, and EOS. This work was funded by NASA along with the Earth Observatory of Singapore and a Singapore National Research Foundation Investigatorship. https://photojournal.jpl.nasa.gov/catalog/PIA23360

iss059e103862 (6/17/2019) --- Photo documentation taken of the JEM Small Satellite Orbital Deployer #11 (J-SSOD #11) micro-satellite deployment mission. SpooQy-1 is a 3-Unit (3U) CubeSat deployed during the J-SSOD #11 mission. SpooQy-1 was developed by the National University of Singapore (NUS).

iss059e104863 (6/17/2019) --- Photo documentation taken of the JEM Small Satellite Orbital Deployer #11 (J-SSOD #11) micro-satellite deployment mission. SpooQy-1 is a 3-Unit (3U) CubeSat deployed during the J-SSOD #11 mission. SpooQy-1 was developed by the National University of Singapore (NUS).
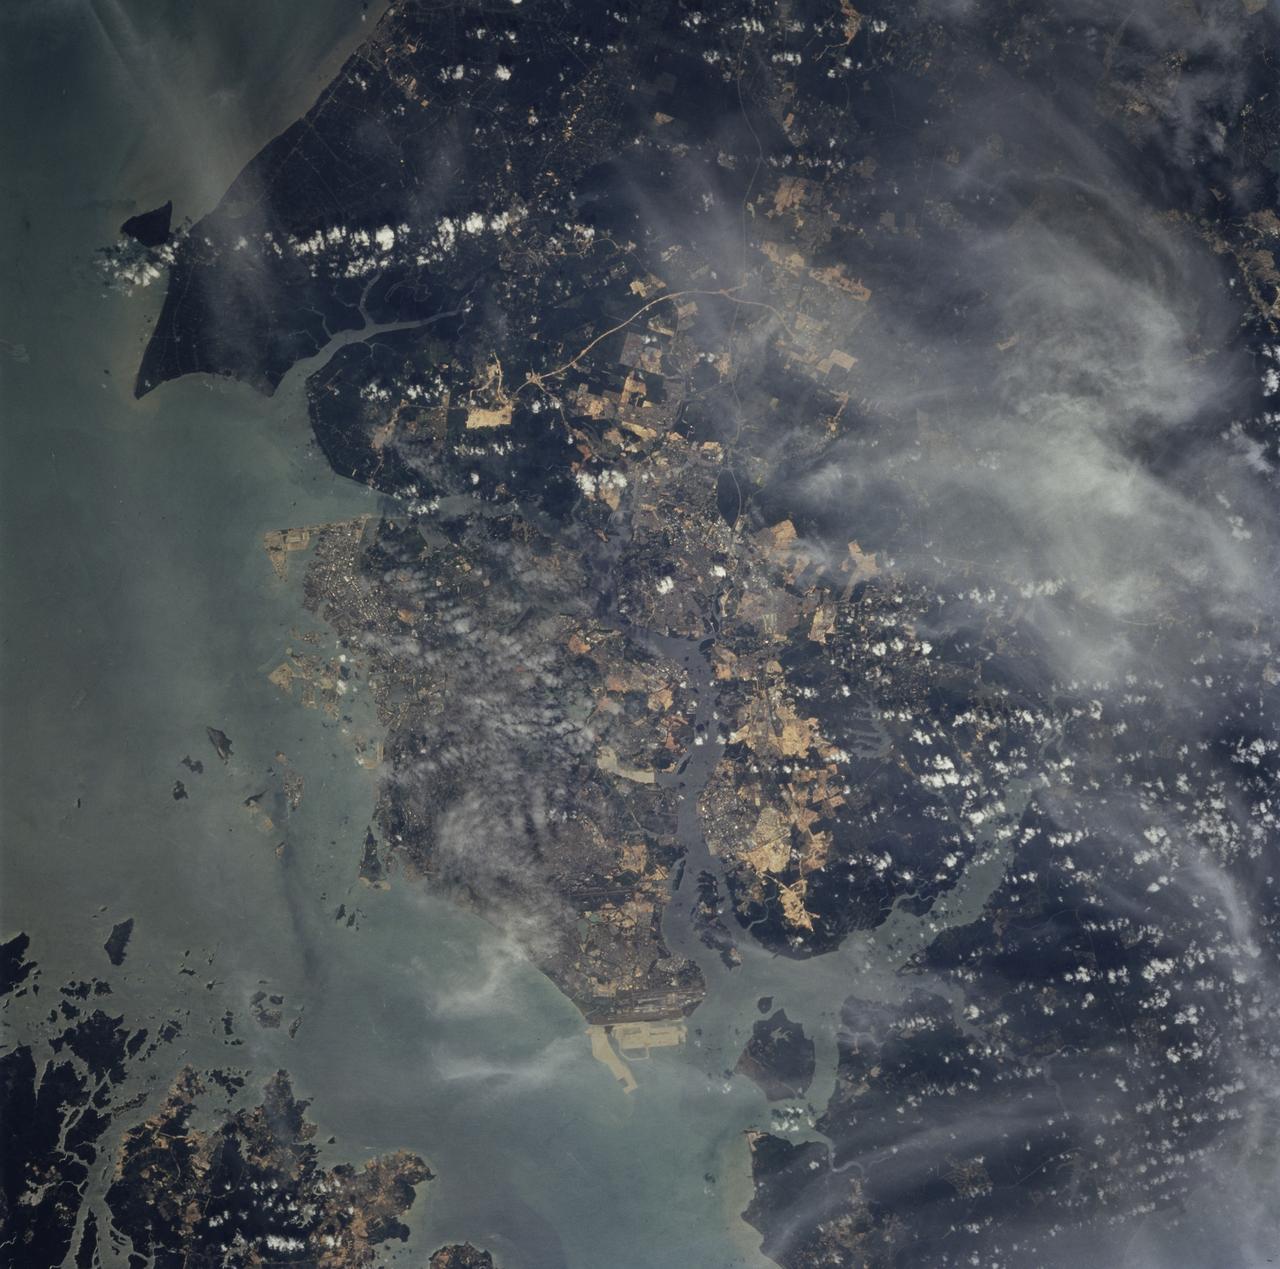
STS081-750-048 (12-22 Jan. 1997) --- This photograph, made with a handheld 70mm camera aimed through the Space Shuttle Atlantis' overhead windows, shows the entire city-state of Singapore with its urban, industrial and commercial land use areas. Singapore is located at the tip of the Malay peninsula separated by Johor strait. This prosperous island state, once Asia's major trade center, is now highly industrialized despite its small area. The ideal location has made this island a hub of trade, shipping and service industries. This photograph shows the urban land uses and a large airport on the island. Several commercial harbors are seen on this photograph. The three large reservoirs in the center of the photograph are obscured by the clouds.

iss059e102911 (6/13/2019 --- Photo documentation taken aboard the International Space Station (ISS) of the JEM Small Satellite Orbital Deployer #11 (J-SSOD #11) micro-satellite deployment mission. J-SSOD#11 deploys the BIRDS-3 Project and Spooky-1 satellites. BIRDS-3 Project is a constellation of three 1U CubeSats developed by Japan, Nepal and Sri Lanka. SpooQy-1 is a 3-Unit (3U) CubeSat developed by the National University of Singapore (NUS).
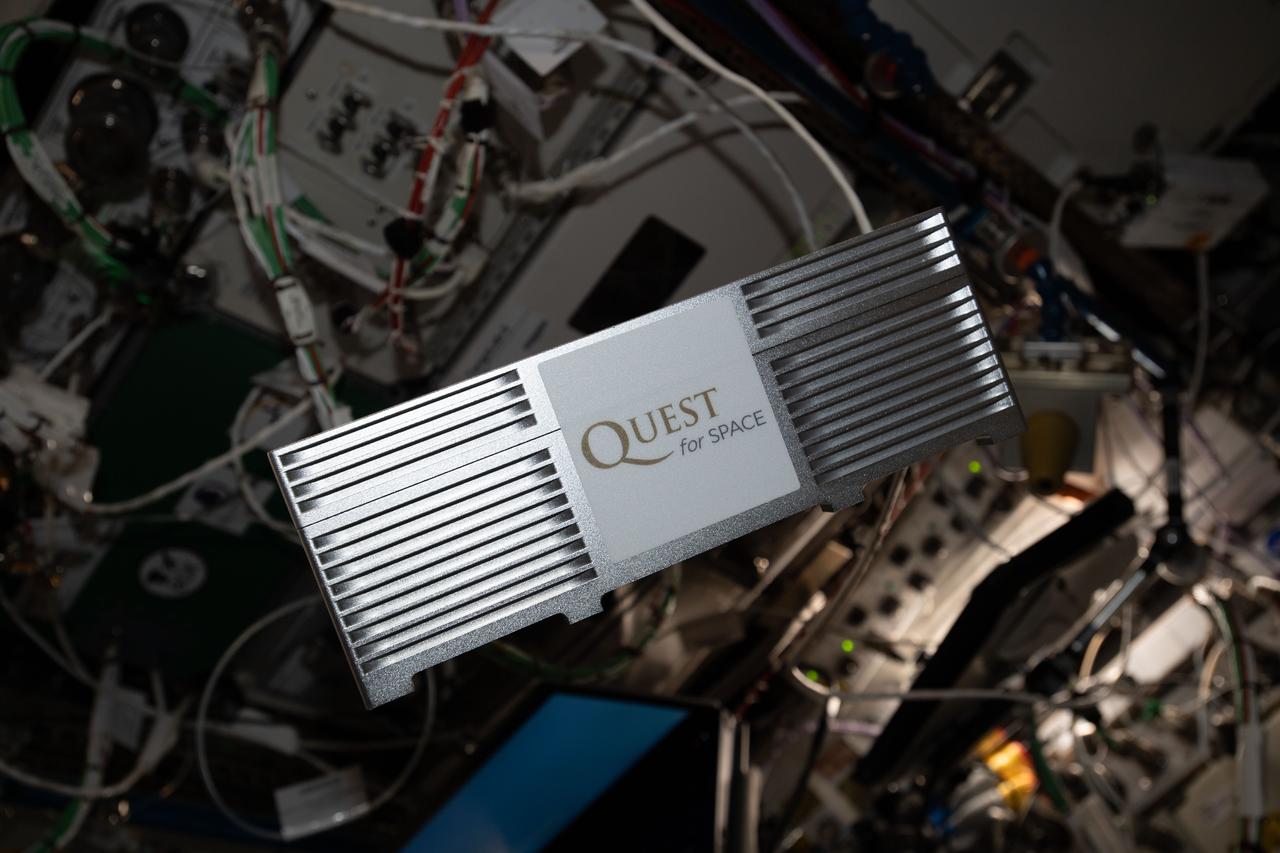
iss062e034557 (2/19/2020) --- A view of the Quest Institute-NanoLab Unit 3 investigation aboard the International Space Station (ISS). Quest Institute-NanoLab Unit 3 contains 15 Nano-Lab experiments from students in the United States and Singapore. Student-developed spaceflight experiments empower students with real-world science experience.

iss050e031525 (1/16/2017) --- Photo documentation of the Japanese-Small Satellite Orbital Deployer-6 (J-SSOD-6) deployment of the AOBA-Velox-3 Cubesat. The AOBA-Velox-3 mission is a joint mission between Nanyang Technological University (NTU), Singapore and the Kyushu Institute of Technology (Kyutech), Japan. This 2-Unit (2U) micro-satellite tests a micro-propulsion system, Pulse Plasma Thruster, PPT designed by NTU, that allows the spacecraft to remain in orbit up to six months.
iss050e031566 (1/16/2017) --- Photo documentation of the Japanese-Small Satellite Orbital Deployer-6 (J-SSOD-6) deployment of the AOBA-Velox-3 Cubesat. The AOBA-Velox-3 mission is a joint mission between Nanyang Technological University (NTU), Singapore and the Kyushu Institute of Technology (Kyutech), Japan. This 2-Unit (2U) micro-satellite tests a micro-propulsion system, Pulse Plasma Thruster, PPT designed by NTU, that allows the spacecraft to remain in orbit up to six months.

iss062e102749 (3/19/2020) --- A view of the Quest Institute-NanoLab Unit 3 investigation aboard the International Space Station (ISS). Quest Institute-NanoLab Unit 3 contains 15 Nano-Lab experiments from students in the United States and Singapore. Student-developed spaceflight experiments empower students with real-world science experience.
![iss056e200730 (10/3/2018) --- Photo documentation of the JEM Small Satellite Orbital Deployer (SSOD) on the Multi-Purpose Experiment Platform (MPEP) installation in preparation of the [Japanese Experiment Module]-Small Satellite Orbital Deployer 10 (J-SSOD 10) mission. J-SSOD-10 deploys the cubesats SPATIUM-I from Nanyang Technological University, Singapore, and the Kyushu Institute of Technology, Japan, RSP-00 from Ryman Sat Spaces General Incorporated Association, Japan, and STARS-Me from Shizuoka University, Japan.](https://images-assets.nasa.gov/image/iss056e200730/iss056e200730~medium.jpg)
iss056e200730 (10/3/2018) --- Photo documentation of the JEM Small Satellite Orbital Deployer (SSOD) on the Multi-Purpose Experiment Platform (MPEP) installation in preparation of the [Japanese Experiment Module]-Small Satellite Orbital Deployer 10 (J-SSOD 10) mission. J-SSOD-10 deploys the cubesats SPATIUM-I from Nanyang Technological University, Singapore, and the Kyushu Institute of Technology, Japan, RSP-00 from Ryman Sat Spaces General Incorporated Association, Japan, and STARS-Me from Shizuoka University, Japan.

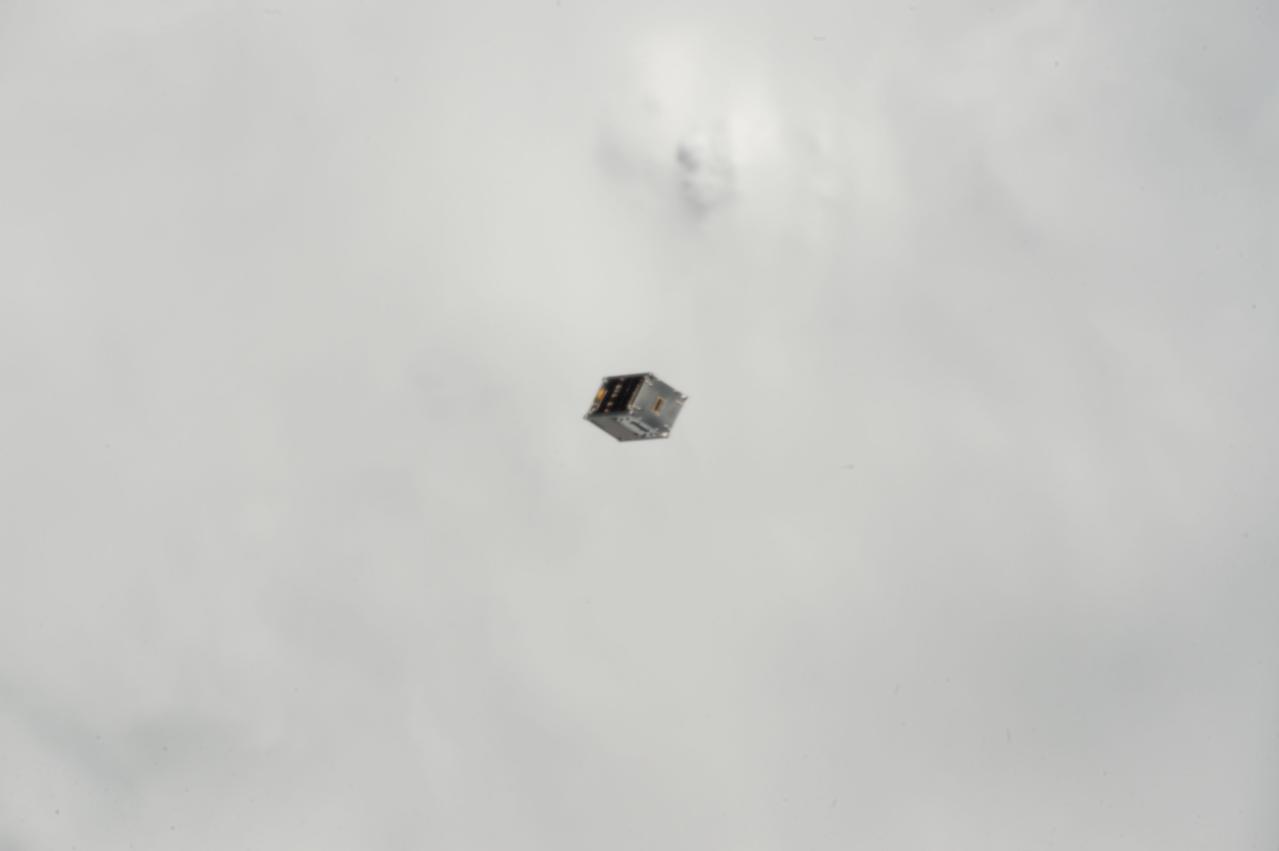
iss059e104368 (June 17, 2019) --- A tiny satellite from Singapore, also known as a CubeSat, is ejected from the Japanese Small Satellite Orbital Deployer past the International Space Station's solar arrays. The CubeSat was among three others from Asian nations deployed earlier for technology demonstrations in Earth orbit. The orbital complex was 254 miles above the Atlantic Ocean northeast of Venezuela when an Expedition 59 crewmember took this photograph.

Typhoon Hagibis, one of the most destructive storms to hit Japan in decades, made landfall on Saturday, Oct. 12, 2019 southwest of Tokyo with wind speeds equivalent to a Category 3 hurricane. The damage it left in its wake is visible from space. NASA's Advance Rapid Imaging and Analysis (ARIA) team, in collaboration with the Earth Observatory of Singapore (EOS), used satellite data to create this map showing areas in Japan that are likely damaged as a result of Typhoon Hagibis. The color variation from yellow to red indicates increasingly more significant ground surface change, or damage. The map was produced using synthetic aperture radar (SAR) data from the Copernicus Sentinel-1 satellites operated by the European Space Agency (ESA). The pre-event images were taken on Oct. 7, 2019, and the post-event image was acquired about 12 hours after the typhoon's landfall. The map covers an area of 155 miles by 220 miles (250 kilometers by 350 kilometers) indicated by the red polygon. The map was delivered to Sentinel Asia, a consortium that supports disaster management across the Asia-Pacific region using space-based technologies. Maps like this one can be used as guidance to help responders identify damaged areas and to allocate resources accordingly. The map may be less reliable over vegetated or badly flooded areas. https://photojournal.jpl.nasa.gov/catalog/PIA23424
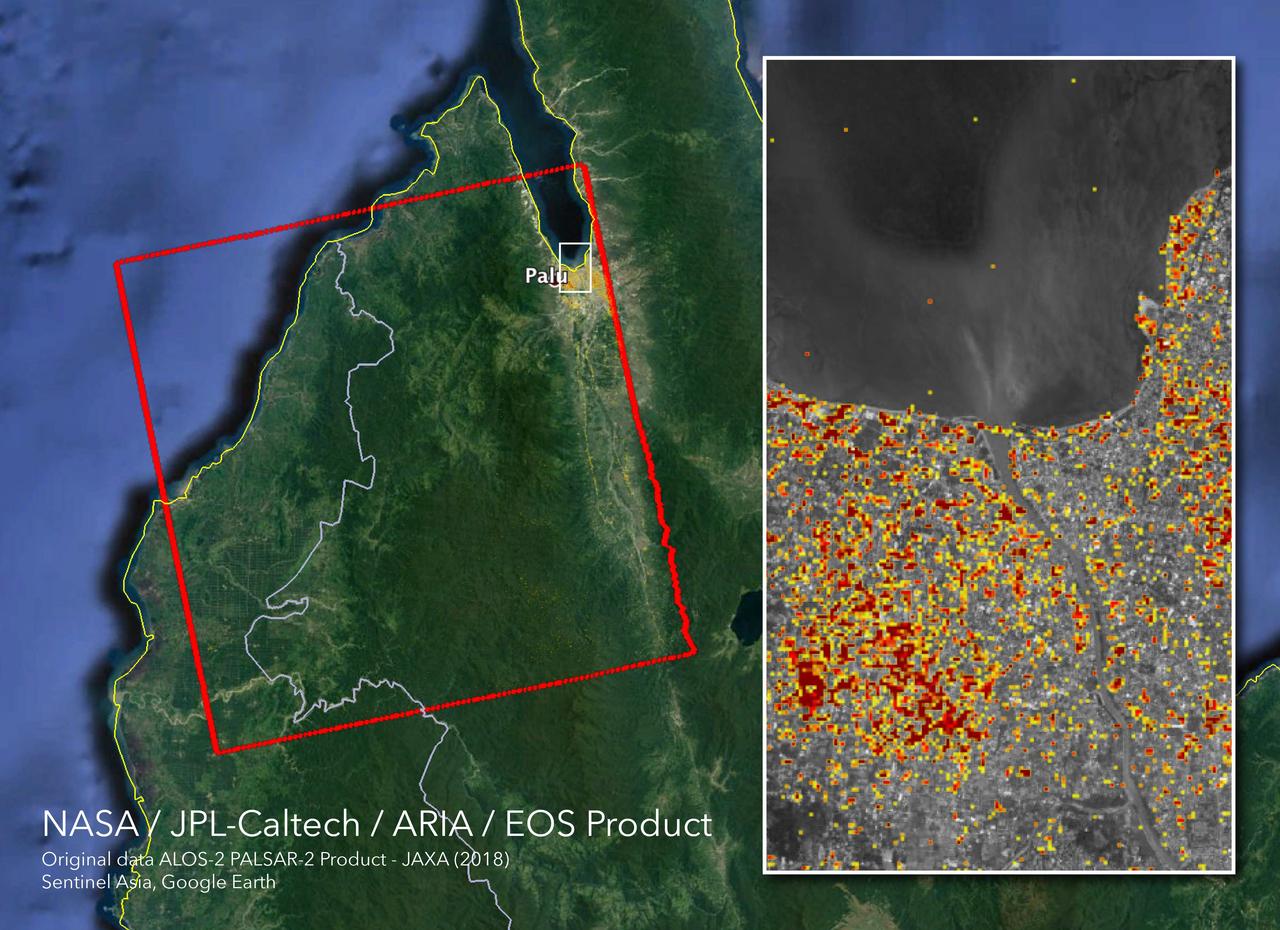
The Advanced Rapid Imaging and Analysis (ARIA) team at NASA's Jet Propulsion Laboratory in Pasadena, California, and Caltech, also in Pasadena, created this Damage Proxy Map (DPM) depicting areas in Central Sulawesi, Indonesia, including the city of Palu, that are likely damaged (shown by red and yellow pixels) as a result of the magnitude 7.5 September 28, 2018 earthquake. The map is derived from synthetic aperture radar (SAR) images from the ALOS-2 satellite, operated by Japan Aerospace Exploration Agency (JAXA). The images were taken before (Aug. 8, 2018) and after (Oct. 3, 2018) the earthquake. The map covers an area of 42 by 44 miles (67 by 70 kilometers), shown by the large red polygon. Each pixel measures about 33 yards (30 meters) across. The color variation from yellow to red indicates increasingly more significant ground surface change. Preliminary validation was done in collaboration with the Earth Observatory of Singapore by comparing with local media information and photos. This damage proxy map should be used as guidance to identify damaged areas, and may be less reliable over vegetated areas. For example, the scattered single colored pixels over vegetated areas may be false positives, and the lack of colored pixels over vegetated areas does not necessarily mean no damage. The DPM was created by the NASA-JPL/Caltech ARIA team, and the ALOS-2 data were provided by JAXA. The Earth Observatory of Singapore coordinated with the Sentinel Asia to timely task the ALOS-2 satellite. The algorithm development was carried out at JPL under a contract with NASA. https://photojournal.jpl.nasa.gov/catalog/PIA22746
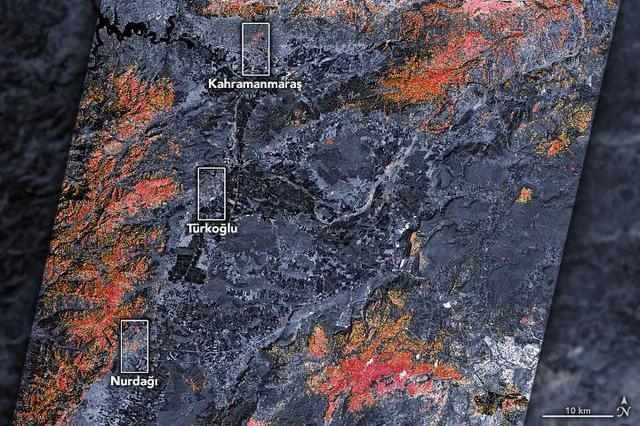
The magnitude 7.8 and 7.5 earthquakes that struck southern Turkey and western Syria on February 6, 2023, caused widespread destruction in both countries. The initial, stronger earthquake emanated from a fault 11 miles (18 kilometers) below the surface. The shallow depth meant the earthquake produced violent shaking that affected areas hundreds of miles from the epicenter, 16 miles (26 kilometers) east of the city of Nurdağı, Turkey. The second quake followed nine hours later, striking 6 miles (10 kilometers) deep, roughly 2.5 miles (4 kilometers) south-southeast of the Turkish town of Ekinözü. Hundreds of smaller aftershocks occurred in subsequent days. The preliminary damage proxy map above shows parts of the Turkish cities of Islahiye, Kahramanmaras, and Nurdağı. Dark red pixels represent areas likely to have severe damage to buildings, homes, and infrastructure or changes to landscape, while orange and yellow areas are moderately or partially damaged. Each pixel measures about 100 feet (30 meters) across (about the size of a baseball infield). The damage estimates are most accurate for urban areas and may be less accurate in the mountain and vegetated areas. The Earth Observatory of Singapore – Remote Sensing Lab and the Advanced Rapid Imaging and Analysis (ARIA) team at NASA's Jet Propulsion Laboratory and Caltech collaborated to derive the map from data collected by Japan's Advanced Land Observing Satellite-2 satellite (ALOS-2) on February 8, 2023. The satellite carries a synthetic aperture radar, a sensor that sends pulses of microwaves toward Earth's surface and records for the reflections of those waves to map the landscape, including buildings. By comparing the February 8 data to observations made by the same satellite before the earthquake (on April 7, 2021 and April 6, 2022), scientists tracked the changes and began to identify areas that were likely damaged. https://photojournal.jpl.nasa.gov/catalog/PIA25564
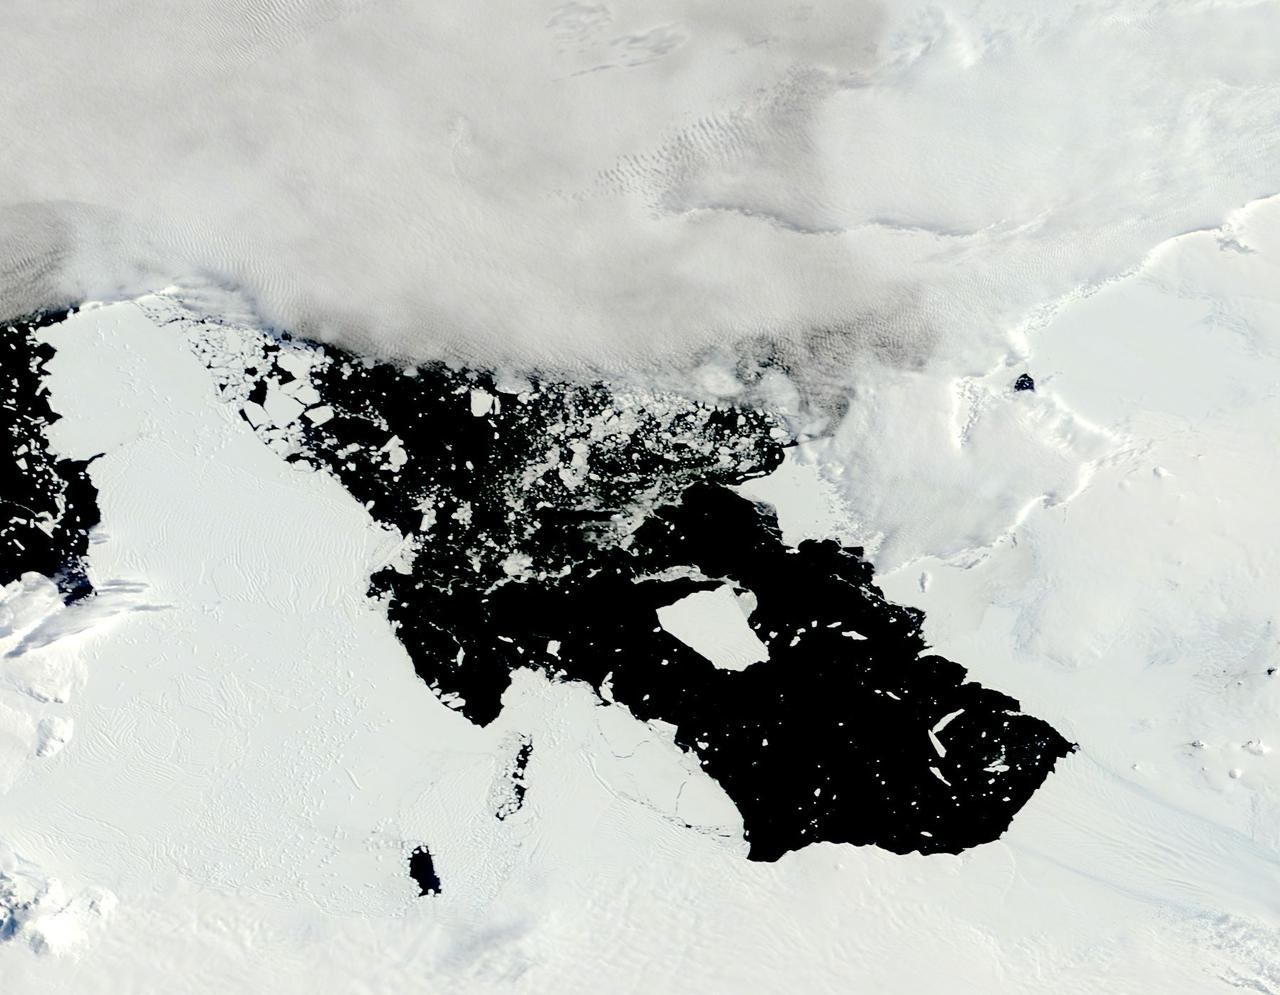
The voyage of Iceberg B-31 continued in January, 2014 as the giant iceberg drifted over the frigid waters of Pine Island Bay and widened the gap between the newly-calved iceberg and the “mother” glacier. Between November 9 and 11, 20143 a giant crack in the Pine Island Glacier gave completely away, liberating Iceberg B-31 from the end of the glacial tongue. The new iceberg was estimated to be 35 km by 20 km (21 mi by 12 mi) in size – or roughly the size of Singapore. On January 5, 2014 the Moderate Resolution Imaging Spectroradiometer (MODIS) aboard NASA’s Terra satellite captured this true-color image of B-31 floating in the center of Pine Island Bay on an approach to the Amundsen Sea. Pine Island Glacier can be seen on the upper right coast of the bay, and is marked by parallel lines in the ice. According to measurements reported by the National U.S. Ice Center, on January 10, B-31 was maintaining its size, and was located at 74°24'S and 104°33'W. Credit: NASA/GSFC/Jeff Schmaltz/MODIS Land Rapid Response Team <b><a href="http://www.nasa.gov/audience/formedia/features/MP_Photo_Guidelines.html" rel="nofollow">NASA image use policy.</a></b> <b><a href="http://www.nasa.gov/centers/goddard/home/index.html" rel="nofollow">NASA Goddard Space Flight Center</a></b> enables NASA’s mission through four scientific endeavors: Earth Science, Heliophysics, Solar System Exploration, and Astrophysics. Goddard plays a leading role in NASA’s accomplishments by contributing compelling scientific knowledge to advance the Agency’s mission. <b>Follow us on <a href="http://twitter.com/NASA_GoddardPix" rel="nofollow">Twitter</a></b> <b>Like us on <a href="http://www.facebook.com/pages/Greenbelt-MD/NASA-Goddard/395013845897?ref=tsd" rel="nofollow">Facebook</a></b> <b>Find us on <a href="http://instagrid.me/nasagoddard/?vm=grid" rel="nofollow">Instagram</a></b>

The Advanced Rapid Imaging and Analysis (ARIA) team at NASA's Jet Propulsion Laboratory in Pasadena, California, and Caltech, also in Pasadena, created this Damage Proxy Map (DPM) depicting areas in the northeastern part of Lombok Island, Indonesia, that are likely damaged (shown by red and yellow pixels) as a result of the major earthquake sequence (including the M6.4 July 29, the M6.9 August 5, the M5.9 August 9, and the M6.4 August 18 earthquakes) in 2018. The map is derived from synthetic aperture radar (SAR) images from the ALOS-2 satellites, operated by Japan Aerospace Exploration Agency (JAXA). The images were taken before the (May 13, 2018 00:30) and after the (August 19, 2018 00:30, both local time) earthquakes. The map covers an area of 73 by 70 kilometers, shown by the large red polygon. Each pixel measures about 30 meters across. The color variation from yellow to red indicates increasingly more significant ground surface change. Preliminary validation was done by comparing with the DigitalGlobe's high-resolution optical satellite imagery. This damage proxy map should be used as guidance to identify damaged areas, and may be less reliable over vegetated areas. For example, the scattered single colored pixels over vegetated areas may be false positives, and the lack of colored pixels over vegetated areas does not necessarily mean no damage. The DPM was created by the NASA-JPL/Caltech ARIA team, and the ALOS-2 data were provided by JAXA. The Earth Observatory of Singapore coordinated with the Sentinel Asia to timely task the ALOS-2 satellite. The algorithm development was carried out at JPL under a contract with NASA. https://photojournal.jpl.nasa.gov/catalog/PIA22495