Smog Moon
The Smog-bound Moon
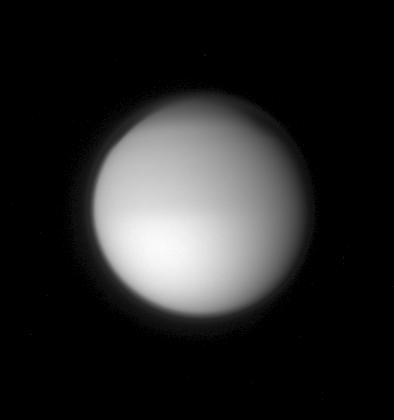
Titan golden, smog-like atmosphere and complex layered hazes appear to NASA Cassini Oribter as a luminous ring around the planet-sized moon.
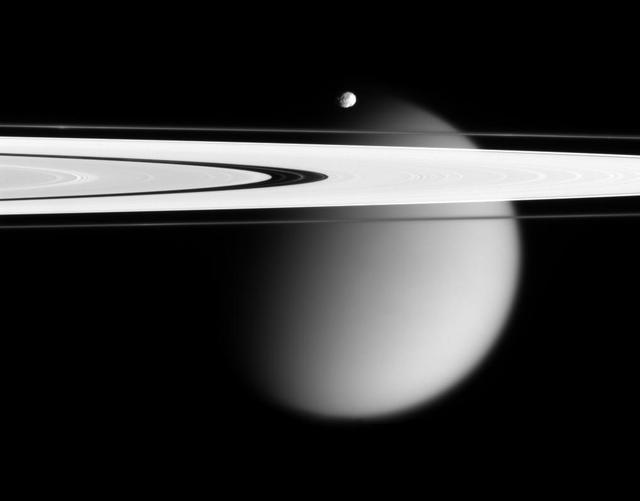
The Cassini spacecraft delivers this stunning vista showing small, battered Epimetheus and smog-enshrouded Titan, with Saturn A and F rings stretching across the scene

Straining to make out the surface of Titan through its murky atmosphere, the Cassini spacecraft wide angle camera manages to exploit one of the infrared spectral windows where the particulate smog is transparent enough for a peek
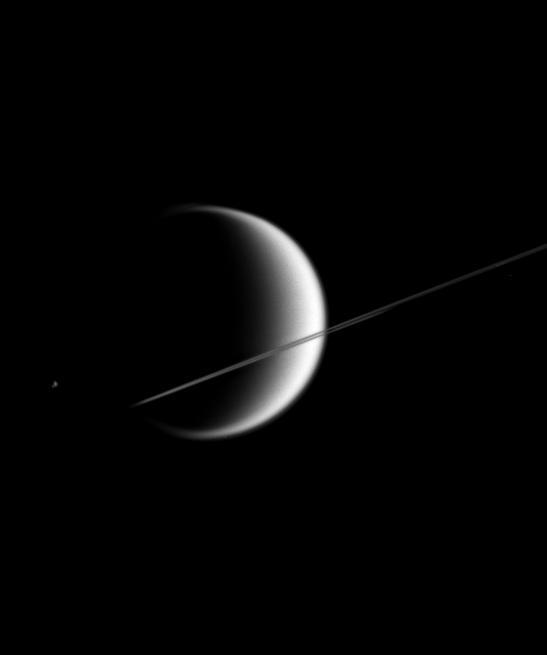
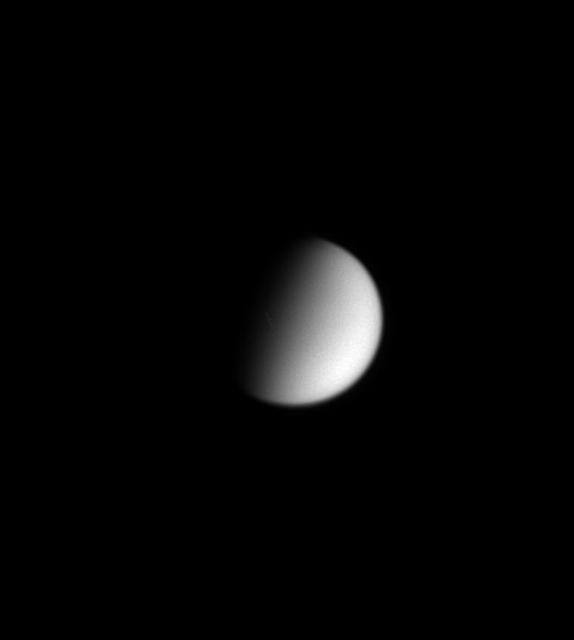
This poetic scene shows the giant, smog-enshrouded moon Titan behind Saturn nearly edge-on rings. Much smaller Epimetheus 116 kilometers, or 72 miles across is just visible to the left of Titan 5,150 kilometers, or 3,200 miles across
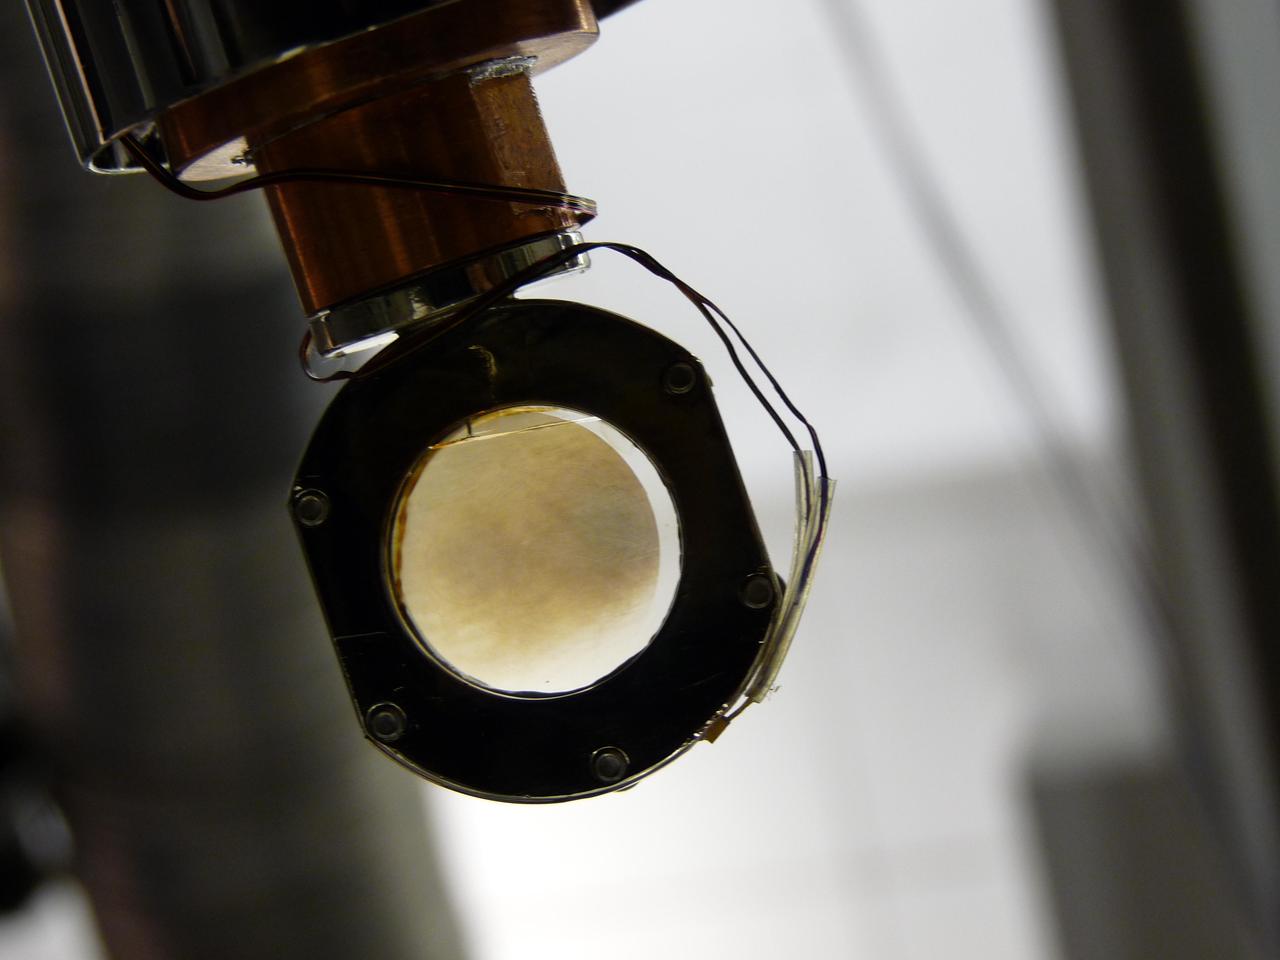
In a laboratory experiment at NASA Jet Propulsion Laboratory, Pasadena, Calif., scientists simulate the atmosphere of Saturn moon Titan. In this picture, molecules of dicyanoacetylene are seen on a special film on a sapphire window.
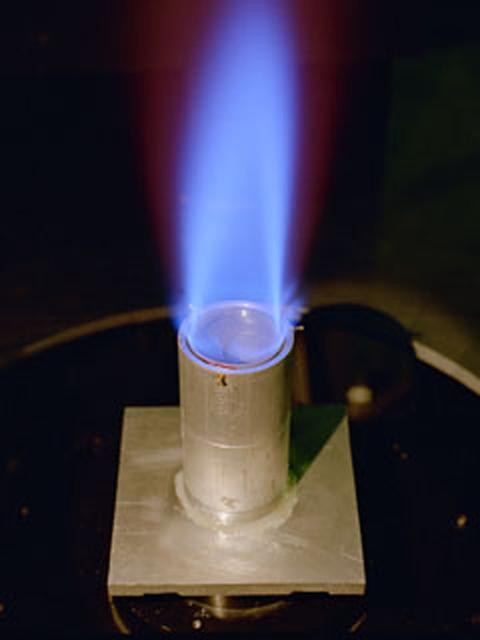
The Ring Flame Stabilizer has been developed in conjunction with Lewis Research Center. This device can lower pollutant emissions (which contribute to smog and air pollution) from natural-gas appliances such as furnaces and water heaters by 90 percent while improving energy efficiency by 2 percent.
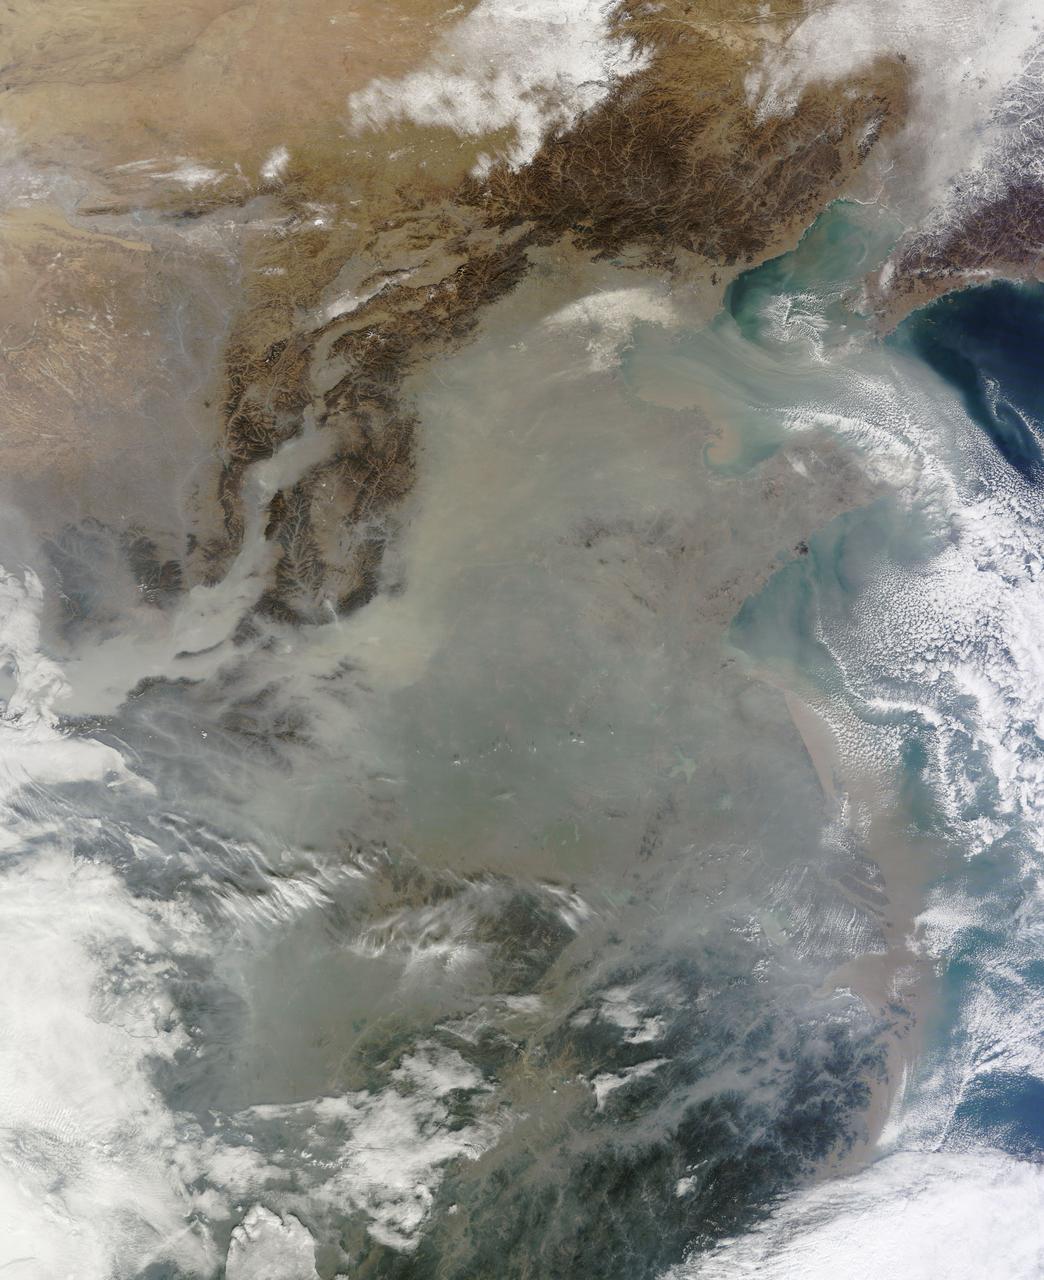
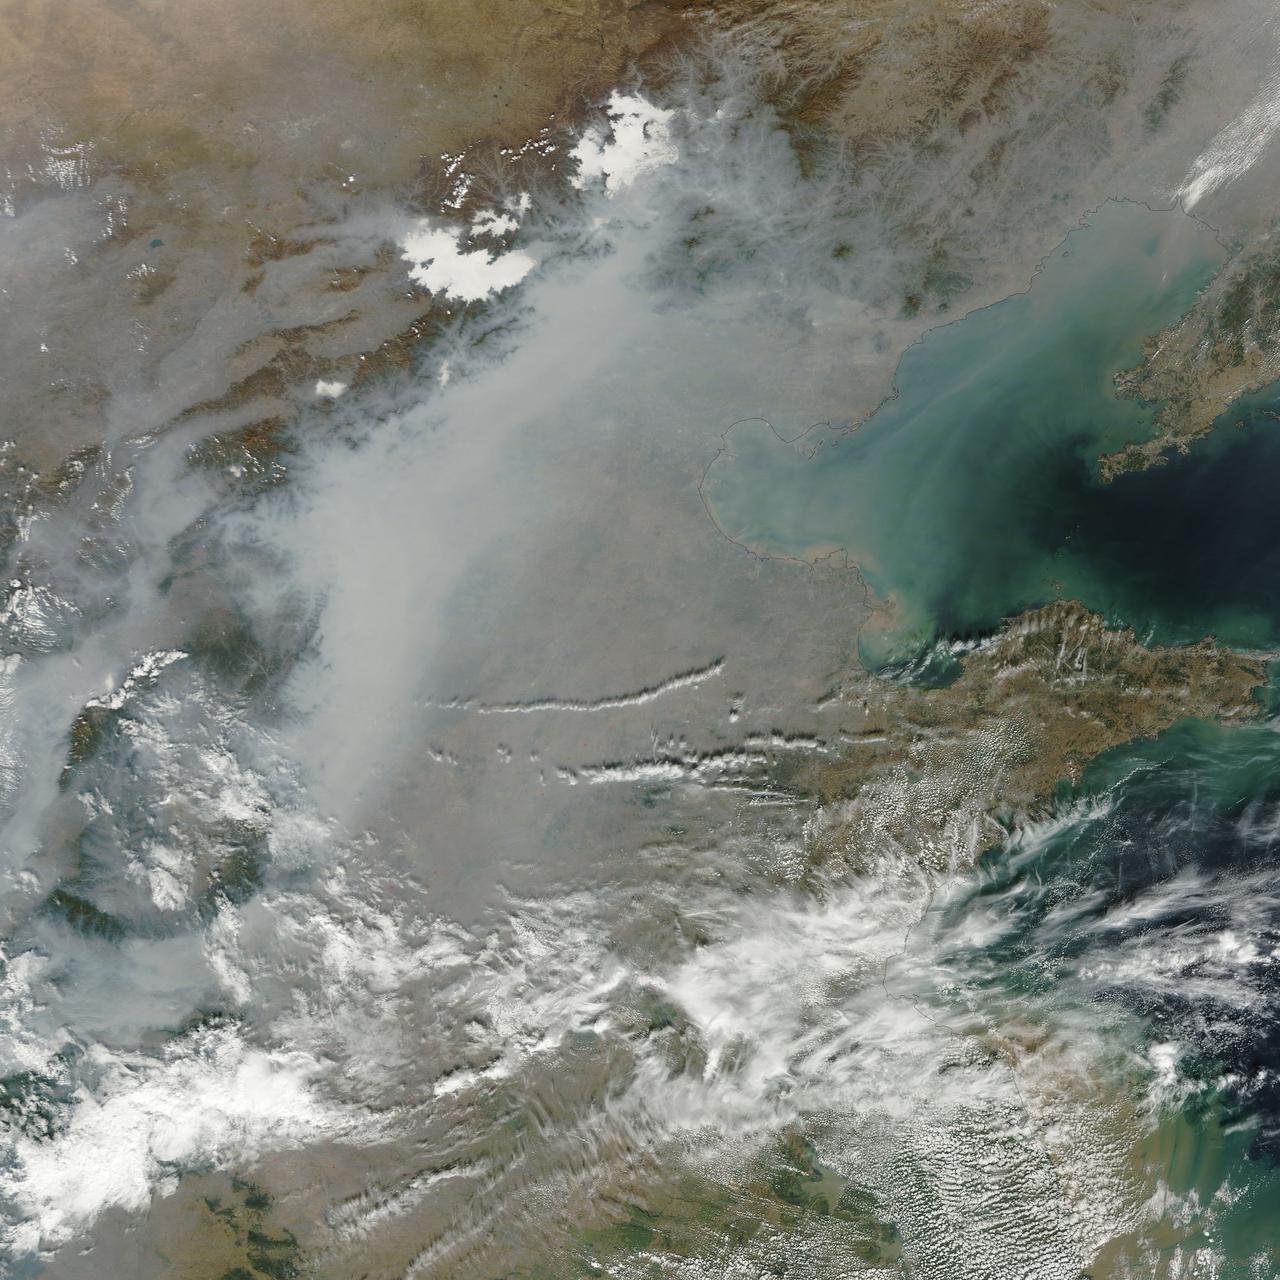
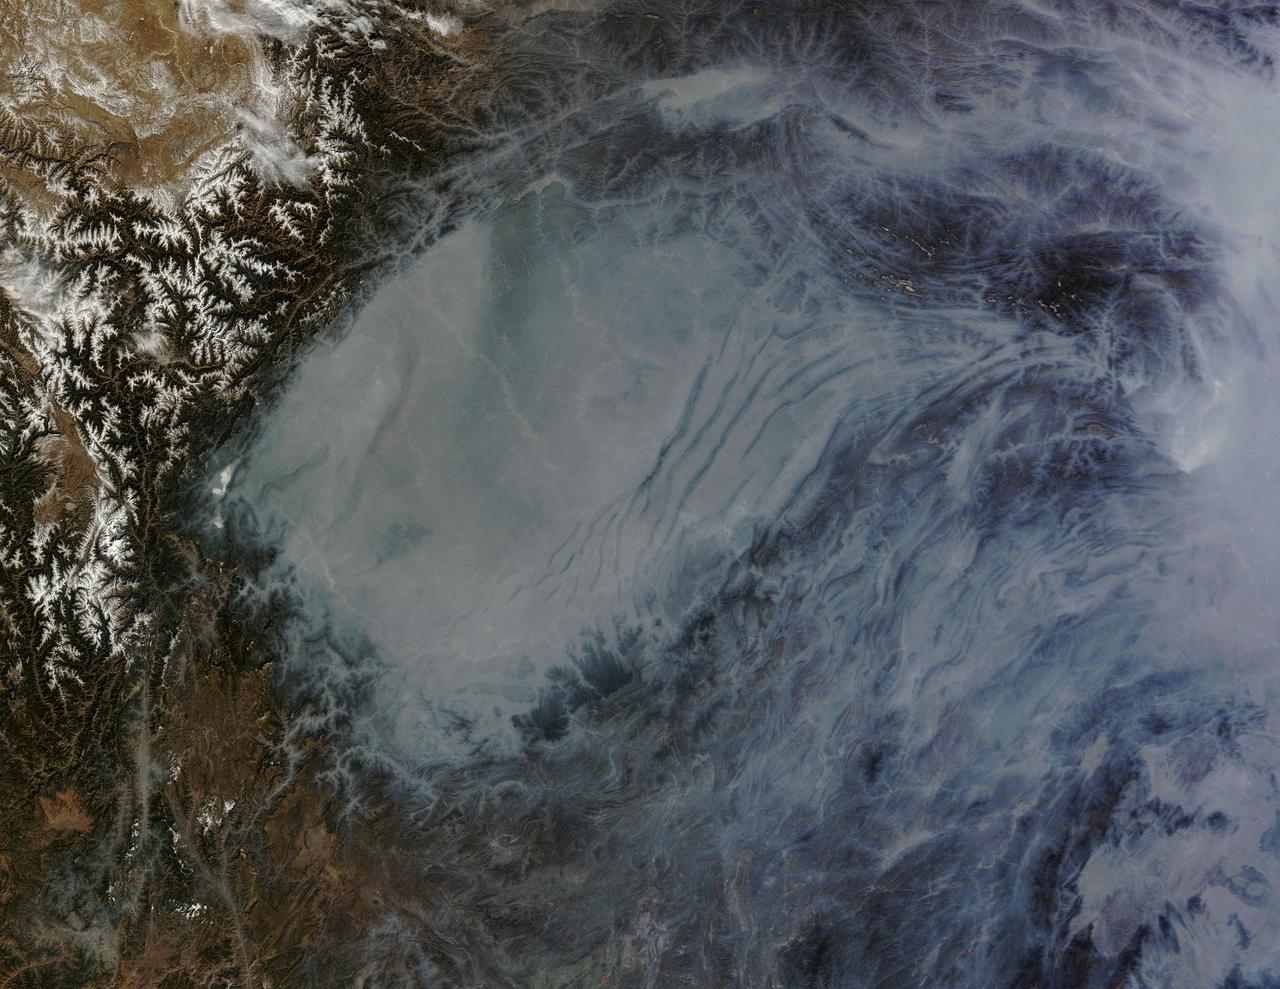
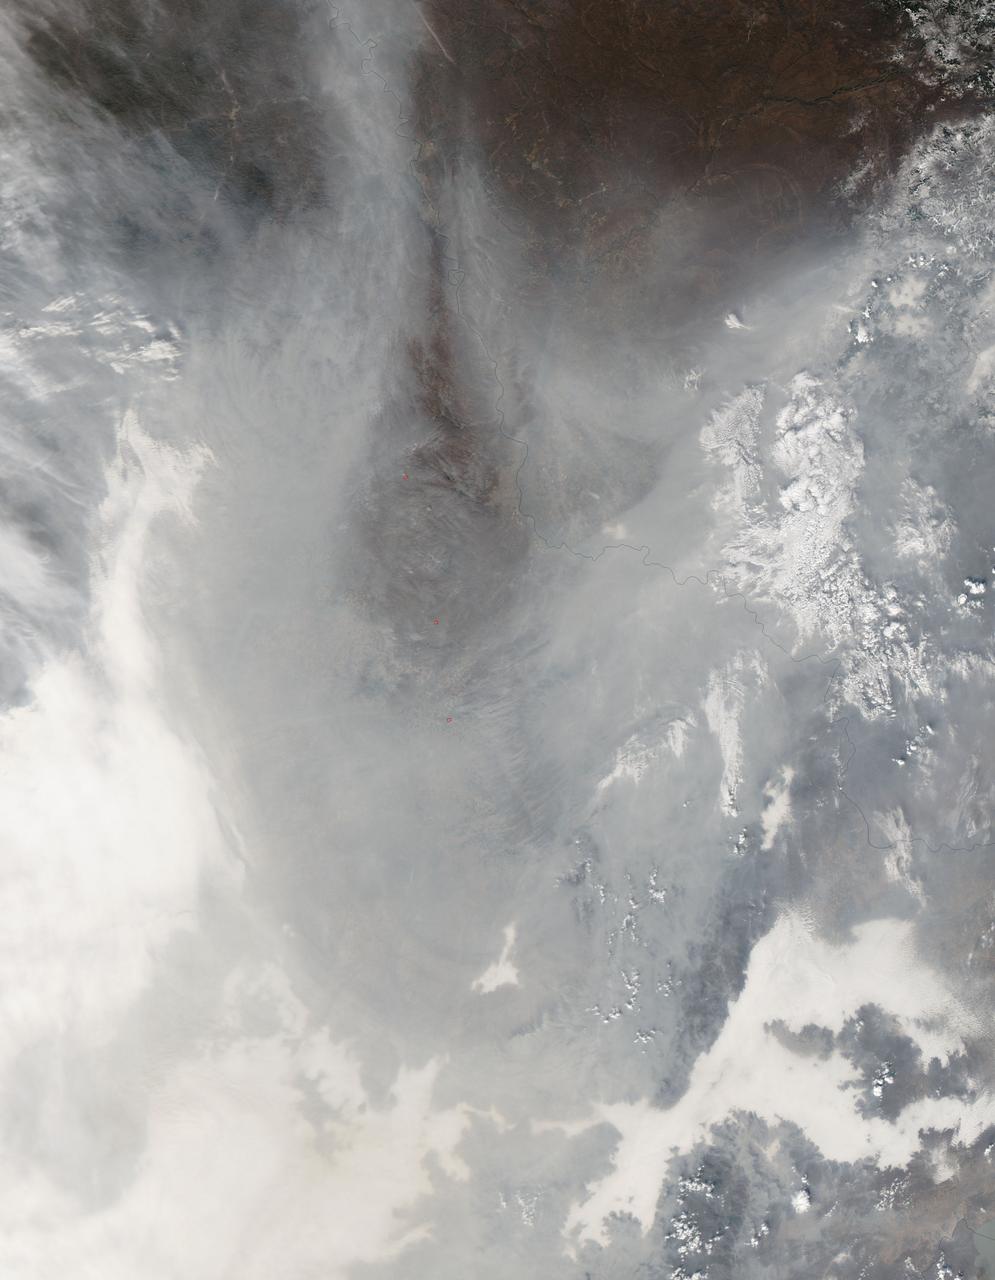
The skies over northern China were shrouded with a thick haze in late December, 2013. The Moderate Resolution Imaging Spectroradiometer (MODIS) aboard the Terra satellite captured this true-color image on December 23. The dense, gray haze obscures almost all the land and much of the coastal waters from view south and east of the Taihang Mountains. Clearer air covers the region north of the mountains, although fingers of haze roll through most river valleys. The cities of Beijing and Hebei, both west of the Bohai Sea are complete enshrouded. By December 24 the smog levels in some area exceeded World Health Organization-recommended levels by 30 times, according to Bloomberg News. The concentration of PM2.5, which are fine air particulates, were reported at 421 micrograms per cubic meter at 2 p.m. near Tiananmen Square in Beijing, while levels were 795 in Xi’an and 740 in Zhengzhou. The World Health Organization (WHO) recommends 24-hour exposure to PM2.5 concentrations no higher than 25 micrograms per cubic meter. While not the sole cause of haze and pollution, the use of coal as a very cheap energy source adds to the problem, particularly north of the Huai River. Prior to 1980, the government policy provided free coal for fuel boilers for all people living north of the Huai River. The widespread use of coal allows people in the north to stay warm in winter, but they have paid a price in air quality. According to Michael Greenstone, a Professor of Environmental Economics at Massachusetts Institute of Technology (MIT), whose research team published a paper on sustained exposure to air pollution on life expectancy in the region, air pollution, as measured by total suspended particulates, was about 55% higher north of the Huai River than south of it, for a difference of around 184 micrograms of particulate matter per cubic meter. The research, published in Proceedings of the National Academy of Sciences in July, 2013, also noted life expectancies were about 5.5 years lower in the north, owing to an increased incidence of cardiorespiratory mortality. Air pollution is an on-going issue for the government of China, and Beijing’s Five-Year Clean Air Action Plan aims to reduce overall particle density by over 25 percent on the PM2.5 scale by 2017, and also takes aim at shutting down all coal-burning plants. Credit: NASA/GSFC/Jeff Schmaltz/MODIS Land Rapid Response Team <b><a href="http://www.nasa.gov/audience/formedia/features/MP_Photo_Guidelines.html" rel="nofollow">NASA image use policy.</a></b> <b><a href="http://www.nasa.gov/centers/goddard/home/index.html" rel="nofollow">NASA Goddard Space Flight Center</a></b> enables NASA’s mission through four scientific endeavors: Earth Science, Heliophysics, Solar System Exploration, and Astrophysics. Goddard plays a leading role in NASA’s accomplishments by contributing compelling scientific knowledge to advance the Agency’s mission. <b>Follow us on <a href="http://twitter.com/NASA_GoddardPix" rel="nofollow">Twitter</a></b> <b>Like us on <a href="http://www.facebook.com/pages/Greenbelt-MD/NASA-Goddard/395013845897?ref=tsd" rel="nofollow">Facebook</a></b> <b>Find us on <a href="http://instagram.com/nasagoddard?vm=grid" rel="nofollow">Instagram</a></b>
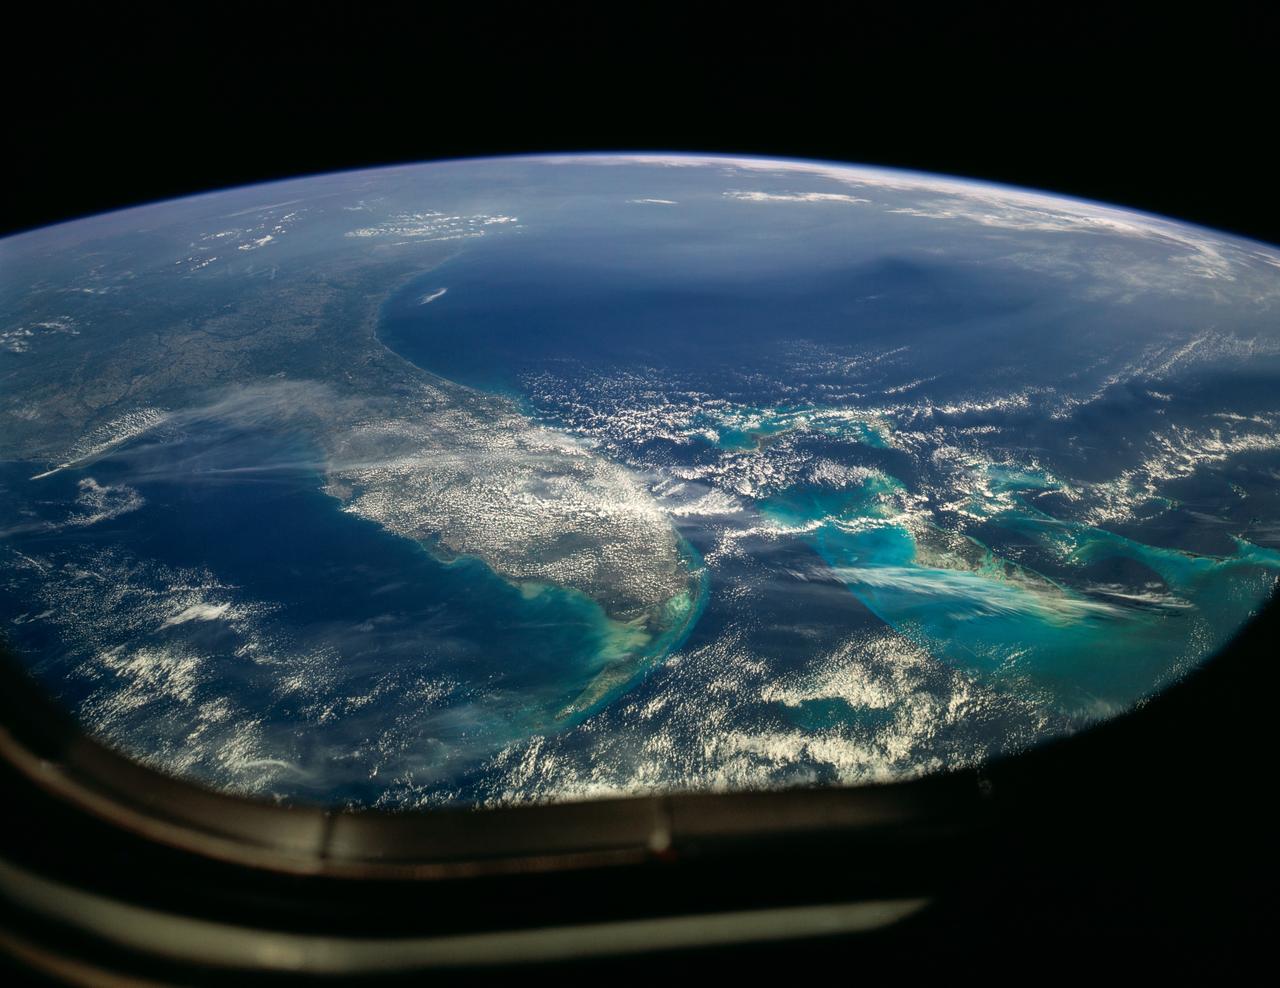
STS031-151-155 (26 April 1990) --- The Florida peninsula and smog over the northeastern U.S. coast are featured in this image photographed by a Space Shuttle Discovery crewmember during STS-31 mission. According to scientists, a mass of aerosol haze stretches across the top of the entire view. Meteorological, visibility and sulfate-content data showed that the haze was indeed industrial smog haze, rather than cloud. The air mass was transported west to east (left to right) around the north limb of a high pressure cell. It moved offshore for at least 1500 kilometers reaching the Atlantic islands of Bermuda. The leading edge of the haze mass can be detected far to the south, near the Bahamas--indicating that aerosols from the industrial Northeast were transported around the high, back directly toward the large population centers of Florida.

ISS012-E-21250 (2 March 2006) --- Dust and smog in northeast China are featured in this image photographed by an Expedition 12 crewmember on the International Space Station. Much of the land surface is obscured in this oblique image of the North China Plain and parts of Inner Mongolia. In the center of the view a mass of gray smog—mainly industrial pollution and smoke from domestic burning—obscures Beijing and surrounding cities. Numerous plumes with their source points appear within the mass. Beijing suffers some of the worst air pollution in the world from these chronic sources, and the characteristic colors and textures of the smog can be easily seen through windows of the International Space Station. The coastline of Bo Hai Bay, 300 kilometers east of Beijing, is visible at left. The light brown material in Bo Hai Bay is sediment from the Yellow and other rivers. Separated from the smog mass by a band of puffy, white cumulus clouds is a light brown plume of dust. The line of white cloud has developed along the escarpment that separates the heavily populated North China Plain – location of the largest population agglomeration on Earth – and the sparsely populated semi-desert plains of Inner Mongolia. Observers saw a number of dust events in most Northern Hemisphere deserts in the spring of 2006, and the Gobi and the Takla Makan deserts of western China were no exception. Dust plumes originating in these deserts typically extend eastward hundreds of kilometers, regularly depositing dust on Beijing, the Korean peninsula and Japan. Some plumes even extend over the Pacific Ocean. In extreme cases, visible masses of Gobi-derived dust have reached North America.
A thick layer of haze blanketed the North China Plain on October 9, 2014, when the Moderate Resolution Imaging Spectroradiometer (MODIS) on NASA’s Terra satellite acquired this natural-color image at 2:50 Coordinated Universal Time (10:50 a.m. local time). The haze obscured many features usually visible in MODIS imagery of the area, including China’s largest city, Beijing. On the day this image was acquired, measurements from ground-based sensors at the U.S. Consulate in Beijing reported PM2.5 measurements of 334 micrograms per cubic meter of air. Fine, airborne particulate matter (PM) that is smaller than 2.5 microns (about one thirtieth the width of a human hair) is considered dangerous because it is small enough to enter the passages of the human lungs. Most PM2.5 aerosol particles come from the burning of fossil fuels and biomass (wood fires and agricultural burning). The World Health Organization considers PM2.5 to be safe when it is below 25. Haze in this region tends to worsen in the fall and winter, when cold, heavy air traps pollutants near the surface. In this case, the haze was likely trapped by a temperature inversion. Normally, air is warmest near the surface of the Earth. Occasionally, a mass of warm air will move over cooler air so that the atmosphere actually warms with altitude. Since the cool air does not have the energy to rise through the warm air, vertical circulation slows and air becomes trapped near the surface. Any pollutant that enters the air gets trapped as well, and haze builds up over time. Daily satellite images of the North China Plain show that visible haze began to accumulate on October 7, 2014. NASA image courtesy Jeff Schmaltz, LANCE MODIS Rapid Response. Caption by Adam Voiland. Read more: <a href="http://earthobservatory.nasa.gov/NaturalHazards/view.php?id=84530&eocn=home&eoci=nh" rel="nofollow">earthobservatory.nasa.gov/NaturalHazards/view.php?id=8453...</a> Credit: <b><a href="http://www.earthobservatory.nasa.gov/" rel="nofollow"> NASA Earth Observatory</a></b> <b><a href="http://www.nasa.gov/audience/formedia/features/MP_Photo_Guidelines.html" rel="nofollow">NASA image use policy.</a></b> <b><a href="http://www.nasa.gov/centers/goddard/home/index.html" rel="nofollow">NASA Goddard Space Flight Center</a></b> enables NASA’s mission through four scientific endeavors: Earth Science, Heliophysics, Solar System Exploration, and Astrophysics. Goddard plays a leading role in NASA’s accomplishments by contributing compelling scientific knowledge to advance the Agency’s mission. <b>Follow us on <a href="http://twitter.com/NASAGoddardPix" rel="nofollow">Twitter</a></b> <b>Like us on <a href="http://www.facebook.com/pages/Greenbelt-MD/NASA-Goddard/395013845897?ref=tsd" rel="nofollow">Facebook</a></b> <b>Find us on <a href="http://instagram.com/nasagoddard?vm=grid" rel="nofollow">Instagram</a></b>
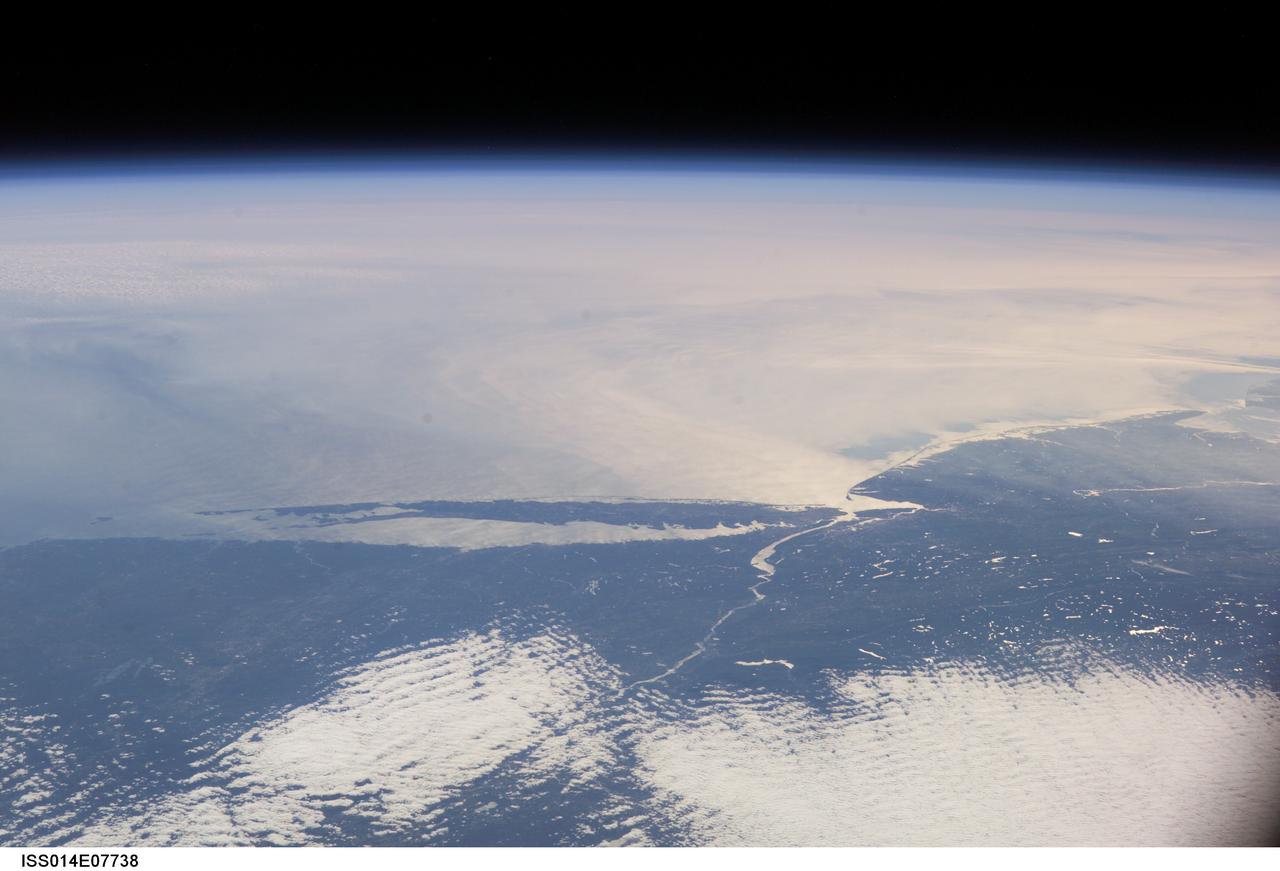
ISS014-E-07738 (10 Nov. 2006) --- This image featuring a southeast-looking view of the Long Island Sound and New Jersey coast, with the lower Hudson River and New York Bay in the area of brightest sunglint was photographed by an Expedition 14 crewmember on the International Space Station. On the far right a gray haze can be seen streaming out to sea offshore of New Jersey, where it becomes harder to see. In fact haze covers most of the visible area offshore, partly obscuring the sea surface. By contrast, clouds look quite different from haze according to scientists. Clouds usually have sharp margins and are pure white, as clouds at the bottom show. Industrial haze is grayer and more diffuse, and is typical of the air over the Northeast. Flow lines show that winds are transporting the haze in clockwise fashion--i.e. bending south--which in turn signifies that a high pressure system was operating on that day, centered roughly over the coast. High pressure systems are notorious for promoting smog events because they bring clear skies, and sunlight promotes smog formation. Highs also concentrate polluted surface layers near the ground.
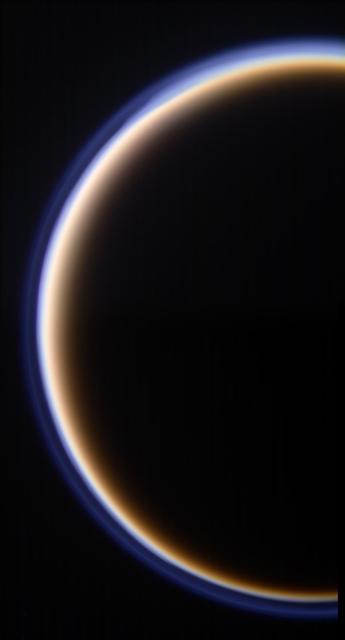
In this view, individual layers of haze can be distinguished in the upper atmosphere of Titan, Saturn's largest moon. Titan's atmosphere features a rich and complex chemistry originating from methane and nitrogen and evolving into complex molecules, eventually forming the smog that surrounds the moon. This natural color image was taken in visible light with the Cassini spacecraft wide-angle camera on March 31, 2005, at a distance of approximately 20,556 miles (33,083 kilometers) from Titan. The view looks toward the north polar region on the moon's night side. Part of Titan's sunlit crescent is visible at right. The Cassini spacecraft ended its mission on Sept. 15, 2017. https://photojournal.jpl.nasa.gov/catalog/PIA21902
The Moderate Resolution Imaging Spectroradiometer (MODIS) on NASA’s Terra satellite acquired this natural-color image of central China on January 23, 2013 at 04:05 UTC. The image shows extensive haze over the region. In areas where the ground is visible, some of the landscape is covered with lingering snow. Credit: NASA/GSFC/Jeff Schmaltz/MODIS Land Rapid Response Team <b><a href="http://www.nasa.gov/audience/formedia/features/MP_Photo_Guidelines.html" rel="nofollow">NASA image use policy.</a></b> <b><a href="http://www.nasa.gov/centers/goddard/home/index.html" rel="nofollow">NASA Goddard Space Flight Center</a></b> enables NASA’s mission through four scientific endeavors: Earth Science, Heliophysics, Solar System Exploration, and Astrophysics. Goddard plays a leading role in NASA’s accomplishments by contributing compelling scientific knowledge to advance the Agency’s mission. <b>Follow us on <a href="http://twitter.com/NASAGoddardPix" rel="nofollow">Twitter</a></b> <b>Like us on <a href="http://www.facebook.com/pages/Greenbelt-MD/NASA-Goddard/395013845897?ref=tsd" rel="nofollow">Facebook</a></b> <b>Find us on <a href="http://instagram.com/nasagoddard?vm=grid" rel="nofollow">Instagram</a></b>
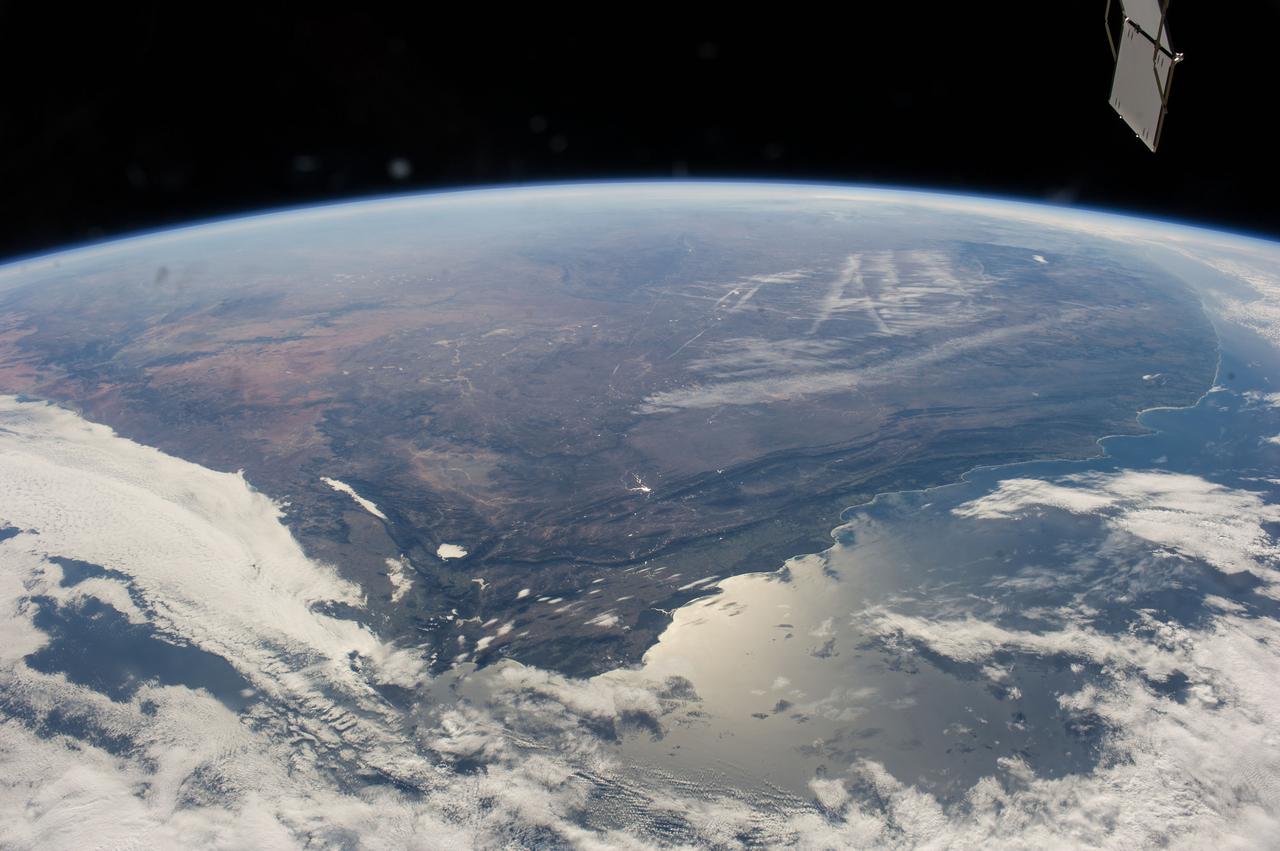
ISS040-E-006271 (31 May 2014) --- One of the Expedition 40 crew members aboard the Earth-orbiting International Space Station captured this panoramic image of South Africa on May 31, 2014. A combination of contrails and a bit of winter mist appears to have formed alphabetic and/or numeric characters in the upper right near the horizon. Sun glint off the south coast is slightly confusing as it is similar in brightness to the west-coast cloud cover, where an Atlantic storm rolls in. The Cape Fold Mountains cross the center of the view, going east from the Cape Town region (clouds obscure the Cape peninsula which normally serves as an icon for this part of Africa). A popular winegrowing region attributable to the Mediterranean climate is the area around Cape Town near lower left. Witwatersrand lies at the top of the picture obscured by the seemingly ever-present winter smoke and smog. The Orange River valley appears as a dark, nearly horizontal line at left.
ISS028-E-024146 (2 Aug. 2011) --- Kaliningrad and Baltic Sea, Russia are featured in this image photographed by an Expedition 28 crew member on the International Space Station. This striking photograph reveals detail of the two great lagoons to the north and south of Kaliningrad, each protected from the open waters of the Baltic Sea by the thin perfect curves of current-generated sand spits. A broad arm of agricultural country separates the freshwater lagoons?known as Kurshsky Bay (or the Curonian Lagoon further north in Lithuania, just outside the top of the image) and the Vistula Lagoon. From the crew member perspective in low Earth orbit, land surfaces usually appear brighter than water, which normally appears darker and often black. Reflected sunlight, or sunglint, inverts this pattern. The reflected light in this image is a pink or coppery hue, indicating the likely existence of smog in the air since smog particles enhance the red part of the light spectrum. Camera settings used to acquire sunglint images result in high contrast that reveals excellent detail of coastlines and surface features of waterbodies, but masks land surface detail. The thin, 50 kilometer-long barge canal leading from the Baltic Sea to Kaliningrad is visible but the great port of Kaliningrad itself is not. Other human patterns on this intensively developed landscape such as towns, highways and farm boundaries are likewise masked in the image. The area has a long human history. The growth of the Vistula spit finally cut off the north Polish city of Elblag (just outside the bottom of the image) from the Baltic Sea in the 13th century. To reconnect Elblag directly with the Baltic Sea, the EU is considering funding the digging of another canal through the spit at lower right, despite ecological concerns. Kaliningrad was heavily damaged during WWII and then annexed by Russia and cleared of its German population. As the only Russian port on the Baltic Sea to be ice-free year-round, Kaliningrad then gained importance strategically as home of the Baltic Fleet.
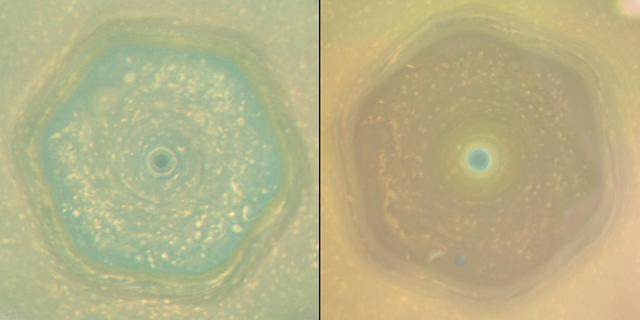
These natural color views from NASA's Cassini spacecraft compare the appearance of Saturn's north-polar region in June 2013 and April 2017. In both views, Saturn's polar hexagon dominates the scene. The comparison shows how clearly the color of the region changed in the interval between the two views, which represents the latter half of Saturn's northern hemisphere spring. In 2013, the entire interior of the hexagon appeared blue. By 2017, most of the hexagon's interior was covered in yellowish haze, and only the center of the polar vortex retained the blue color. The seasonal arrival of the sun's ultraviolet light triggers the formation of photochemical aerosols, leading to haze formation. The general yellowing of the polar region is believed to be caused by smog particles produced by increasing solar radiation shining on the polar region as Saturn approached the northern summer solstice on May 24, 2017. Scientists are considering several ideas to explain why the center of the polar vortex remains blue while the rest of the polar region has turned yellow. One idea is that, because the atmosphere in the vortex's interior is the last place in the northern hemisphere to be exposed to spring and summer sunlight, smog particles have not yet changed the color of the region. A second explanation hypothesizes that the polar vortex may have an internal circulation similar to hurricanes on Earth. If the Saturnian polar vortex indeed has an analogous structure to terrestrial hurricanes, the circulation should be downward in the eye of the vortex. The downward circulation should keep the atmosphere clear of the photochemical smog particles, and may explain the blue color. Images captured with Cassini's wide-angle camera using red, green and blue spectral filters were combined to create these natural-color views. The 2013 view (left in the combined view), was captured on June 25, 2013, when the spacecraft was about 430,000 miles (700,000 kilometers) away from Saturn. The original versions of these images, as sent by the spacecraft, have a size of 512 by 512 pixels and an image scale of about 52 miles (80 kilometers) per pixel; the images have been mapped in polar stereographic projection to the resolution of approximately 16 miles (25 kilometers) per pixel. The second and third frames in the animation were taken approximately 130 and 260 minutes after the first image. The 2017 sequence (right in the combined view) was captured on April 25, 2017, just before Cassini made its first dive between Saturn and its rings. During the imaging sequence, the spacecraft's distance from the center of the planet changed from 450,000 miles (725,000 kilometers) to 143,000 miles (230,000 kilometers). The original versions of these images, as sent by the spacecraft, have a size of 512 by 512 pixels. The resolution of the original images changed from about 52 miles (80 kilometers) per pixel at the beginning to about 9 miles (14 kilometers) per pixel at the end. The images have been mapped in polar stereographic projection to the resolution of approximately 16 miles (25 kilometers) per pixel. The average interval between the frames in the movie sequence is 230 minutes. Corresponding animated movie sequences are available at https://photojournal.jpl.nasa.gov/catalog/PIA21611 https://photojournal.jpl.nasa.gov/catalog/PIA21611
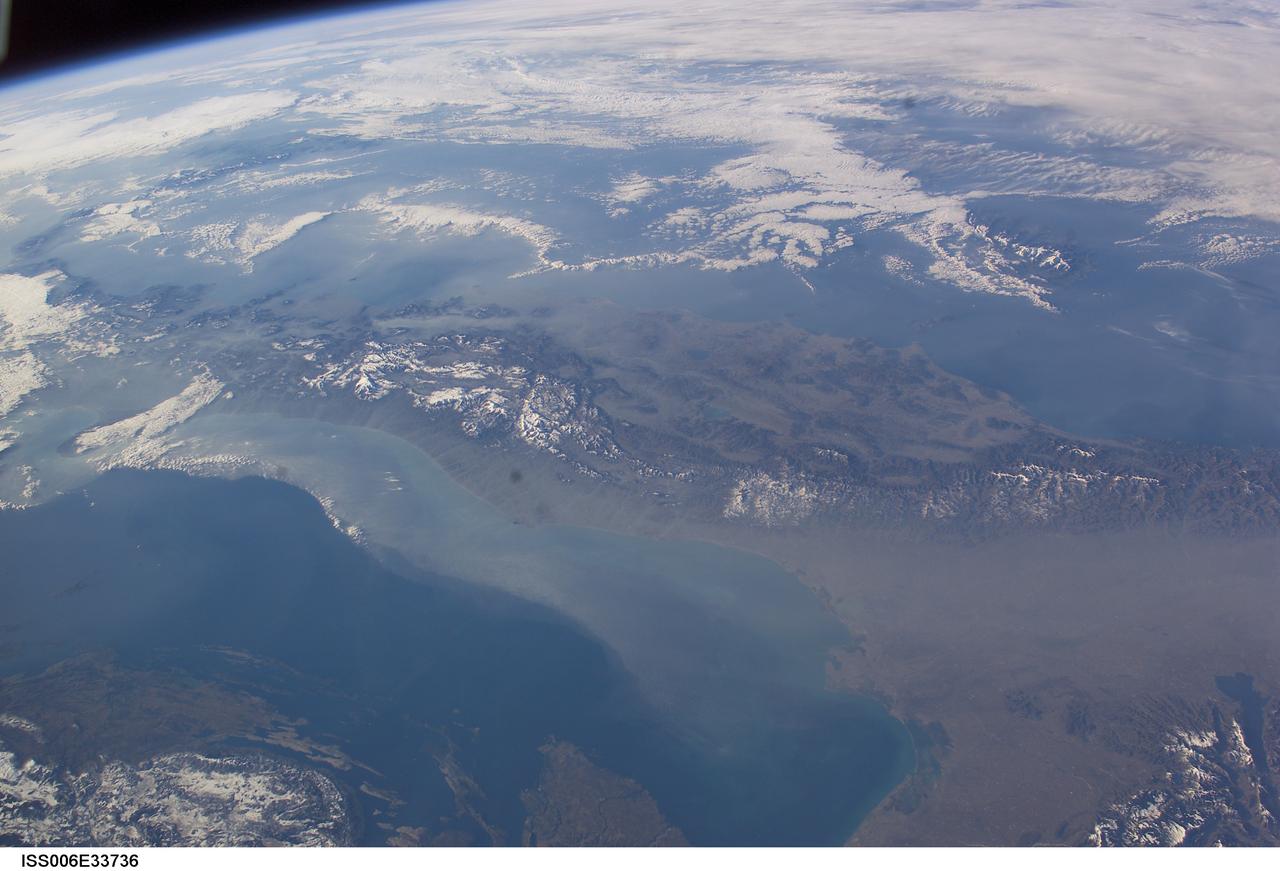
ISS006-E-33736 (25 February 2003) --- The boot of Italy crosses the image in this southwest-looking view taken by an Expedition Six crewmember onboard the International Space Station (ISS). The spine of Italy is highlighted with snow and the largely cloud-covered Mediterranean Sea is at the top. The Adriatic Sea transverses most of the bottom of the image and Sicily appears top left beyond the toe of the boot. The heel lies out of the left side of the image. Corsica and Sardinia appear right of center partly under cloud. The floor of the Po River valley, lower right, is obscured by haze. Experience gained from similar haze events, in which atmospheric pressure, humidity and visibility and atmospheric chemistry were known, suggests that the haze as industrial smog. Industrial haze from the urban region of the central and upper Po valley accumulates to visible concentrations under conditions of high atmospheric pressure and the surrounding mountains prevent easy dispersal. This view illustrates the markedly different color and texture of cloud versus industrial aerosol haze.
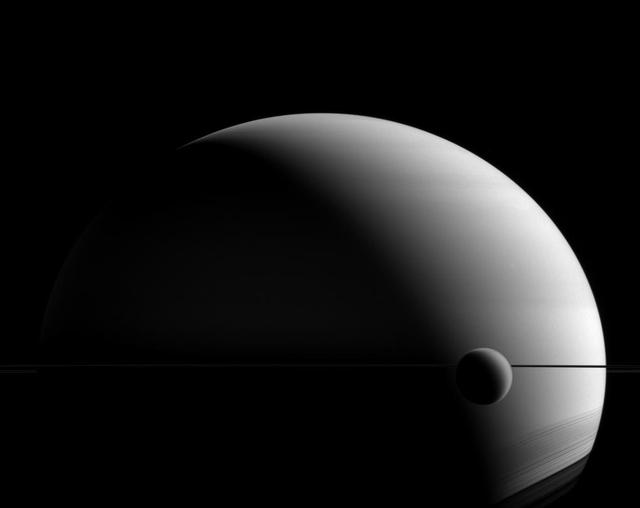
Titan and Saturn have very few things in common, but a hazy appearance is one feature they share. Although their faces seem similar in images like this, appearances can be misleading. Both Saturn and Titan have thick atmospheres, in a relative sense. But Saturn is a gas giant, covered in clouds, with no solid surface to speak of. Titan's atmosphere is a blanket of dense haze -- a photochemical smog -- surrounding an icy, solid body. Even their atmospheric compositions are different; Saturn is mostly hydrogen and helium with clouds of water, ammonia and ammonium hydrosulfide. Titan's atmosphere is primarily nitrogen and methane, with occasional methane clouds. This view looks toward Saturn from the unilluminated side of the rings, 0.3 degrees below the ring plane. The image was taken in visible green light with the Cassini spacecraft wide-angle camera on May 22, 2015. The view was obtained at a distance of approximately 1.4 million miles (2.2 million kilometers) from Saturn. Image scale is 81 miles (130 kilometers) per pixel. http://photojournal.jpl.nasa.gov/catalog/PIA18335
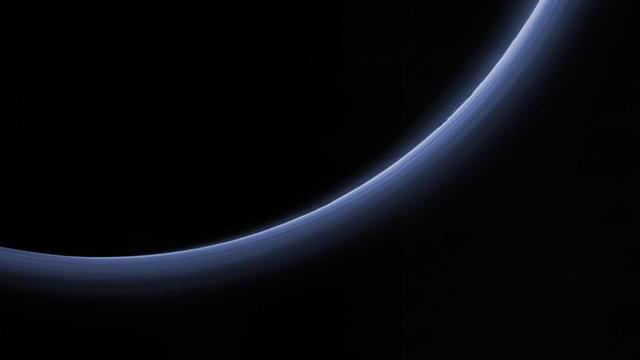
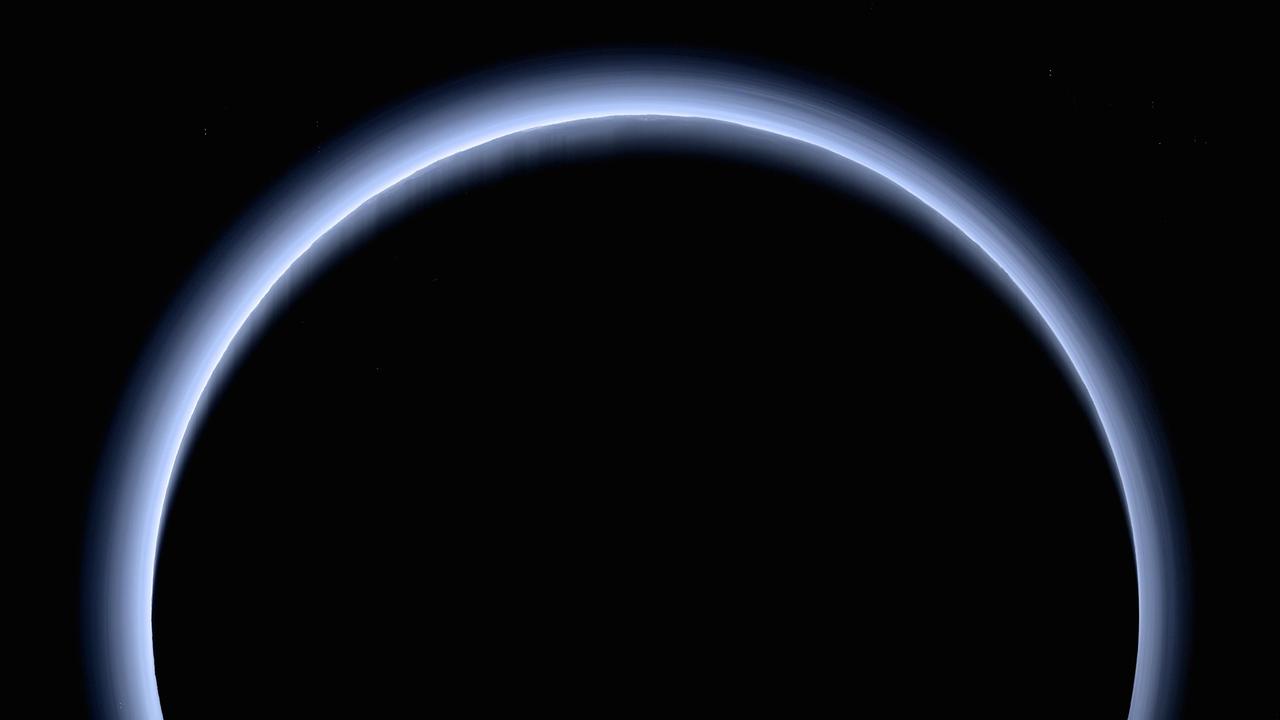
This processed image is the highest-resolution color look yet at the haze layers in Pluto's atmosphere. Shown in approximate true color, the picture was constructed from a mosaic of four panchromatic images from the Long Range Reconnaissance Imager (LORRI) splashed with Ralph/Multispectral Visible Imaging Camera (MVIC) four-color filter data, all acquired by NASA's New Horizons spacecraft on July 14, 2015. The resolution is 1 kilometer (0.6 miles) per pixel; the sun illuminates the scene from the right. Scientists believe the haze is a photochemical smog resulting from the action of sunlight on methane and other molecules in Pluto's atmosphere, producing a complex mixture of hydrocarbons such as acetylene and ethylene. These hydrocarbons accumulate into small particles, a fraction of a micrometer in size, and scatter sunlight to make the bright blue haze seen in this image. As they settle down through the atmosphere, the haze particles form numerous intricate, horizontal layers, some extending for hundreds of miles around Pluto. The haze layers extend to altitudes of over 200 kilometers (120 miles). Adding to the stark beauty of this image are mountains on Pluto's limb (on the right, near the 4 o'clock position), surface features just within the limb to the right, and crepuscular rays (dark finger-like shadows to the left) extending from Pluto's topographic features. http://photojournal.jpl.nasa.gov/catalog/PIA20362
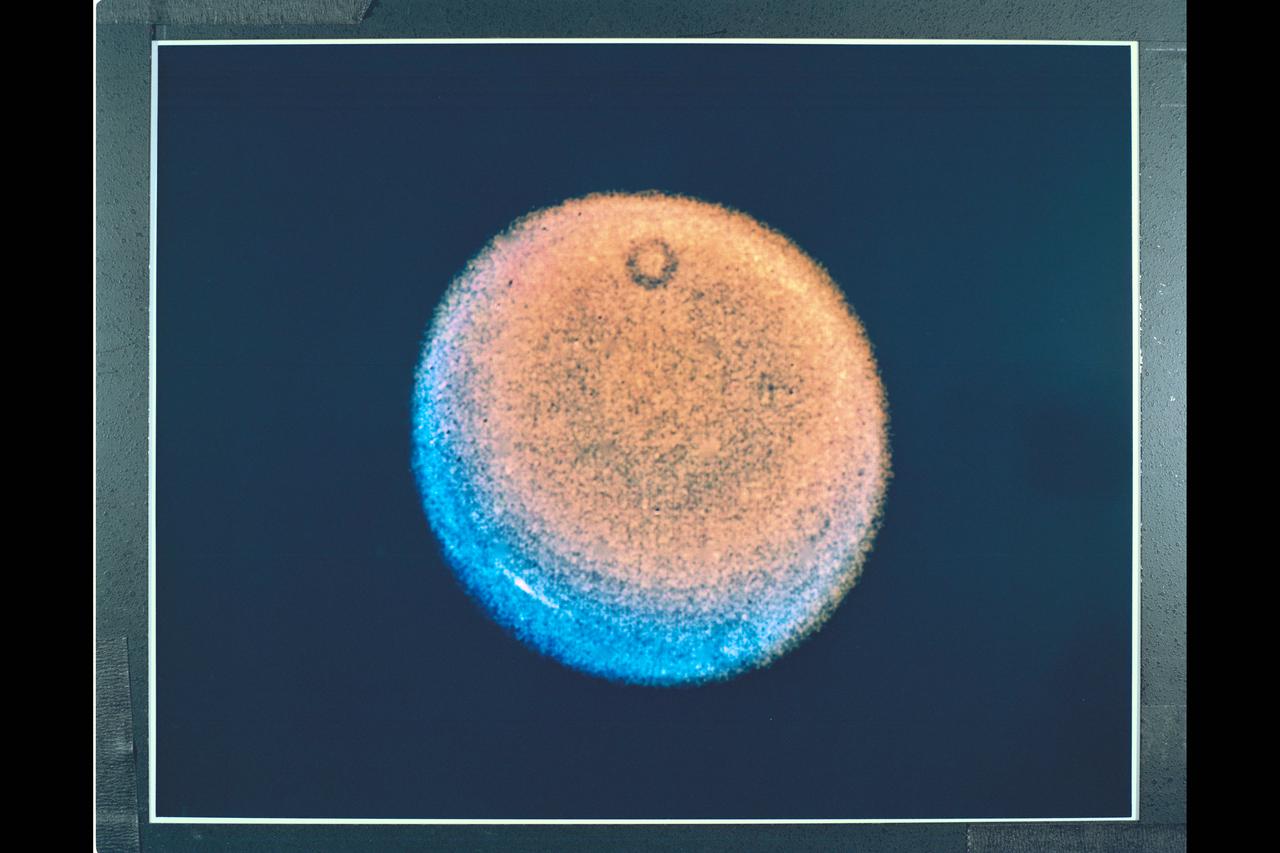
Range : 12.9 million miles (8.0 million miles) P-29468C This false color Voyager photograph of Uranus shows a discrete cloud seen as a bright streak near the planets limb. The cloud visible here is the most prominent feature seen in a series of Voyager images designed to track atmospheric motions. The occasional donut shaped features, including one at the bottom, are shadows cast by dust on the camera optics. The picture is a highly processed composite of three images. The processing necessary to bring out the faint features on the planet also brings out these camera blemishes. The three seperate images used where shot through violet, blue, and orange filters. Each color image showd the cloud to a different degree; because they were not exposed at the same time , the images were processed to provide a good spatial match. In a true color image, the cloud would be barely discernable; the false color helps to bring out additional details. The different colors imply variations in vertical structure, but as of yet it is not possible to be specific about such differences. One possiblity is that the uranian atmosphere may contain smog like constituents, in which case some color differences may represent differences in how these molecules are distributed.
Chinese authorities shut down much of Harbin – a city of more than 10 million people – as unusually high levels of pollution shrouded the city and the surrounding region in mid-October, 2013. Measurements taken on October 20, 2013 scored the air quality index in the city at 500, the highest possible reading. Levels above 300 are considered hazardous to human health. The Moderate Resolution Imaging Spectroradiometer (MODIS) on NASA’s Aqua satellite acquired this true-color image of northeastern China on October 21. The brightest areas are fog, which is tinged with gray or yellow due to the air pollution. Other cloud-free areas have a pall of gray and brown smog that blots out the city and surrounding towns. Harbin lies under the Y-shaped patch of fog and smog in the south-central section of the image, completely obscured from view. Some neighborhoods experienced concentrations of fine particulate matter (PM 2.5) as high as 1,000 micrograms per cubic meter. For comparison the U.S. Environmental Protection Agency’s air quality standards state that PM 2.5 should remain below 35 micrograms per cubic meter. It is extremely rare for particulate levels to reach such high levels in the absence of a dust storm or forest fire. Chinese authorities grounded airplanes, shuttered thousands of schools and closed major roads in response to the surge in pollution. A few days after pollution levels started to rise, Harbin hospitals reported a 30 percent increase in admissions related to respiratory problems, and several Harbin pharmacies were sold out of pollution facemasks, according to media reports. Cold weather and lack of wind helped fuel the pollution outbreak, but human factors also played an important role. Wheat and corn farmers in the region light fires in the fall to burn off debris following the harvest. Also, city officials turned on Harbin’s city-wide, coal-powered heating system just prior to the pollution outbreak, according to China’s state-run Xinhua News Agency. Credit: NASA/GSFC/Jeff Schmaltz/MODIS Land Rapid Response Team <b><a href="http://www.nasa.gov/audience/formedia/features/MP_Photo_Guidelines.html" rel="nofollow">NASA image use policy.</a></b> <b><a href="http://www.nasa.gov/centers/goddard/home/index.html" rel="nofollow">NASA Goddard Space Flight Center</a></b> enables NASA’s mission through four scientific endeavors: Earth Science, Heliophysics, Solar System Exploration, and Astrophysics. Goddard plays a leading role in NASA’s accomplishments by contributing compelling scientific knowledge to advance the Agency’s mission. <b>Follow us on <a href="http://twitter.com/NASA_GoddardPix" rel="nofollow">Twitter</a></b> <b>Like us on <a href="http://www.facebook.com/pages/Greenbelt-MD/NASA-Goddard/395013845897?ref=tsd" rel="nofollow">Facebook</a></b> <b>Find us on <a href="http://instagram.com/nasagoddard?vm=grid" rel="nofollow">Instagram</a></b>
This is the highest-resolution color departure shot of Pluto's receding crescent from NASA's New Horizons spacecraft, taken when the spacecraft was 120,000 miles (200,000 kilometers) away from Pluto. Shown in approximate true color, the picture was constructed from a mosaic of six black-and-white images from the Long Range Reconnaissance Imager (LORRI), with color added from a lower resolution Ralph/Multispectral Visible Imaging Camera (MVIC) color image, all acquired between 15:20 and 15:45 UT -- about 3.5 hours after closest approach to Pluto -- on July 14, 2015. The resolution of the LORRI images is about 0.6 miles (1 kilometer) per pixel; the sun illuminates the scene from the other side of Pluto and somewhat toward the top of this image. The image is dominated by spectacular layers of blue haze in Pluto's atmosphere. Scientists believe the haze is a photochemical smog resulting from the action of sunlight on methane and other molecules in Pluto's atmosphere, producing a complex mixture of hydrocarbons such as acetylene and ethylene. These hydrocarbons accumulate into small haze particles, a fraction of a micrometer in size, which preferentially scatter blue sunlight -- the same process that can make haze appear bluish on Earth. As they settle down through the atmosphere, the haze particles form numerous intricate, horizontal layers, some extending for hundreds of miles around large portions of the limb of Pluto. The haze layers extend to altitudes of over 120 miles (200 kilometers). Pluto's circumference is 4,667 miles (7,466 kilometers). Adding to the beauty of this picture are mountains and other topographic features on Pluto's surface that are silhouetted against the haze near the top of the image. Sunlight casts dramatic and beautiful finger-like shadows from many of these features onto the haze (especially on the left, near the 11 o'clock position), forming crepuscular rays like those often seen in Earth's atmosphere near sunrise or sunset. https://photojournal.jpl.nasa.gov/catalog/PIA21590
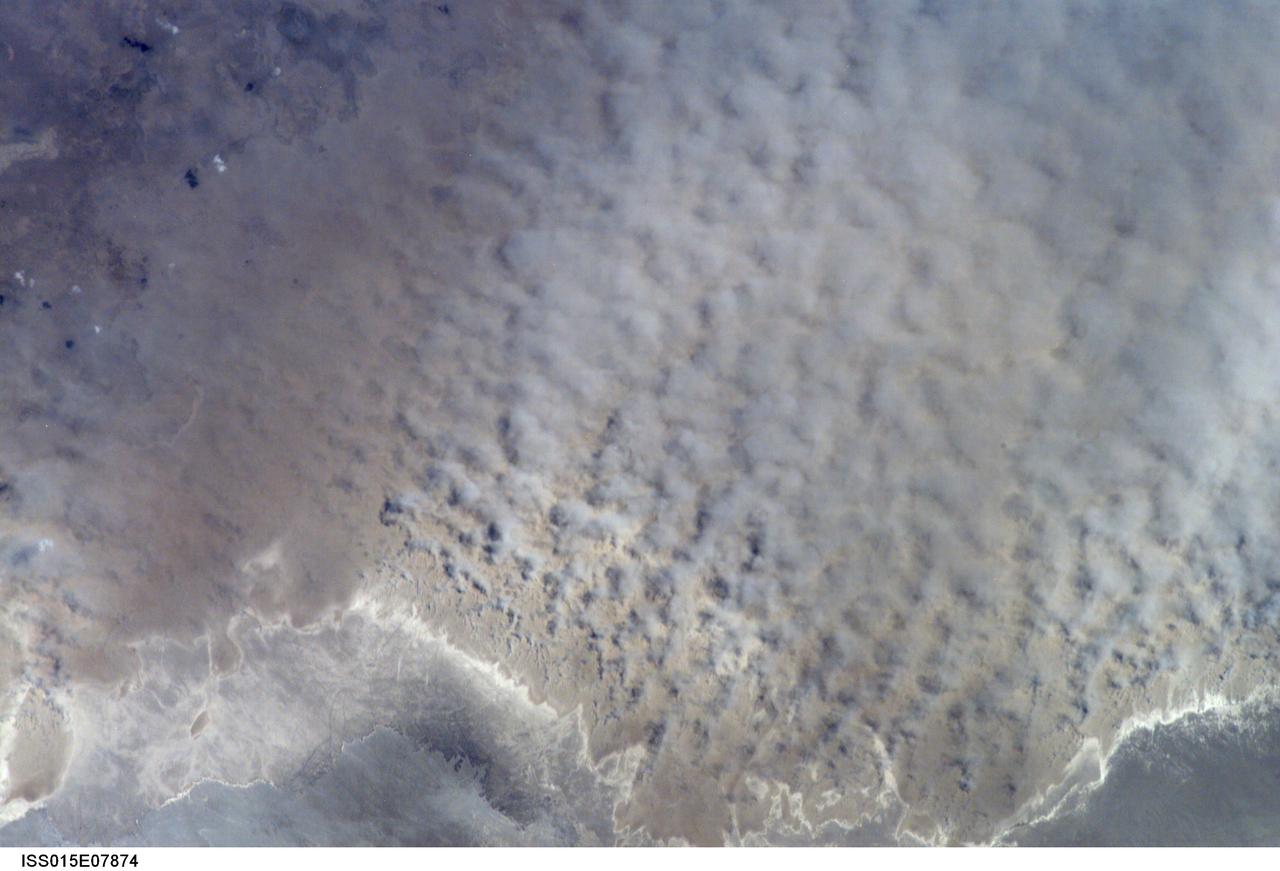
ISS015-E-07874 (12 May 2007) --- A major dust storm (center right) along the east side of the Aral Sea, Kazakhstan, is featured in this image photographed by an Expedition 15 crewmember on the International Space Station while passing over central Asia. The white, irregular lines along the bottom of the image are salt and clay deposits on the present coastline. On the spring day when the ISS crew shot the image, winds were blowing from the west (lower left). The gray, puffy appearance is typical of dust clouds, allowing scientists to distinguish dust from fog and smog. The dust in this image is rising from the sea bed of the Aral Sea, from a point close to the middle of the original Aral Sea of 40--50 years ago, then the fourth largest inland sea on Earth. Heavy extraction of water from the main supply river, the Amu Dary'a, has resulted in rapid shrinking of the sea. According to scientists, dust storms have been occurring in the Aral Sea region for thousands of years, but since the drastic shrinking of the sea over the past half-century an important change in dust composition has occurred. The dust now includes fertilizer and pesticide washed into the Sea from the extensive cotton fields of the Amu Dary'a floodplain. Years of liberal application of agricultural chemicals have resulted in concentration of these pollutants on the sea bed. These are now exposed to the wind and transported hundreds of kilometers in a generally easterly direction. Research suggests that the remobilized chemicals are the cause of high rates of many diseases in the populations along the north, east and southern margins of the Aral Sea. This is one of the unintended consequences of the shrinking of the sea, which has made international news for many years due to the loss of the fishing industry and other significant ecological problems.
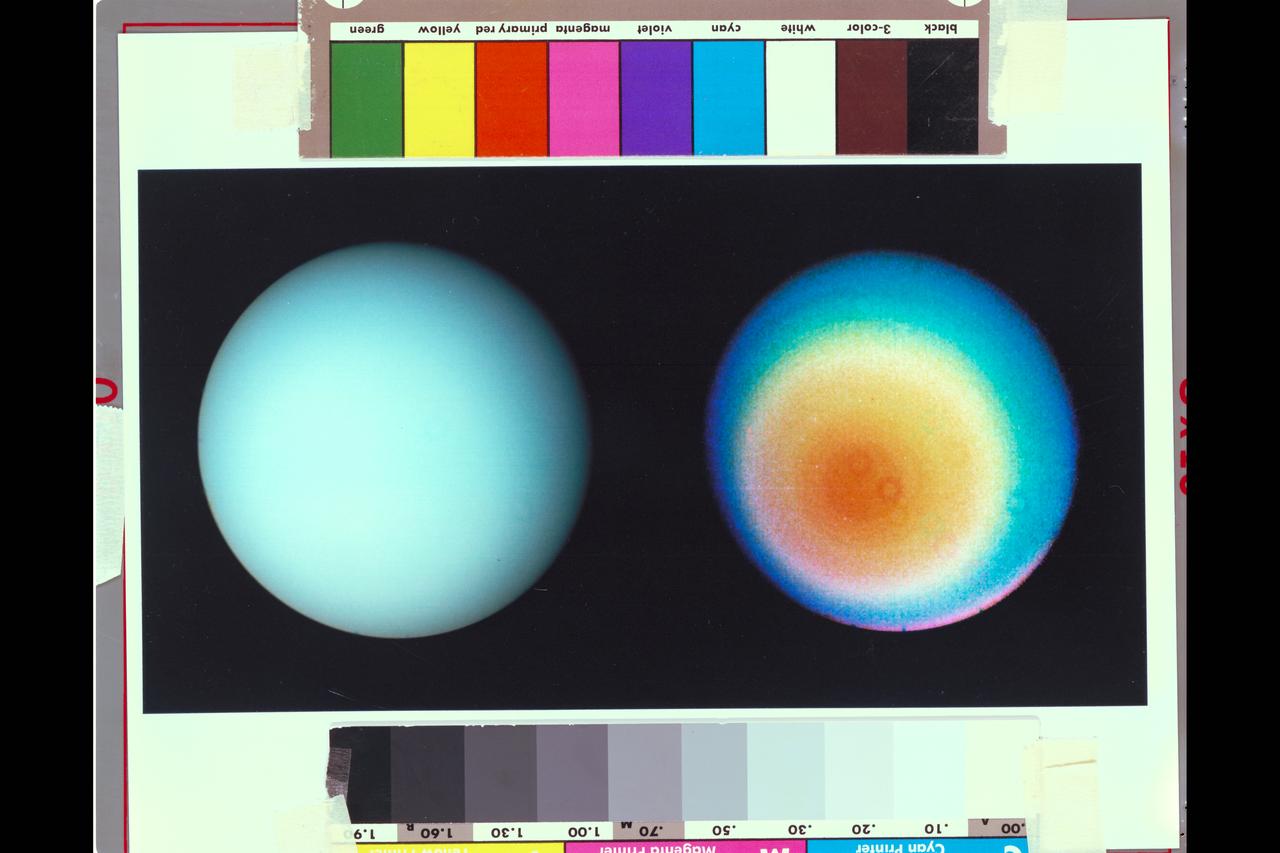
Range : 9.1 million miles (5.7 million miles) P-29478C These two images pictures of Uranus, one in true color and the other in false color, were shot by Voyager 2's narrow angle camera. The picture at left has been processed to show Uranus as the human eye would see from the vantage point of the spacecraft. The image is a composite of shots taken through blue, green, and orange filters. The darker shadings on the upper right of the disk correspond to day-night boundaries on the planet. Beyond this boundary lies the hidden northern hemisphere of Uranus, which currently remains in total darkness as the planet rotates. The blue-green color results from the aborption of red light by methane gas in Uranus' deep, cold, and remarkably clear atmosphere. The picture at right uses false color and extreme contrast to bring out subtle details in the polar region of Uranus. Images obtained through ultraviolet, violet, and orange filters were respectively converted to the same blue, green, and red colors used to produce the picture at left. The very slight contrasts visible in true color are greatly exaggerated here. In this false colr picture, Uranus reveals a dark polar hood surrounded by aseries of progressively lighter concentric bands. One possible explanation is that a brownish haze or smog, concentrated around the pole, is arranged into bands of zonal motions of the upper atmosphere. Several artifacts of the optics and processing are visible. The occasional donut shapes are shadows cast by dust in the camera optics;the processing needed to bring ot faint features also bring out camera blemishes. in addition, the bright pink strip at the lower edge of the planets limb is an artifact of the image enhancement. In fact, the limb is dark and uniform in color around the planet.
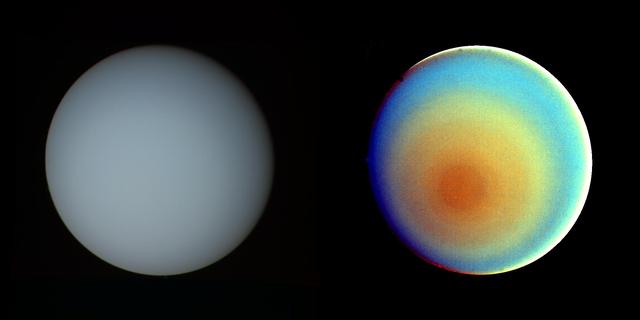
These two pictures of Uranus -- one in true color (left) and the other in false color -- were compiled from images returned Jan. 17, 1986, by the narrow-angle camera of Voyager 2. The spacecraft was 9.1 million kilometers (5.7 million miles) from the planet, several days from closest approach. The picture at left has been processed to show Uranus as human eyes would see it from the vantage point of the spacecraft. The picture is a composite of images taken through blue, green and orange filters. The darker shadings at the upper right of the disk correspond to the day-night boundary on the planet. Beyond this boundary lies the hidden northern hemisphere of Uranus, which currently remains in total darkness as the planet rotates. The blue-green color results from the absorption of red light by methane gas in Uranus' deep, cold and remarkably clear atmosphere. The picture at right uses false color and extreme contrast enhancement to bring out subtle details in the polar region of Uranus. Images obtained through ultraviolet, violet and orange filters were respectively converted to the same blue, green and red colors used to produce the picture at left. The very slight contrasts visible in true color are greatly exaggerated here. In this false-color picture, Uranus reveals a dark polar hood surrounded by a series of progressively lighter concentric bands. One possible explanation is that a brownish haze or smog, concentrated over the pole, is arranged into bands by zonal motions of the upper atmosphere. The bright orange and yellow strip at the lower edge of the planet's limb is an artifact of the image enhancement. In fact, the limb is dark and uniform in color around the planet. http://photojournal.jpl.nasa.gov/catalog/PIA00032