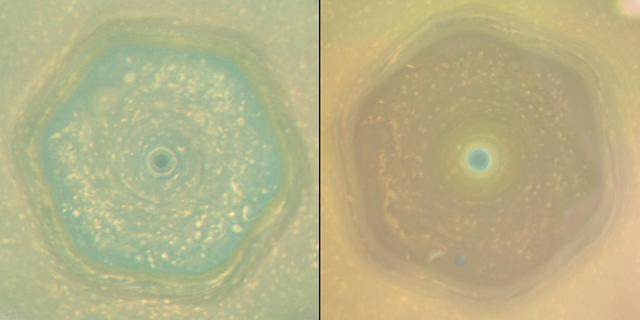
These natural color views from NASA's Cassini spacecraft compare the appearance of Saturn's north-polar region in June 2013 and April 2017. In both views, Saturn's polar hexagon dominates the scene. The comparison shows how clearly the color of the region changed in the interval between the two views, which represents the latter half of Saturn's northern hemisphere spring. In 2013, the entire interior of the hexagon appeared blue. By 2017, most of the hexagon's interior was covered in yellowish haze, and only the center of the polar vortex retained the blue color. The seasonal arrival of the sun's ultraviolet light triggers the formation of photochemical aerosols, leading to haze formation. The general yellowing of the polar region is believed to be caused by smog particles produced by increasing solar radiation shining on the polar region as Saturn approached the northern summer solstice on May 24, 2017. Scientists are considering several ideas to explain why the center of the polar vortex remains blue while the rest of the polar region has turned yellow. One idea is that, because the atmosphere in the vortex's interior is the last place in the northern hemisphere to be exposed to spring and summer sunlight, smog particles have not yet changed the color of the region. A second explanation hypothesizes that the polar vortex may have an internal circulation similar to hurricanes on Earth. If the Saturnian polar vortex indeed has an analogous structure to terrestrial hurricanes, the circulation should be downward in the eye of the vortex. The downward circulation should keep the atmosphere clear of the photochemical smog particles, and may explain the blue color. Images captured with Cassini's wide-angle camera using red, green and blue spectral filters were combined to create these natural-color views. The 2013 view (left in the combined view), was captured on June 25, 2013, when the spacecraft was about 430,000 miles (700,000 kilometers) away from Saturn. The original versions of these images, as sent by the spacecraft, have a size of 512 by 512 pixels and an image scale of about 52 miles (80 kilometers) per pixel; the images have been mapped in polar stereographic projection to the resolution of approximately 16 miles (25 kilometers) per pixel. The second and third frames in the animation were taken approximately 130 and 260 minutes after the first image. The 2017 sequence (right in the combined view) was captured on April 25, 2017, just before Cassini made its first dive between Saturn and its rings. During the imaging sequence, the spacecraft's distance from the center of the planet changed from 450,000 miles (725,000 kilometers) to 143,000 miles (230,000 kilometers). The original versions of these images, as sent by the spacecraft, have a size of 512 by 512 pixels. The resolution of the original images changed from about 52 miles (80 kilometers) per pixel at the beginning to about 9 miles (14 kilometers) per pixel at the end. The images have been mapped in polar stereographic projection to the resolution of approximately 16 miles (25 kilometers) per pixel. The average interval between the frames in the movie sequence is 230 minutes. Corresponding animated movie sequences are available at https://photojournal.jpl.nasa.gov/catalog/PIA21611 https://photojournal.jpl.nasa.gov/catalog/PIA21611

Images acquired December 21, 2010 - September 20, 2011. To view a HD animation of this go to: <a href="http://www.flickr.com/photos/gsfc/6175313242/in/photostream/">www.flickr.com/photos/gsfc/6175313242/in/photostream/</a> To download the high res and learn more go to: <a href="http://earthobservatory.nasa.gov/IOTD/view.php?id=52248" rel="nofollow">earthobservatory.nasa.gov/IOTD/view.php?id=52248</a> One of the most frequently misunderstood concepts in science is the reason for Earth’s seasons. As we experience the September equinox today—anyone try to balance an egg yet?—we thought we’d offer a space-based view of what’s going on. Around 6 a.m. local time each day, the Sun, Earth, and any geosynchronous satellite form a right angle, affording a nadir (straight down) view of the terminator, where the shadows of nightfall meet the sunlight of dusk and dawn. The shape of this line between night and day varies with the seasons, which means different lengths of days and differing amounts of warming sunshine. (The line is actually a curve because the Earth is round, but satellite images only show it in two-dimensions.) The Spinning Enhanced Visible and Infrared Imager (SEVIRI) on EUMETSAT's Meteosat-9 captured these four views of the day-night terminator on December 21, 2010, and March 20, June 21, and September 20, 2011. Each image was taken at 6:12 a.m. local time. On March 20 and September 20, the terminator is a straight north-south line, and the Sun is said to sit directly above the equator. On December 21, the Sun resides directly over the Tropic of Capricorn when viewed from the ground, and sunlight spreads over more of the Southern Hemisphere. On June 21, the Sun sits above the Tropic of Cancer, spreading more sunlight in the north and turning the tables on the south. The bulge of our spherical Earth blocks sunlight from the far hemisphere at the solstices; that same curvature allows the Sun’s rays to spread over more area near the top and bottom of the globe. Of course, it is not the Sun that is moving north or south through the seasons, but a change in the orientation and angles between the Earth and its nearest star. The axis of the Earth is tilted 23.5 degrees relative to the Sun and the ecliptic plane. The axis is tilted away from the Sun at the December solstice and toward the Sun at the June solstice, spreading more and less light on each hemisphere. At the equinoxes, the tilt is at a right angle to the Sun and the light is spread evenly. The equinox and changing of the seasons occurs on September 23, 2011 at 9:05 a.m. Universal Time. (Our September image above is a few days early.) Equinox means "equal night" in Latin, capturing the idea that daytime and nighttime are equal lengths everywhere on the planet. That is true of the Sun's presence above the horizon, though it does not account for twilight, when the Sun's rays extend from beyond the horizon to illuminate our gas-filled atmosphere. NASA images and animation by Robert Simmon, using data ©2010 EUMETSAT. Caption by Mike Carlowicz. Instrument: Meteosat Credit: <b><a href="http://www.earthobservatory.nasa.gov/" rel="nofollow"> NASA Earth Observatory</a></b> <b><a href="http://www.nasa.gov/audience/formedia/features/MP_Photo_Guidelines.html" rel="nofollow">NASA image use policy.</a></b> <b><a href="http://www.nasa.gov/centers/goddard/home/index.html" rel="nofollow">NASA Goddard Space Flight Center</a></b> enables NASA’s mission through four scientific endeavors: Earth Science, Heliophysics, Solar System Exploration, and Astrophysics. Goddard plays a leading role in NASA’s accomplishments by contributing compelling scientific knowledge to advance the Agency’s mission. <b>Follow us on <a href="http://twitter.com/NASAGoddardPix" rel="nofollow">Twitter</a></b> <b>Like us on <a href="http://www.facebook.com/pages/Greenbelt-MD/NASA-Goddard/395013845897?ref=tsd" rel="nofollow">Facebook</a></b> <b>Find us on <a href="http://instagrid.me/nasagoddard/?vm=grid" rel="nofollow">Instagram</a></b>
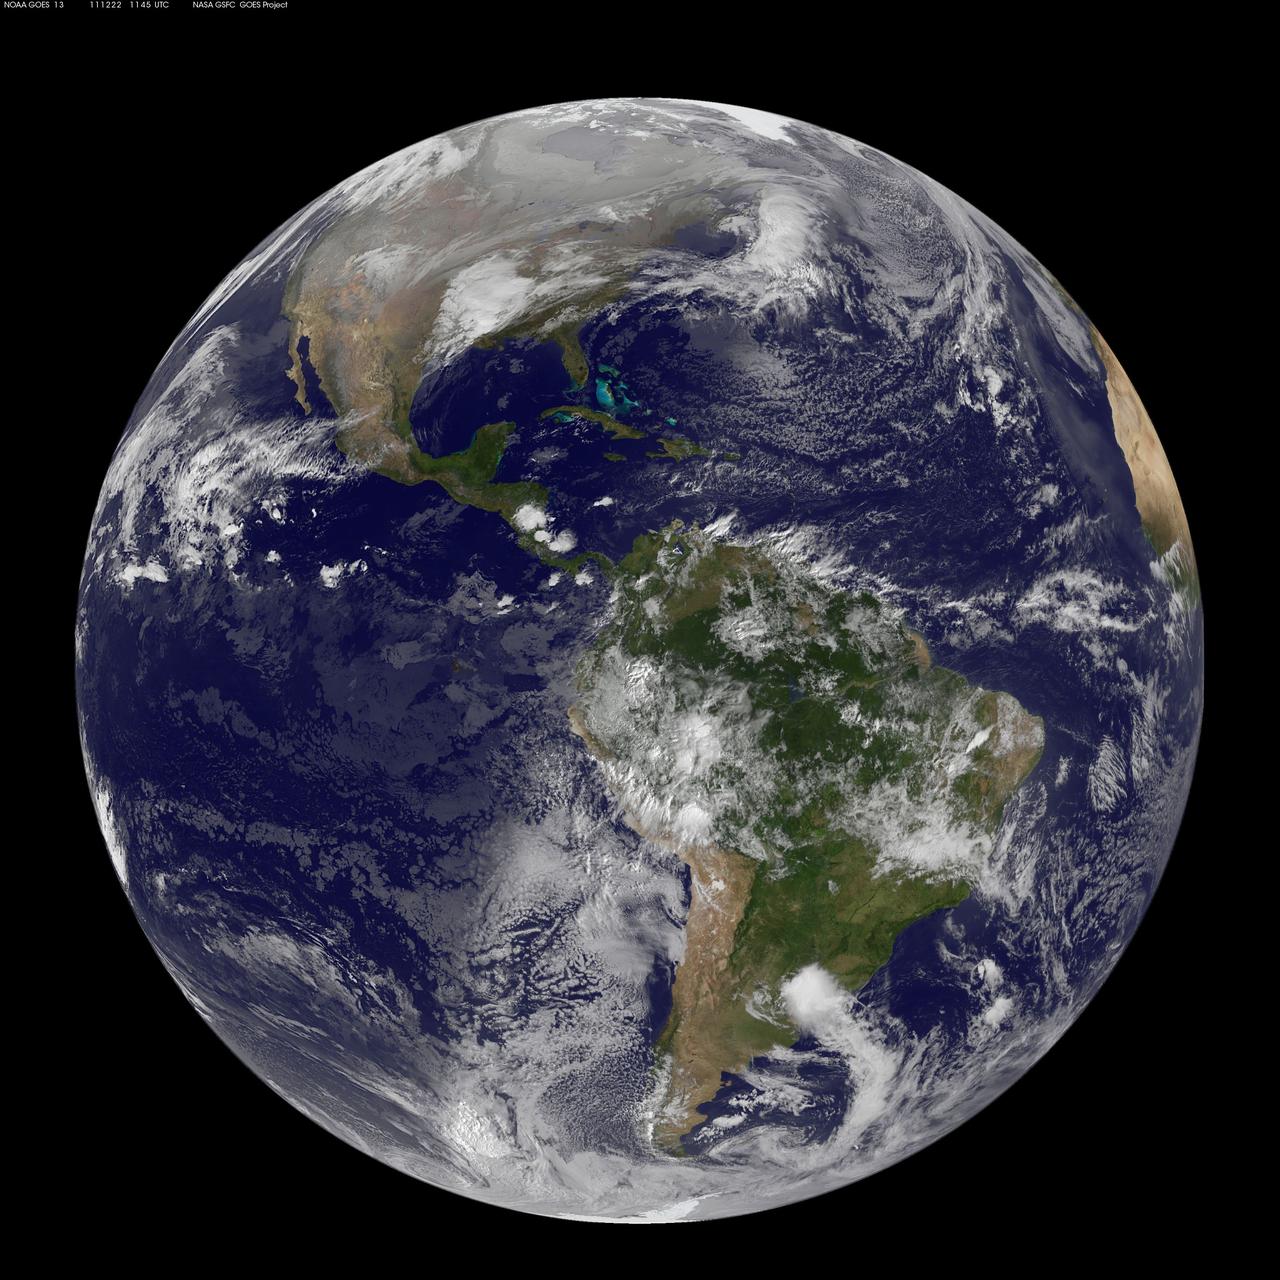
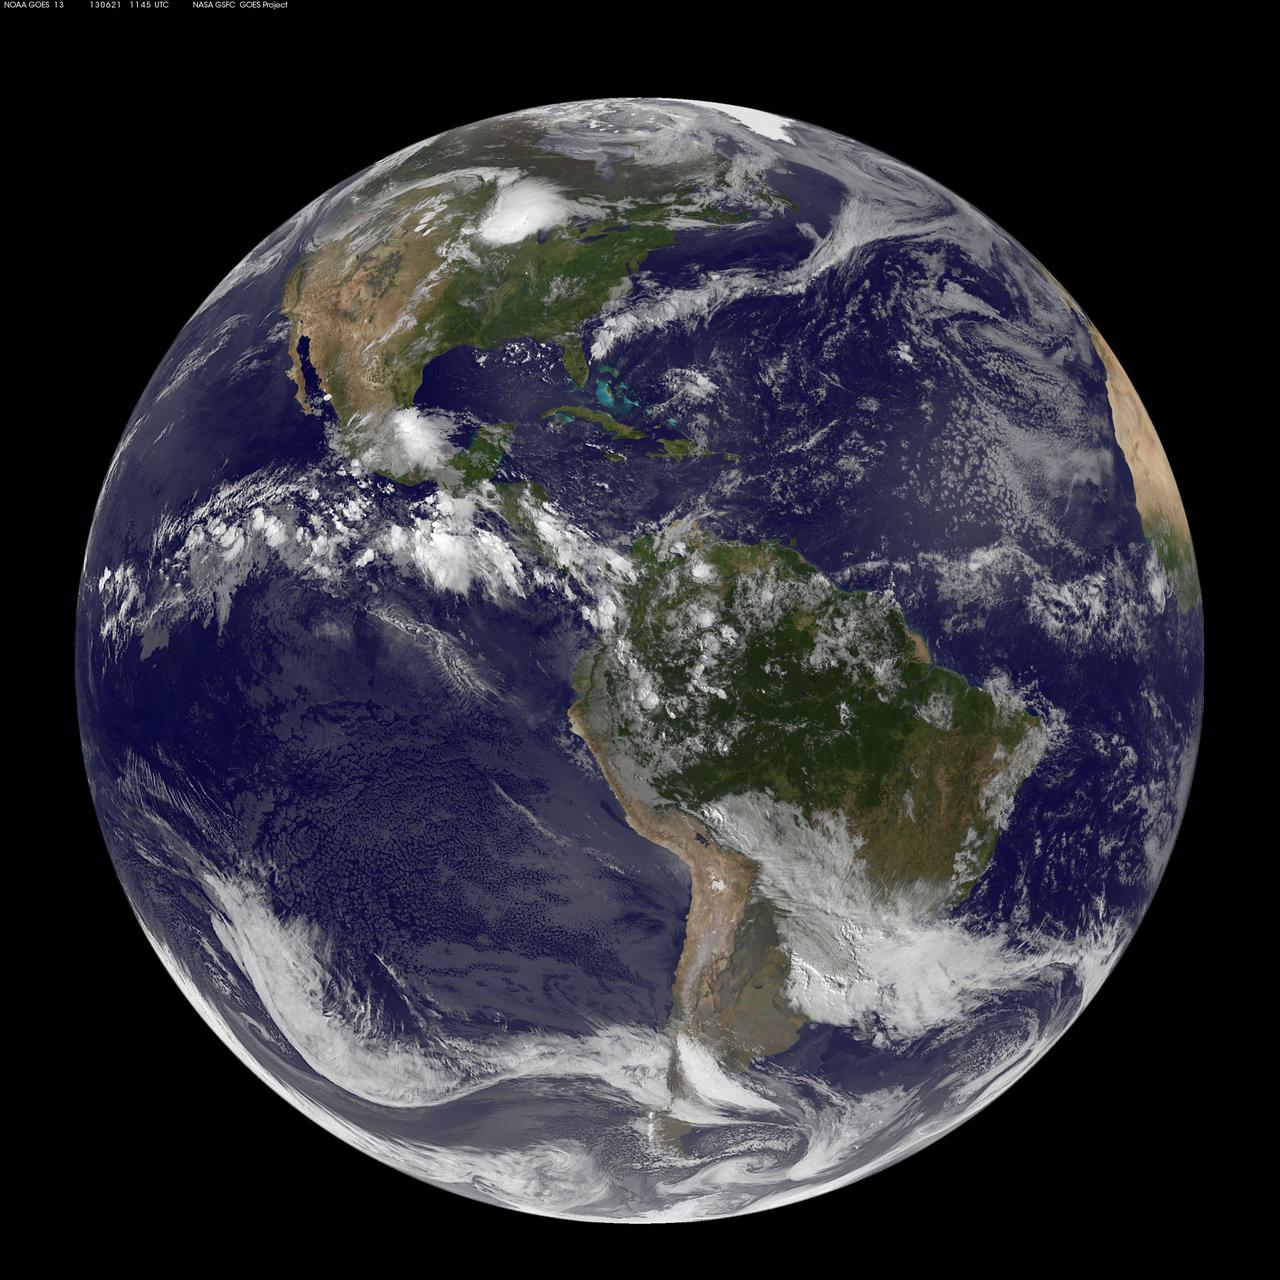
Image acquired December 22, 2011 NOAA's GOES-13 satellite captured this image of Earth on the first day of the winter solstice, December 22, 2011 at 11:45 UTC. The GOES-13 cloud images are overlaid on a true-color NASA/MODIS map by the NASA/NOAA GOES Project at NASA's Goddard Space Flight Center in Greenbelt, Md. <b><a href="http://goes.gsfc.nasa.gov/" rel="nofollow">Credit: NOAA/NASA GOES Project</a></b> <b><a href="http://www.nasa.gov/audience/formedia/features/MP_Photo_Guidelines.html" rel="nofollow">NASA image use policy.</a></b> <b><a href="http://www.nasa.gov/centers/goddard/home/index.html" rel="nofollow">NASA Goddard Space Flight Center</a></b> enables NASA’s mission through four scientific endeavors: Earth Science, Heliophysics, Solar System Exploration, and Astrophysics. Goddard plays a leading role in NASA’s accomplishments by contributing compelling scientific knowledge to advance the Agency’s mission. <b>Follow us on <a href="http://twitter.com/NASA_GoddardPix" rel="nofollow">Twitter</a></b> <b>Like us on <a href="http://www.facebook.com/pages/Greenbelt-MD/NASA-Goddard/395013845897?ref=tsd" rel="nofollow">Facebook</a></b> <b>Find us on <a href="http://instagrid.me/nasagoddard/?vm=grid" rel="nofollow">Instagram</a></b>
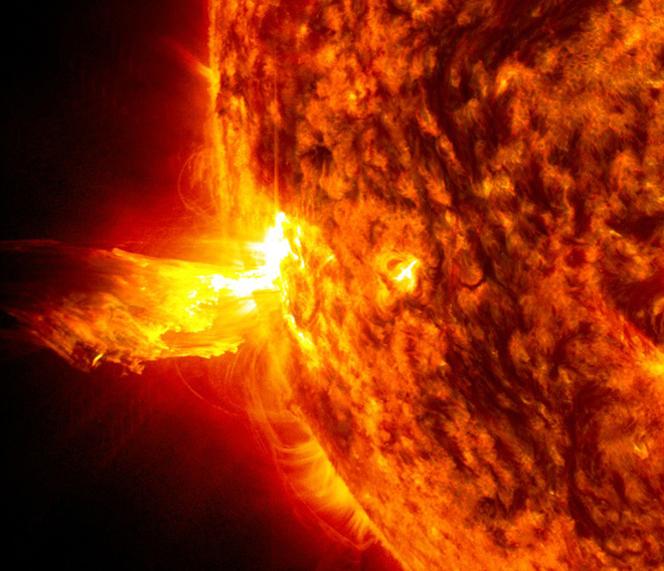
Caption: This image from June 20, 2013, at 11:15 p.m. EDT shows the bright light of a solar flare on the left side of the sun and an eruption of solar material shooting through the sun’s atmosphere, called a prominence eruption. Shortly thereafter, this same region of the sun sent a coronal mass ejection out into space. --- On June 20, 2013, at 11:24 p.m., the sun erupted with an Earth-directed coronal mass ejection or CME, a solar phenomenon that can send billions of tons of particles into space that can reach Earth one to three days later. These particles cannot travel through the atmosphere to harm humans on Earth, but they can affect electronic systems in satellites and on the ground. Experimental NASA research models, based on observations from NASA’s Solar Terrestrial Relations Observatory and ESA/NASA’s Solar and Heliospheric Observatory show that the CME left the sun at speeds of around 1350 miles per second, which is a fast speed for CMEs. Earth-directed CMEs can cause a space weather phenomenon called a geomagnetic storm, which occurs when they funnel energy into Earth's magnetic envelope, the magnetosphere, for an extended period of time. The CME’s magnetic fields peel back the outermost layers of Earth's fields changing their very shape. Magnetic storms can degrade communication signals and cause unexpected electrical surges in power grids. They also can cause aurora. Storms are rare during solar minimum, but as the sun’s activity ramps up every 11 years toward solar maximum – currently expected in late 2013 -- large storms occur several times per year. In the past, geomagnetic storms caused by CMEs of this strength and direction have usually been mild. Credit: NASA/Goddard/SDO <b><a href="http://www.nasa.gov/audience/formedia/features/MP_Photo_Guidelines.html" rel="nofollow">NASA image use policy.</a></b> <b><a href="http://www.nasa.gov/centers/goddard/home/index.html" rel="nofollow">NASA Goddard Space Flight Center</a></b> enables NASA’s mission through four scientific endeavors: Earth Science, Heliophysics, Solar System Exploration, and Astrophysics. Goddard plays a leading role in NASA’s accomplishments by contributing compelling scientific knowledge to advance the Agency’s mission. <b>Follow us on <a href="http://twitter.com/NASA_GoddardPix" rel="nofollow">Twitter</a></b> <b>Like us on <a href="http://www.facebook.com/pages/Greenbelt-MD/NASA-Goddard/395013845897?ref=tsd" rel="nofollow">Facebook</a></b> <b>Find us on <a href="http://instagram.com/nasagoddard?vm=grid" rel="nofollow">Instagram</a></b>

Caption: This image from June 20, 2013, at 11:15 p.m. EDT shows the bright light of a solar flare on the left side of the sun and an eruption of solar material shooting through the sun’s atmosphere, called a prominence eruption. Shortly thereafter, this same region of the sun sent a coronal mass ejection out into space. --- On June 20, 2013, at 11:24 p.m., the sun erupted with an Earth-directed coronal mass ejection or CME, a solar phenomenon that can send billions of tons of particles into space that can reach Earth one to three days later. These particles cannot travel through the atmosphere to harm humans on Earth, but they can affect electronic systems in satellites and on the ground. Experimental NASA research models, based on observations from NASA’s Solar Terrestrial Relations Observatory and ESA/NASA’s Solar and Heliospheric Observatory show that the CME left the sun at speeds of around 1350 miles per second, which is a fast speed for CMEs. Earth-directed CMEs can cause a space weather phenomenon called a geomagnetic storm, which occurs when they funnel energy into Earth's magnetic envelope, the magnetosphere, for an extended period of time. The CME’s magnetic fields peel back the outermost layers of Earth's fields changing their very shape. Magnetic storms can degrade communication signals and cause unexpected electrical surges in power grids. They also can cause aurora. Storms are rare during solar minimum, but as the sun’s activity ramps up every 11 years toward solar maximum – currently expected in late 2013 -- large storms occur several times per year. In the past, geomagnetic storms caused by CMEs of this strength and direction have usually been mild. Read more: <a href="http://1.usa.gov/14OxuEe" rel="nofollow">1.usa.gov/14OxuEe</a> Credit: NASA/Goddard/SDO <b><a href="http://www.nasa.gov/audience/formedia/features/MP_Photo_Guidelines.html" rel="nofollow">NASA image use policy.</a></b> <b><a href="http://www.nasa.gov/centers/goddard/home/index.html" rel="nofollow">NASA Goddard Space Flight Center</a></b> enables NASA’s mission through four scientific endeavors: Earth Science, Heliophysics, Solar System Exploration, and Astrophysics. Goddard plays a leading role in NASA’s accomplishments by contributing compelling scientific knowledge to advance the Agency’s mission. <b>Follow us on <a href="http://twitter.com/NASA_GoddardPix" rel="nofollow">Twitter</a></b> <b>Like us on <a href="http://www.facebook.com/pages/Greenbelt-MD/NASA-Goddard/395013845897?ref=tsd" rel="nofollow">Facebook</a></b> <b>Find us on <a href="http://instagram.com/nasagoddard?vm=grid" rel="nofollow">Instagram</a></b>
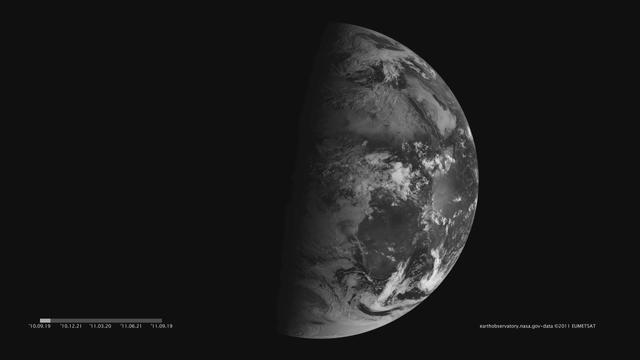
Images acquired December 21, 2010 - September 20, 2011. To download the high res and learn more go to: <a href="http://earthobservatory.nasa.gov/IOTD/view.php?id=52248" rel="nofollow">earthobservatory.nasa.gov/IOTD/view.php?id=52248</a> One of the most frequently misunderstood concepts in science is the reason for Earth’s seasons. As we experience the September equinox today—anyone try to balance an egg yet?—we thought we’d offer a space-based view of what’s going on. Around 6 a.m. local time each day, the Sun, Earth, and any geosynchronous satellite form a right angle, affording a nadir (straight down) view of the terminator, where the shadows of nightfall meet the sunlight of dusk and dawn. The shape of this line between night and day varies with the seasons, which means different lengths of days and differing amounts of warming sunshine. (The line is actually a curve because the Earth is round, but satellite images only show it in two-dimensions.) The Spinning Enhanced Visible and Infrared Imager (SEVIRI) on EUMETSAT's Meteosat-9 captured these four views of the day-night terminator on December 21, 2010, and March 20, June 21, and September 20, 2011. Each image was taken at 6:12 a.m. local time. On March 20 and September 20, the terminator is a straight north-south line, and the Sun is said to sit directly above the equator. On December 21, the Sun resides directly over the Tropic of Capricorn when viewed from the ground, and sunlight spreads over more of the Southern Hemisphere. On June 21, the Sun sits above the Tropic of Cancer, spreading more sunlight in the north and turning the tables on the south. The bulge of our spherical Earth blocks sunlight from the far hemisphere at the solstices; that same curvature allows the Sun’s rays to spread over more area near the top and bottom of the globe. Of course, it is not the Sun that is moving north or south through the seasons, but a change in the orientation and angles between the Earth and its nearest star. The axis of the Earth is tilted 23.5 degrees relative to the Sun and the ecliptic plane. The axis is tilted away from the Sun at the December solstice and toward the Sun at the June solstice, spreading more and less light on each hemisphere. At the equinoxes, the tilt is at a right angle to the Sun and the light is spread evenly. The equinox and changing of the seasons occurs on September 23, 2011 at 9:05 a.m. Universal Time. (Our September image above is a few days early.) Equinox means "equal night" in Latin, capturing the idea that daytime and nighttime are equal lengths everywhere on the planet. That is true of the Sun's presence above the horizon, though it does not account for twilight, when the Sun's rays extend from beyond the horizon to illuminate our gas-filled atmosphere. <b>NASA images and animation by Robert Simmon, using data ©2010 EUMETSAT. Caption by Mike Carlowicz.</b> Instrument: Meteosat Credit: <b><a href="http://www.earthobservatory.nasa.gov/" rel="nofollow"> NASA Earth Observatory</a></b> <b><a href="http://www.nasa.gov/audience/formedia/features/MP_Photo_Guidelines.html" rel="nofollow">NASA image use policy.</a></b> <b><a href="http://www.nasa.gov/centers/goddard/home/index.html" rel="nofollow">NASA Goddard Space Flight Center</a></b> enables NASA’s mission through four scientific endeavors: Earth Science, Heliophysics, Solar System Exploration, and Astrophysics. Goddard plays a leading role in NASA’s accomplishments by contributing compelling scientific knowledge to advance the Agency’s mission. <b>Follow us on <a href="http://twitter.com/NASAGoddardPix" rel="nofollow">Twitter</a></b> <b>Like us on <a href="http://www.facebook.com/pages/Greenbelt-MD/NASA-Goddard/395013845897?ref=tsd" rel="nofollow">Facebook</a></b> <b>Find us on <a href="http://instagrid.me/nasagoddard/?vm=grid" rel="nofollow">Instagram</a></b>
This full-disk image from NOAA’s GOES-13 satellite was captured at 11:45 UTC (7:45 a.m. EDT) and shows the Americas on June 21, 2012. This date marks the start of astronomical summer in the northern hemisphere, making it the longest day of the year! <b><a href="http://www.nasa.gov/audience/formedia/features/MP_Photo_Guidelines.html" rel="nofollow">NASA image use policy.</a></b> <b><a href="http://www.nasa.gov/centers/goddard/home/index.html" rel="nofollow">NASA Goddard Space Flight Center</a></b> enables NASA’s mission through four scientific endeavors: Earth Science, Heliophysics, Solar System Exploration, and Astrophysics. Goddard plays a leading role in NASA’s accomplishments by contributing compelling scientific knowledge to advance the Agency’s mission. <b>Follow us on <a href="http://twitter.com/NASA_GoddardPix" rel="nofollow">Twitter</a></b> <b>Like us on <a href="http://www.facebook.com/pages/Greenbelt-MD/NASA-Goddard/395013845897?ref=tsd" rel="nofollow">Facebook</a></b> <b>Find us on <a href="http://instagram.com/nasagoddard?vm=grid" rel="nofollow">Instagram</a></b>
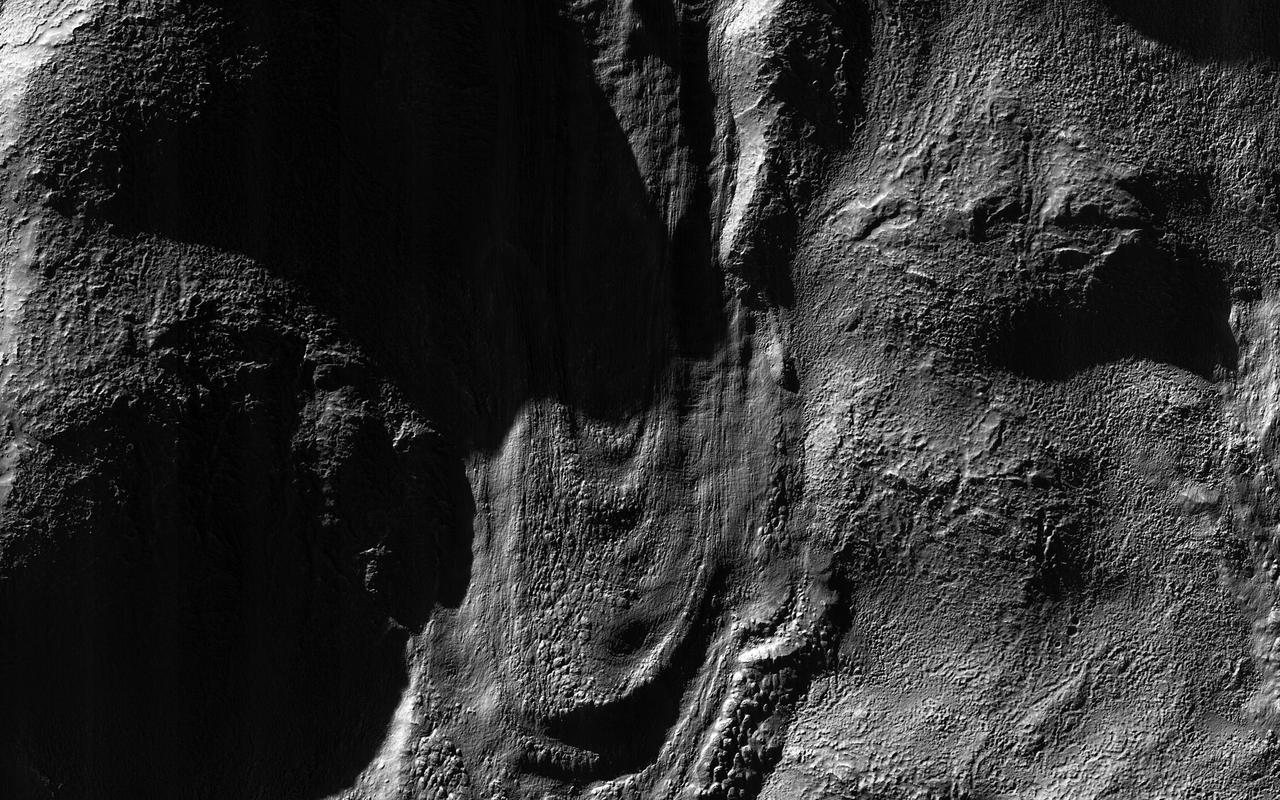
This image from NASA Mars Reconnaissance Orbiter spacecraft was acquired near the Martian winter solstice, when the sun was low over the horizon at this location.
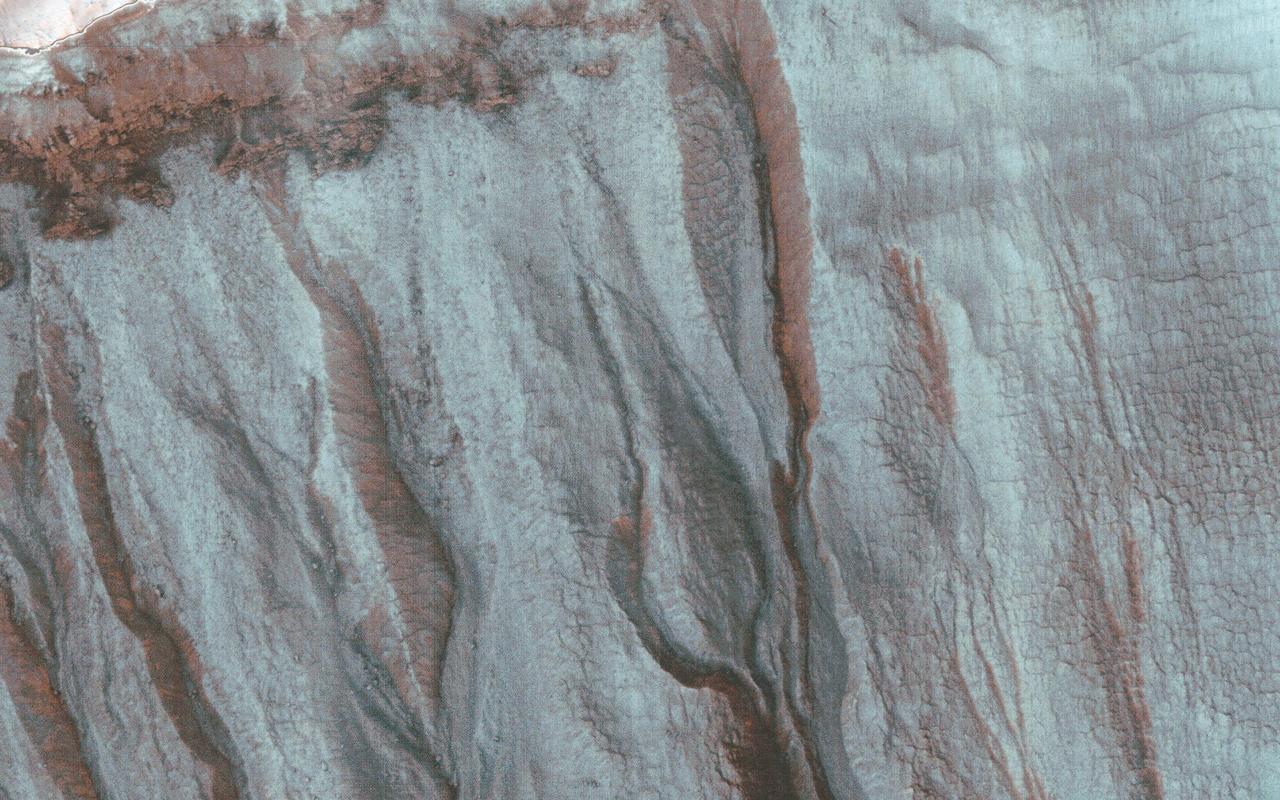
This image was acquired by NASA Mars Reconnaissance Orbiter spacecraft just after the northern winter solstice, when Southern hemisphere shadows are longest.
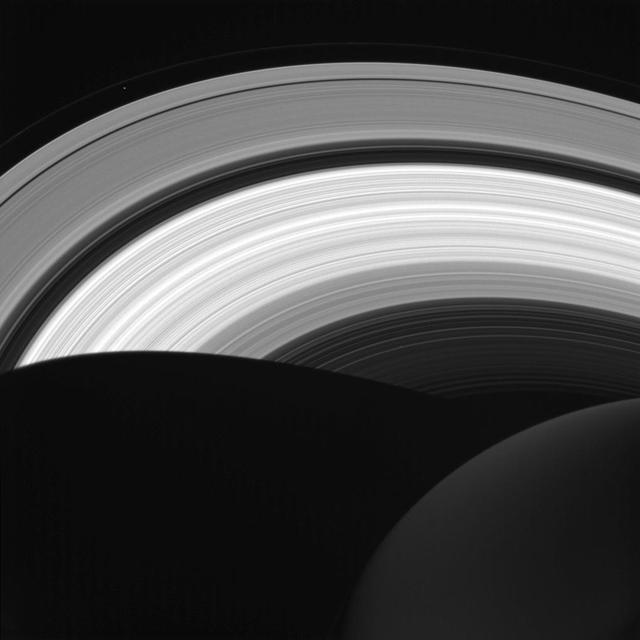
Saturn's northern hemisphere reached its summer solstice in mid-2017, bringing continuous sunshine to the planet's far north. The solstice took place on May 24, 2017. The Cassini mission is using the unparalleled opportunity to observe changes that occur on the planet as the Saturnian seasons turn. This view looks toward the sunlit side of the rings from about 17 degrees above the ring plane. The image was taken with the Cassini spacecraft wide-angle camera on April 17, 2017 using a spectral filter which preferentially admits wavelengths of near-infrared light centered at 939 nanometers. The view was acquired at a distance of approximately 733,000 miles (1.2 million kilometers) from Saturn. Image scale is 44 miles (70 kilometers) per pixel. https://photojournal.jpl.nasa.gov/catalog/PIA21337
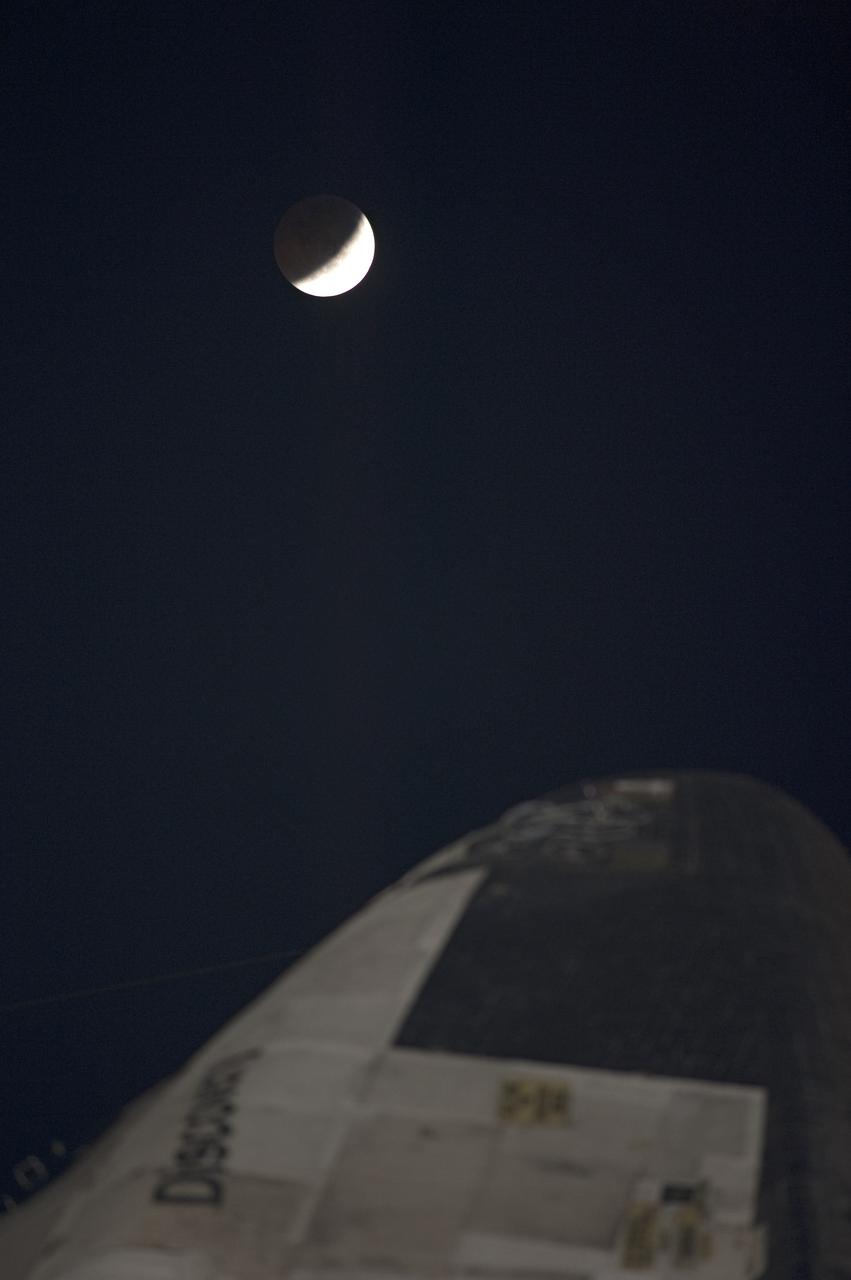
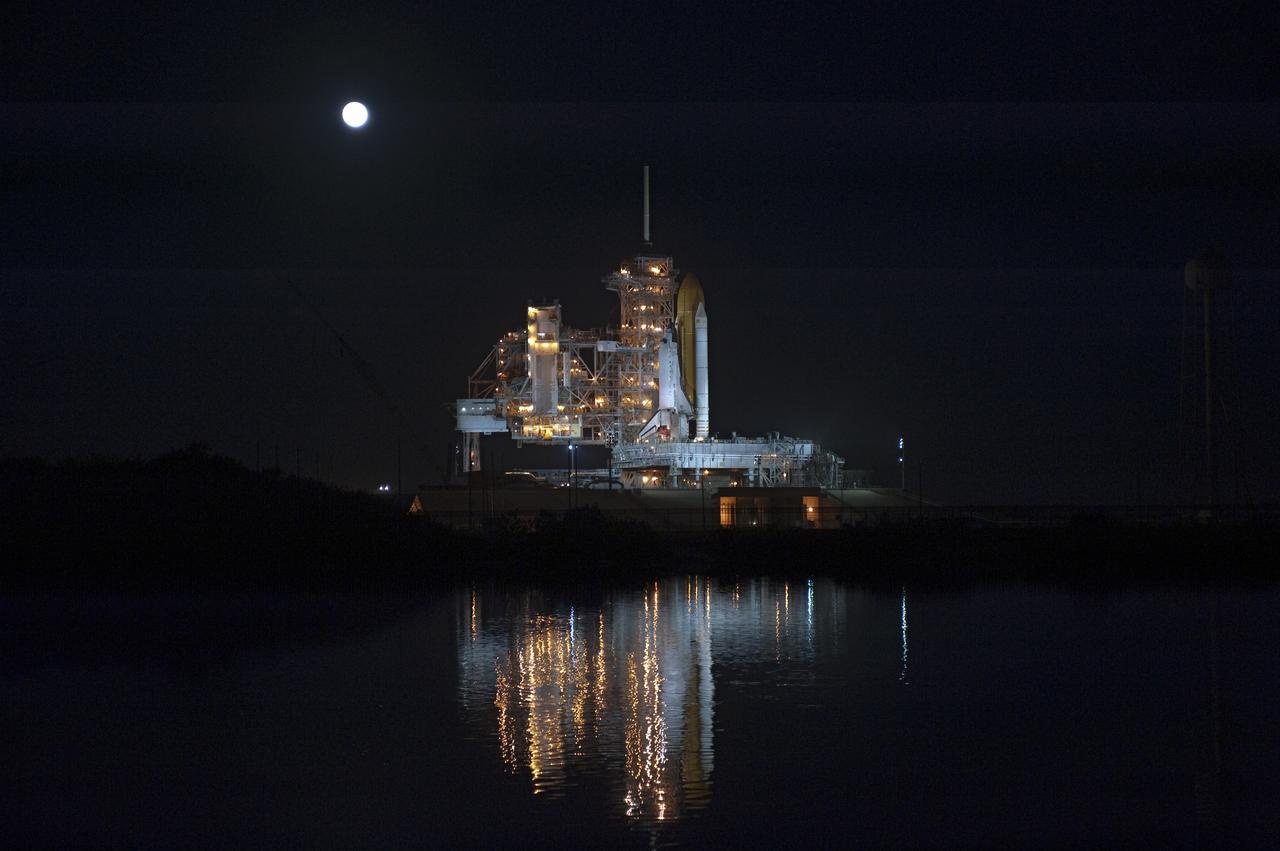
STS-133 Discovery on Pad 39A with Winter Solstice Moon Eclipse - scrubbed Rollback to VAB
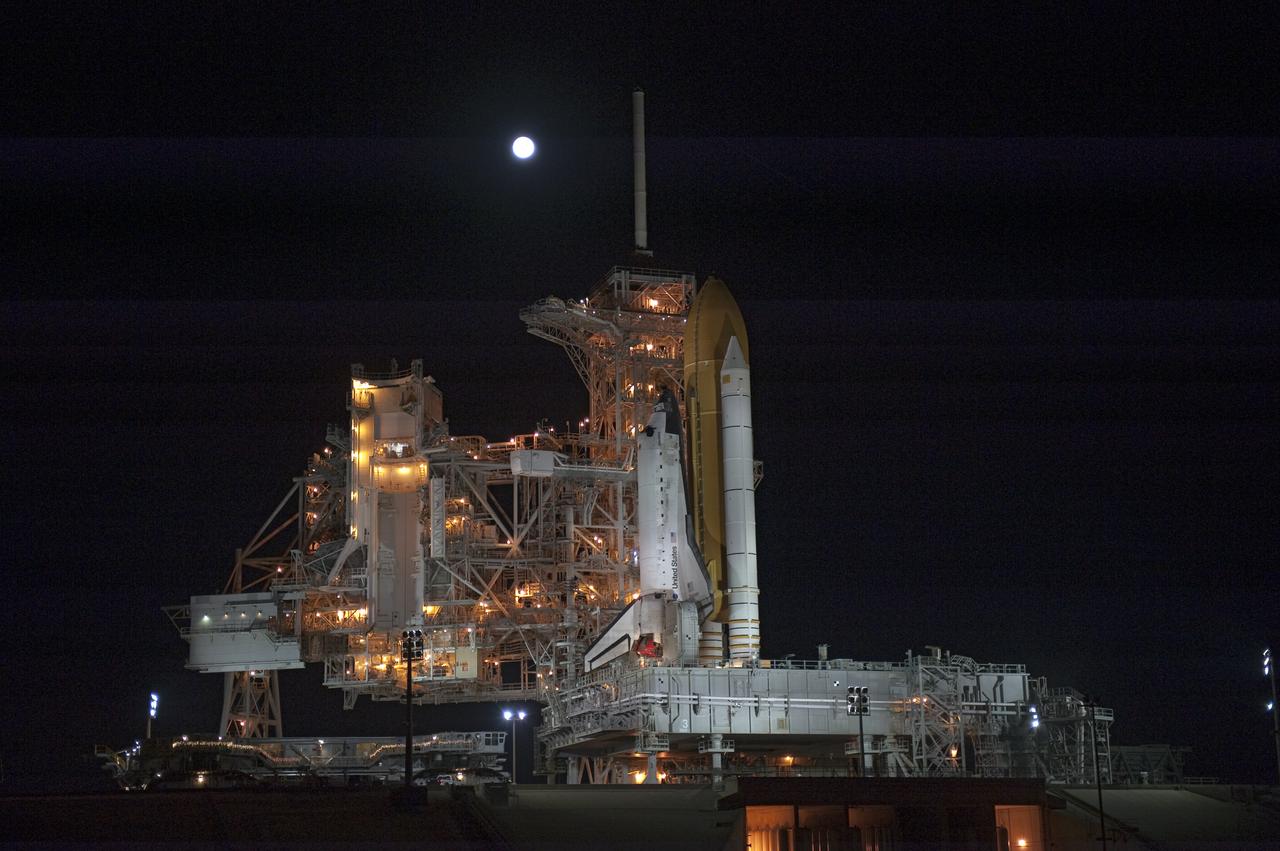
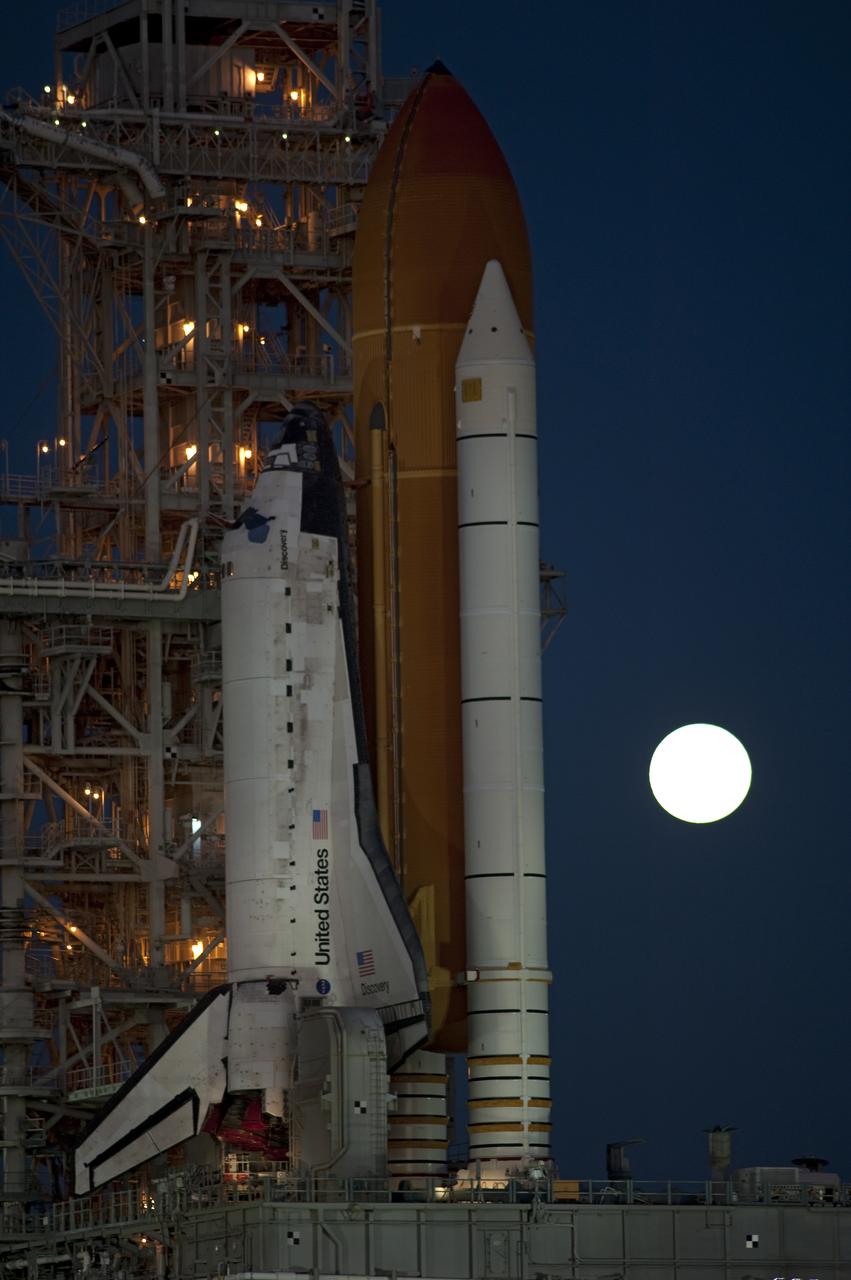
STS-133 Discovery on Pad 39A with Winter Solstice Moon Eclipse - scrubbed Rollback to VAB
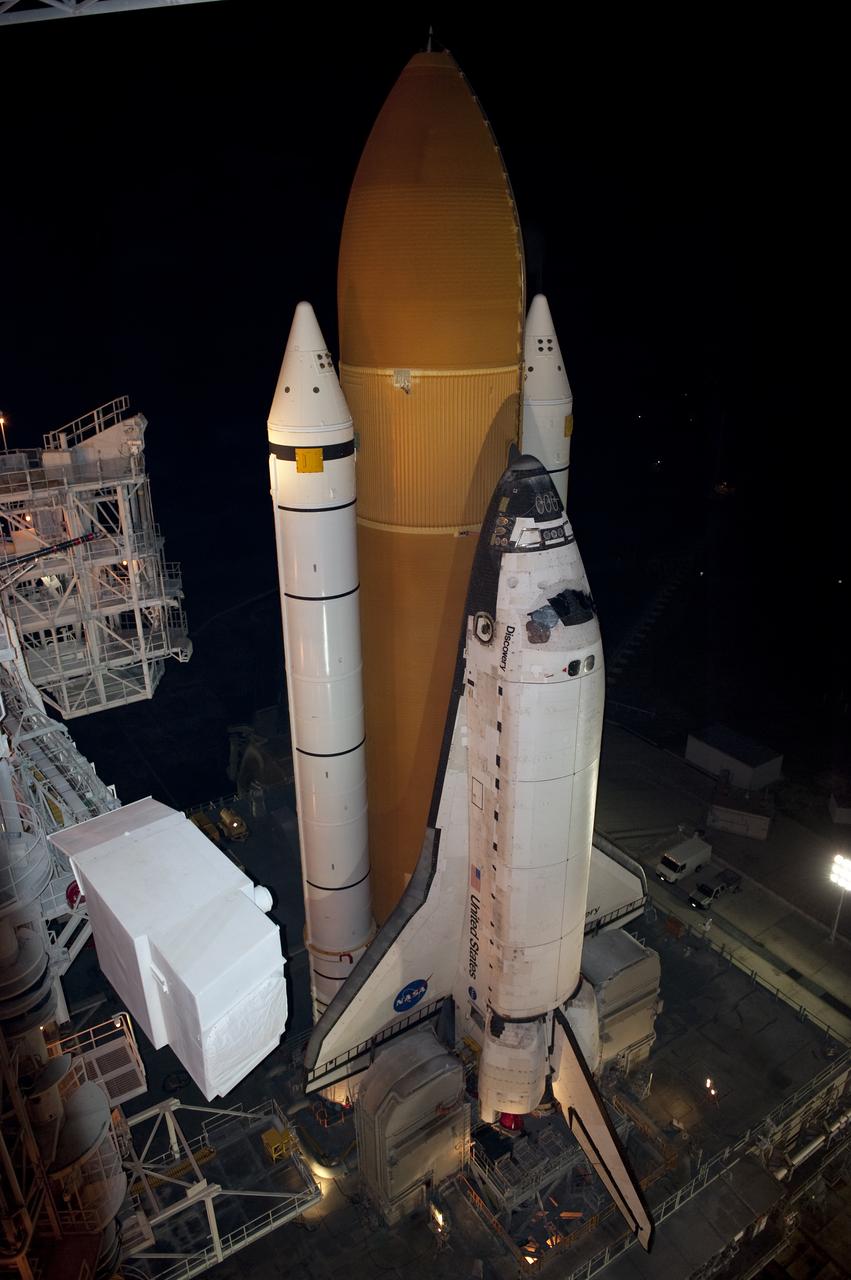
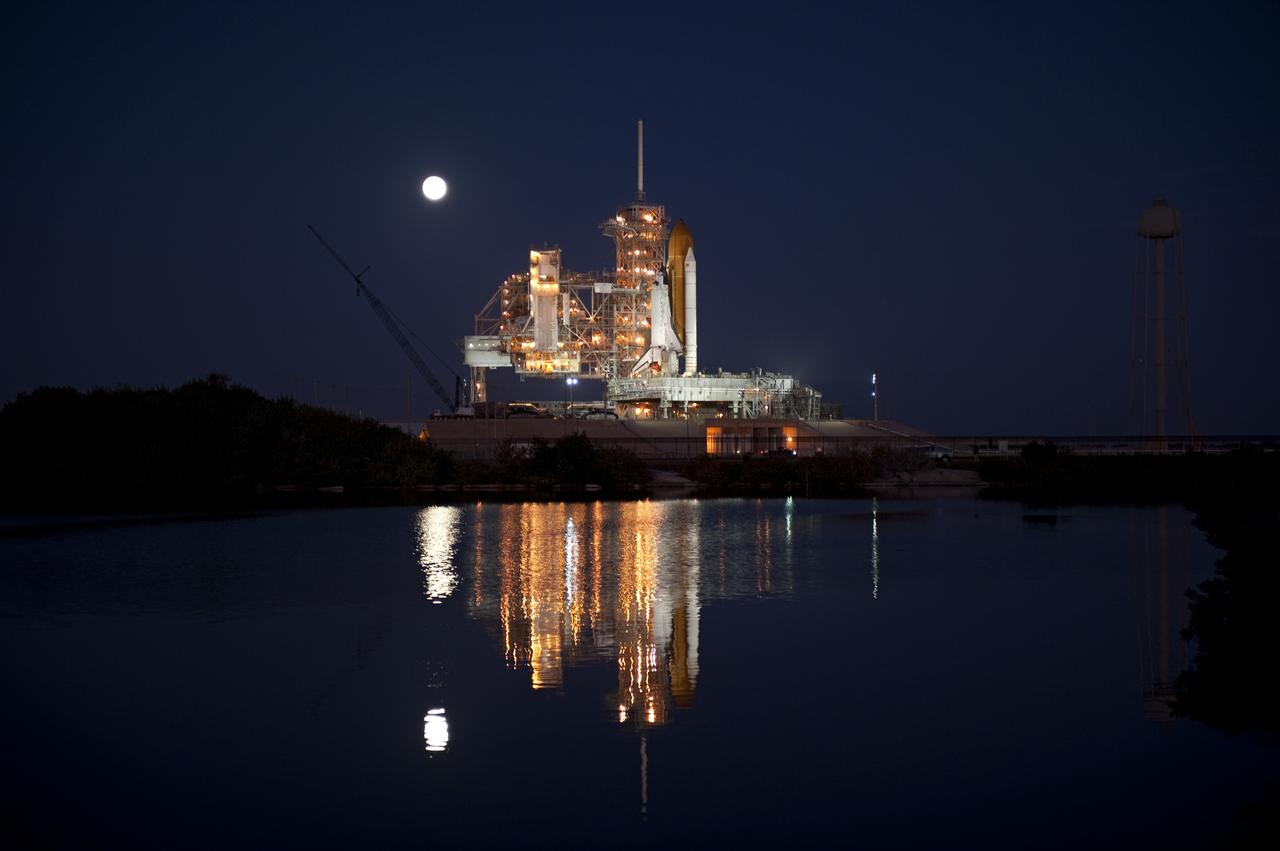
STS-133 Discovery on Pad 39A with Winter Solstice Moon Eclipse - scrubbed Rollback to VAB
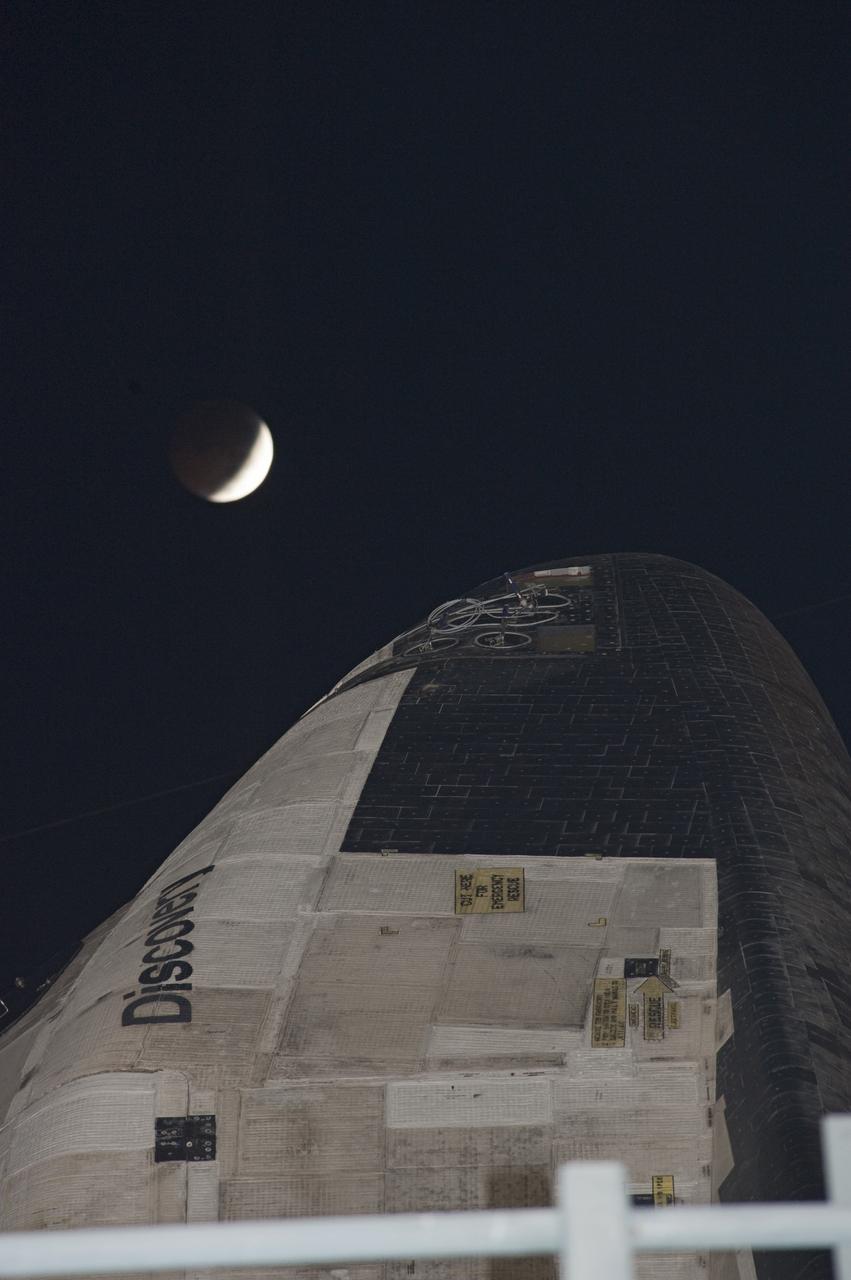
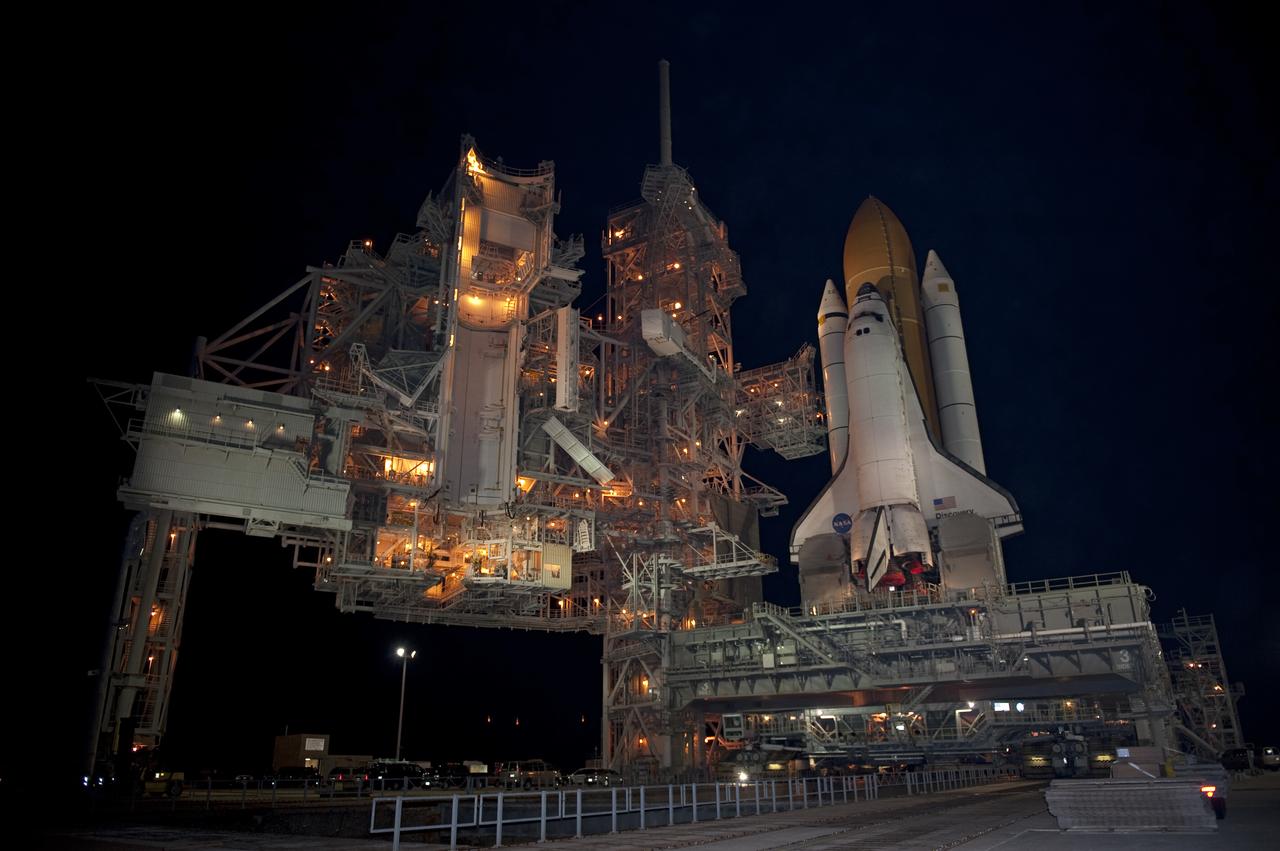
STS-133 Discovery on Pad 39A with Winter Solstice Moon Eclipse - scrubbed Rollback to VAB
STS-133 Discovery on Pad 39A with Winter Solstice Moon Eclipse - scrubbed Rollback to VAB
STS-133 Discovery on Pad 39A with Winter Solstice Moon Eclipse - scrubbed Rollback to VAB
STS-133 Discovery on Pad 39A with Winter Solstice Moon Eclipse - scrubbed Rollback to VAB
STS-133 Discovery on Pad 39A with Winter Solstice Moon Eclipse - scrubbed Rollback to VAB
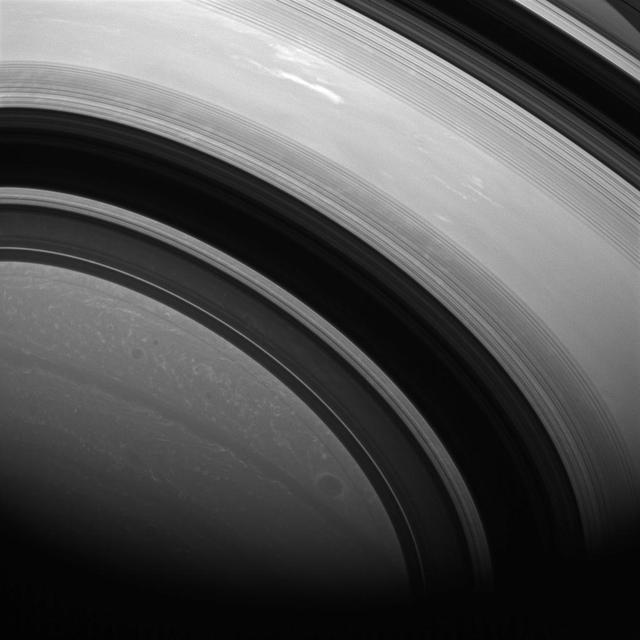
The shadows of Saturn rings edge ever farther southward as Saturn creeps towards southern winter or northern summer. Saturn is now almost exactly halfway between its equinox August 2009 and southern winter solstice in May 2017.
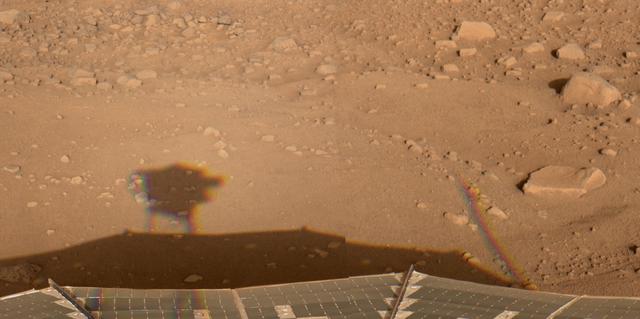
This image was acquired by NASA Phoenix Mars Lander Surface Stereo Imager SSI in the late afternoon of the 30th Martian day of the mission, or Sol 30 June 25, 2008. This is hours after the beginning of Martian northern summer.
A total lunar eclipse begins as the full moon is shadowed by the Earth on the arrival of the winter solstice, Tuesday, December 21, 2010 in Arlington, VA. From beginning to end, the eclipse will last about three hours and twenty-eight minutes. Photo Credit: (NASA/Bill Ingalls)
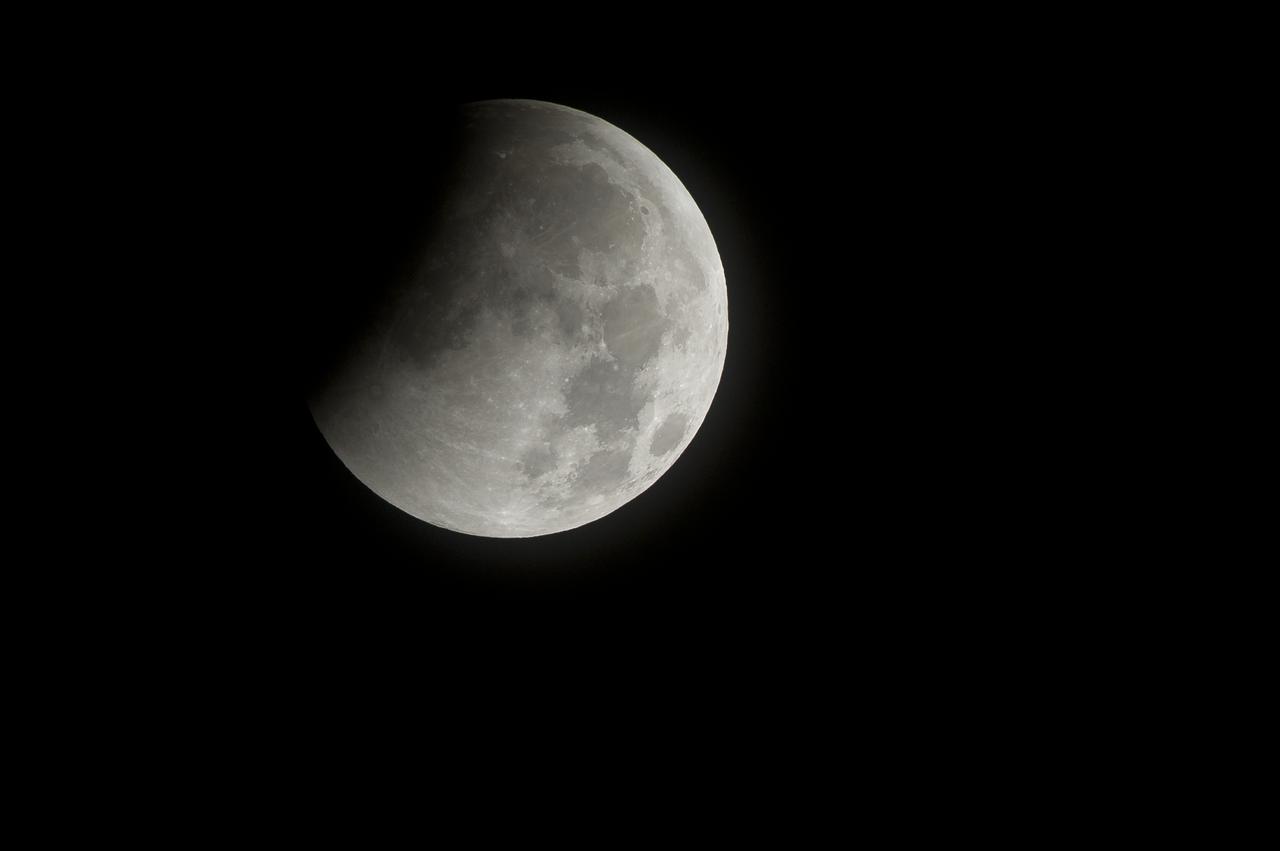
A nearly total lunar eclipse is seen as the full moon is shadowed by the Earth on the arrival of the winter solstice, Tuesday, December 21, 2010 in Arlington, VA. From beginning to end, the eclipse will last about three hours and twenty-eight minutes. Photo Credit: (NASA/Bill Ingalls)
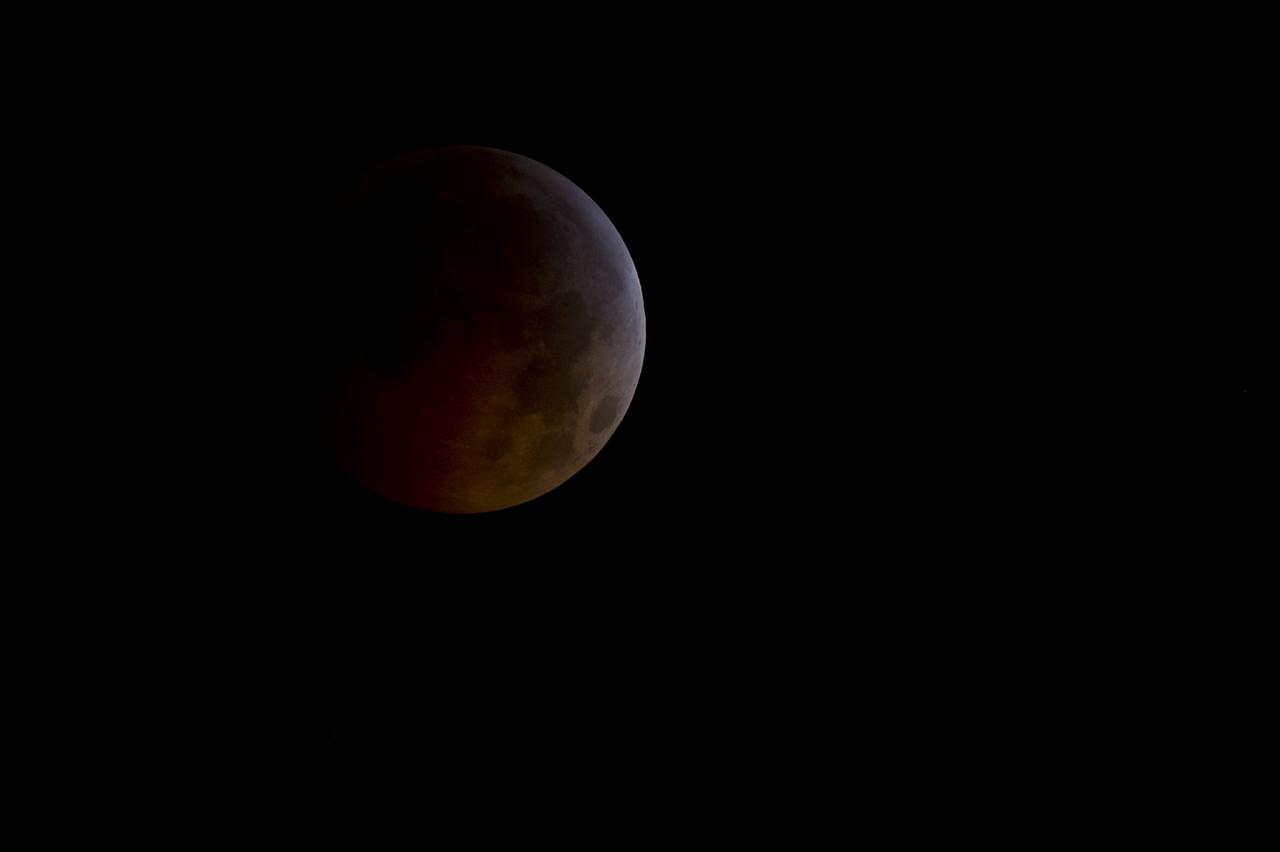
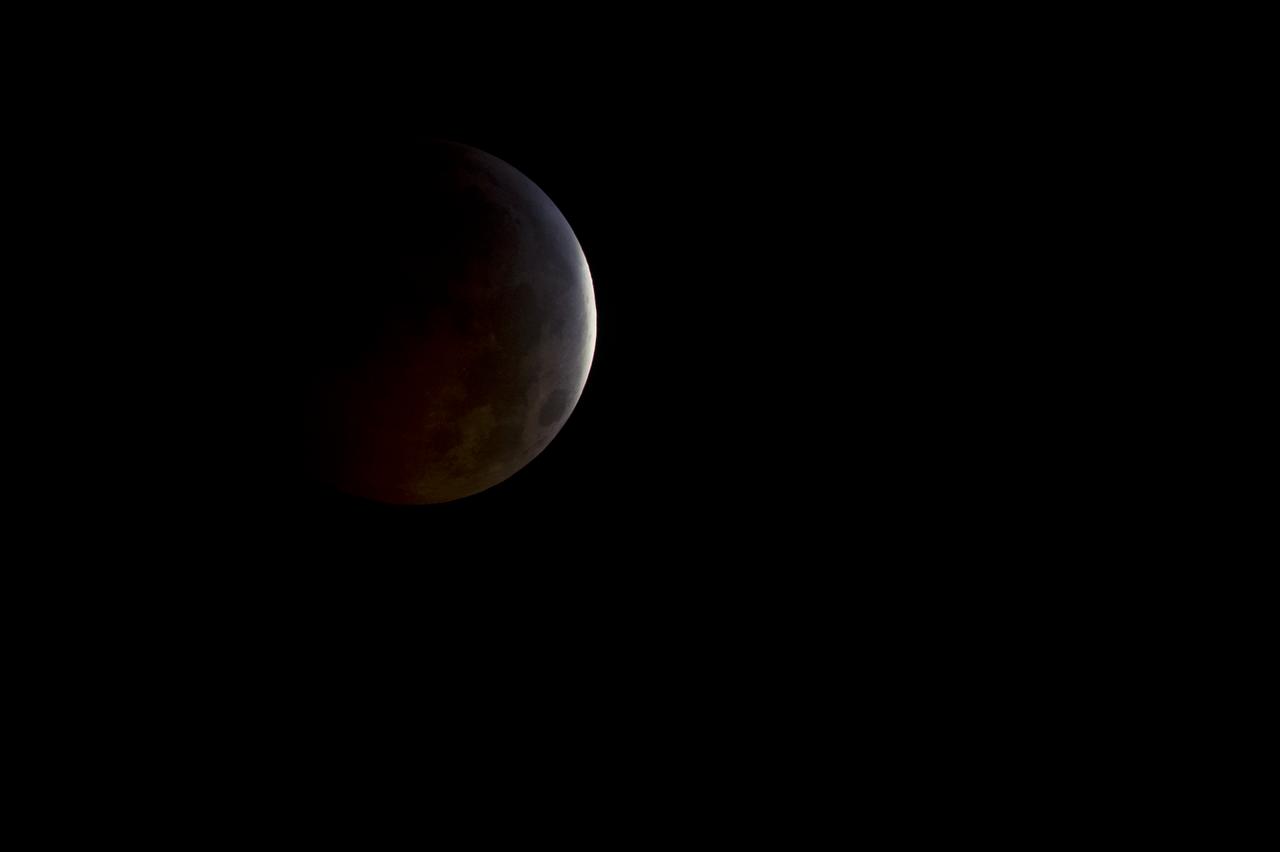
A total lunar eclipse is seen as the full moon is shadowed by the Earth on the arrival of the winter solstice, Tuesday, December 21, 2010 in Arlington, VA. From beginning to end, the eclipse will last about three hours and twenty-eight minutes. Photo Credit: (NASA/Bill Ingalls)

The Washington Monument is seen as the full moon is shadowed by the Earth during a total lunar eclipse on the arrival of the winter solstice, Tuesday, December 21, 2010 in Washington. From beginning to end, the eclipse lasted about three hours and twenty-eight minutes. Photo Credit: (NASA/Bill Ingalls)
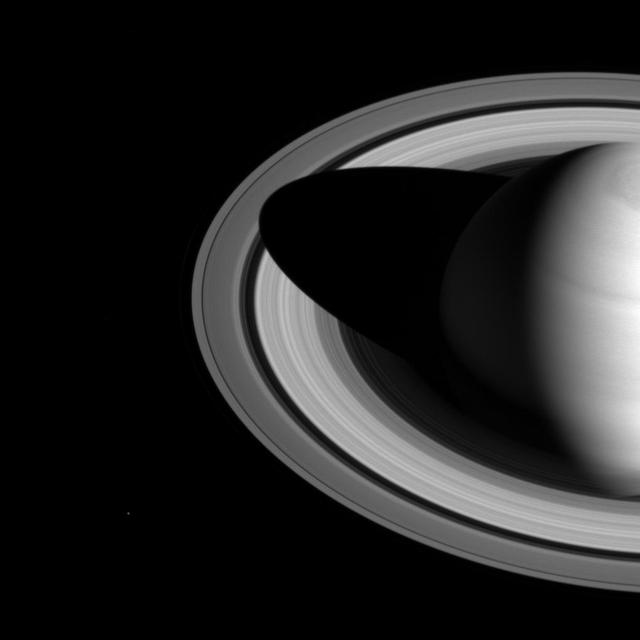
The shadow of Saturn on the rings, which stretched across all of the rings earlier in Cassini's mission (see PIA08362), now barely makes it past the Cassini division. The changing length of the shadow marks the passing of the seasons on Saturn. As the planet nears its northern-hemisphere solstice in May 2017, the shadow will get even shorter. At solstice, the shadow's edge will be about 28,000 miles (45,000 kilometers) from the planet's surface, barely making it past the middle of the B ring. The moon Mimas is a few pixels wide, near the lower left in this image. This view looks toward the sunlit side of the rings from about 35 degrees above the ring plane. The image was taken in visible light with the Cassini spacecraft wide-angle camera on May 21, 2016. The view was obtained at a distance of approximately 2.0 million miles (3.2 million kilometers) from Saturn. Image scale is 120 miles (190 kilometers) per pixel. http://photojournal.jpl.nasa.gov/catalog/PIA20494
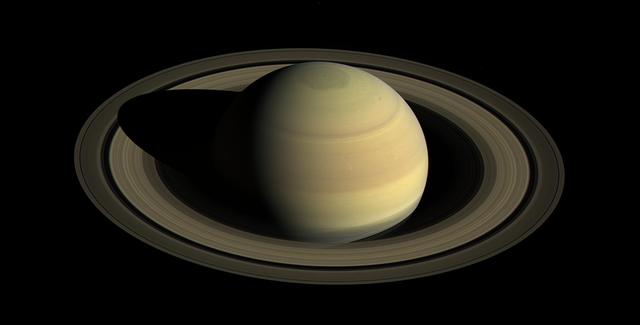
Since NASA's Cassini spacecraft arrived at Saturn in mid-2004, the planet's appearance has changed greatly. The shifting angle of sunlight as the seasons march forward has illuminated the giant hexagon-shaped jet stream around the north polar region, and the subtle bluish hues seen earlier in the mission have continued to fade. Earlier views obtained in 2004 and 2009 (see PIA06077 and PIA11667) demonstrate how drastically the illumination has changed. This view shows Saturn's northern hemisphere in 2016, as that part of the planet nears its northern hemisphere summer solstice in May 2017. Saturn's year is nearly 30 Earth years long, and during its long time there, Cassini has observed winter and spring in the north, and summer and fall in the south. The spacecraft will complete its mission just after northern summer solstice, having observed long-term changes in the planet's winds, temperatures, clouds and chemistry. Cassini scanned across the planet and its rings on April 25, 2016, capturing three sets of red, green and blue images to cover this entire scene showing the planet and the main rings. The images were obtained using Cassini's wide-angle camera at a distance of approximately 1.9 million miles (3 million kilometers) from Saturn and at an elevation of about 30 degrees above the ring plane. The view looks toward the sunlit side of the rings from a sun-Saturn-spacecraft angle, or phase angle, of 55 degrees. Image scale on Saturn is about 111 miles (178 kilometers) per pixel. The exposures used to make this mosaic were obtained just prior to the beginning of a 44-hour movie sequence. http://photojournal.jpl.nasa.gov/catalog/PIA21046
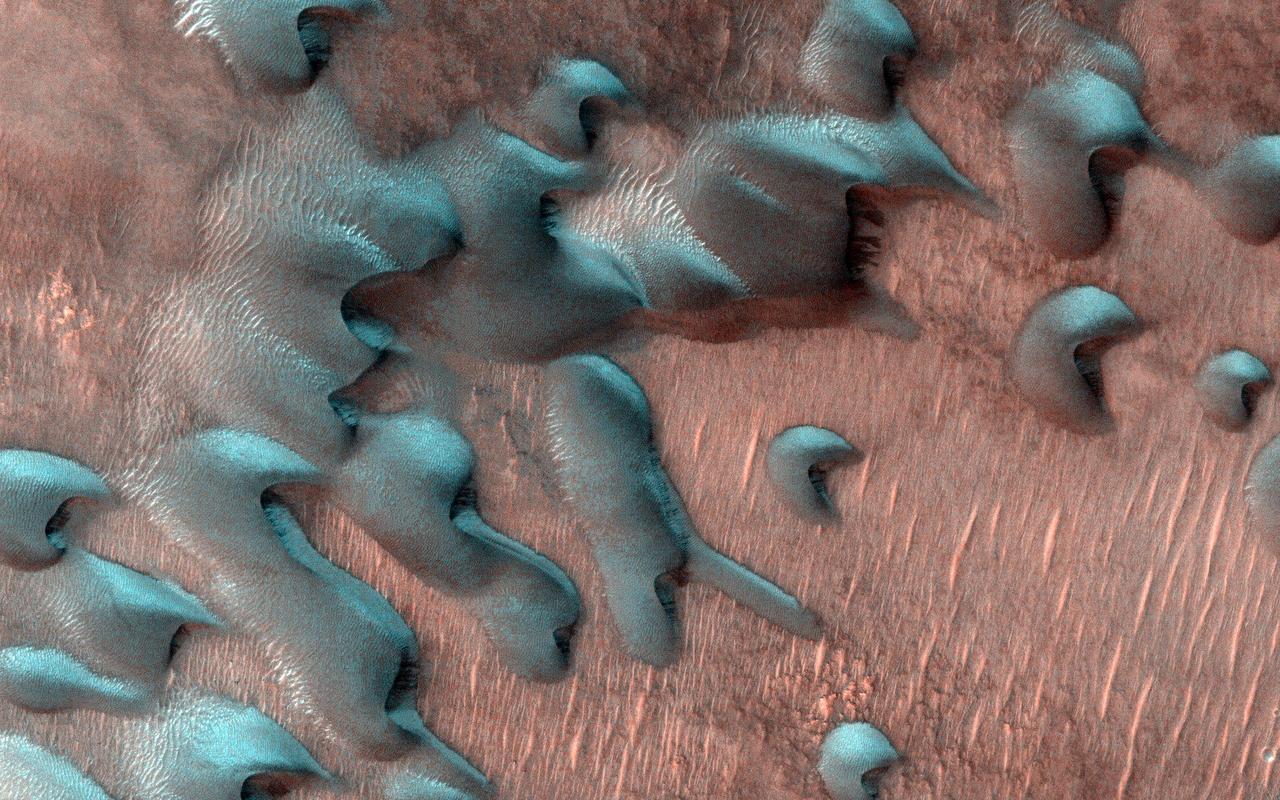
Usually, HiRISE takes pictures of well-illuminated terrain where there is plenty of light to produce clear images. Sometimes though, we would like to know what's going on in the dim wintertime areas. This picture was taken far north of the equator just two days after the winter solstice when the Sun was just a few degrees above the horizon. Sand dunes are moving across this landscape from top left to bottom right. Winter frost covers the colder, north-facing half of each dune (but not the warmer south-facing half). The frost here is a mixture of carbon dioxide ice and water ice and will disappear in a few months when spring arrives. https://photojournal.jpl.nasa.gov/catalog/PIA25552
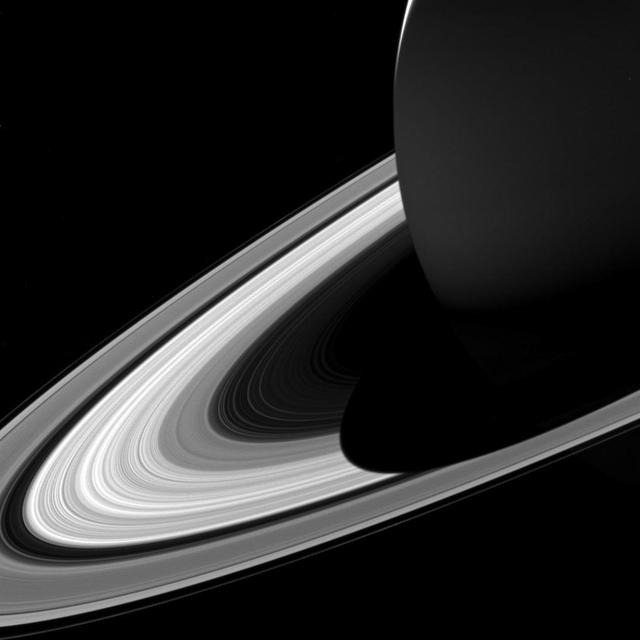
The projection of Saturn's shadow on the rings grows shorter as Saturn's season advances toward northern summer, thanks to the planet's permanent tilt as it orbits the sun. This will continue until Saturn's solstice in May 2017. At that point in time, the shadow will extend only as far as the innermost A ring, leaving the middle and outer A ring completely free of the planet's shadow. Over the course of NASA's Cassini mission, the shadow of Saturn first lengthened steadily until equinox in August 2009. Since then, the shadow has been shrinking. This view looks toward the sunlit side of the rings from about 10 degrees above the ring plane. The image was taken in visible light with the Cassini spacecraft wide-angle camera on Feb. 3, 2017. The view was acquired at a distance of approximately 760,000 miles (1.2 million kilometers) from Saturn. Image scale is 46 miles (73 kilometers) per pixel. https://photojournal.jpl.nasa.gov/catalog/PIA21328
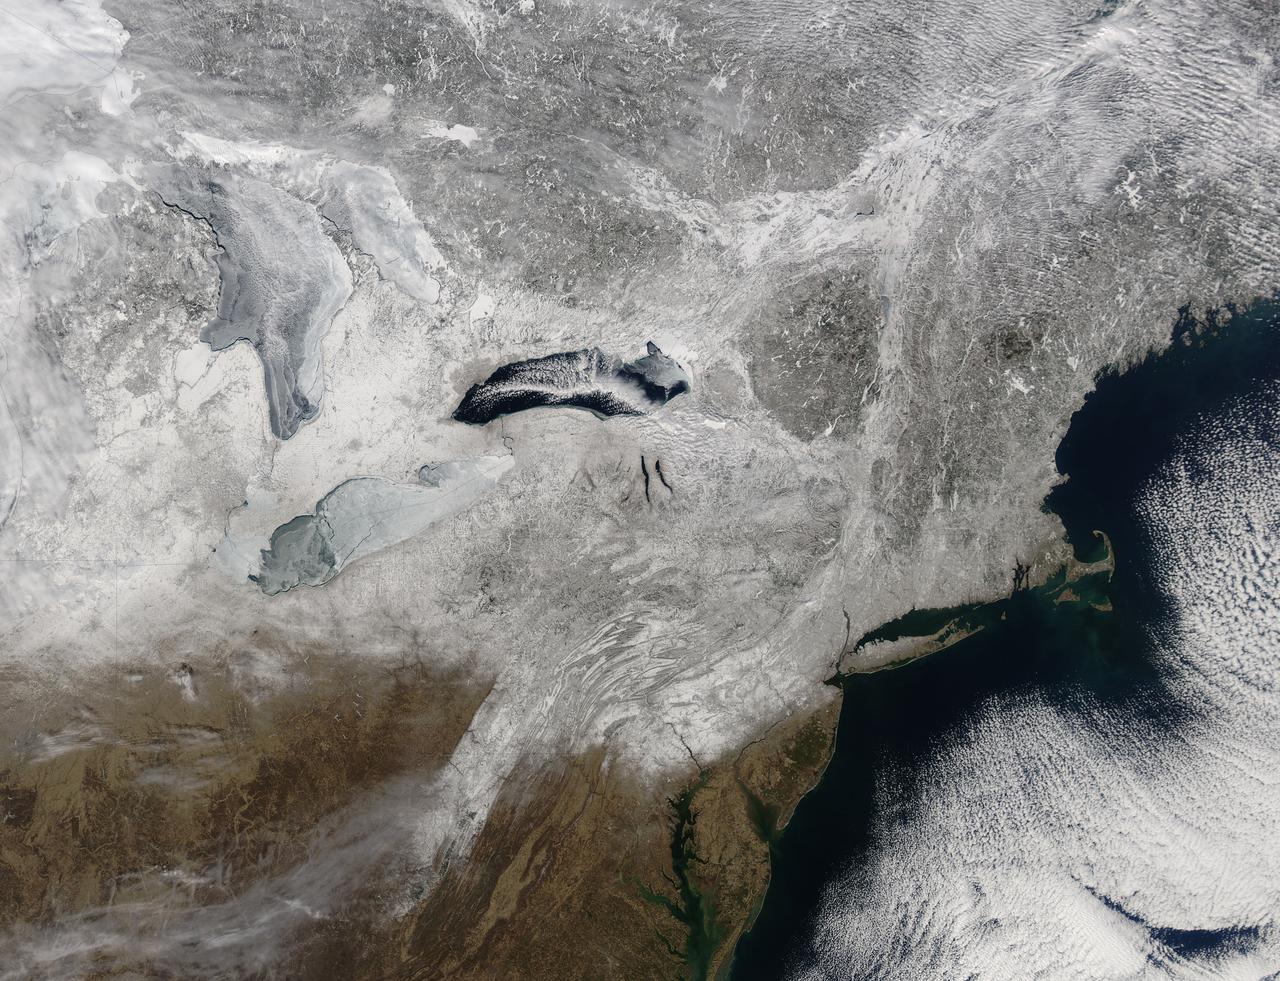
Snow covered the northeastern United States on last day of meteorological winter, 2014. Climatologists and meteorologists break seasons down into three-month groups, based on annual temperature and our calendar. This method is helpful for weather observing and forecasting, and for planning consistent agricultural dates, such as expected first frosts or best planting date. Meteorological winter – the season where temperatures are, on average, coldest and when snow is most likely to fall – runs from December 1 to February 28 in the United States and Canada. Winter can also be defined by the astronomical calendar, which is based on the rotation of the Earth around the sun. In this method, the seasons are defined by two solstices (times when the sun’s path is furthest from the Earth’s equator) and two equinoxes (the times when the sun passes directly above the equator). In the Northern Hemisphere, winter begins on the winter solstice, which falls on or around December 22 and ends on or around March 21, at the vernal (spring) equinox. On February 28, 2014, the Moderate Resolution Imaging Spectroradiometer aboard NASA’s Aqua satellite captured this true-color image of a sunny winter day in the northeastern United States. Snow stretches from Maine west to Indiana and south along the ridges of the Appalachian Mountains well into West Virginia. In Canada, the landscape appears greener, primarily because snow lies on conifers (evergreen) trees in the boreal forest regions. The Great Lakes, with the exception of Lake Ontario, are almost completely covered with ice. Credit: NASA/GSFC/Jeff Schmaltz/MODIS Land Rapid Response Team <b><a href="http://www.nasa.gov/audience/formedia/features/MP_Photo_Guidelines.html" rel="nofollow">NASA image use policy.</a></b> <b><a href="http://www.nasa.gov/centers/goddard/home/index.html" rel="nofollow">NASA Goddard Space Flight Center</a></b> enables NASA’s mission through four scientific endeavors: Earth Science, Heliophysics, Solar System Exploration, and Astrophysics. Goddard plays a leading role in NASA’s accomplishments by contributing compelling scientific knowledge to advance the Agency’s mission. <b>Follow us on <a href="http://twitter.com/NASAGoddardPix" rel="nofollow">Twitter</a></b> <b>Like us on <a href="http://www.facebook.com/pages/Greenbelt-MD/NASA-Goddard/395013845897?ref=tsd" rel="nofollow">Facebook</a></b> <b>Find us on <a href="http://instagram.com/nasagoddard?vm=grid" rel="nofollow">Instagram</a></b>

Reflected sunlight is the source of the illumination for visible wavelength images such as the one above. However, at longer infrared wavelengths, direct thermal emission from objects dominates over reflected sunlight. This enabled instruments that can detect infrared radiation to observe the pole even in the dark days of winter when Cassini first arrived at Saturn and Saturn's northern hemisphere was shrouded in shadow. Now, 13 years later, the north pole basks in full sunlight. Close to the northern summer solstice, sunlight illuminates the previously dark region, permitting Cassini scientists to study this area with the spacecraft's full suite of imagers. This view looks toward the northern hemisphere from about 34 degrees above Saturn's ringplane. The image was taken with the Cassini spacecraft wide-angle camera on April 25, 2017 using a spectral filter which preferentially admits wavelengths of near-infrared light centered at 752 nanometers. The view was acquired at a distance of approximately 274,000 miles (441,000 kilometers) from Saturn and at a Sun-Saturn-spacecraft, or phase, angle of 111 degrees. Image scale is 16 miles (26 kilometers) per pixel. The Cassini spacecraft ended its mission on Sept. 15, 2017. https://photojournal.jpl.nasa.gov/catalog/PIA21351
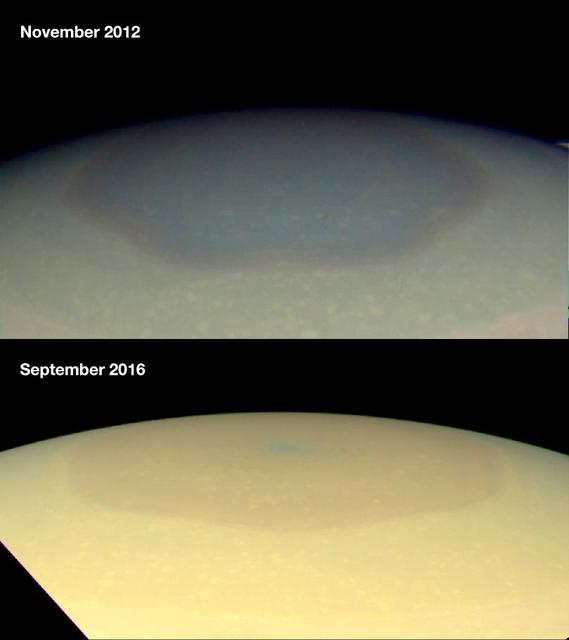
These two natural color images from NASA's Cassini spacecraft show the changing appearance of Saturn's north polar region between 2012 and 2016. Scientists are investigating potential causes for the change in color of the region inside the north-polar hexagon on Saturn. The color change is thought to be an effect of Saturn's seasons. In particular, the change from a bluish color to a more golden hue may be due to the increased production of photochemical hazes in the atmosphere as the north pole approaches summer solstice in May 2017. Researchers think the hexagon, which is a six-sided jetstream, might act as a barrier that prevents haze particles produced outside it from entering. During the polar winter night between November 1995 and August 2009, Saturn's north polar atmosphere became clear of aerosols produced by photochemical reactions -- reactions involving sunlight and the atmosphere. Since the planet experienced equinox in August 2009, the polar atmosphere has been basking in continuous sunshine, and aerosols are being produced inside of the hexagon, around the north pole, making the polar atmosphere appear hazy today. Other effects, including changes in atmospheric circulation, could also be playing a role. Scientists think seasonally shifting patterns of solar heating probably influence the winds in the polar regions. Both images were taken by the Cassini wide-angle camera. http://photojournal.jpl.nasa.gov/catalog/PIA21049

Saturn's shadow stretched beyond the edge of its rings for many years after Cassini first arrived at Saturn, casting an ever-lengthening shadow that reached its maximum extent at the planet's 2009 equinox. This image captured the moment in 2015 when the shrinking shadow just barely reached across the entire main ring system. The shadow will continue to shrink until the planet's northern summer solstice, at which point it will once again start lengthening across the rings, reaching across them in 2019. Like Earth, Saturn is tilted on its axis. And, just as on Earth, as the sun climbs higher in the sky, shadows get shorter. The projection of the planet's shadow onto the rings shrinks and grows over the course of its 29-year-long orbit, as the angle of the sun changes with respect to Saturn's equator. This view looks toward the sunlit side of the rings from about 11 degrees above the ring plane. The image was taken in visible light with the Cassini spacecraft wide-angle camera on Jan. 16, 2015. The view was obtained at a distance of approximately 1.6 million miles (2.5 million kilometers) from Saturn. Image scale is about 90 miles (150 kilometers) per pixel. http://photojournal.jpl.nasa.gov/catalog/PIA20498
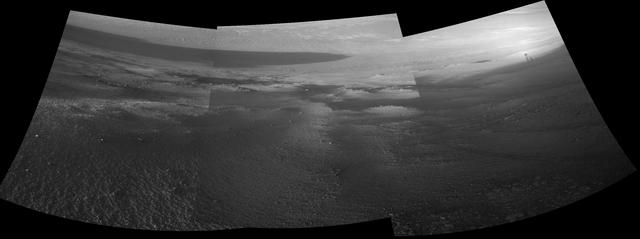
Late-afternoon shadows include one cast by the rover itself in this look toward the floor of Endeavour Crater by NASA's Mars Exploration Rover Opportunity. The rover recorded this scene on Nov. 11, 2017, during the 4,911th Martian day, or sol, of the rover's work on Mars. That was about a week before Opportunity's eighth Martian winter solstice. Opportunity's location is partway down a narrow valley that descends from the crest of the western rim of Endeavour Crater to the crater's floor. This fluid-carved set of troughs, called "Perseverance Valley," is the length of about two football fields, at a slope of about 15 to 17 degrees. The Navigation Camera (Navcam) on Opportunity's mast took the three component images stitched together into this scene. The images were taken about three minutes apart, long enough to see how the shadow was changing on the slope, at the seams between the images. Wheel tracks in the lower right of the scene were made before the rover climbed back uphill for a closer look at some rocks it had passed. The portions of the rover in the shadow at upper right include the mast with the Navcam and Panoramic Camera (Pancam) on top and the UHF radio antenna, which Opportunity uses to transmit images and other data to overflying orbiters for relay to Earth. https://photojournal.jpl.nasa.gov/catalog/PIA22071
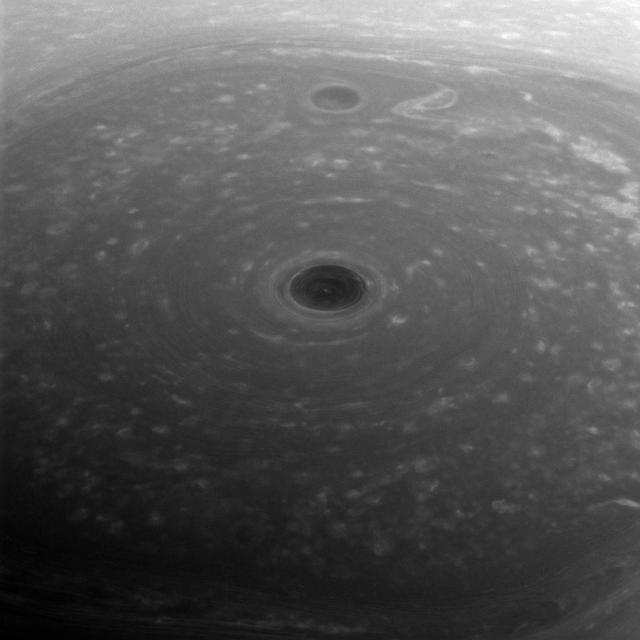
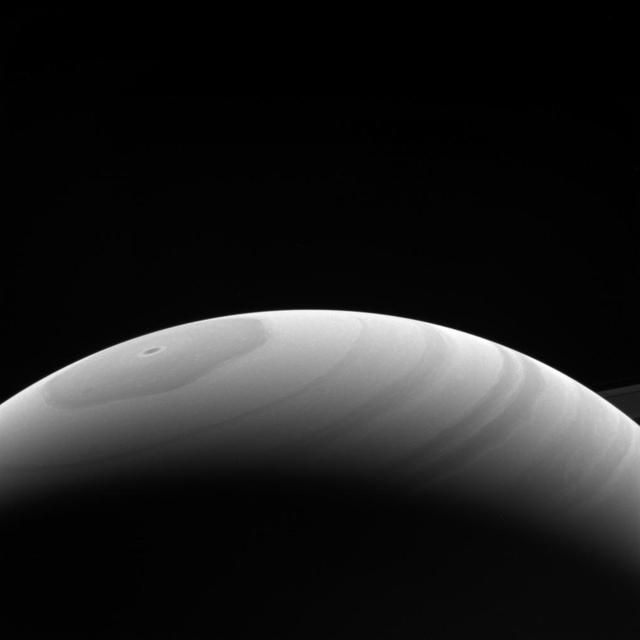
These turbulent clouds are on top of the world at Saturn. NASA's Cassini spacecraft captured this view of Saturn's north pole on April 26, 2017 - the day it began its Grand Finale -- as it approached the planet for its first daring dive through the gap between the planet and its rings. Although the pole is still bathed in sunlight at present, northern summer solstice on Saturn occurred on May 24, 2017, bringing the maximum solar illumination to the north polar region. Now the Sun begins its slow descent in the northern sky, which eventually will plunge the north pole into Earth-years of darkness. Cassini's long mission at Saturn enabled the spacecraft to see the Sun rise over the north, revealing that region in great detail for the first time. This view looks toward the sunlit side of the rings from about 44 degrees above the ring plane. The image was taken with the Cassini spacecraft wide-angle camera using a spectral filter which preferentially admits wavelengths of near-infrared light centered at 752 nanometers. The view was obtained at a distance of approximately 166,000 miles (267,000 kilometers) from Saturn. Image scale is about 10 miles (16 kilometers) per pixel. https://photojournal.jpl.nasa.gov/catalog/PIA21343
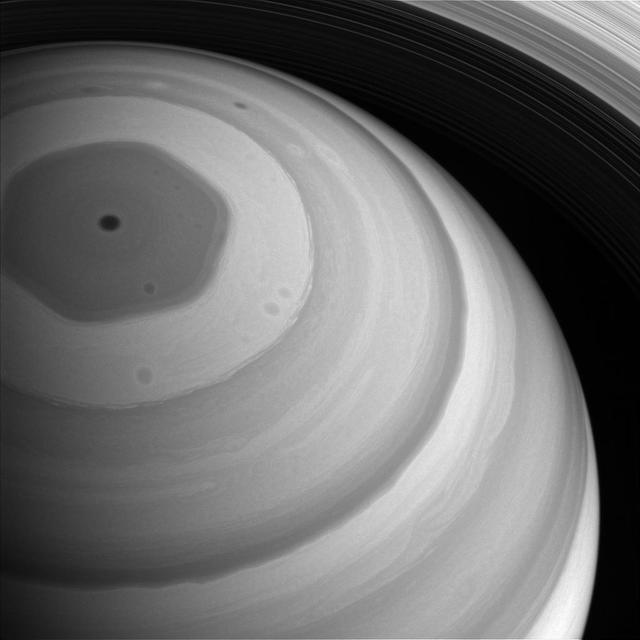
Sunlight truly has come to Saturn's north pole. The whole northern region is bathed in sunlight in this view from late 2016, feeble though the light may be at Saturn's distant domain in the solar system. The hexagon-shaped jet-stream is fully illuminated here. In this image, the planet appears darker in regions where the cloud deck is lower, such the region interior to the hexagon. Mission experts on Saturn's atmosphere are taking advantage of the season and Cassini's favorable viewing geometry to study this and other weather patterns as Saturn's northern hemisphere approaches Summer solstice. This view looks toward the sunlit side of the rings from about 51 degrees above the ring plane. The image was taken with the Cassini spacecraft wide-angle camera on Sept. 9, 2016 using a spectral filter which preferentially admits wavelengths of near-infrared light centered at 728 nanometers. The view was obtained at a distance of approximately 750,000 miles (1.2 million kilometers) from Saturn. Image scale is 46 miles (74 kilometers) per pixel. http://photojournal.jpl.nasa.gov/catalog/PIA20513
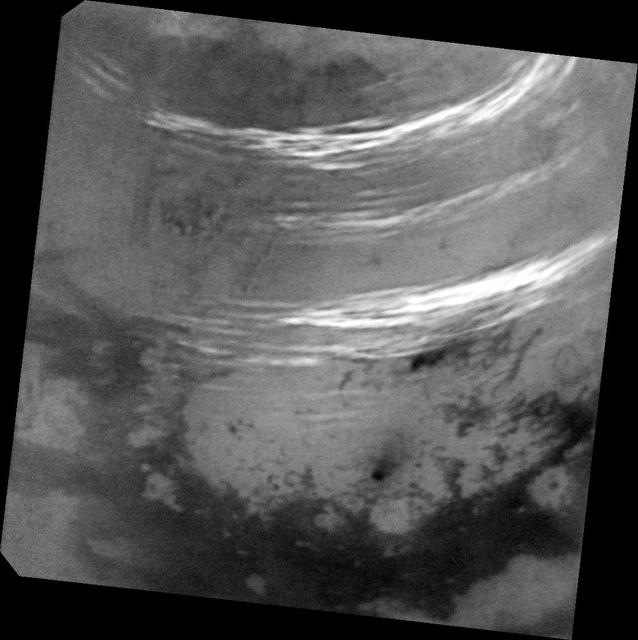
As summer approaches in Titan's northern hemisphere, NASA's Cassini spacecraft has been monitoring Titan, anticipating an increase in cloud activity at high northern latitudes. Intriguingly, with the summer solstice just a couple of weeks away, an outburst of multiple clouds appeared at mid-northern latitudes. These are some of the most intensely bright clouds Cassini has observed on Titan, likely due to high-cloud tops. This activity also represents the most extensive cloud outburst on Titan since clouds reappeared at northern mid-latitudes in early 2016. Three methane cloud bands visible in this view: the southern band is located between 30 and 38 degrees north latitude. Scientists have not spotted many clouds in this latitude range prior this observation. A fainter, middle band between 44 and 50 degrees north latitude is in a region where cloud bands have been observed fairly regularly over the past year. A northern band is also seen between 52 and 59 degrees north latitude. There are a few isolated cloud streaks outside these bands, including some near the southern edge of the north polar terrain near 63 degrees north and another set that goes as far south as 23 degrees north latitude. Just above the dark, equatorial dunelands at bottom is a dark feature with a streak that points toward the northeast (toward upper right). This feature is named Omacatl Macula, and is likely a region of dark dust that is organized into dunes in some places. The image was taken on May 7, 2017, at a distance of 311,000 miles (500,000 kilometers). The view is an orthographic projection centered on 37.5 degrees north latitude, 45 degrees west longitude. An orthographic view is most like the view seen by a distant observer. Image scale is about 2 miles (3 kilometers) per pixel. https://photojournal.jpl.nasa.gov/catalog/PIA21610
NASA's Cassini spacecraft looks down at the rings of Saturn from above the planet's nightside. The darkened globe of Saturn is seen here at lower right, along with the shadow it casts across the rings. The image shows that even on the planet's night side, the rings remain in sunlight, apart from the portion that lies within Saturn's shadow. The rings also reflect sunlight back onto the night side of the planet, making it appear brighter than it would otherwise appear. Saturn's small moon Prometheus (53 miles or 86 kilometers across) is faintly visible as a speck near upper left. The shadow of Saturn was once long enough to stretch to the orbit of Prometheus. But as northern summer solstice approaches, Saturn's shadow no longer reaches that far (see PIA20498). So Prometheus will not move into the darkness of the planet's shadow until the march of the seasons again causes the shadow to lengthen. This view looks toward the sunlit side of the rings from about 41 degrees above the ring plane. The image was taken in visible light with the Cassini spacecraft wide-angle camera on Aug. 14, 2016. The view was obtained at a distance of approximately 870,000 miles (1.4 million kilometers) from Saturn and at a Sun-Saturn-spacecraft, or phase, angle of 87 degrees. Image scale is 53 miles (86 kilometers) per pixel. Prometheus has been brightened by a factor of two to enhance its visibility. http://photojournal.jpl.nasa.gov/catalog/PIA20505
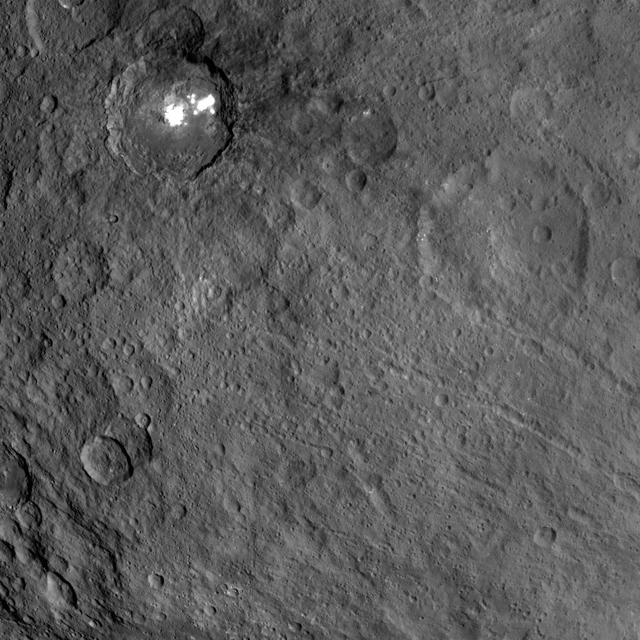
This view obtained by NASA's Dawn spacecraft during its Survey orbit illustrates the diversity and complexity of Ceres' geology. It shows familiar features: Occator Crater with its bright deposits (called faculae) of carbonates and other salts, a series of linear features (at right) called Samhain Catenae, and another large crater on the right side of the image called Kirnis. A relatively fresh crater called Lociyo, superimposed on an older crater, can be seen toward the bottom left of the picture. Studying the morphologies and relationships between various types of geological features can help scientists reconstruct Ceres' history. Occator appears to be one of the youngest features in this picture, except for a couple of smaller craters. The 71-mile-wide (115-kilometer-wide) Kirnis Crater on the other hand is an old, eroded crater. It owes its peculiar polygonal shape in part to its overlap with one of the Samhain Catenae. This illustrates the role of fractures in driving the geometry of some of Ceres' craters. The origin of these particular catenae is not understood yet, and is not necessarily related to the Pongal Catena. Kirnis Crater is named after a Lithuanian spirit-guardian of cherry trees, whereas the Samhain Catenae refer to a Gaelic festival organized at the end of the harvest season. It was observed in Ireland and Scotland during seven days in October and November, nearly halfway between the autumn equinox and the winter solstice. This picture was obtained on June 25, 2015, from an altitude of 2,700 miles (4,400 kilometers). It is centered at 1.7 degrees north latitude, and 249 degrees east longitude. https://photojournal.jpl.nasa.gov/catalog/PIA21409

NASA's Cassini spacecraft watched clouds of methane moving across the far northern regions of Saturn's largest moon, Titan, on Oct. 29 and 30, 2016. Several sets of clouds develop, move over the surface and fade during the course of this movie sequence, which spans 11 hours, with one frame taken every 20 minutes. Most prominent are long cloud streaks that lie between 49 and 55 degrees north latitude. While the general region of cloud activity is persistent over the course of the observation, individual streaks appear to develop then fade. These clouds are measured to move at a speed of about 14 to 22 miles per hour (7 to 10 meters per second). There are also some small clouds over the region of small lakes farther north, including a bright cloud between Neagh Lacus and Punga Mare, which fade over the course of the movie. This small grouping of clouds is moving at a speed of about 0.7 to 1.4 miles per hour (1 to 2 meters per second). Time-lapse movies like this allow scientists to observe the dynamics of clouds as they develop, move over the surface and fade. A time-lapse movie can also help to distinguish between noise in images (for example from cosmic rays hitting the detector) and faint clouds or fog. In 2016, Cassini has intermittently observed clouds across the northern mid-latitudes of Titan, as well as within the north polar region -- an area known to contain numerous methane/ethane lakes and seas see PIA19657 and PIA17655. However, most of this year's observations designed for cloud monitoring have been short snapshots taken days, or weeks, apart. This observation provides Cassini's best opportunity in 2016 to study short-term cloud dynamics. Models of Titan's climate have predicted more cloud activity during early northern summer than what Cassini has observed so far, suggesting that the current understanding of the giant moon's changing seasons is incomplete. The mission will continue monitoring Titan's weather around the 2017 summer solstice in Titan's northern hemisphere. The movie was acquired using the Cassini narrow-angle camera using infrared filters to make the surface and tropospheric methane clouds visible. A movie is available at http://photojournal.jpl.nasa.gov/catalog/PIA21051
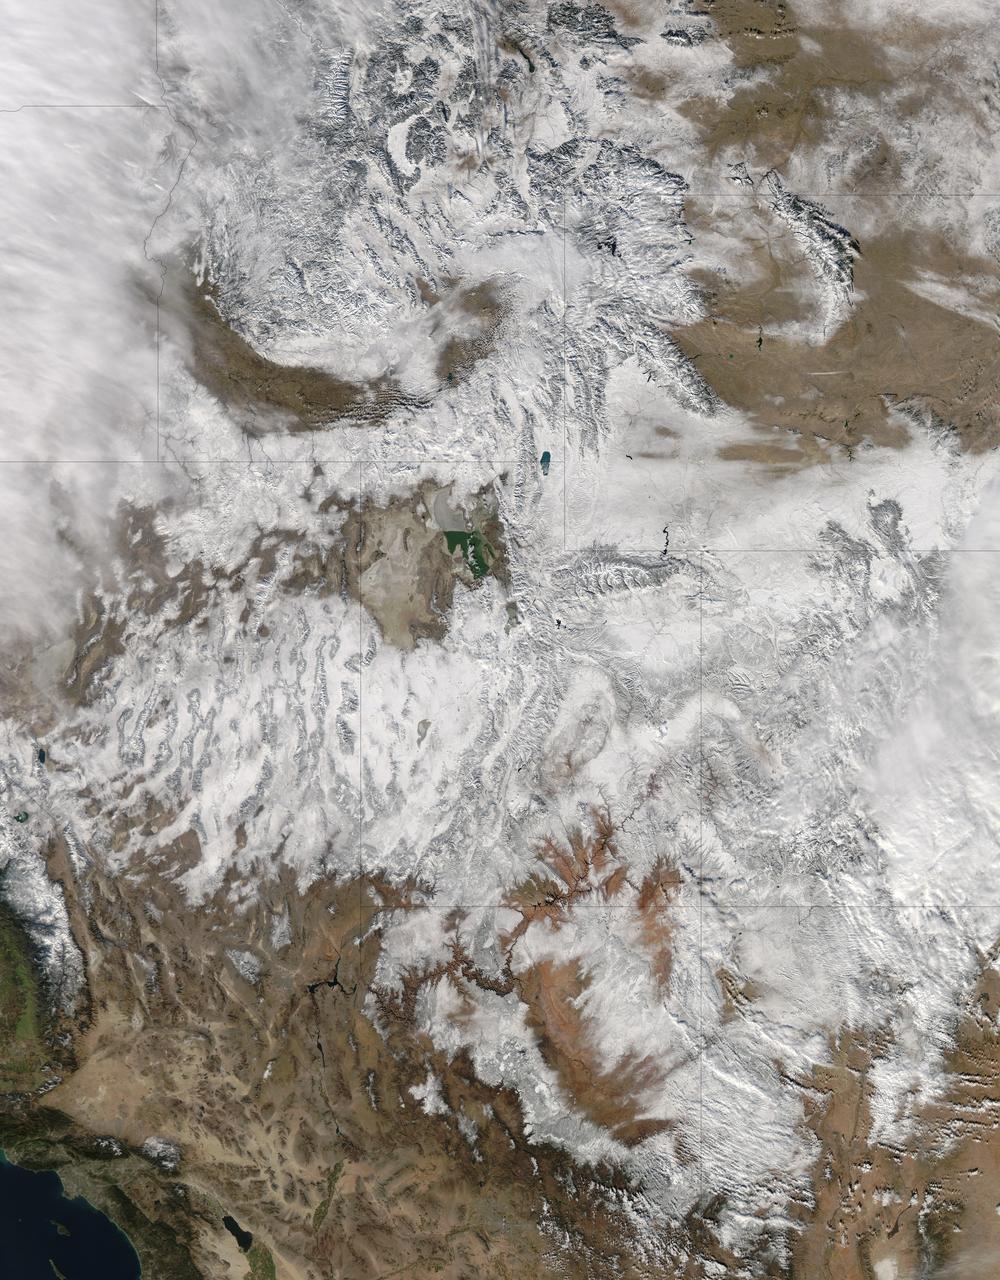
NASA image acquired December 19, 2012 In time for the 2012 winter solstice, a storm dropped snow over most of the Rocky Mountains in the United States. On December 20, the National Weather Service reported snow depths exceeding 100 centimeters (39 inches) in some places—the result of the recent snowfall plus accumulation from earlier storms. The Moderate Resolution Imaging Spectroradiometer (MODIS) on NASA’s Aqua satellite captured this natural-color image on December 19, 2012. Clouds had mostly cleared from the region, though some cloud cover lingered over parts of the Pacific Northwest and Colorado. Showing more distinct contours than the clouds, the snow cover stretched across the Rocky Mountains and the surrounding region, from Idaho to Arizona and from California to Colorado. Snowfall did not stop in Colorado, as the storm continued moving eastward across the Midwest. By December 20, 2012, a combination of heavy snow and strong winds had closed schools, iced roads, and delayed flights, complicating plans for holiday travelers. Though troublesome for travel, the snow brought much-needed moisture; multiple cities had set new records for consecutive days without measurable snow, CBS news reported. As of December 18, the U.S. Drought Monitor stated that a substantial portion of the continental United States continued to suffer from drought, and “exceptional” drought conditions extended from South Dakota to southern Texas. NASA image courtesy Jeff Schmaltz, LANCE MODIS Rapid Response. Caption by Michon Scott. Instrument: Aqua - MODIS To read more go to: <a href="http://earthobservatory.nasa.gov/IOTD/view.php?id=80035" rel="nofollow">earthobservatory.nasa.gov/IOTD/view.php?id=80035</a> Credit: <b><a href="http://www.earthobservatory.nasa.gov/" rel="nofollow"> NASA Earth Observatory</a></b> <b><a href="http://www.nasa.gov/audience/formedia/features/MP_Photo_Guidelines.html" rel="nofollow">NASA image use policy.</a></b> <b><a href="http://www.nasa.gov/centers/goddard/home/index.html" rel="nofollow">NASA Goddard Space Flight Center</a></b> enables NASA’s mission through four scientific endeavors: Earth Science, Heliophysics, Solar System Exploration, and Astrophysics. Goddard plays a leading role in NASA’s accomplishments by contributing compelling scientific knowledge to advance the Agency’s mission. <b>Follow us on <a href="http://twitter.com/NASA_GoddardPix" rel="nofollow">Twitter</a></b> <b>Like us on <a href="http://www.facebook.com/pages/Greenbelt-MD/NASA-Goddard/395013845897?ref=tsd" rel="nofollow">Facebook</a></b> <b>Find us on <a href="http://instagram.com/nasagoddard?vm=grid" rel="nofollow">Instagram</a></b>
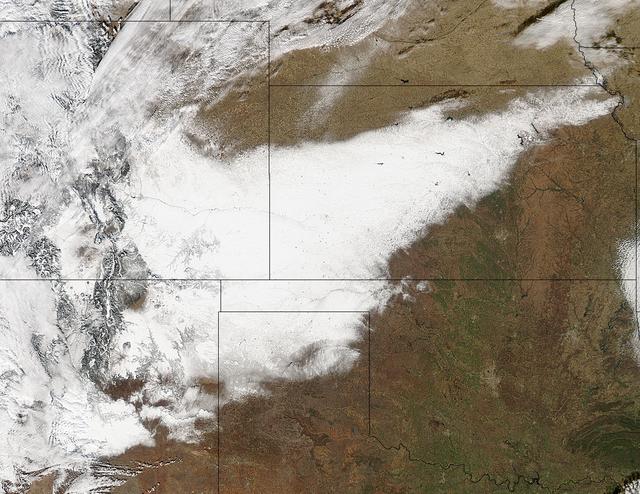
Winter arrived officially on Dec. 22 at 12:35 a.m. EST, but the U.S. Plains states received an early and cool welcome on Dec. 19 from heavy snowfall that was seen by a NASA satellite. NASA's Aqua satellite passed overhead on Dec. 21 at 20:05 UTC (3:05 p.m. EST) and the Moderate Resolution Imaging Spectroradiometer (MODIS) instrument aboard NASA's Aqua satellite captured a visible image of snow blanketing the ground through west and central Kansas, eastern and central Colorado, much of New Mexico, northern Texas and the panhandle of Oklahoma. According to CBS News, blizzard conditions were reported in northern New Mexico, the Texas Panhandle, Oklahoma and northwestern Kansas. The Associated Press reported snow drifts as high as 10 feet in southeast Colorado. Six people lost their lives in traffic accidents from this storm. Heavy snow is expected again today, Dec. 22 in New Mexico and Colorado. Snow is also expected to stretch across the plains into the upper Midwest today, according to the National Weather Service. Portions of many states are expecting some snow today, including the four corners states, north Texas, Kansas, southern Nebraska, western Oklahoma, northern Missouri, Iowa, northern Illinois and southern Wisconsin stretching east into northern New England. The first day of the winter season occurs when the sun is farthest south, either Dec. 21 or 22. The day is also known as the winter solstice. By the second day of winter, NASA's Aqua satellite is going to have a lot more snowfall to observe. Image Credit: NASA Goddard MODIS Rapid Response Team Caption: NASA, Rob Gutro <b><a href="http://www.nasa.gov/audience/formedia/features/MP_Photo_Guidelines.html" rel="nofollow">NASA image use policy.</a></b> <b><a href="http://www.nasa.gov/centers/goddard/home/index.html" rel="nofollow">NASA Goddard Space Flight Center</a></b> enables NASA’s mission through four scientific endeavors: Earth Science, Heliophysics, Solar System Exploration, and Astrophysics. Goddard plays a leading role in NASA’s accomplishments by contributing compelling scientific knowledge to advance the Agency’s mission. <b>Follow us on <a href="http://twitter.com/NASA_GoddardPix" rel="nofollow">Twitter</a></b> <b>Like us on <a href="http://www.facebook.com/pages/Greenbelt-MD/NASA-Goddard/395013845897?ref=tsd" rel="nofollow">Facebook</a></b> <b>Find us on <a href="http://instagrid.me/nasagoddard/?vm=grid" rel="nofollow">Instagram</a></b>