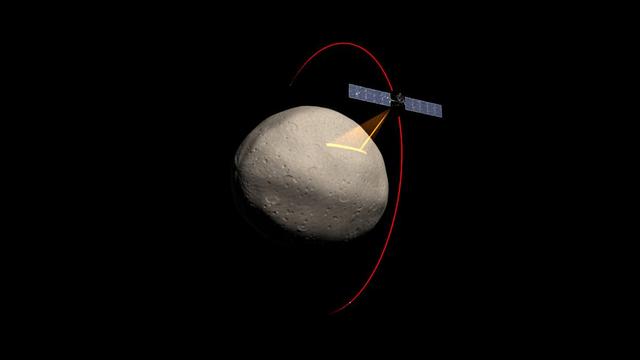
Artist concept of the Dawn spacecraft gathering spectral data from Vesta.

This global view of Venus, centered at 270 degrees east longitude, is a compilation of data from several sources. Magellan synthetic aperature radar mosaics from the first cycle of Magellan mapping are mapped onto a computer-simulated globe to create the image. Data gaps are filled with Pioneer-Venus orbiter data, or a constant mid-range value. Simulated color is used to enhance small-scale structure. The simulated hues are based on color images recorded by the Soviet Venera 13 and 14 spacecraft. The image was produced at the Jet Propulsion Laboratory (JPL) Multimission Image Processing Laboratory and is a single frame from a video released at the JPL news conference, 10-29-91. View provided by JPL with alternate number P-39225 MGN81.
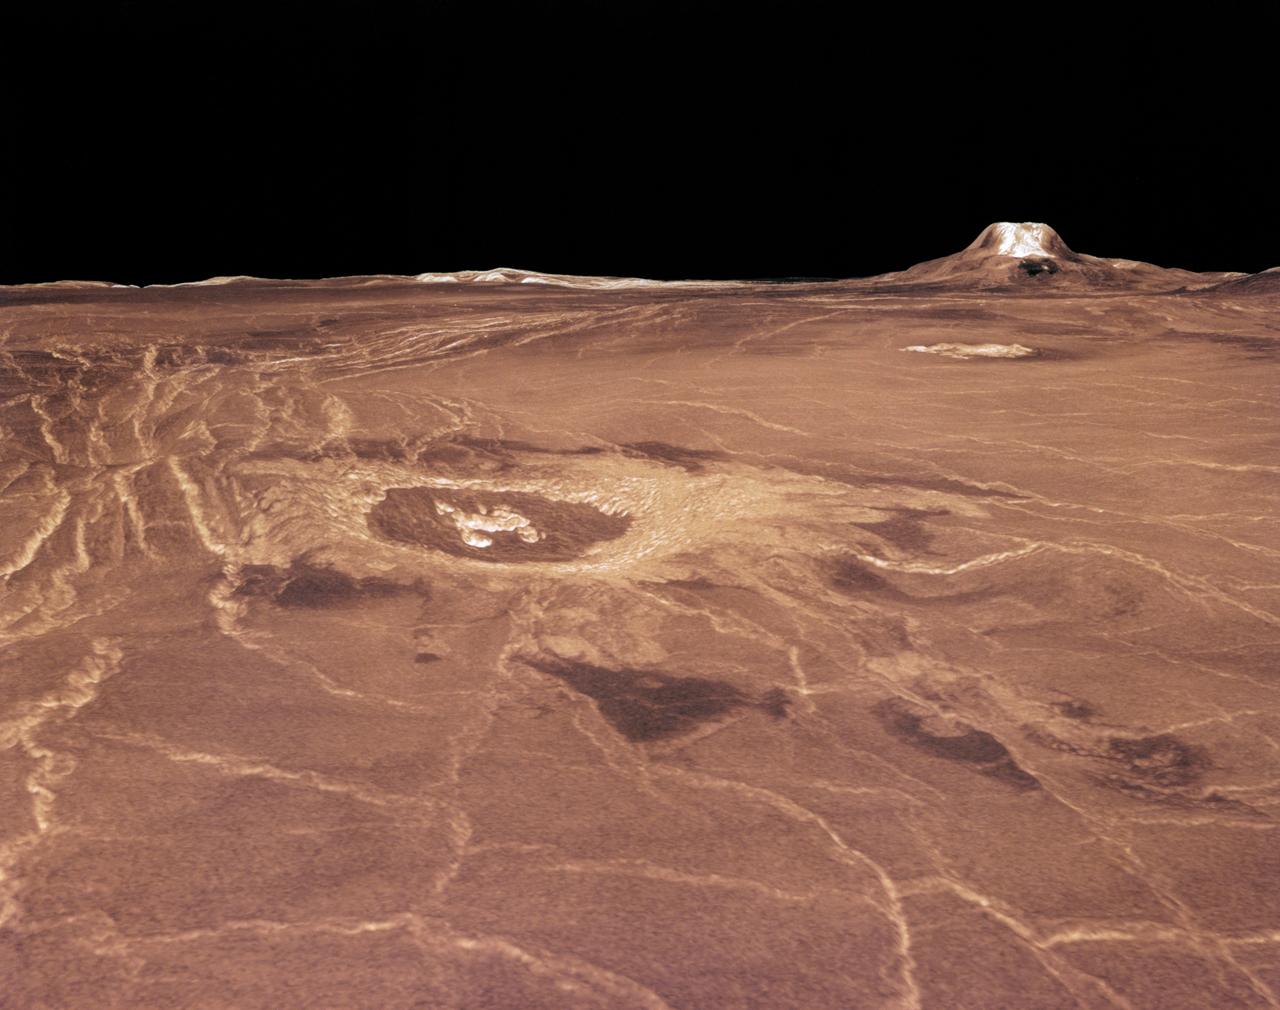
Magellan synthetic aperture radar data was used to create this three- dimensional (3D) perspective view of Venus' western Eistla Regio. This viewpoint is located at 1,310 kilometers (812 miles) southwest of Gula Mons at an elevation of 0.178 kilometers (0.48 miles). The view is of the northeast with Gula Mons appearing on the horizon. Gula Mons, a 3 kilometer (1.86 mile) high volcano, is located at approximately 22 degrees north latitude, 359 degrees east longitude. The impact crater Cunitz, named for the astronomer and mathematician Maria Cunitz, is visible in the center of the image. The crater is 48.5 kilometers (30 miles) in diameter and is 215 kilometers (133 miles) from the viewer's position. Magellan synthetic aperture radar data is combined with radar altimetry to develop a 3D map of the surface. Rays cast in a computer intersect the surface to create a 3D view. Simulated color and a digital elevation map developed by the United States (U.S.) Geological Survey is used to enhance small-scale structure. The simulated hues are based on color images recorded by the Soviet Venera 13 and 14 spacecraft. The image was produced at the Jet Propulsion Laboratory (JPL) Multimission Image Processing Laboratory and is a single frame from a video released at the JPL news conference 03-05-91. View was provided by JPL with alternate number P-38720 MGN76.
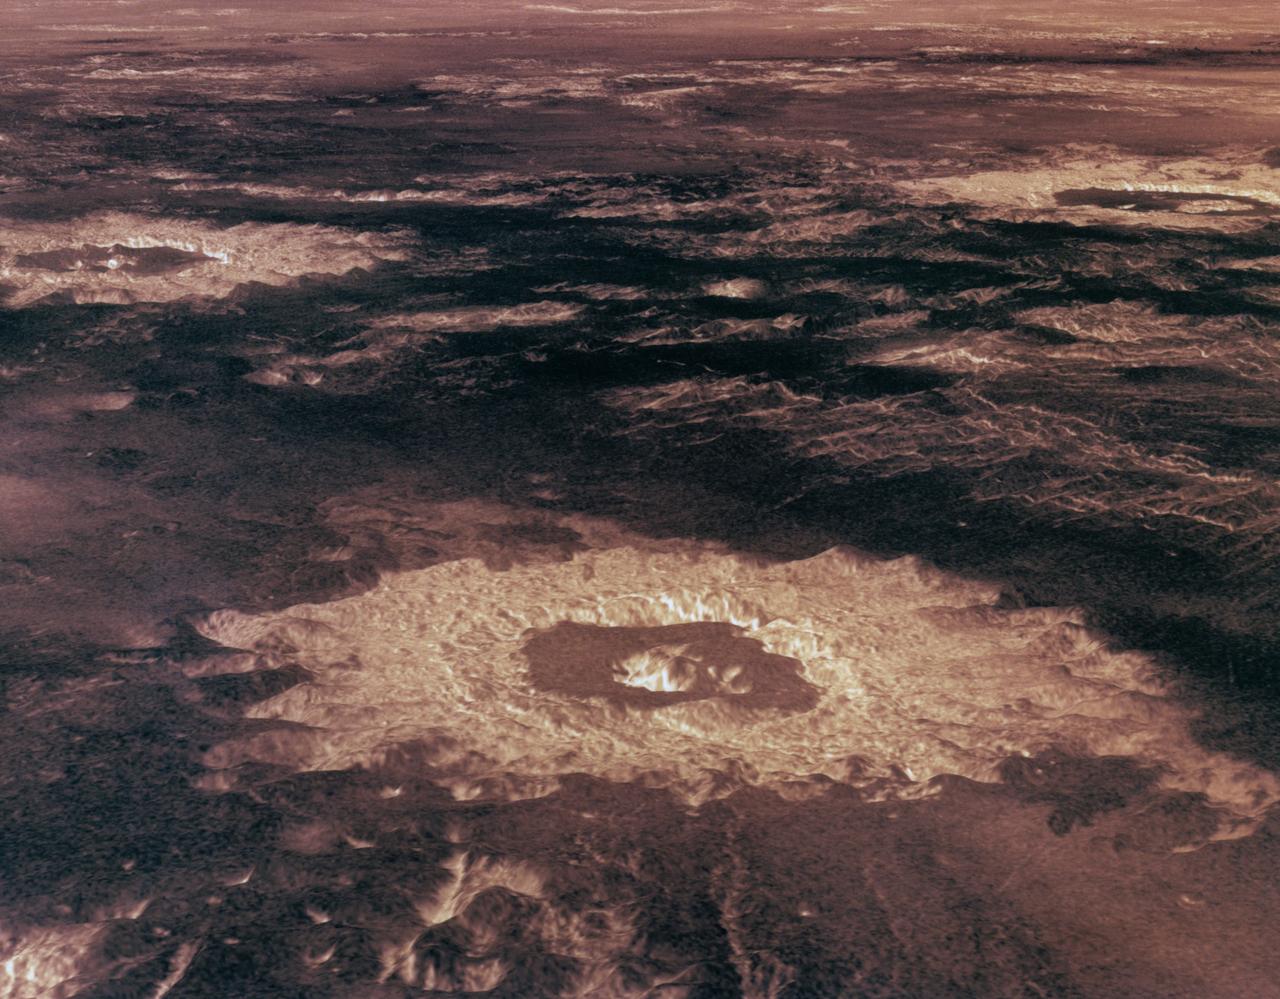
Three impact craters in three-dimensional perspective located approximately 27 degrees south latitude, 339 degrees east longitude in the northwestern portion of Lavinia Planitia. The viewpoint is located southwest of Howe Crater which appears centered in the lower portion of the image. Howe has a diameter of 37.3 kilometers (23.1 miles) located at 28.6 degrees south latitude, 337.1 degrees east longitude. Danilova, a crater with a diameter of 47.6 kilometers (29.5 miles) and located at 26.35 degrees south latitude and 337.5 east longitude, appears above and to the left of Howe in the image. Aglaonice, a crater with a diameter of 62.7 kilometers (38.9 miles) and located at 26.5 degrees south latitude and 340 degrees east longitude is on the right of Danilova. Magellan synthetic aperture radar data is combined with radar altimetry to develop a 3D map of the surface. Rays cast in a computer intersect the surface to create a 3D view. Simulated color and a digital elevation map developed by the United States (U.S.) Geological Survey is used to enhance small-scale structure. The simulated hues are based on color images recorded by the Soviet Venera 13 and 14 spacecraft. The image was processed at the Jet Propulsion Laboratory (JPL) Multimission Image Processing Laboratory and is a single frame from a video released at the JPL news conference 05-29-91. View provided by JPL with alternate number P-39146.
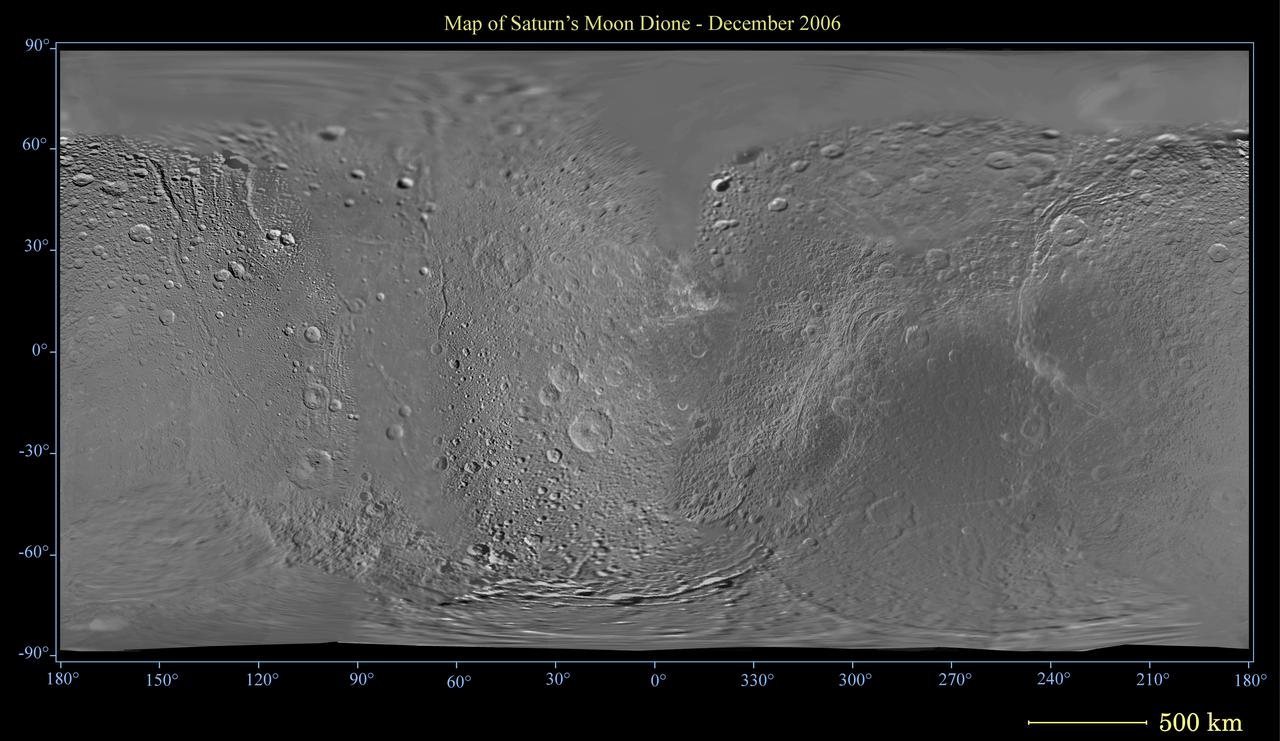
This global digital map of Saturn moon Dione was created using data taken by the Cassini spacecraft, with gaps in coverage filled in by NASA Voyager spacecraft data
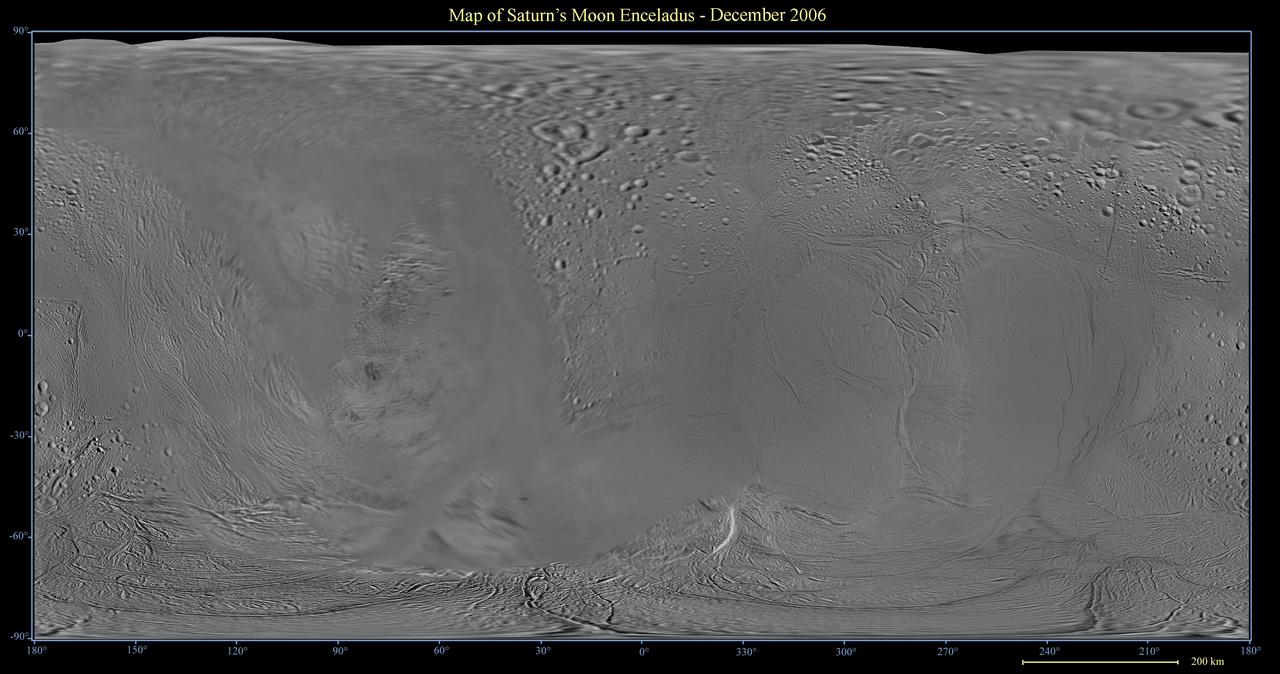
This global digital map of Saturn moon Enceladus was created using data taken by the Cassini spacecraft, with gaps in coverage filled in by NASA Voyager spacecraft data
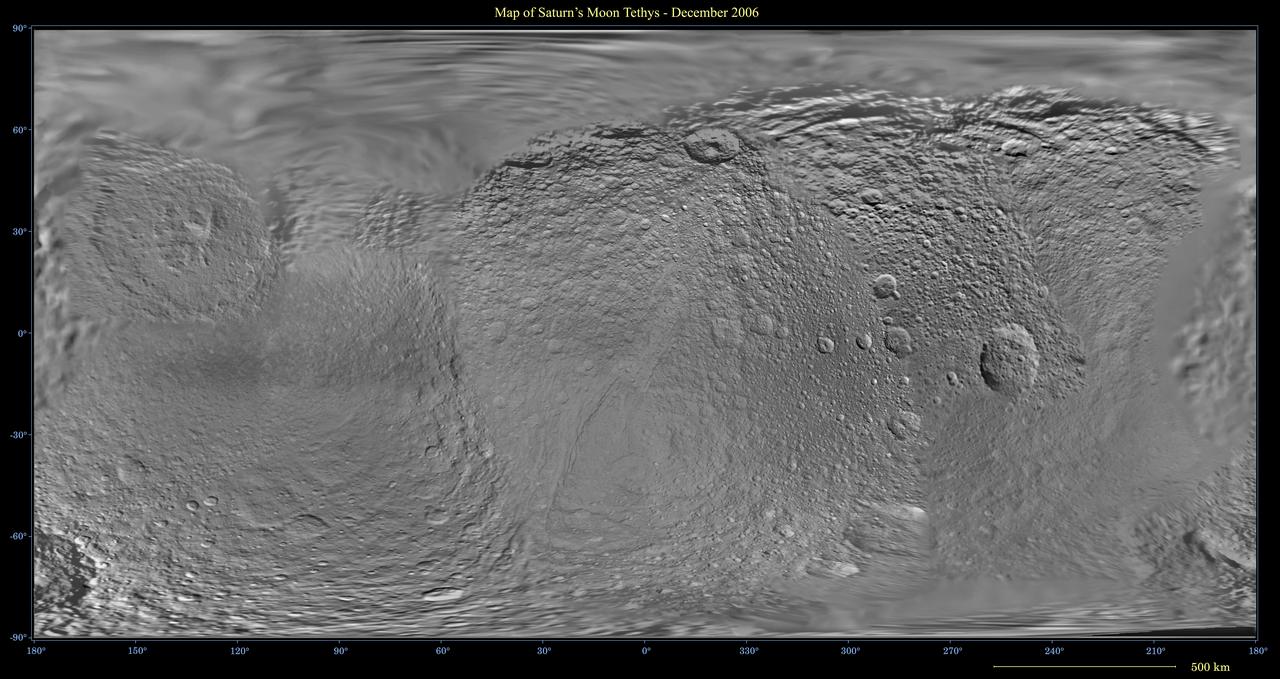
This global digital map of Saturn moon Tethys was created using data taken by the Cassini spacecraft, with gaps in coverage filled in by NASA Voyager spacecraft data
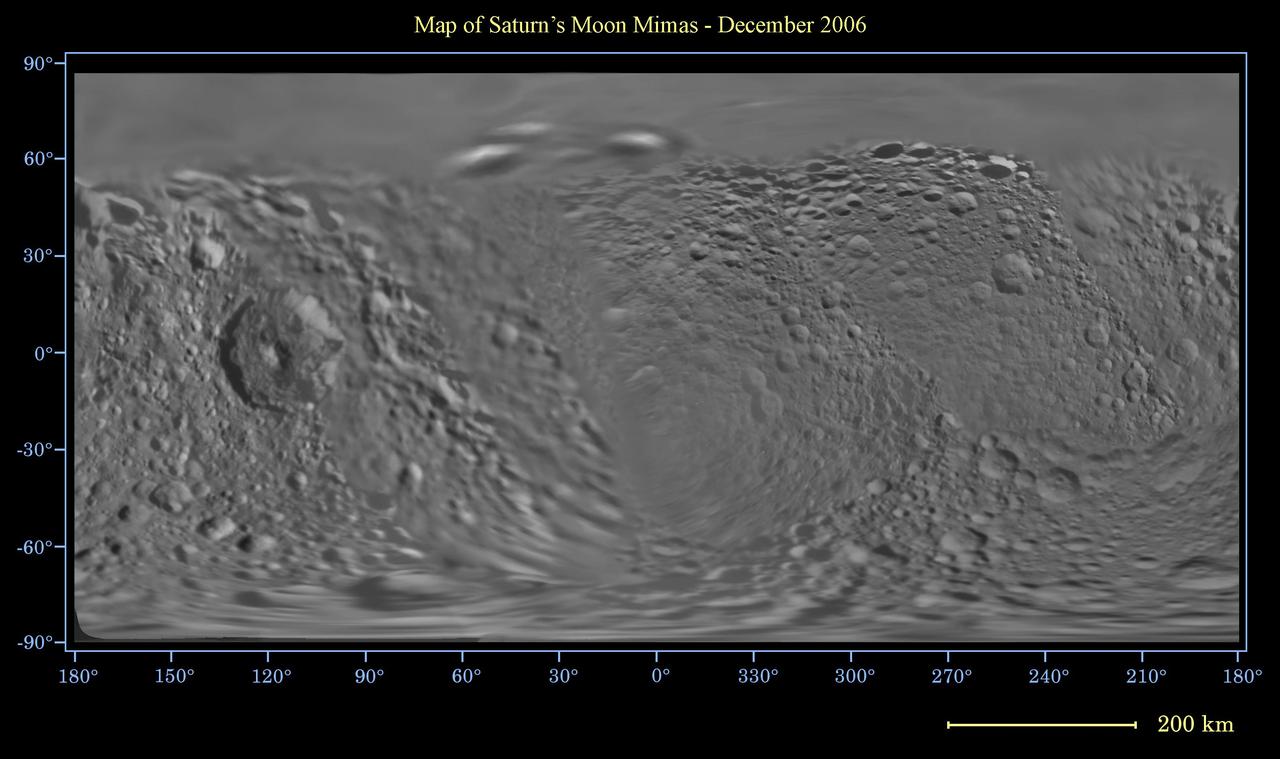
This global digital map of Saturn moon Mimas was created using data taken by the Cassini spacecraft, with gaps in coverage filled in by NASA Voyager spacecraft data
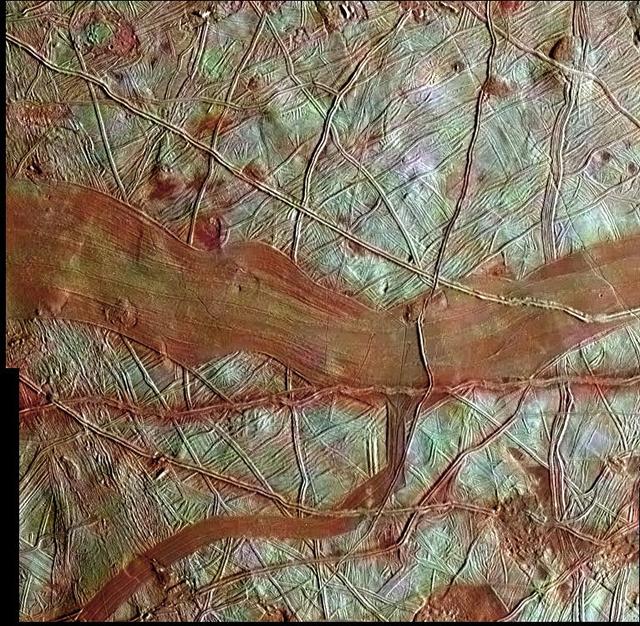
This colorized image of Europa is a product of clear-filter grayscale data from one orbit of NASA Galileo spacecraft, combined with lower-resolution color data taken on a different orbit.
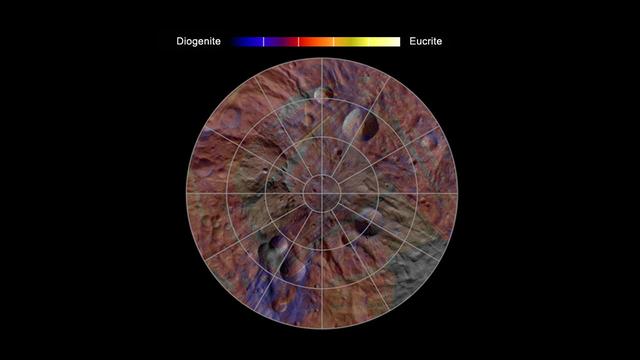
This image, made from data obtained by NASA Dawn spacecraft, shows the mineral distribution in the southern hemisphere of the giant asteroid Vesta.
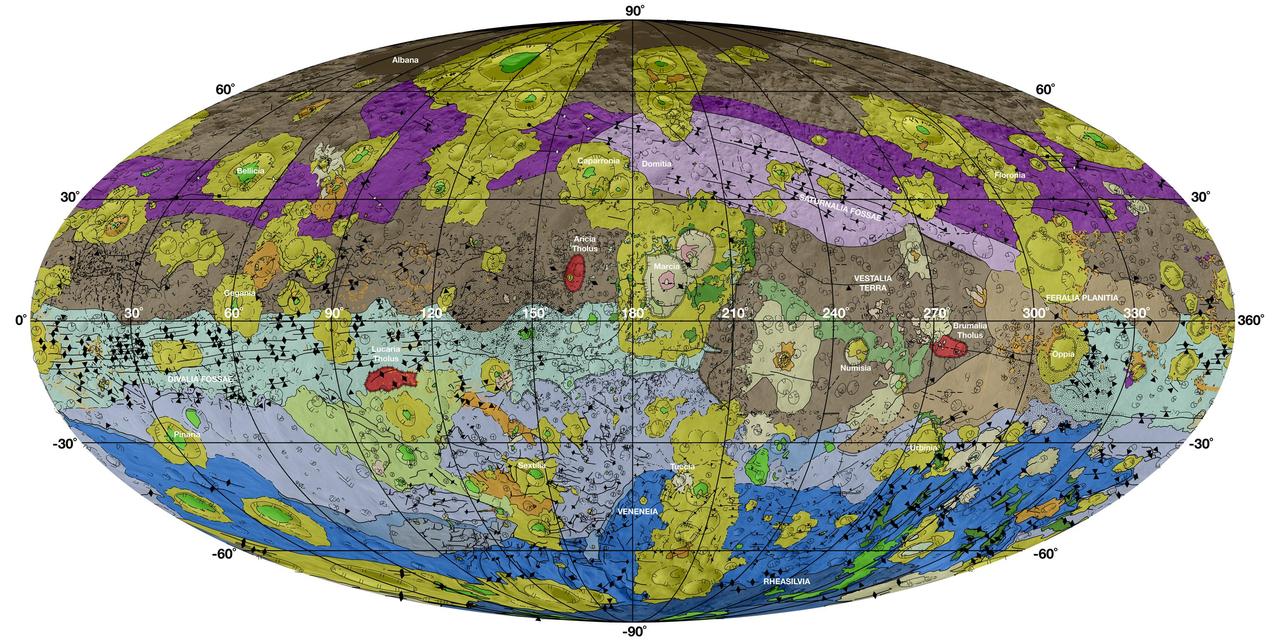
This high-resolution geological map of Vesta is derived from NASA Dawn spacecraft data.
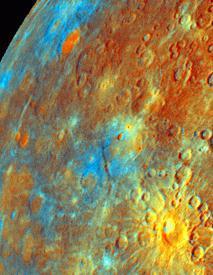
Updated calibration and subsequent mosaicing led to substantial improvements in NASA Mariner 10 color image data; the spacecraft launched in 1974.

This false-color composite image, constructed from data obtained by NASA Cassini spacecraft, shows Saturn rings and southern hemisphere.
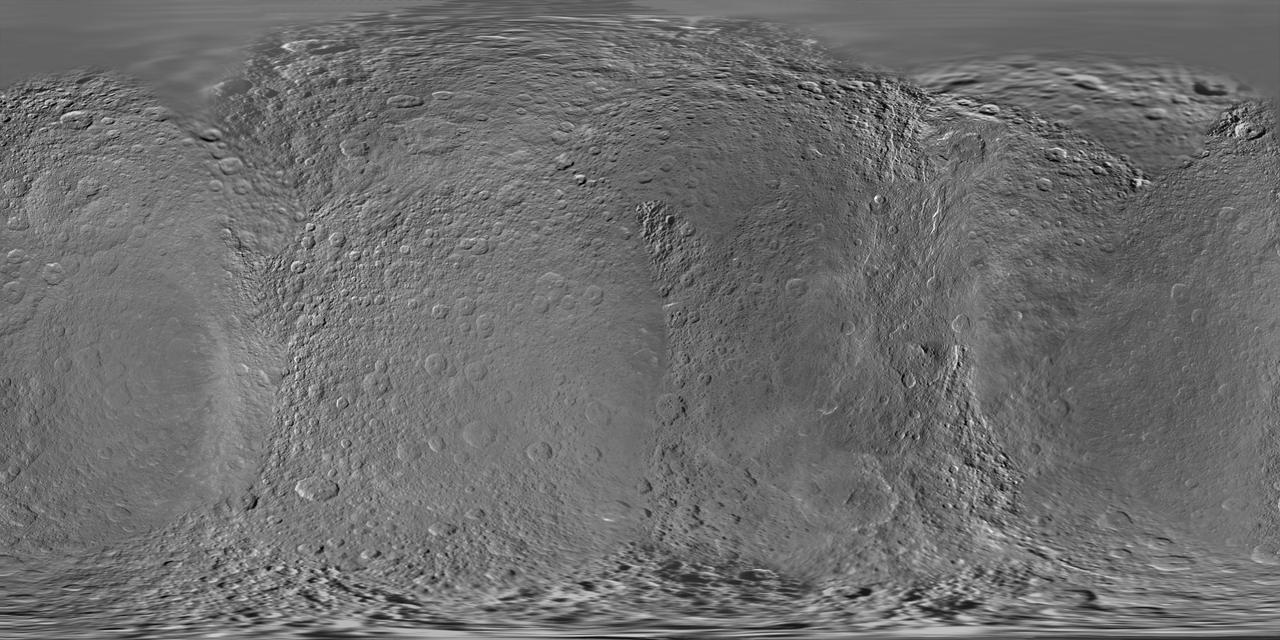
This global digital map of Saturn moon Rhea was created using data obtained by NASA Cassini and Voyager spacecraft.
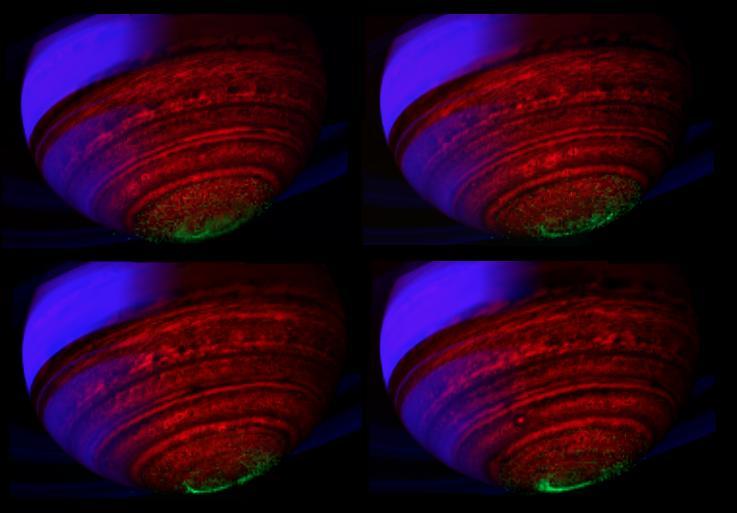
A quartet of false-color, composite images show the dance of Saturn southern lights in data obtained by NASA Cassini spacecraft.
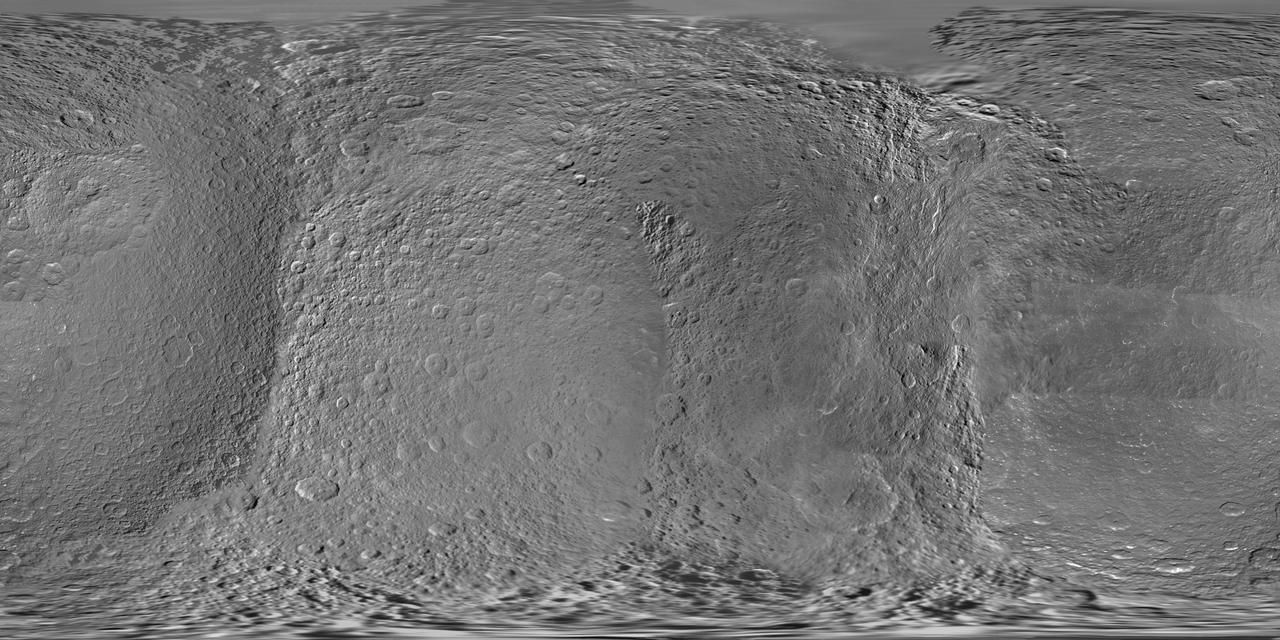
This global digital map of Rhea was created using data taken during NASA Cassini and Voyager spacecraft flybys.
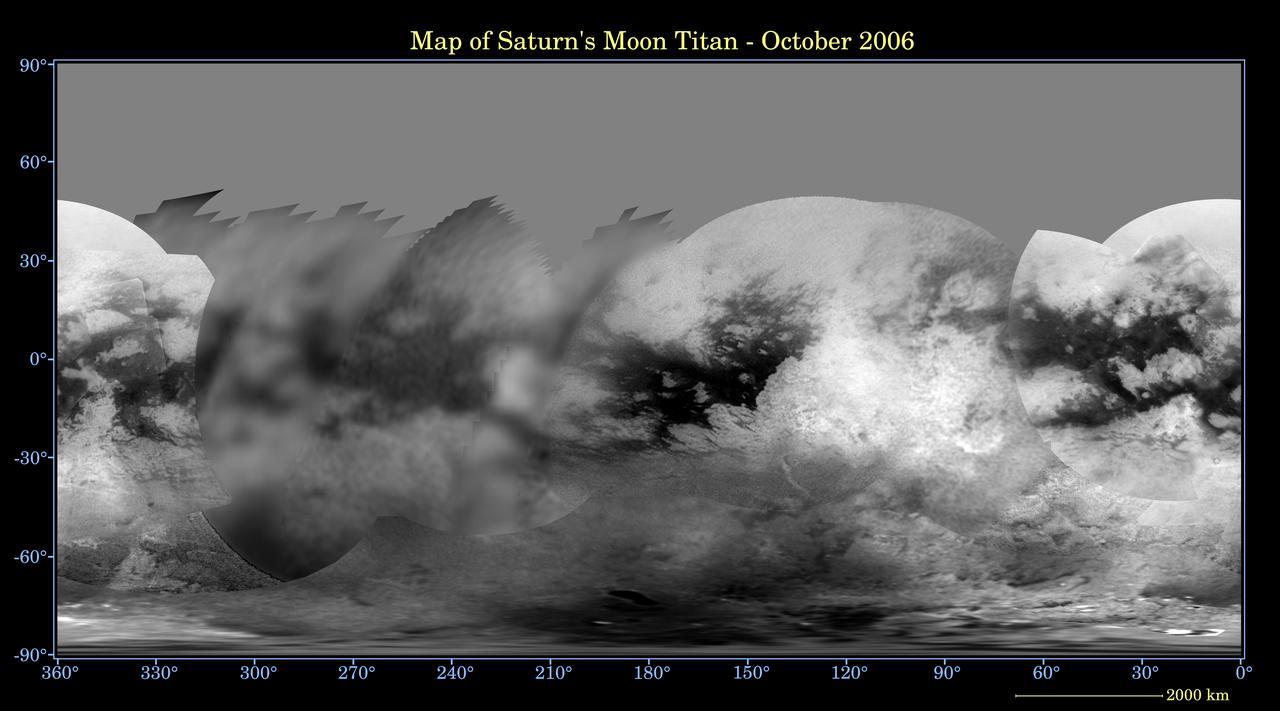
This global digital map of Titan was created using data taken by the Cassini spacecraft Imaging Science Subsystem ISS
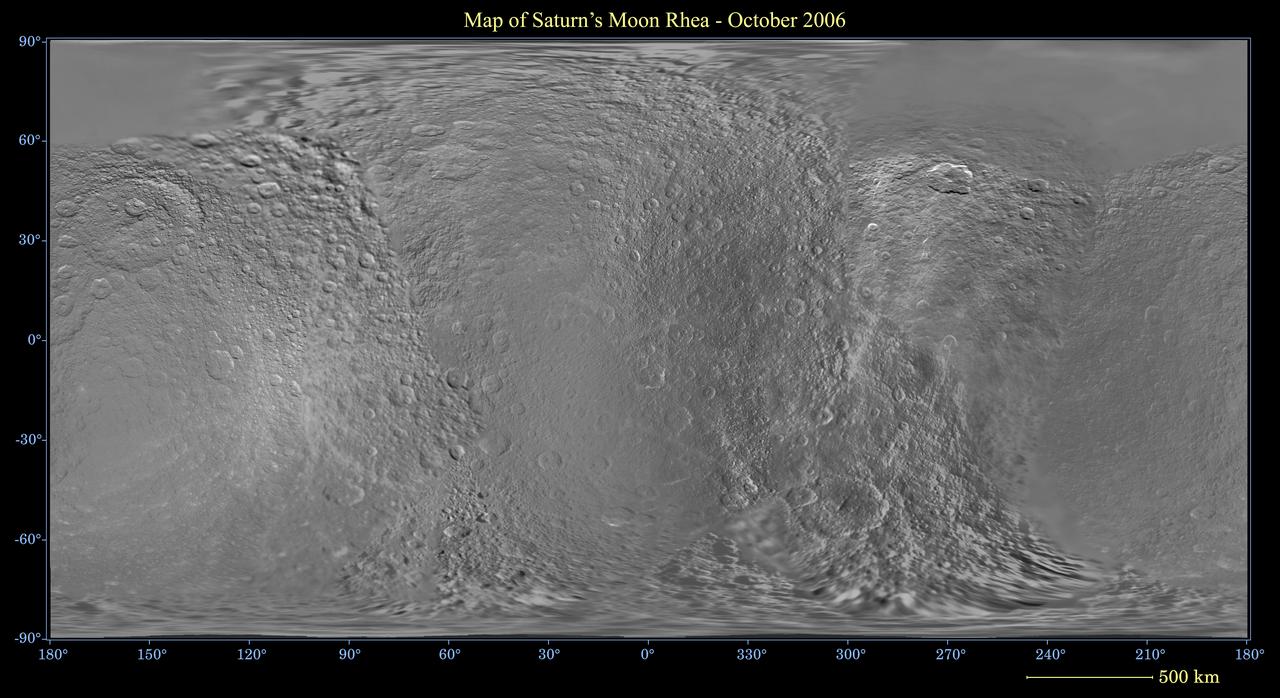
This global digital map of Saturn moon Rhea was created using data taken during NASA Cassini and Voyager spacecraft flybys

Data from NASA Terra spacecraft were combined to create this cloud-free natural-color mosaic of Scandinavia and the Baltic region.
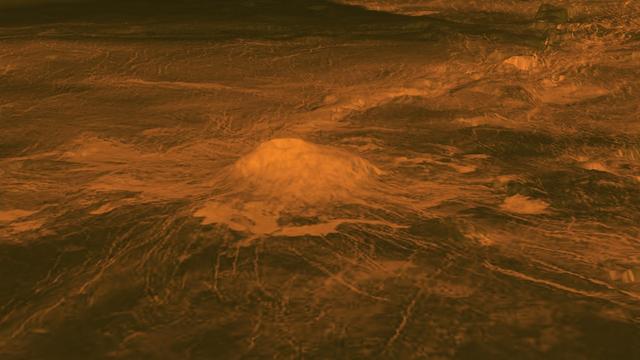
This figure shows the volcanic peak Idunn Mons in the Imdr Regio area of Venus. The topographic backbone brown color was derived from data obtained by NASA Magellan spacecraft and the overlay was derived from data from ESA Venus Express Spacecraft.
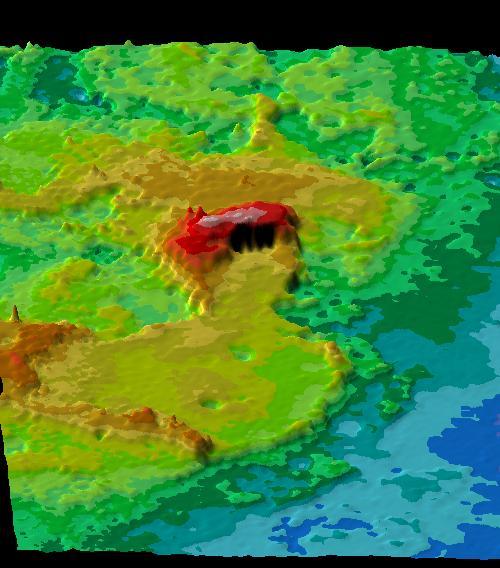
This perspective view of Ishtar Terra was derived from data obtained by NASA's Pioneer Venus spacecraft altimetry radar instrument. http://photojournal.jpl.nasa.gov/catalog/PIA00093
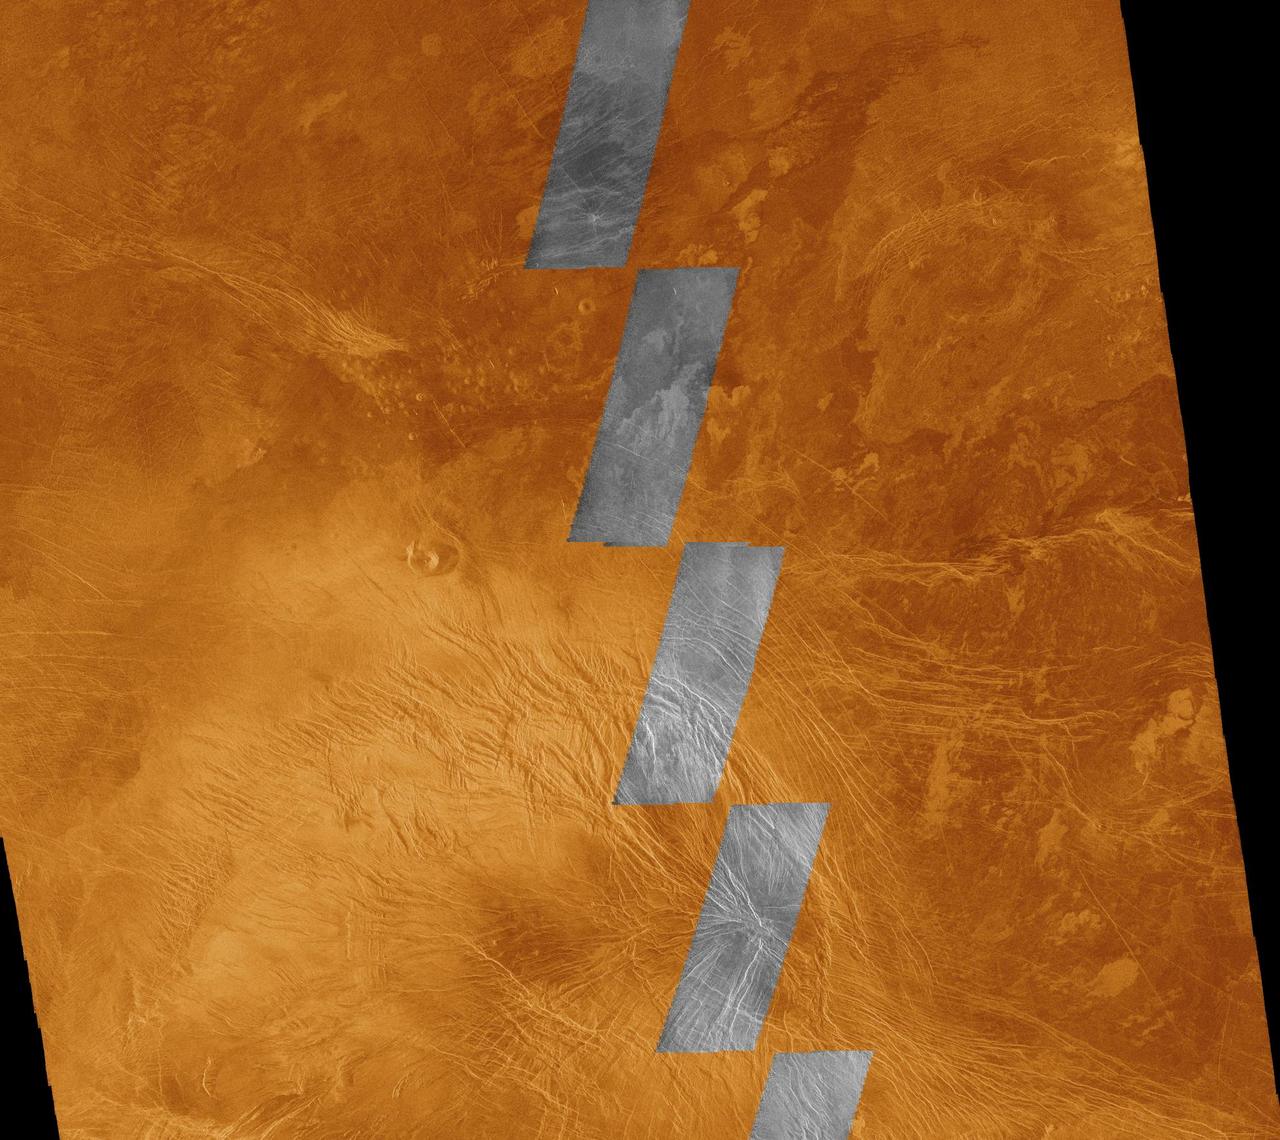
This image compares NASA Magellan data acquired in August 1990 during the initial test of the radar system black and white insets with data acquired by the spacecraft in April 1991 color background. The area is in the southern hemisphere of Venus. http://photojournal.jpl.nasa.gov/catalog/PIA00220

This global view of Europa shows the location of a four-frame mosaic of images taken by NASA Galileo spacecraft in 1996, set into low-resolution data obtained by NASA Voyager spacecraft in 1979.
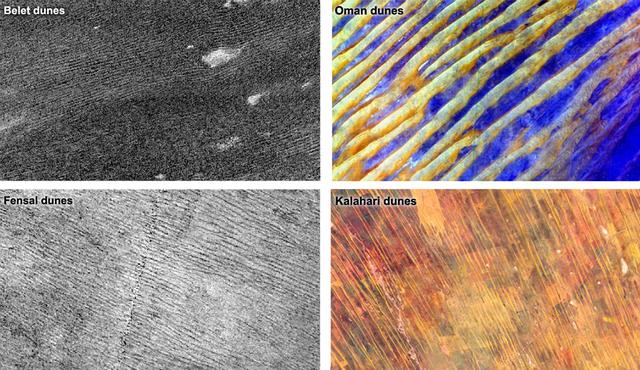
Data from NASA Cassini spacecraft show that the sizes and patterns of dunes on Saturn moon Titan vary as a function of altitude and latitude left. Images of Earth dunes Oman and Kalahari are shown at right as seen by NASA Terra spacecraft.
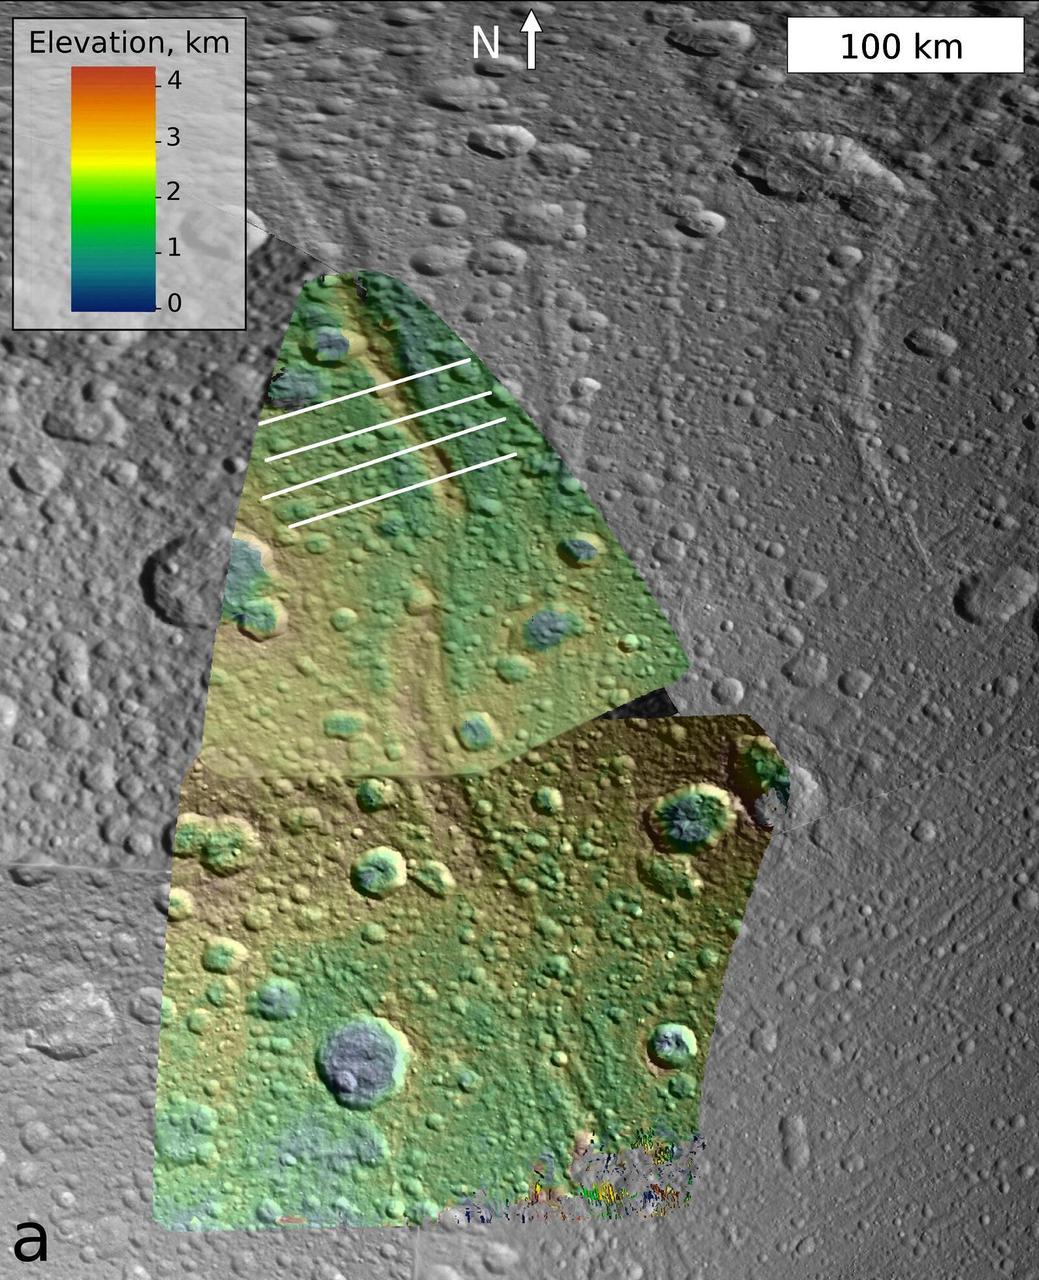
This image, which is composed of data obtained by NASA Cassini spacecraft, shows the topography of a mountain known as Janiculum Dorsa on the Saturnian moon Dione.
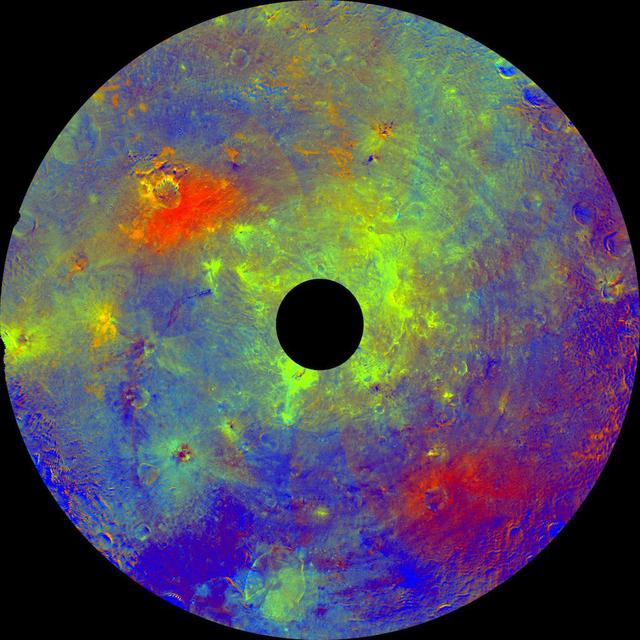
This image using color data obtained by the framing camera aboard NASA Dawn spacecraft shows asteroid Vesta southern hemisphere in color, centered on the Rheasilvia formation.
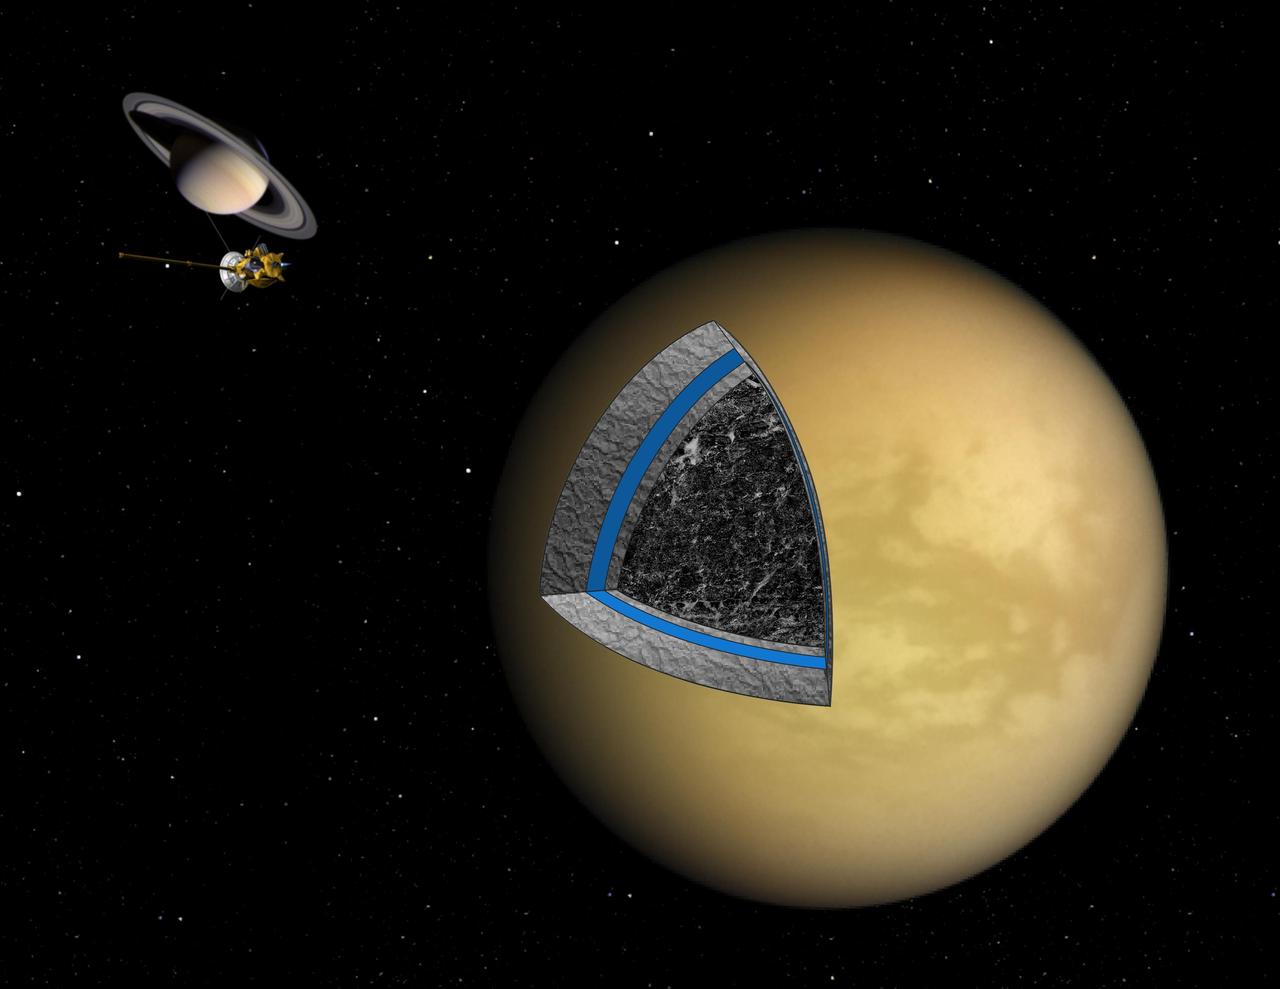
This artist illustration shows the likely interior structure of Saturn moon Titan deduced from gravity field data collected by NASA Cassini spacecraft.
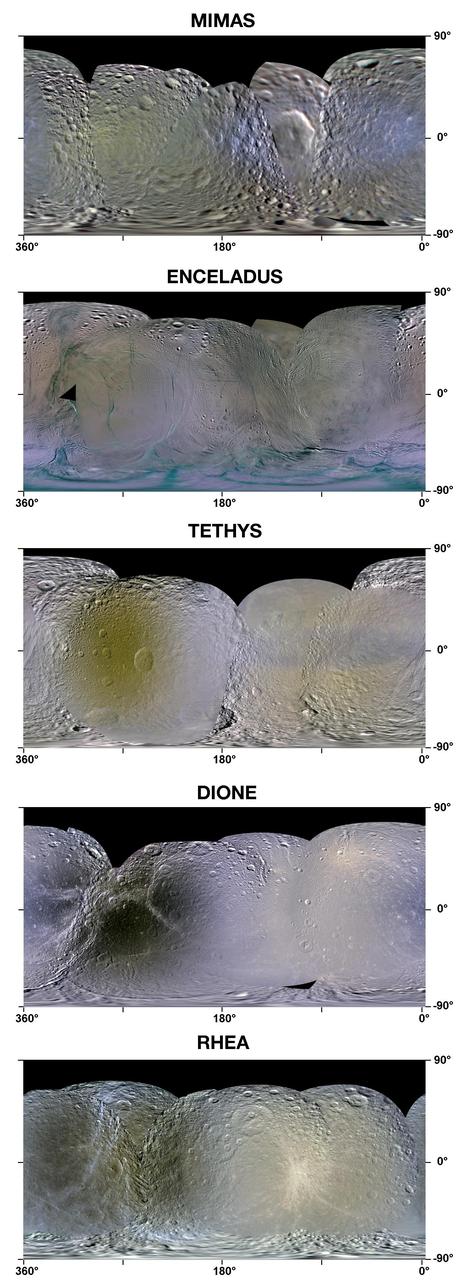
This set of enhanced-color maps made from data obtained by NASA Cassini spacecraft show Saturn moons Mimas, Enceladus, Tethys, Dione and Rhea.

This false-color image, made from infrared data obtained by NASA Cassini spacecraft, shows dark and bright clouds on Saturn associated with thunderstorm activity.
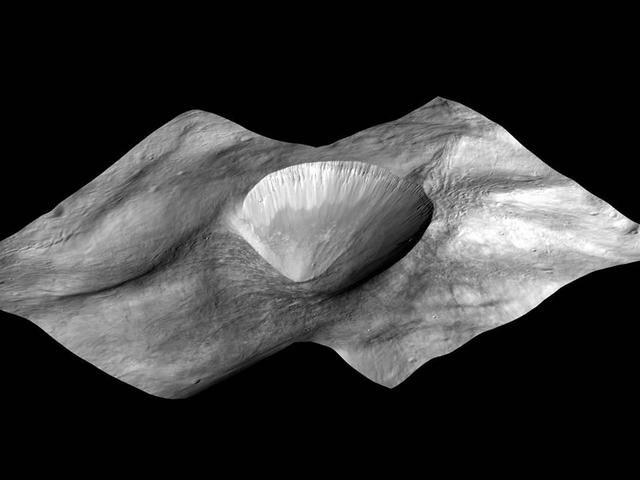
This image, made from data obtained by NASA Dawn spacecraft, shows a perspective view of a layered young crater in the Rheasilvia basin at asteroid Vesta.
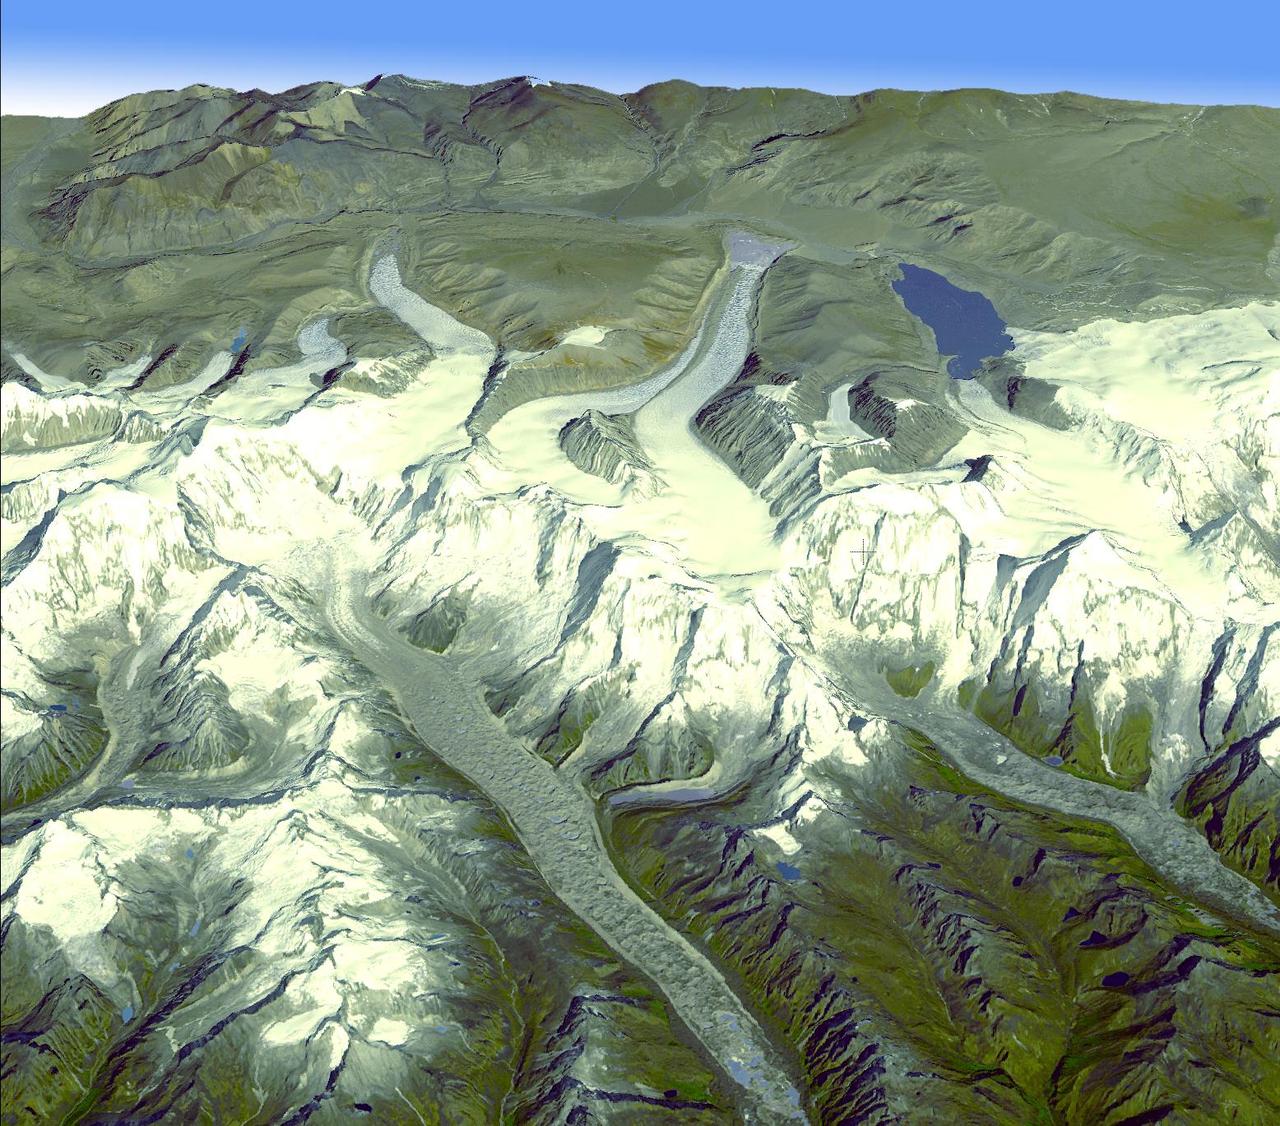
Onboard NASA Terra spacecraft, the Advanced Spaceborne Thermal Emission and Reflection Radiometer data have revealed significant spatial variability in glacier flow in the Bhutan Himalayas.
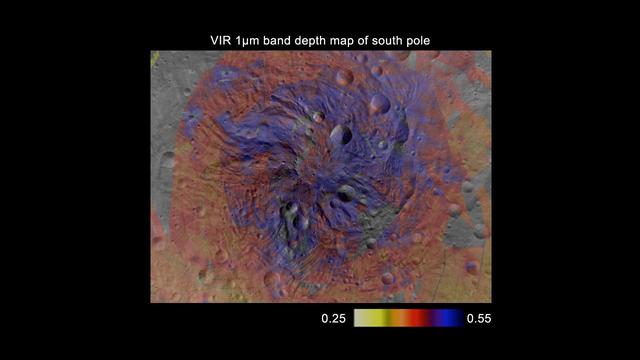
This map, made from data obtained by NASA Dawn spacecraft, shows the distribution of pyroxene, an iron- and magnesium-rich mineral, in the southern hemisphere of the giant asteroid Vesta.

Volcanic hot spots are seen in this color temperature map of the Prometheus volcano on Jupiter moon Io created with data obtained by NASA Galileo and Voyager spacecraft.
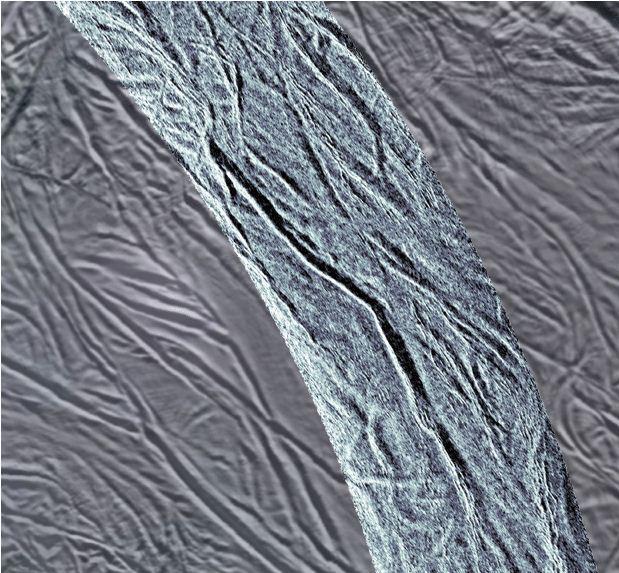
This image using synthetic-aperture radar SAR data acquired by NASA Cassini spacecraft shows grooves in the southern part of Saturn moon Enceladus.
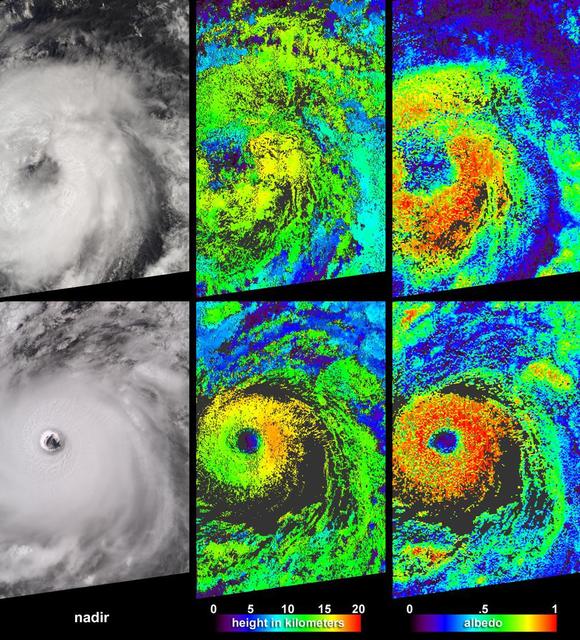
Cloud-top radiance and height characteristics of Hurricane Isabel are depicted in these data products and animations from NASA Terra spacecraft on September 7, 2003.

NASA Voyager 2 spacecraft flew by Triton, a moon of Neptune, on August 25, 1989. This frame from a video using Voyager data recreates that exciting encounter.
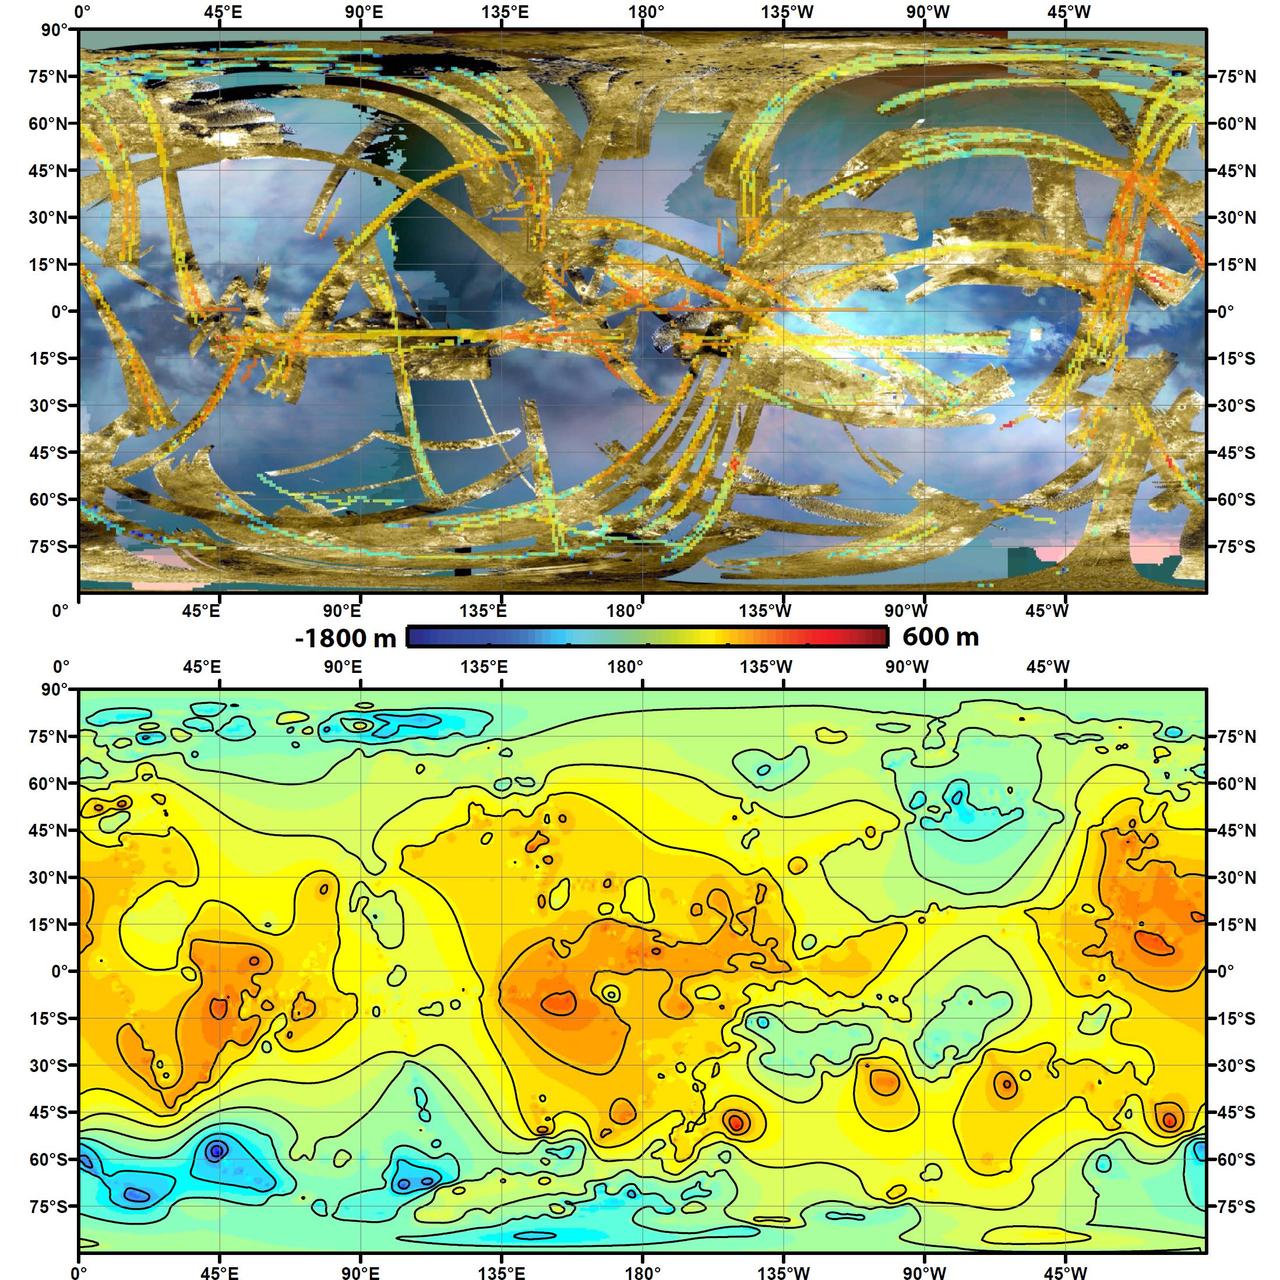
To create the first global, topographic map of Saturn moon Titan, scientists analyzed data from NASA Cassini spacecraft and a mathematical process called splining.
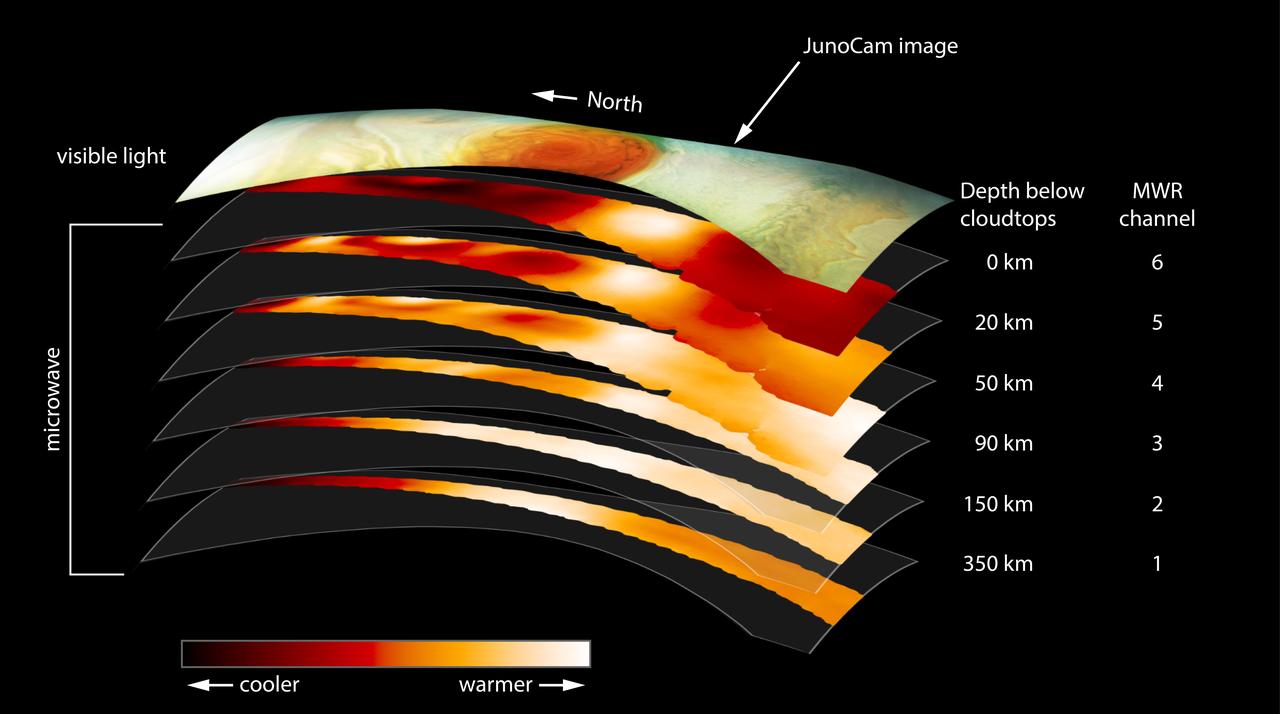
This figure shows data from the six channels of the microwave radiometer (MWR) instrument onboard NASA's Juno spacecraft. The data were collected in the mission's sixth science orbit (referred to as "perijove 7"), during which the spacecraft passed over Jupiter's Great Red Spot. The top layer in the figure is a visible light image from the mission's JunoCam instrument, provided for context. The MWR instrument enables Juno to see deeper into Jupiter than any previous spacecraft or Earth-based observations. Each MWR channel peers progressively deeper below the visible cloud tops. Channel 1 is sensitive to longer microwave wavelengths; each of the other channels is sensitive to progressively shorter wavelengths. The large-scale structure of the Great Red Spot is visible in the data as deep into Jupiter as MWR can observe. https://photojournal.jpl.nasa.gov/catalog/PIA22177
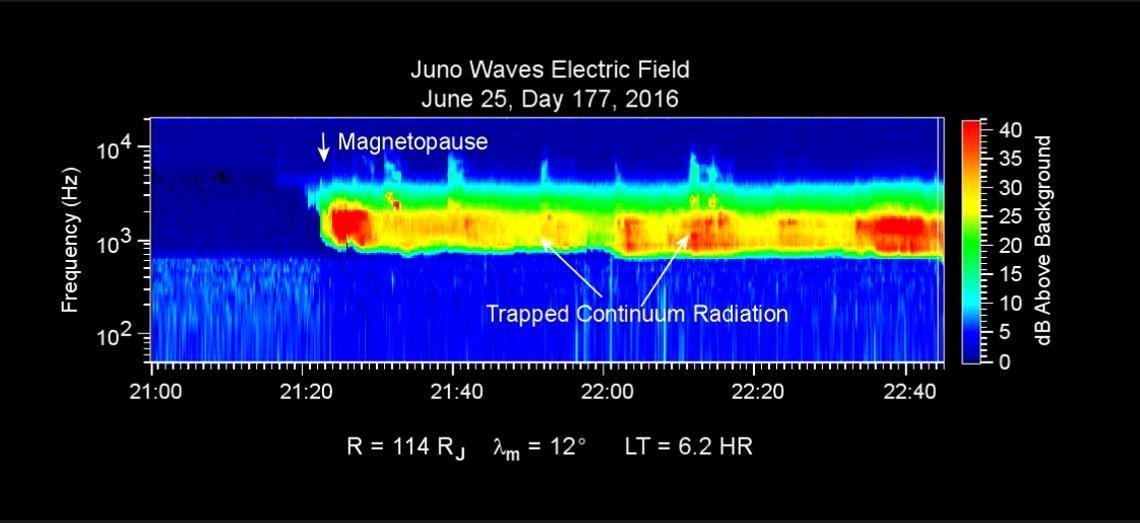
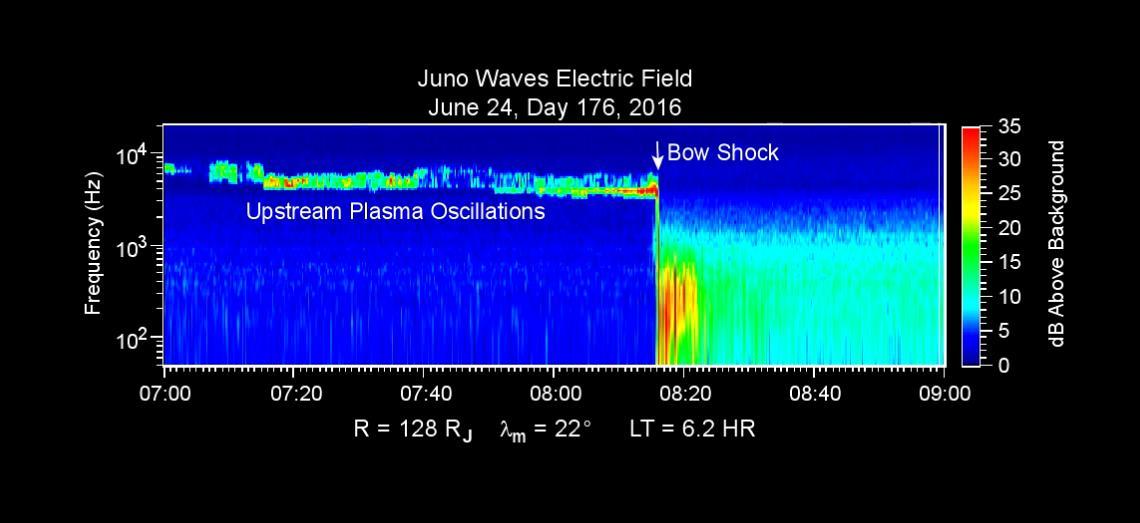
This chart presents data that the Waves investigation on NASA's Juno spacecraft recorded as the spacecraft crossed the bow shock just outside of Jupiter's magnetosphere on June 24, 2016, while approaching Jupiter. Audio accompanies the animation, with volume and pitch correlated to the amplitude and frequency of the recorded waves. The graph is a frequency-time spectrogram with color coding to indicate wave amplitudes as a function of wave frequency (vertical axis, in hertz) and time (horizontal axis, with a total elapsed time of two hours). During the hour before Juno reached the bow shock, the Waves instrument was detecting mainly plasma oscillations just below 10,000 hertz (10 kilohertz). The frequency of these oscillations is related to the local density of electrons; the data yield an estimate of approximately one electron per cubic centimeter (about 16 per cubic inch) in this region just outside Jupiter's bow shock. The broadband burst of noise marked "Bow Shock" is the region of turbulence where the supersonic solar wind is heated and slowed by encountering the Jovian magnetosphere. The shock is analogous to a sonic boom generated in Earth's atmosphere by a supersonic aircraft. The region after the shock is called the magnetosheath. The vertical bar to the right of the chart indicates the color coding of wave amplitude, in decibels (dB) above the background level detected by the Waves instrument. Each step of 10 decibels marks a tenfold increase in wave power. When Juno collected these data, the distance from the spacecraft to Jupiter was about 5.56 million miles (8.95 million kilometers), indicated on the chart as 128 times the radius of Jupiter. Jupiter's magnetic field is tilted about 10 degrees from the planet's axis of rotation. The note of 22 degrees on the chart indicates that at the time these data were recorded, the spacecraft was 22 degrees north of the magnetic-field equator. The "LT" notation is local time on Jupiter at the longitude of the planet directly below the spacecraft, with a value of 6.2 indicating approximately dawn. http://photojournal.jpl.nasa.gov/catalog/PIA20753
This chart presents data that the Waves investigation on NASA's Juno spacecraft recorded as the spacecraft crossed the bow shock just outside of Jupiter's magnetosphere on June 24, 2016, while approaching Jupiter. Audio accompanies the animation, with volume and pitch correlated to the amplitude and frequency of the recorded waves. The graph is a frequency-time spectrogram with color coding to indicate wave amplitudes as a function of wave frequency (vertical axis, in hertz) and time (horizontal axis, with a total elapsed time of two hours). During the hour before Juno reached the bow shock, the Waves instrument was detecting mainly plasma oscillations just below 10,000 hertz (10 kilohertz). The frequency of these oscillations is related to the local density of electrons; the data yield an estimate of approximately one electron per cubic centimeter (about 16 per cubic inch) in this region just outside Jupiter's bow shock. The broadband burst of noise marked "Bow Shock" is the region of turbulence where the supersonic solar wind is heated and slowed by encountering the Jovian magnetosphere. The shock is analogous to a sonic boom generated in Earth's atmosphere by a supersonic aircraft. The region after the shock is called the magnetosheath. The vertical bar to the right of the chart indicates the color coding of wave amplitude, in decibels (dB) above the background level detected by the Waves instrument. Each step of 10 decibels marks a tenfold increase in wave power. When Juno collected these data, the distance from the spacecraft to Jupiter was about 5.56 million miles (8.95 million kilometers), indicated on the chart as 128 times the radius of Jupiter. Jupiter's magnetic field is tilted about 10 degrees from the planet's axis of rotation. The note of 22 degrees on the chart indicates that at the time these data were recorded, the spacecraft was 22 degrees north of the magnetic-field equator. The "LT" notation is local time on Jupiter at the longitude of the planet directly below the spacecraft, with a value of 6.2 indicating approximately dawn. http://photojournal.jpl.nasa.gov/catalog/PIA20753
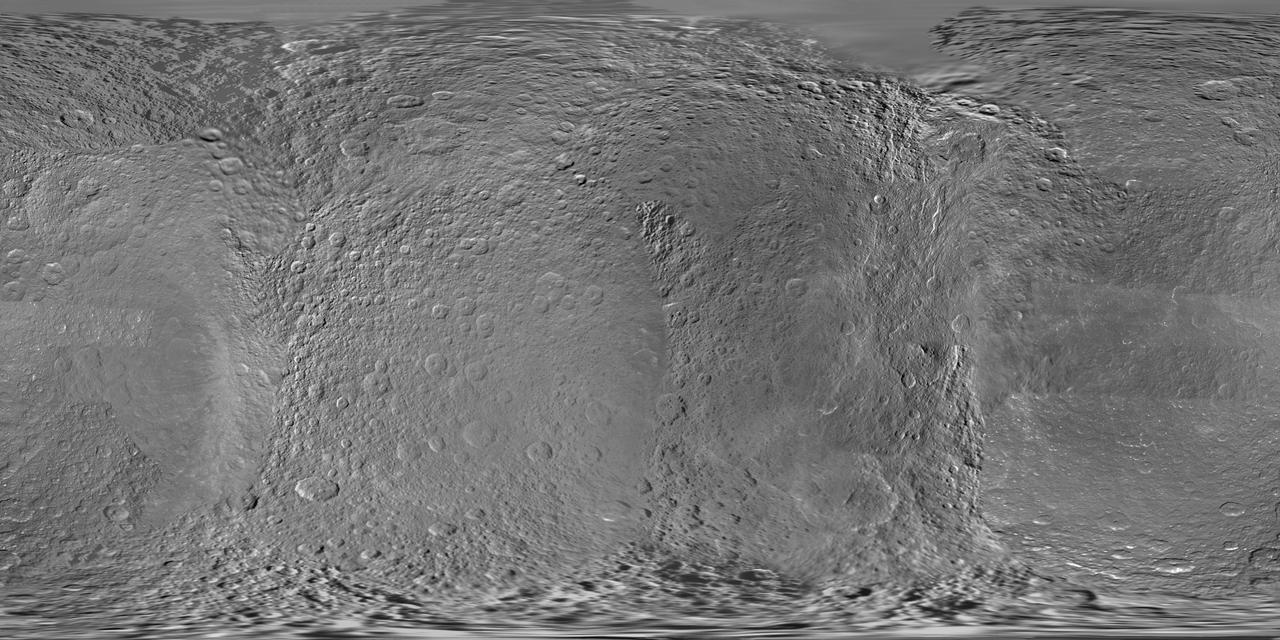
This global digital map of Rhea was created using data taken during NASA Cassini and Voyager spacecraft flybys. This map contains data from Cassini Jan. 11, 2011, flyby of Rhea. Six Voyager images fill gaps in Cassini coverage of the north pole.
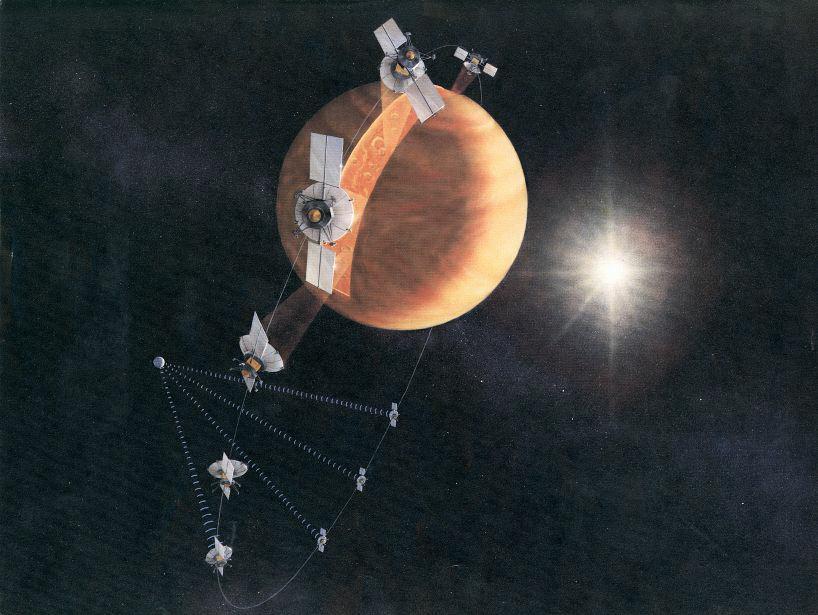
An artist's concept of the Magellan spacecraft making a radar map of Venus. Magellan mapped 98 percent of Venus' surface at a resolution of 100 to 150 meters (about the length of a football or soccer field), using synthetic aperture radar, a technique that simulates the use of a much larger radar antenna. It found that 85 percent of the surface is covered with volcanic flows and showed evidence of tectonic movement, turbulent surface winds, lava channels and pancake-shaped domes. Magellan also produced high-resolution gravity data for 95 percent of the planet and tested a new maneuvering technique called aerobraking, using atmospheric drag to adjust its orbit. The spacecraft was commanded to plunge into Venus' atmosphere in 1994 as part of a final experiment to gather atmospheric data. http://photojournal.jpl.nasa.gov/catalog/PIA18175

These four images of the Moon are from data acquired by NASA Galileo spacecraft Near-Earth Mapping Spectrometer during Galileo December 1992 Earth/Moon flyby. http://photojournal.jpl.nasa.gov/catalog/PIA00231
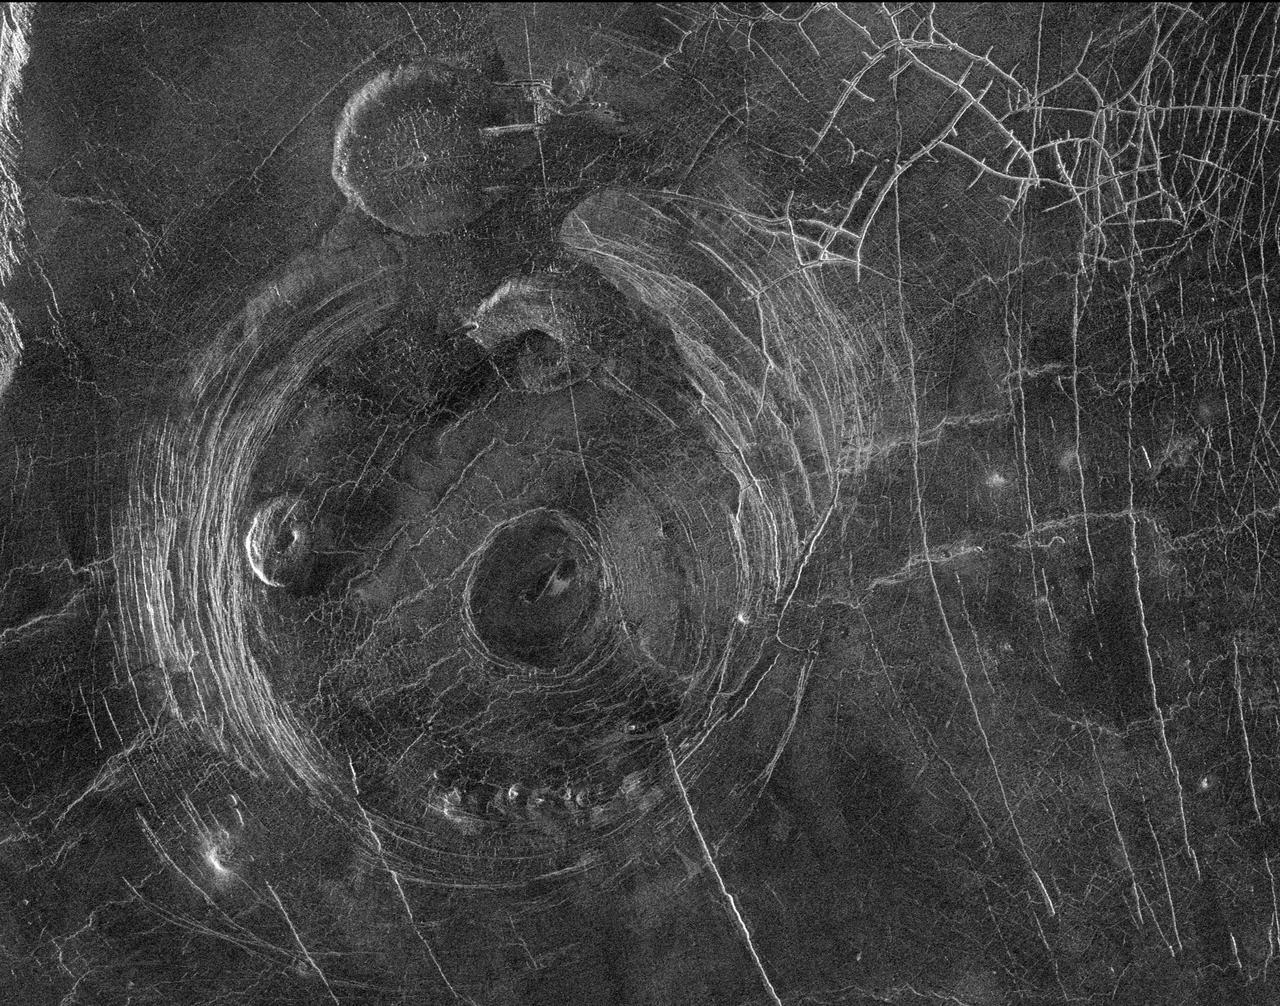
This radar image from NASA Magellan spacecraft shows a region located in a vast plain to the south of Aphrodite Terra. The data for this image was obtained in January 1991. http://photojournal.jpl.nasa.gov/catalog/PIA00202
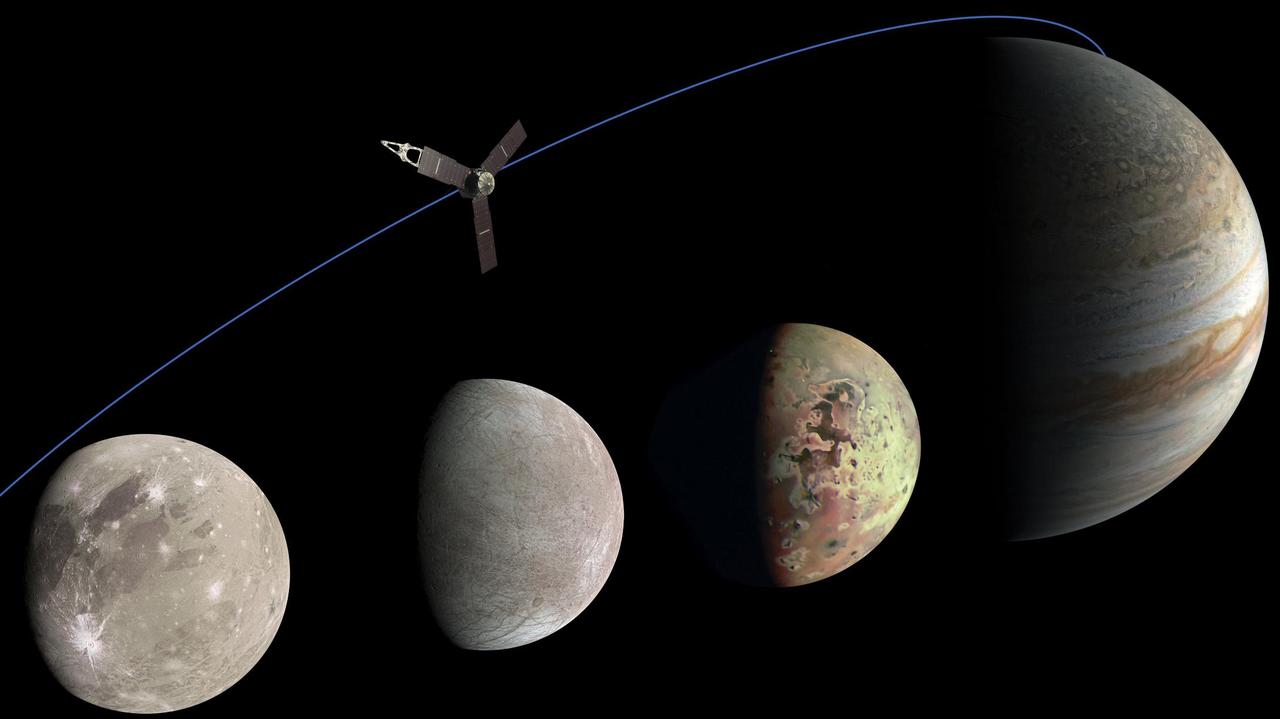
This photo illustration of Jupiter and the three Jovian moons NASA's Juno mission has flown past was generated from data collected by the spacecraft's JunoCam imager. Ganymede, the moon furthest to the left, was imaged by JunoCam as it flew past on June 8, 2021. Citizen scientist Kevin M. Gill created this image using data from JunoCam. The moon second from the left is Europa, which Juno imaged on Sept. 29, 2022. Citizen scientist Kevin M. Gill created this image using data from JunoCam. The image of Io was captured during a flyby of the moon on May 16, 2023. Citizen scientist Thomas Thomopoulos created this image using data from JunoCam. The image of Jupiter was captured on Dec. 15, 2022. Citizen scientist Kevin M. Gill created this image using data from JunoCam. https://photojournal.jpl.nasa.gov/catalog/PIA25966
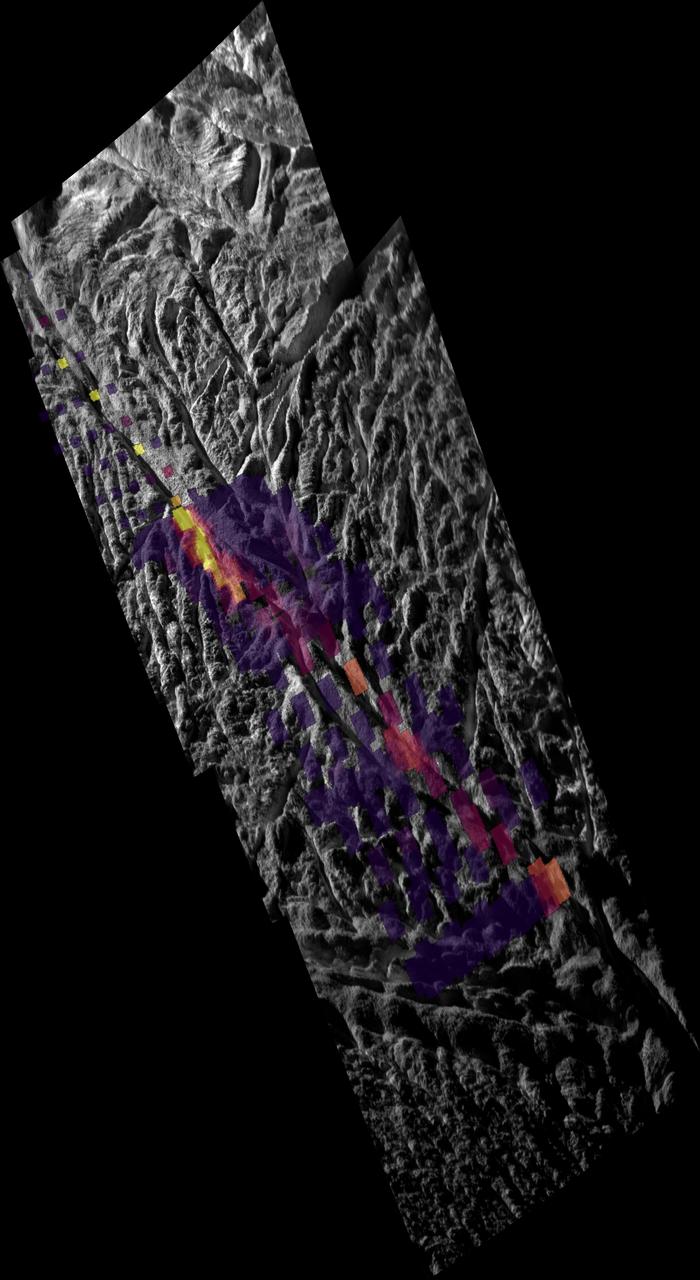
This image, combining data from the imaging science subsystem and composite infrared spectrometer aboard NASA Cassini spacecraft, shows pockets of heat appearing along one of the mysterious fractures in the south polar region of Saturn moon Enceladus
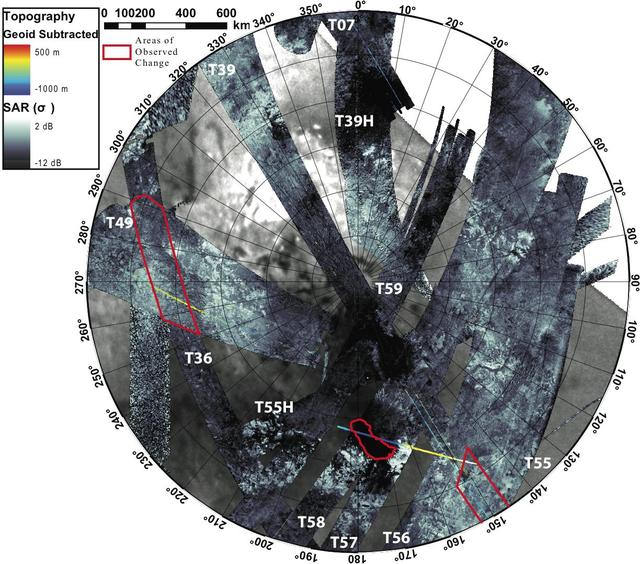
This first glimpse of seasonal change shows the southern polar area of Saturn moon Titan, using data from the Synthetic Aperture Radar instrument aboard NASA Cassini spacecraft.
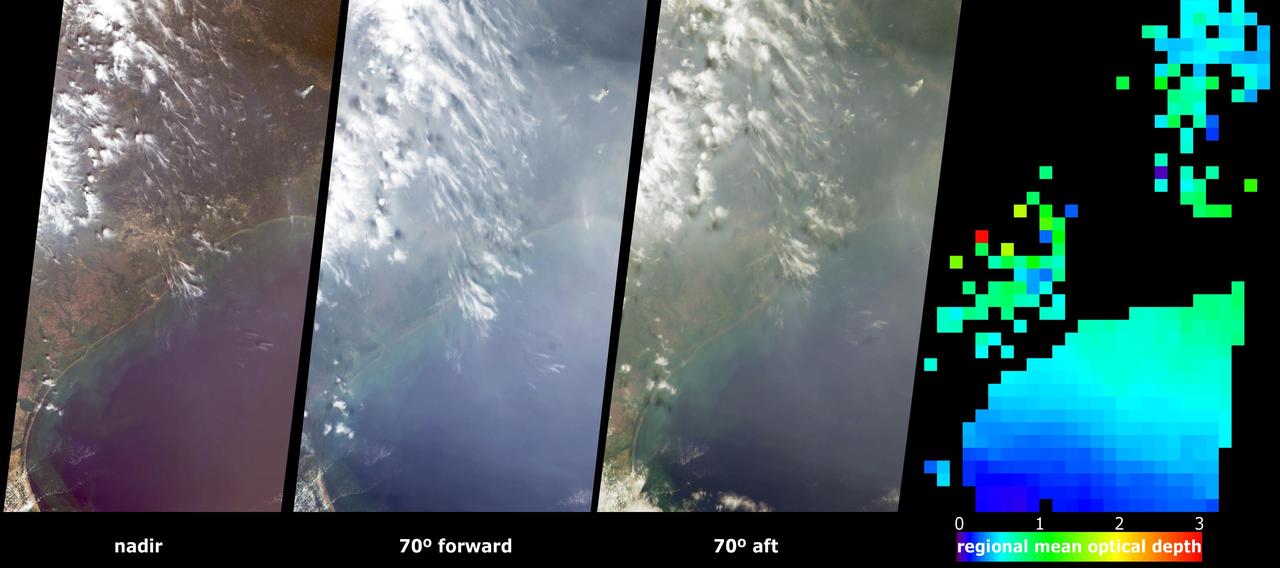
These views from NASA Terra spacecraft portray Houston and Galveston Bay on September 12, 2002, and display data from three of MISR nine cameras along with a map of retrieved aerosol optical thickness.
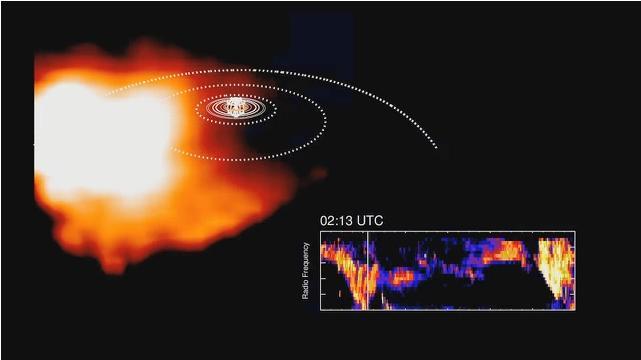
This frame from an animation, derived from data obtained by NASA Cassini spacecraft, shows how plasma swirling around Saturn is correlated to bursts of radio waves emanating from the planet.
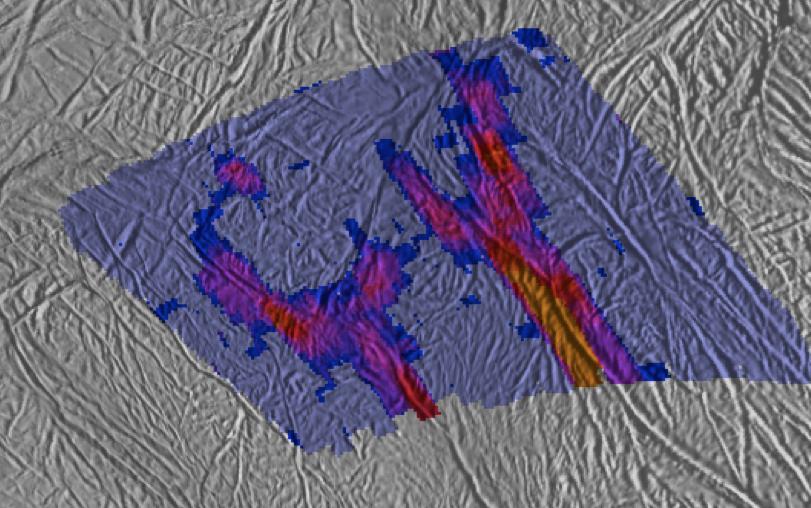
This image shows a high-resolution heat intensity map of part of the south polar region of Saturn moon Enceladus, made from data obtained by NASA Cassini spacecraft.
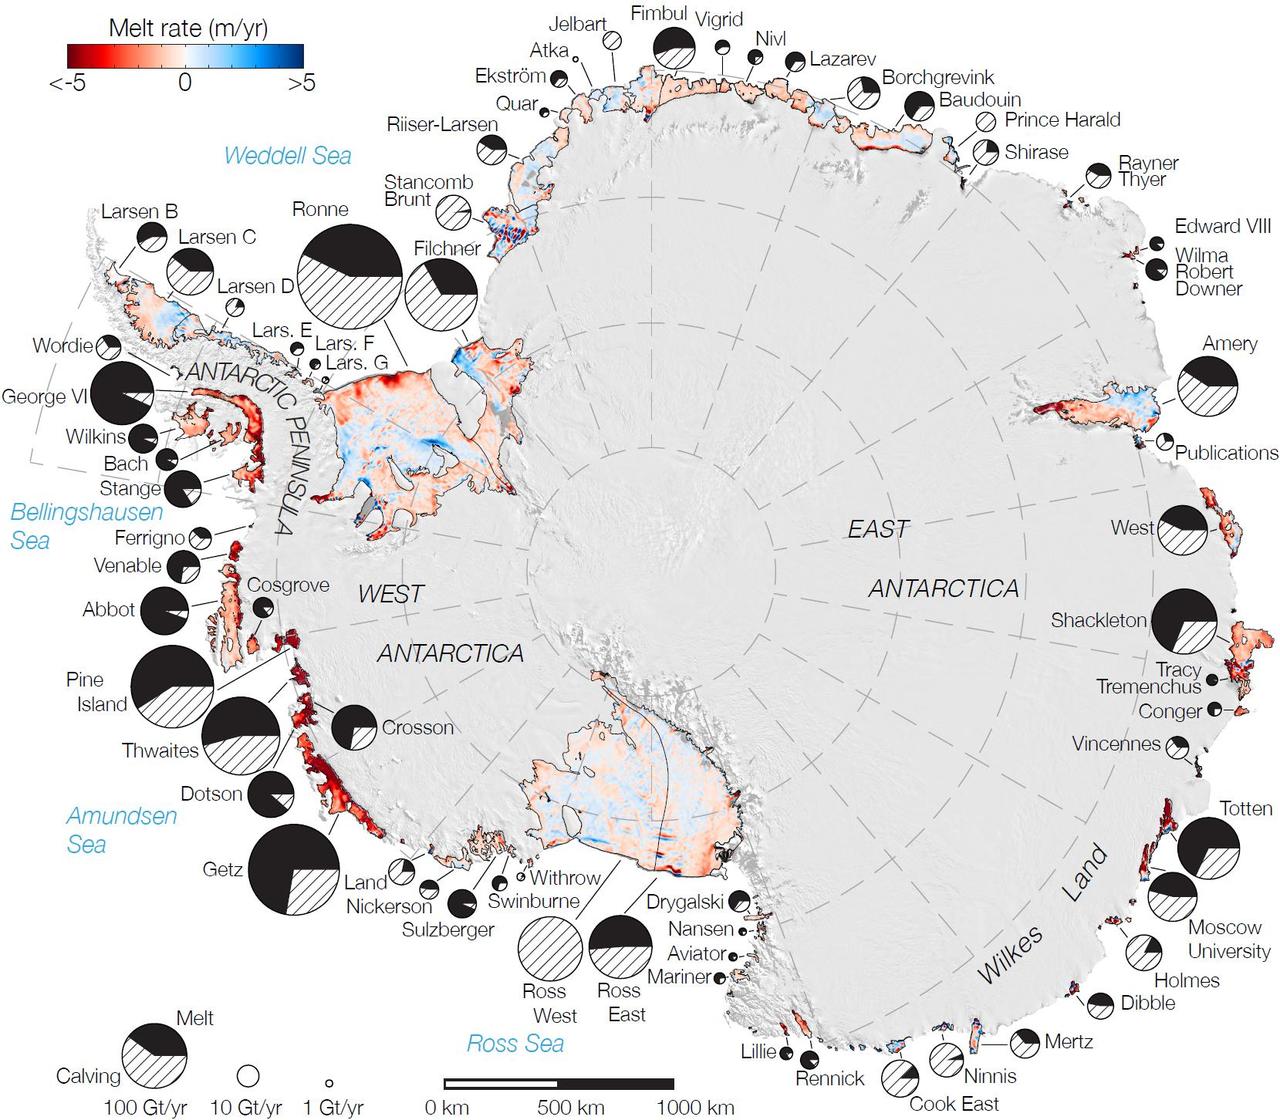
Rates of basal melt of Antarctic ice shelves melting of the shelves from underneath overlaid on a 2009 mosaic of Antarctica created from data from NASA Terra and Aqua spacecraft.
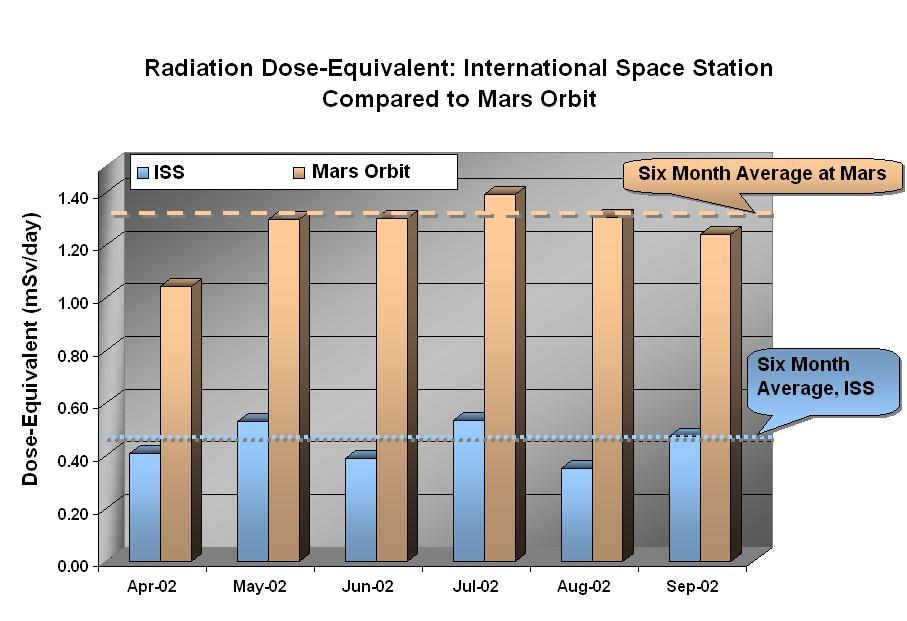
Data from NASA Mars Odyssey spacecraft Martian radiation environment experiment show that the radiation dose equivalent at Mars is two to three times greater than that aboard the International Space Station.
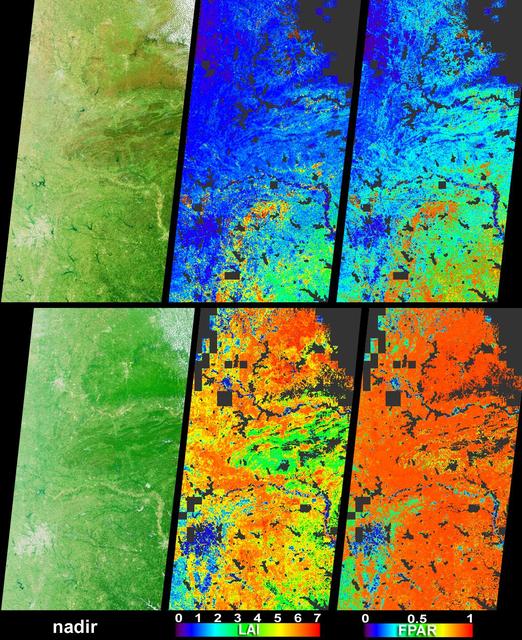
Vigorous vegetation growth in the Southern United States after heavy rains fell during April and early May, 2004, is quantified in these images and data products from NASA Terra spacecraft.
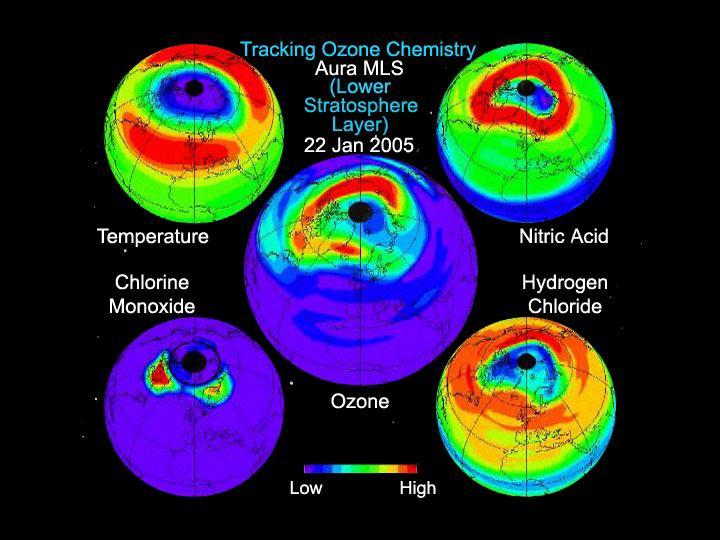
This still from an animation created from data from the Microwave Limb Sounder instrument on NASA Aura spacecraft depicts the complex interaction of chemicals involved in the destruction of ozone during the 2005 Arctic winter.
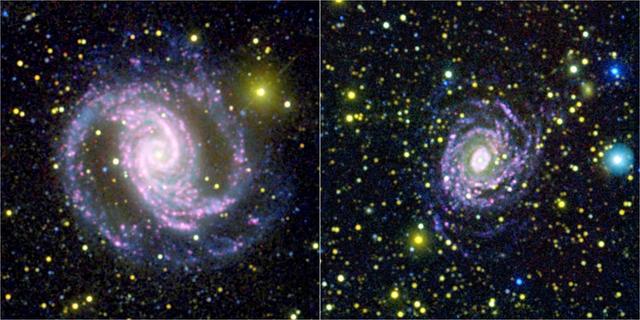
These two photographs were made by combining data from NASA Galaxy Evolution Explorer spacecraft and the Cerro Tololo Inter-American Observatory in Chile to learn that not all galaxies make stars of different sizes in the same quantities.
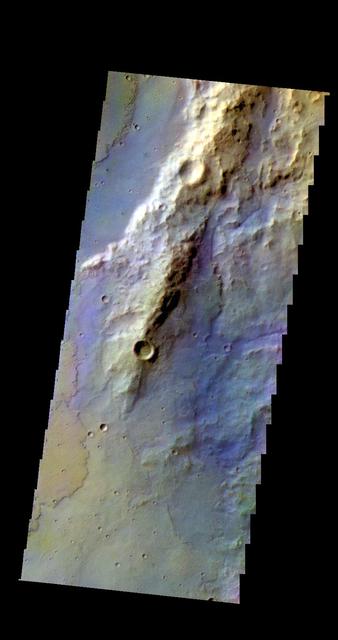
The THEMIS camera contains 5 filters. The data from different filters can be combined in multiple ways to create a false color image. This image from NASA 2001 Mars Odyssey spacecraft shows part of Terra Sirenum.

NASA Voyager 2 spacecraft flew by Triton, a moon of Neptune, in the summer of 1989. Dr. Paul Schenk, a scientist at the Lunar and Planetary Institute in Houston, used Voyager data to construct the best-ever global color map of Triton.
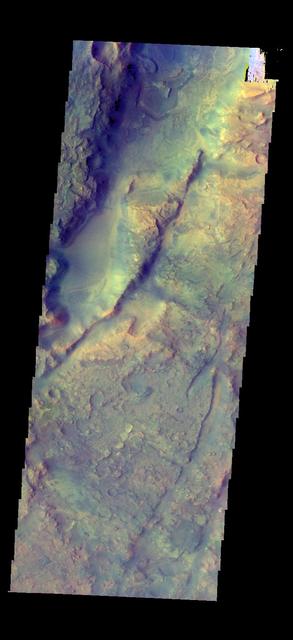
The THEMIS camera contains 5 filters. The data from different filters can be combined in multiple ways to create a false color image. This image from NASA 2001 Mars Odyssey spacecraft shows part of Nili Fossae.
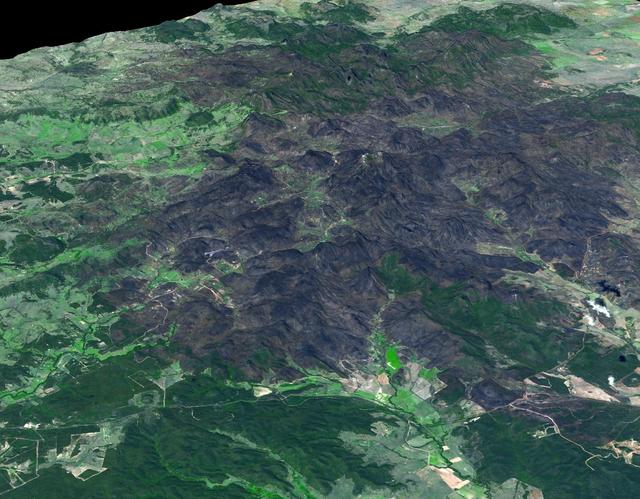
This 3-D view was created from data acquired Feb. 4, 2013 by NASA Terra spacecraft showing a massive wildfire which damaged Australia largest optical astronomy facility, the Siding Spring Observatory.
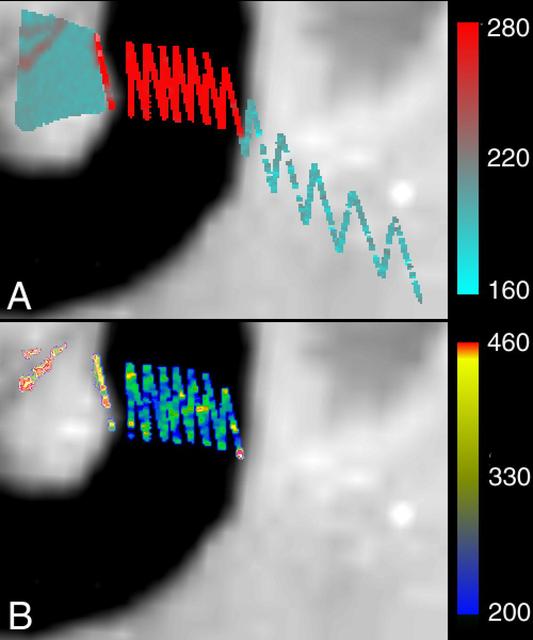
This image of Loki Patera on Jupiter volcanic moon Io shows data taken by the near-infrared mapping spectrometer onboard NASA Galileo spacecraft during its Io flyby on Oct. 10, 1999.
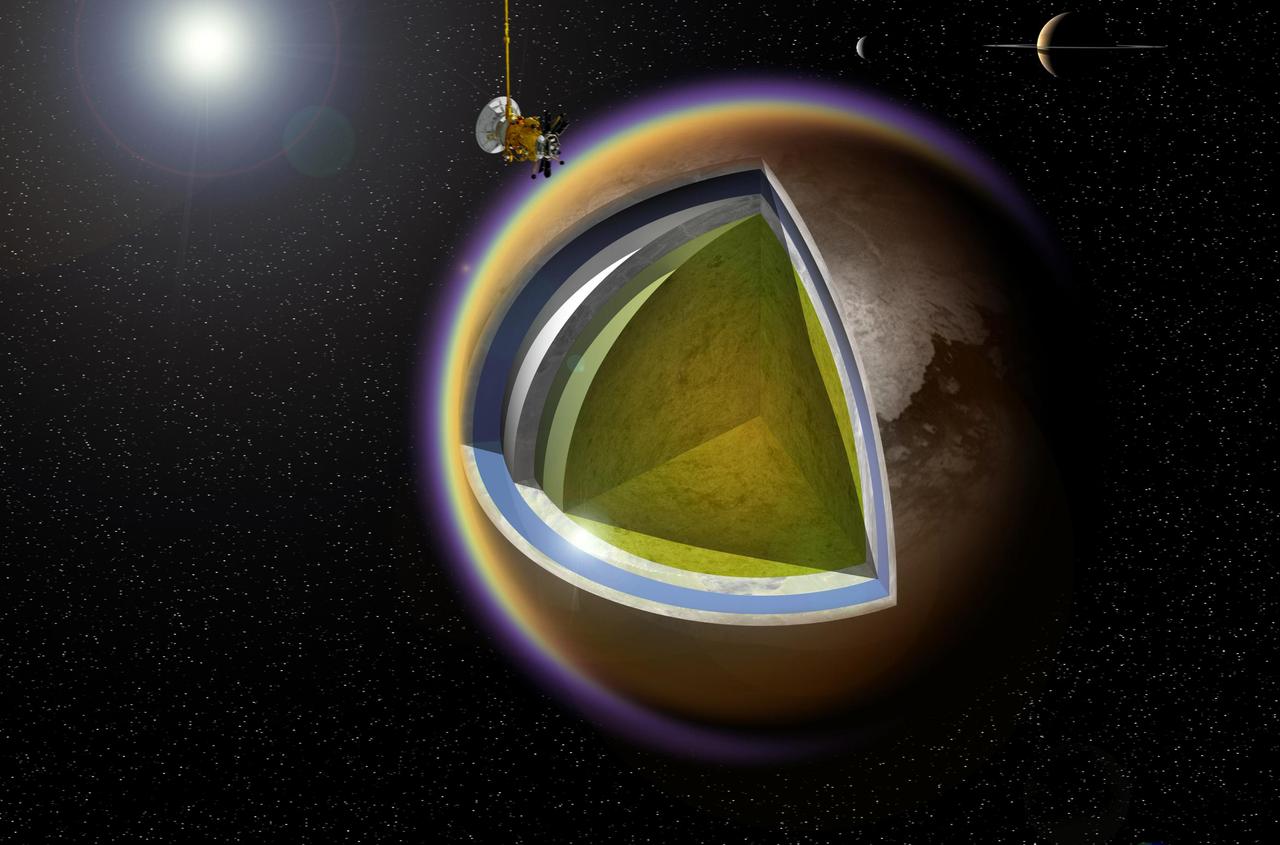
This artist concept shows a possible model of Titan internal structure that incorporates data from NASA Cassini spacecraft. A model of Cassini is shown making a targeted flyby over Titan cloudtops; Saturn and Enceladus appear at upper right.
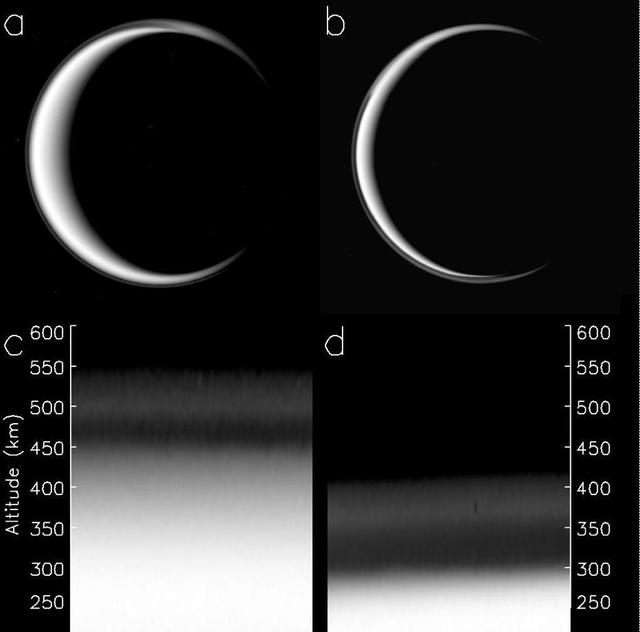
The change in Titan haze layer is illustrated in this figure, derived from data obtained by NASA Cassini spacecraft. The picture of Titan in panel a was taken on May 3, 2006, panel b was taken on April 2, 2010.
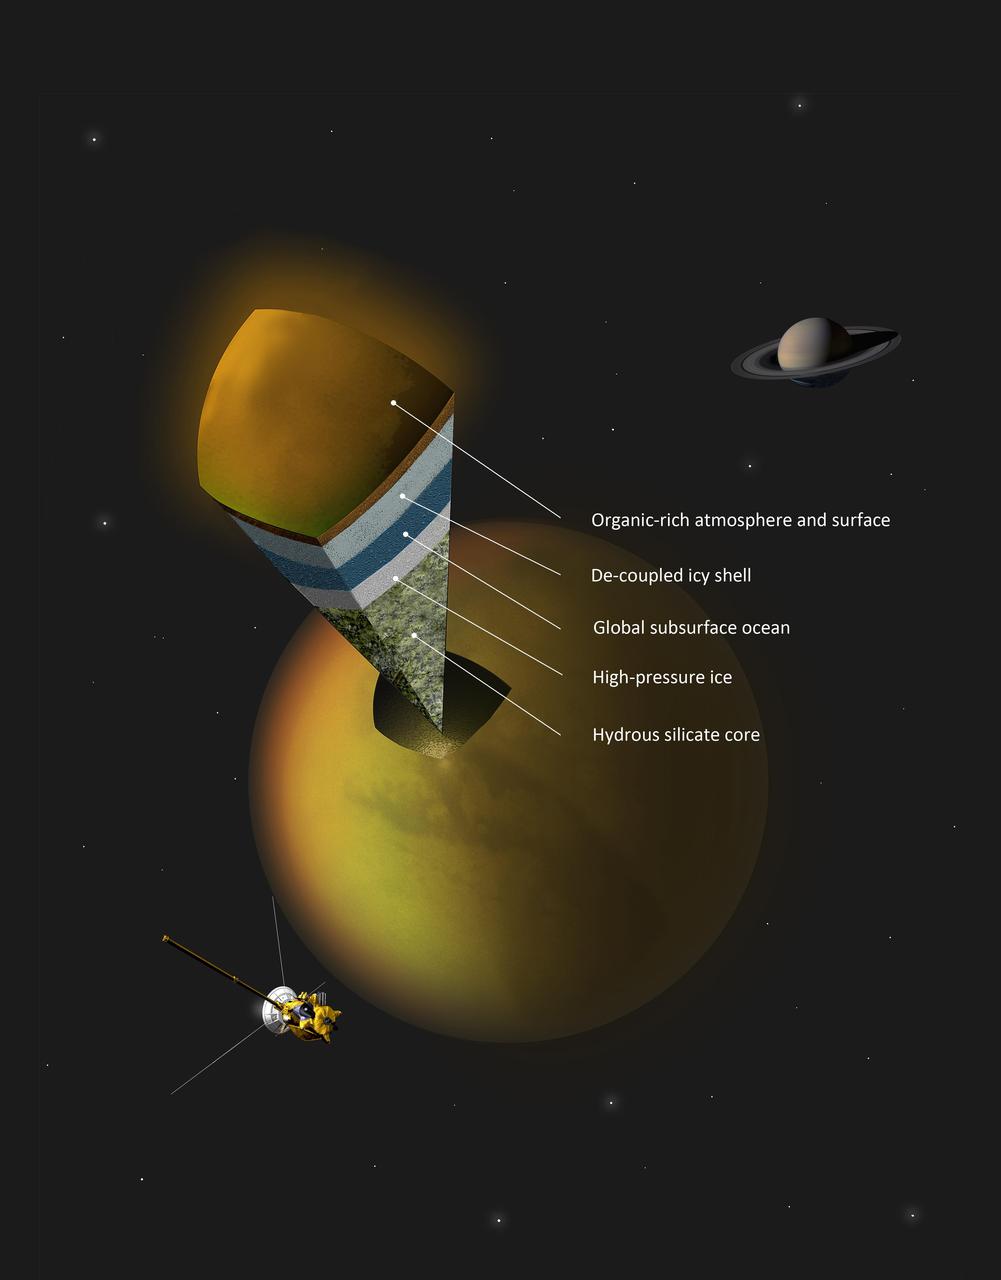
This artist concept shows a possible scenario for the internal structure of Titan, as suggested by data from NASA Cassini spacecraft. Scientists have been trying to determine what is under Titan organic-rich atmosphere and icy crust.
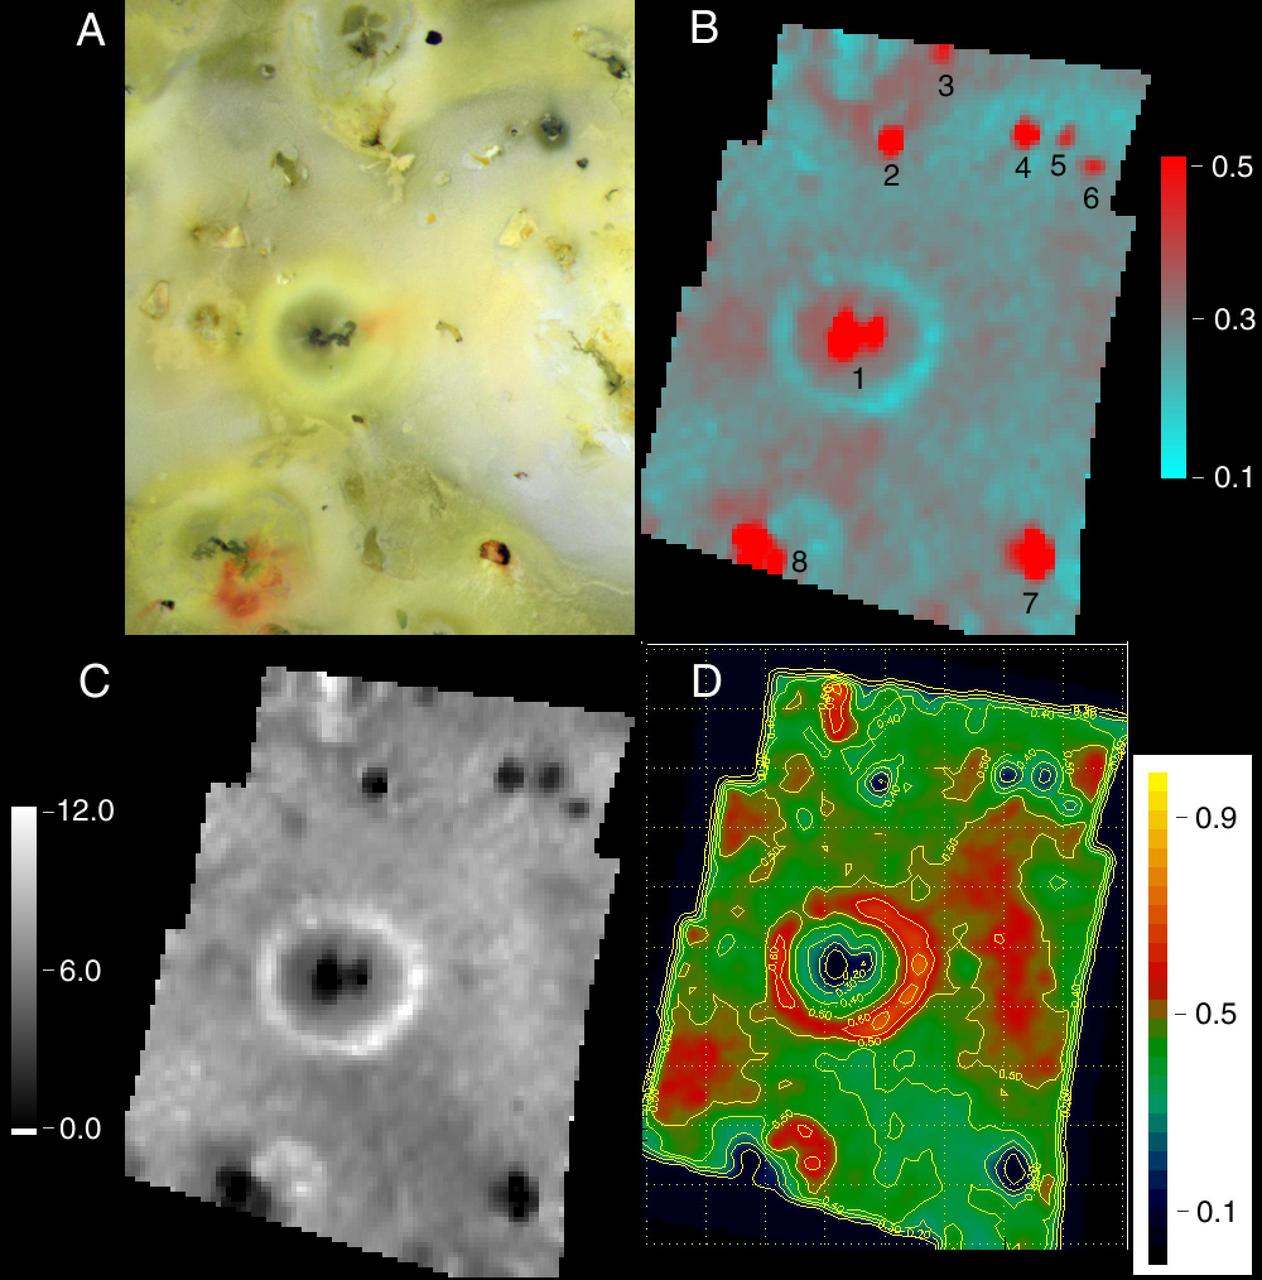
The Prometheus region of Jupiter moon Io was imaged by NASA Galileo spacecraft in 1999. The maps made from spectrometer data show the interplay between hot silicates on the surface and sulfur dioxide frost.

This still from an animation made from data obtained by NASA Dawn spacecraft shows the topography of a portion of the wall and interior of the Rheasilvia impact basin in asteroid Vesta south-polar region.
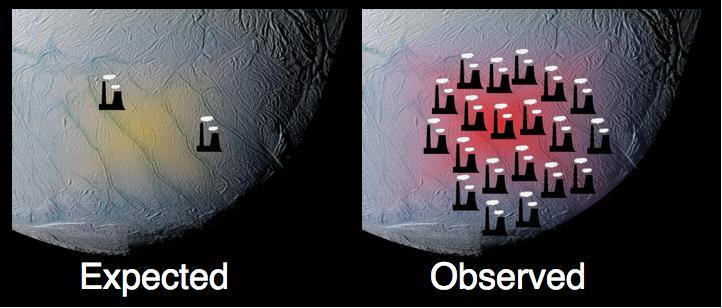
This graphic, using data from NASA Cassini spacecraft, shows how the south polar terrain of Saturn moon Enceladus emits much more power than scientists had originally predicted.
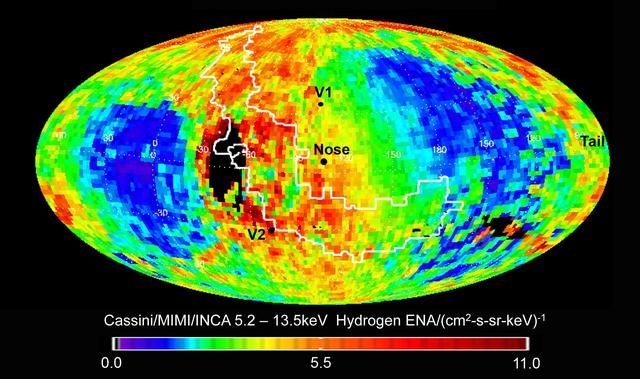
Data from NASA Cassini spacecraft have enabled scientists to create this map of the heliosphere, the bubble of charged particles around our sun. Charged particles stream out from our sun in a phenomenon known as solar wind.
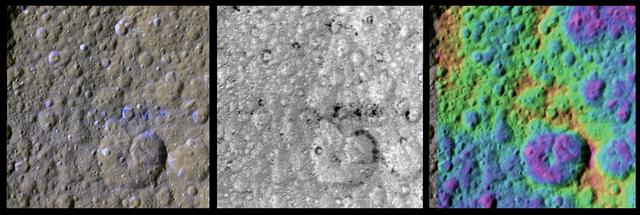
These three enhanced-color views of an equatorial region on Saturn moon Rhea were made from data obtained by NASA Cassini spacecraft. The colors have been enhanced to show colorful splotches and bands on the icy moon surface.
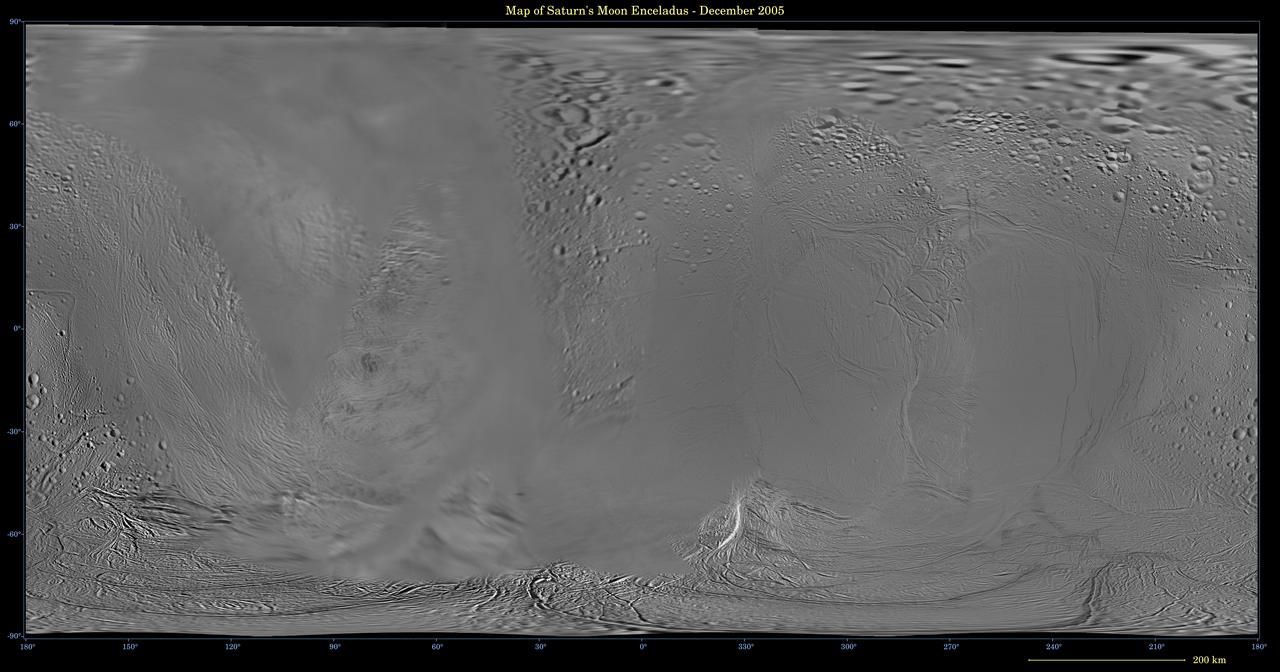
This global digital map of Saturn moon Enceladus was created using data taken during Cassini and Voyager spacecraft flybys. The map is an equidistant projection and has a scale of 110 meters 361 feet per pixel
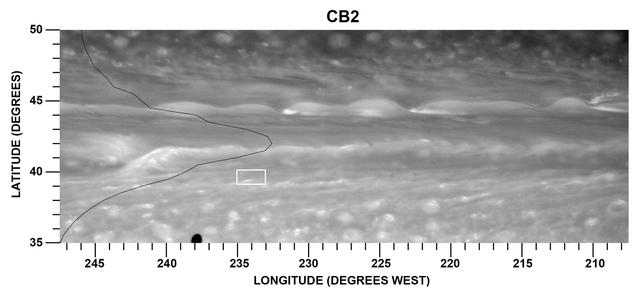
This figure examines a particularly strong jet stream and the eddies that drive it through the atmosphere of Saturn northern hemisphere. Data from NASA Cassini spacecraft were used to create this figure.

These two views of Mars were made with data taken by the neutron spectrometer component of NASA Mars Odyssey spacecraft and show epithermal neutron flux, which is sensitive to the amount of hydrogen present.
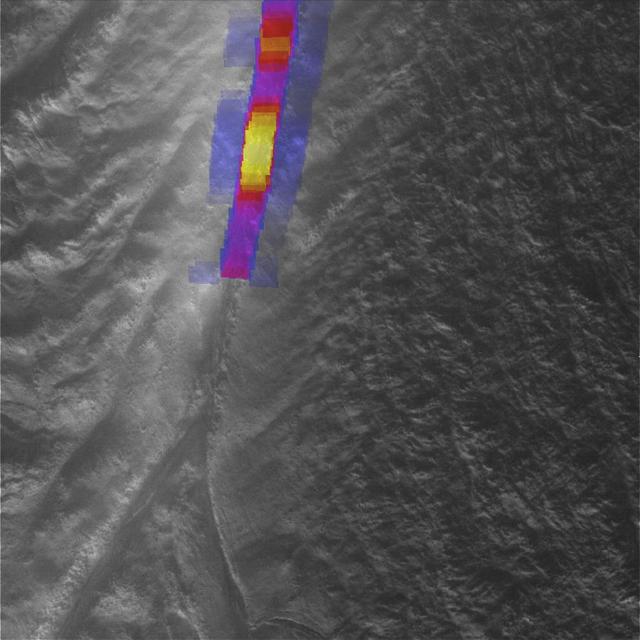
Data from NASA Cassini spacecraft have enabled scientists to make the highest-resolution heat intensity maps yet for the hottest part of a tiger stripe fissure on Saturn moon Enceladus.
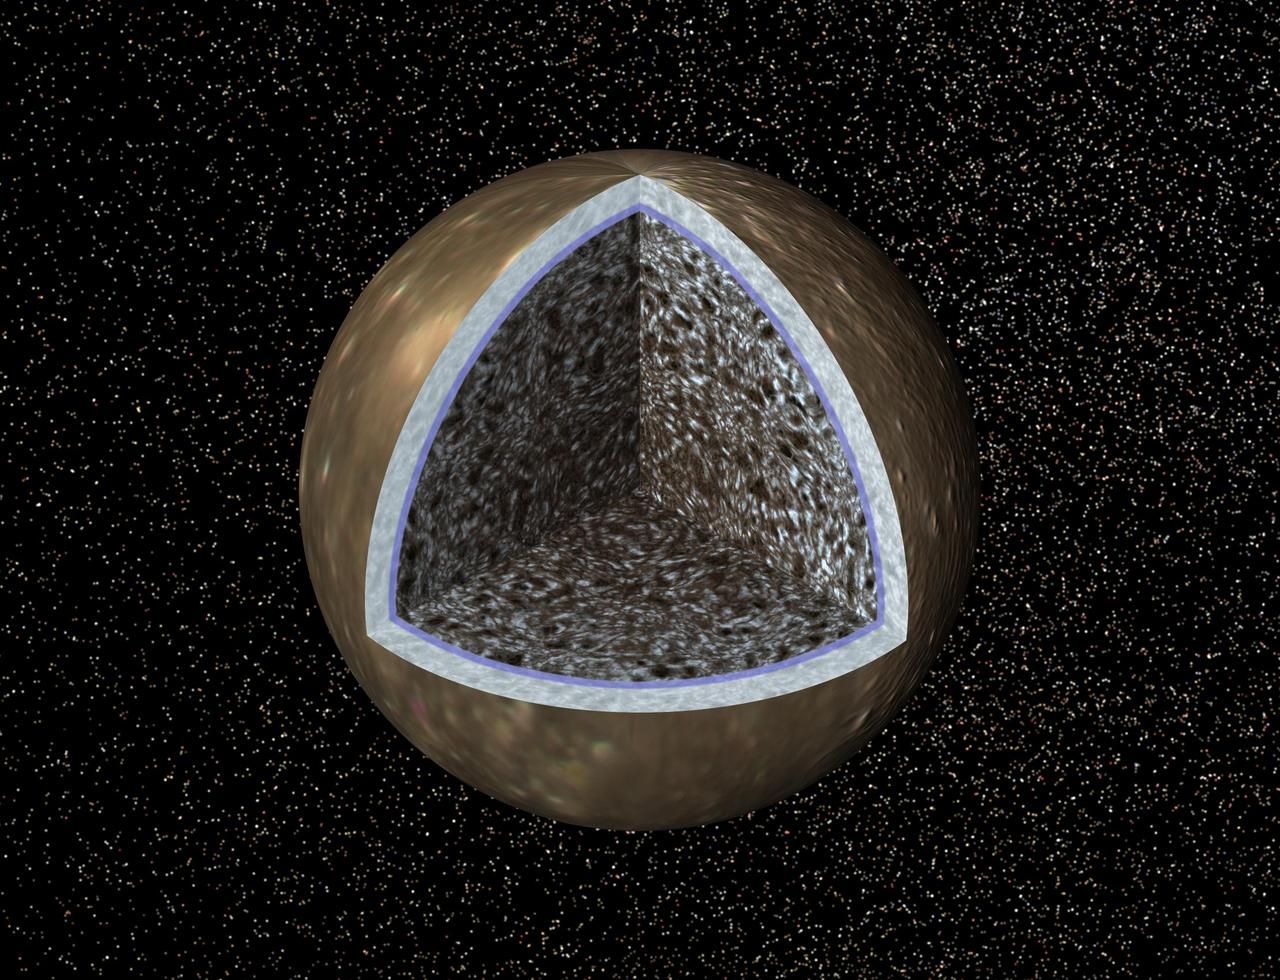
This artist concept, a cutaway view of Jupiter moon Callisto, is based on recent data from NASA Galileo spacecraft which indicates a salty ocean may lie beneath Callisto icy crust.
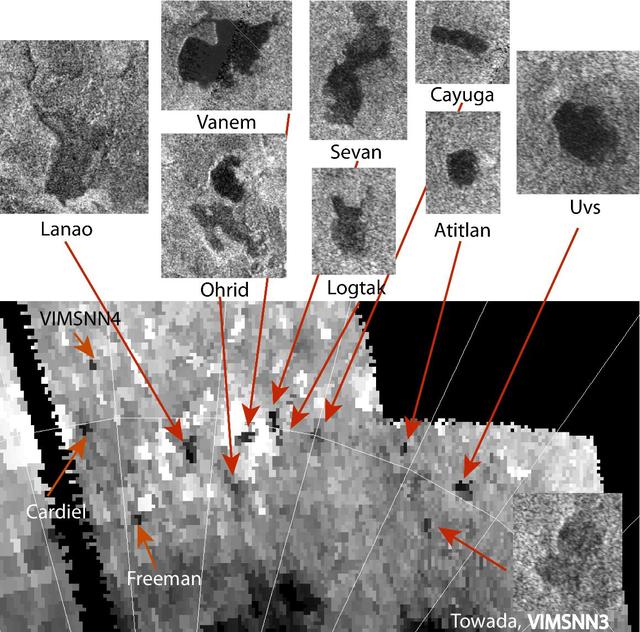
Three new small lakes, 100 to 300 square miles a few hundreds of square kilometers in surface area, have been identified on Saturn moon Titan in data from NASA Cassini spacecraft.
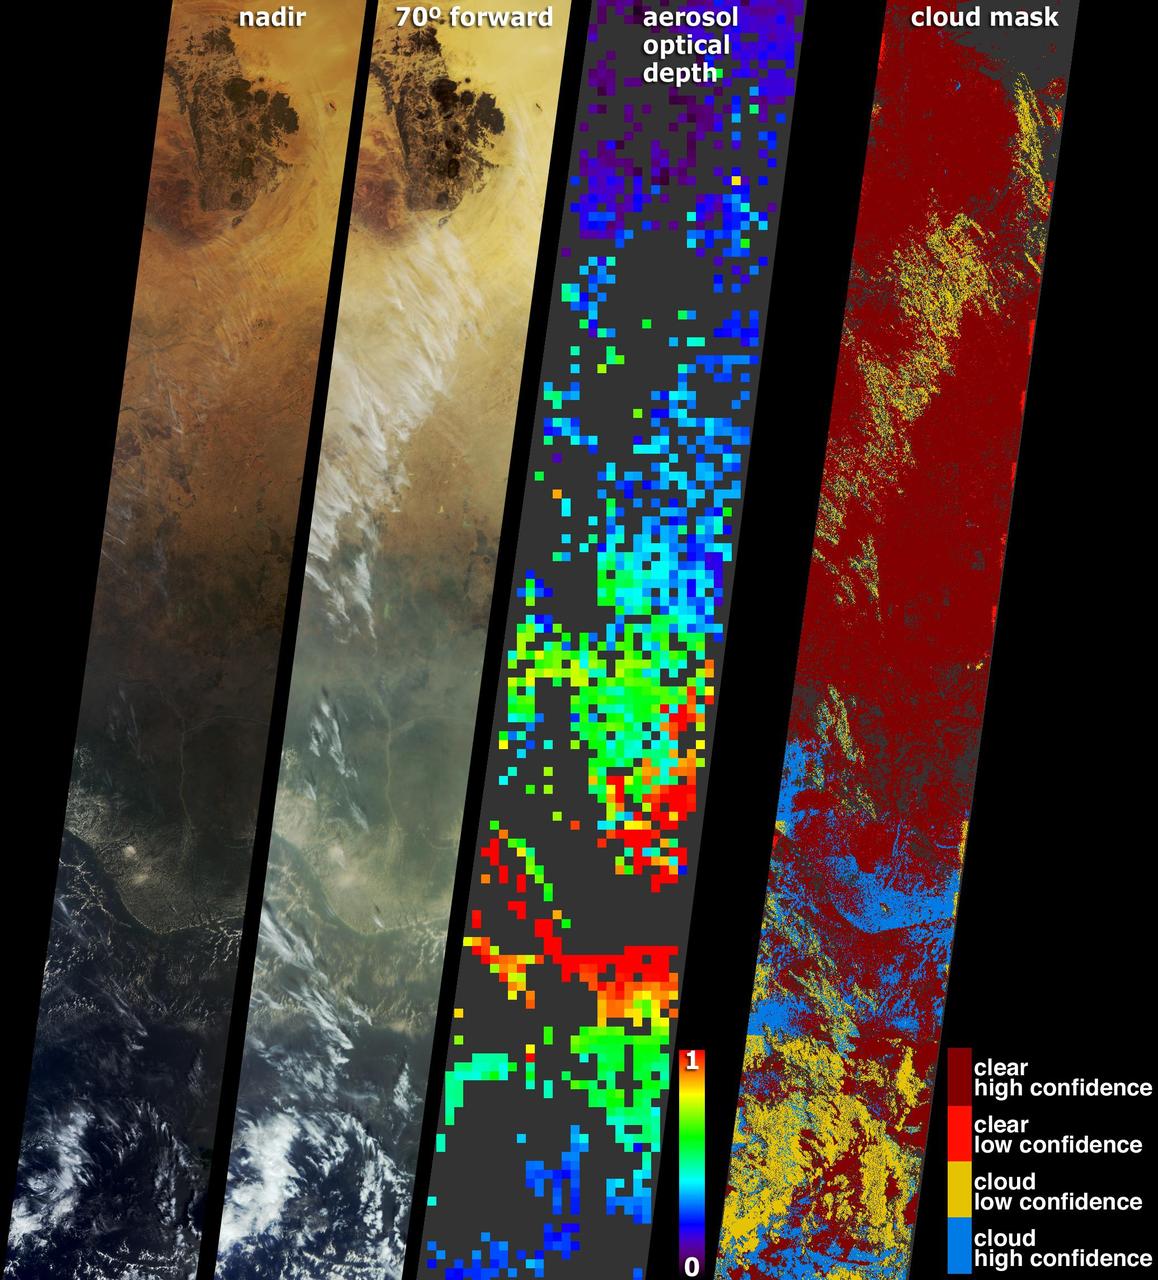
These images and data products from NASA Terra spacecraft documented extensive smoke from fires burning throughout Nigeria and north central Africa on January 31, 2003.
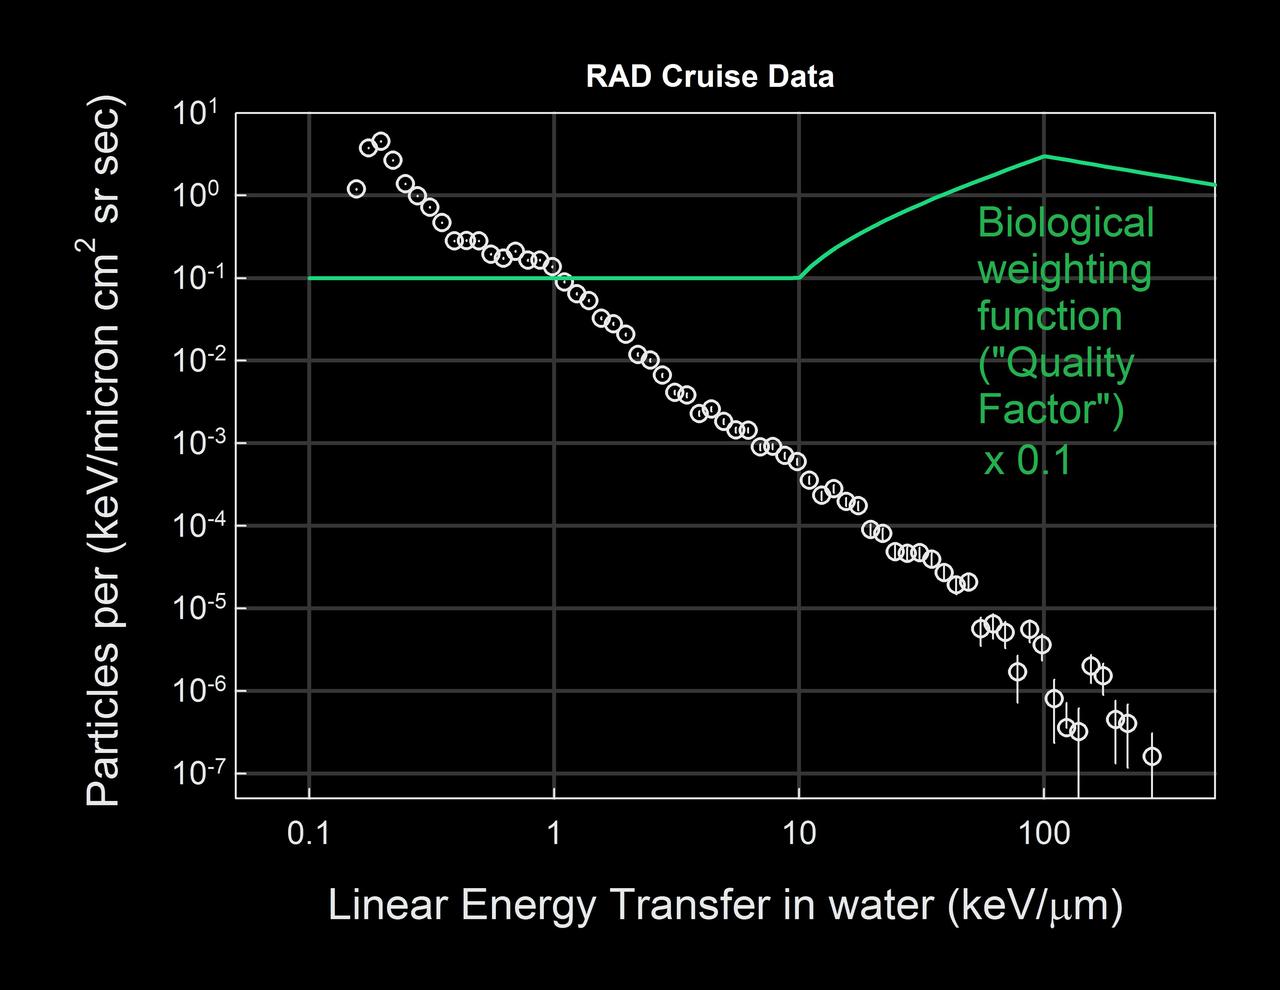
This graph based on data from the RAD instrument onboard NASA Mars Science Laboratory spacecraft shows the flux of energetic particles vertical axis as a function of the estimated energy deposited in water horizontal axis.
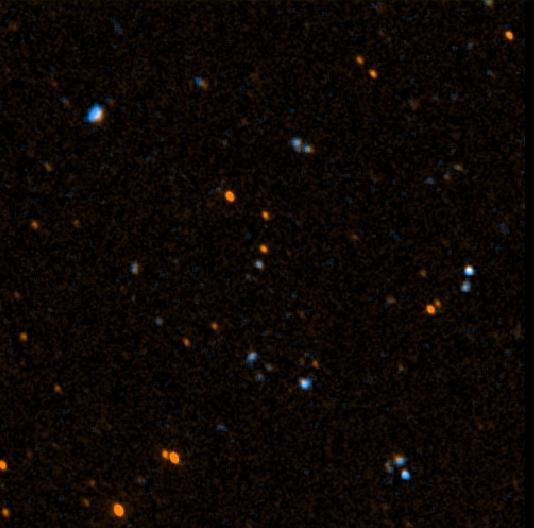
This image was taken May 21 and 22, 2003, by NASA Galaxy Evolution Explorer. The image was made from data gathered by the two channels of the spacecraft camera during the mission first light milestone.
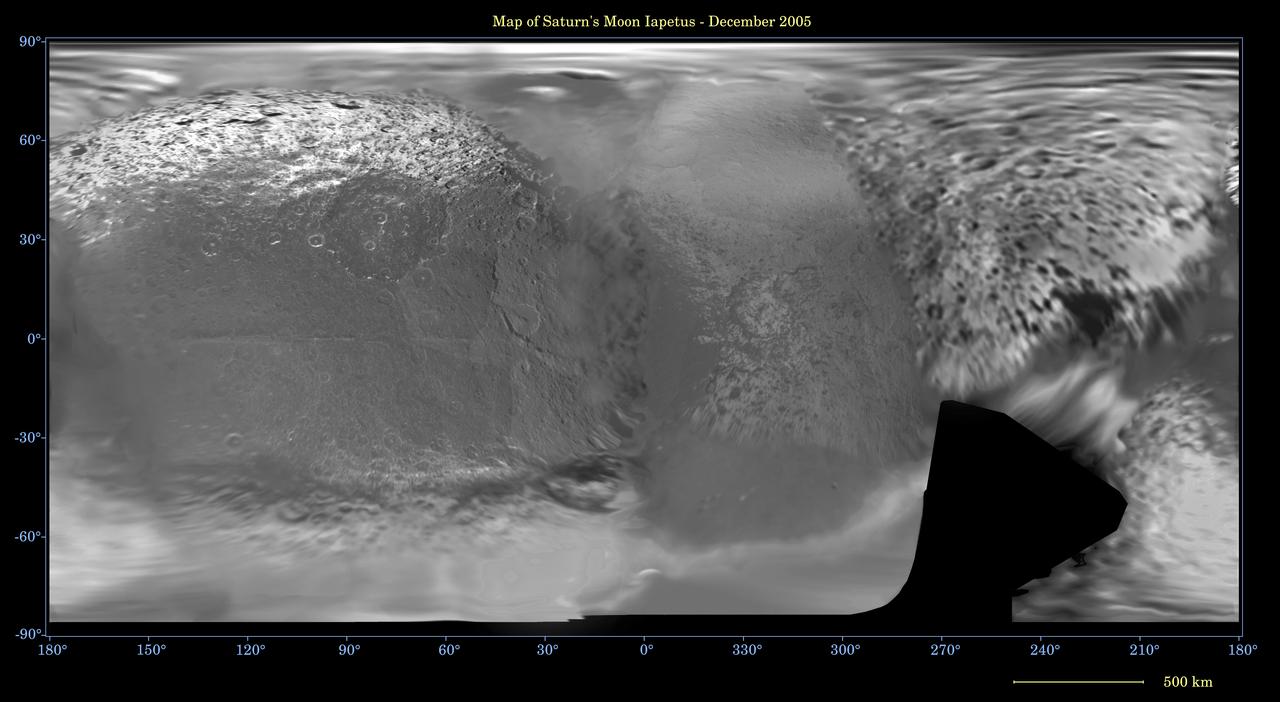
This global digital map of Saturn moon Iapetus was created using data taken during Cassini and Voyager spacecraft flybys. The map is an equidistant projection and has a scale of 641 meters 2,103 feet per pixel
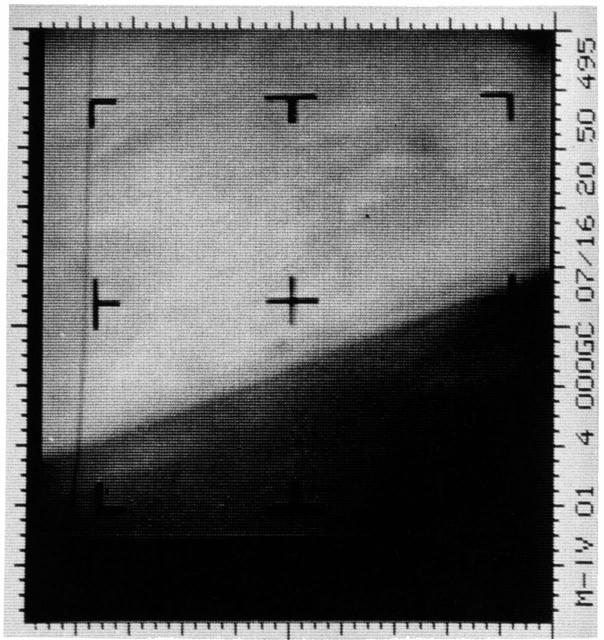
This is an enhanced contrast version of the first Mars photograph released on July 15, 1965. This is man first close-up photograph of another planet, a photographic representation of digital data radioed from Mars by the Mariner 4 spacecraft.
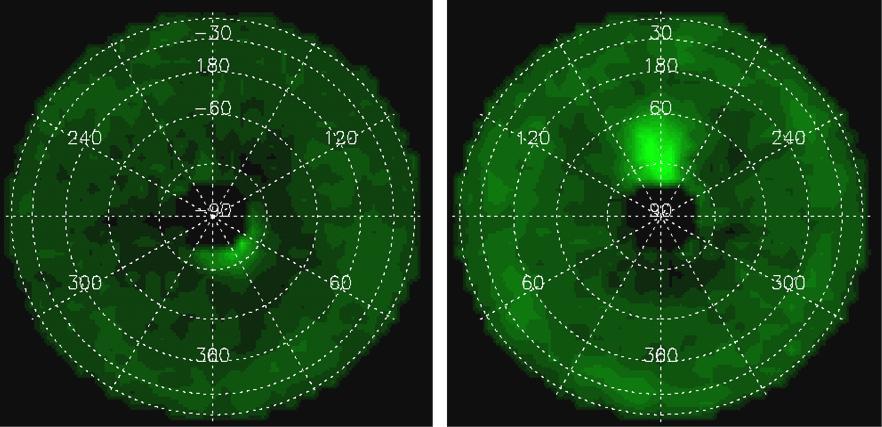
This graphic shows the distribution of the organic molecule acetylene at the north and south poles of Jupiter, based on data obtained by NASA Cassini spacecraft in early January 2001. Movie is available at the Photojournal.
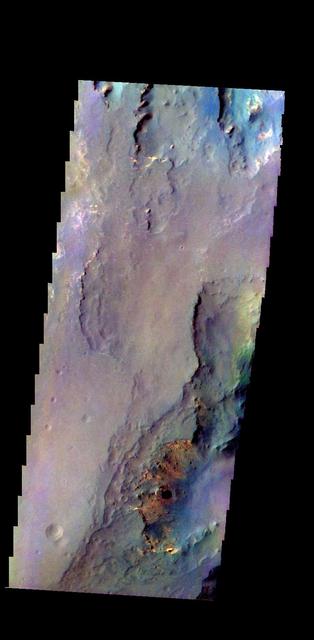
The THEMIS camera contains 5 filters. The data from different filters can be combined in multiple ways to create a false color image. This image from NASA 2001 Mars Odyssey spacecraft shows part of Capri Mensa.
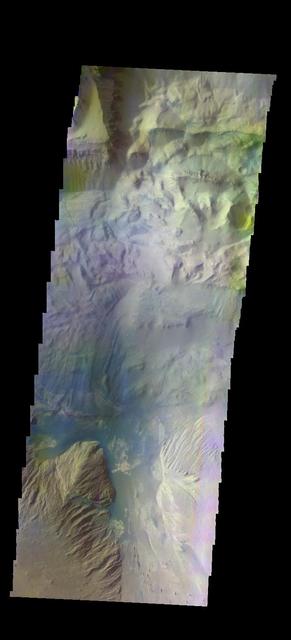
The THEMIS camera contains 5 filters. The data from different filters can be combined in multiple ways to create a false color image. This image from NASA 2001 Mars Odyssey spacecraft shows part of Ophir Chasma.
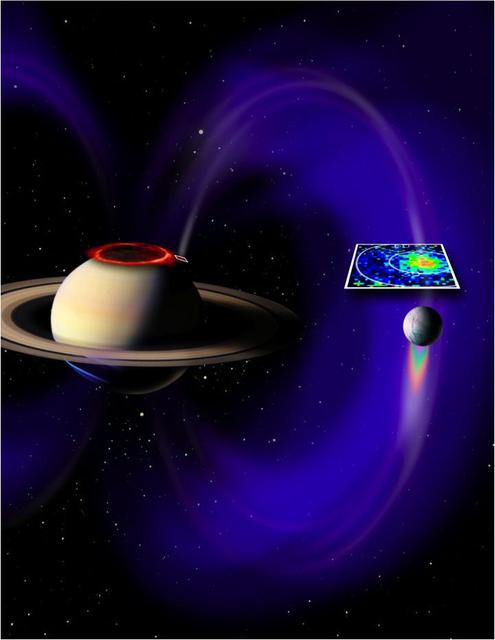
This artist concept based on data from NASA Cassini spacecraft, shows a glowing patch of ultraviolet light near Saturn north pole that occurs at the footprint of the magnetic connection between Saturn and its moon Enceladus.
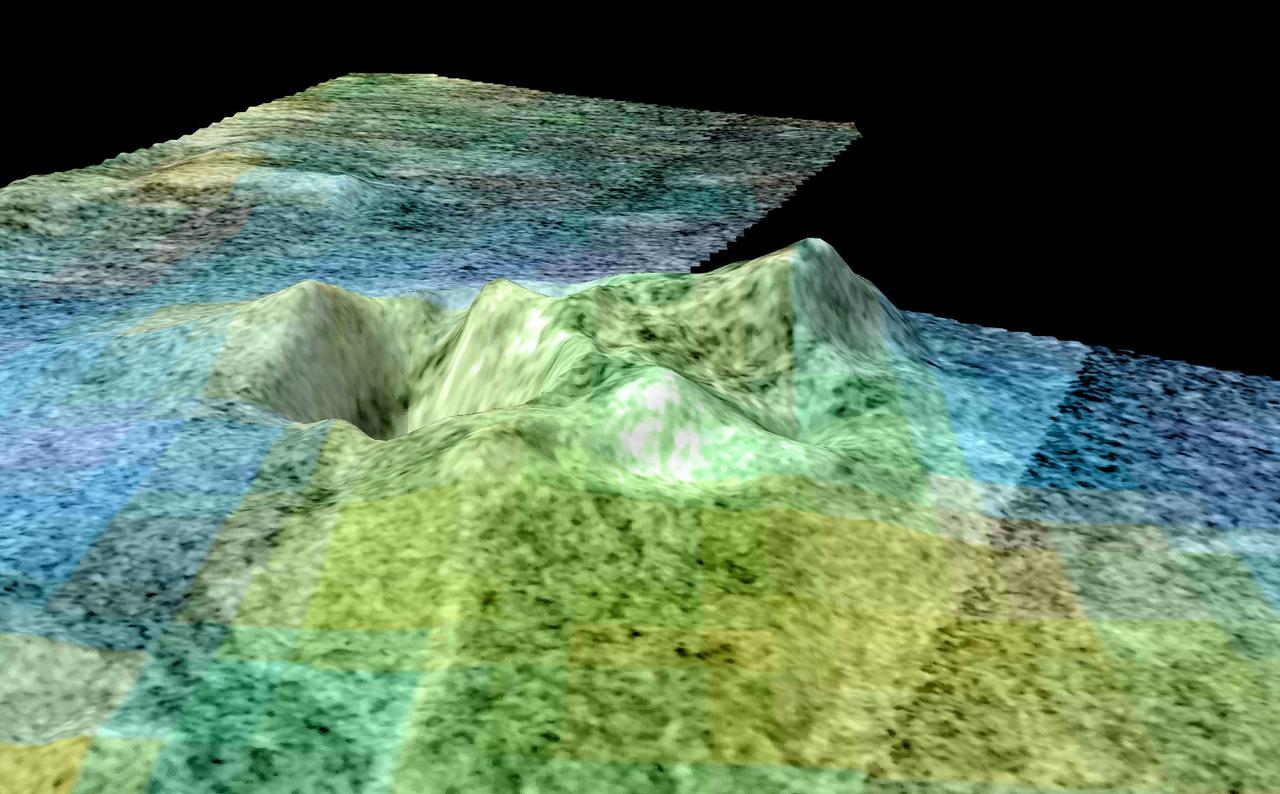
This frame from a movie is based on data from NASA Cassini spacecraft and shows a flyover of an area of Saturn moon Titan known as Sotra Facula. Scientists believe Sotra is the best case for an ice volcano, or cryovolcano, region on Titan.
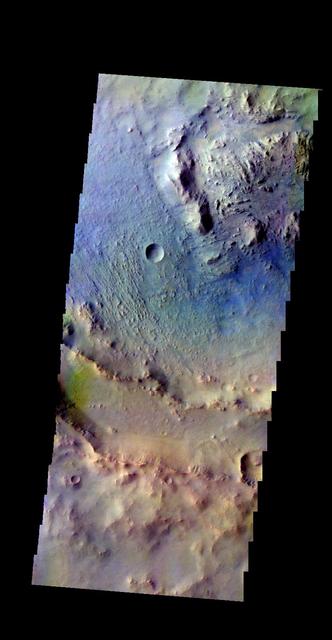
The THEMIS camera contains 5 filters. The data from different filters can be combined in multiple ways to create a false color image. This image from NASA 2001 Mars Odyssey spacecraft shows part of Martin Crater.
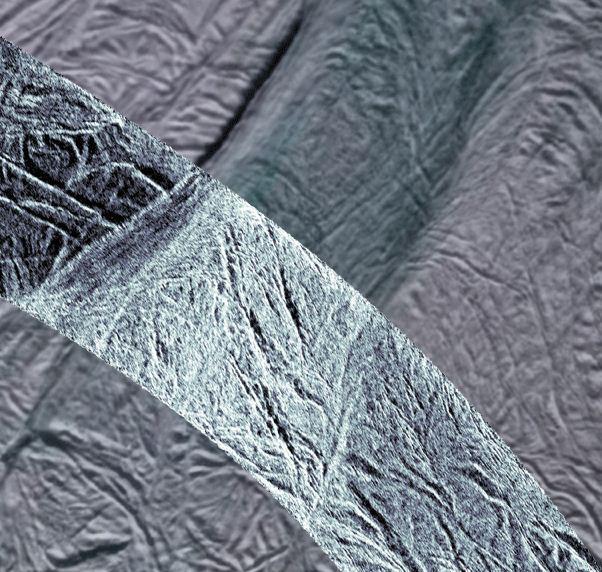
This image shows rough ice in the southern part of Saturn moon Enceladus. It was created using synthetic-aperture radar SAR data acquired by NASA Cassini spacecraft on Nov. 6, 2011.
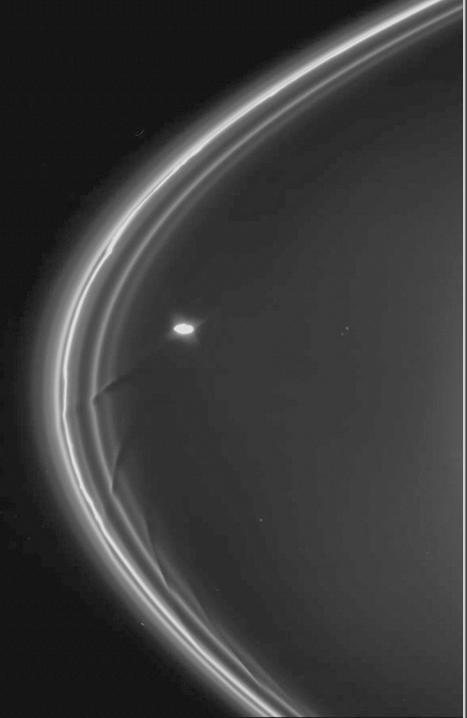
This image is from a simulation showing the changes to a portion of Saturn F ring as the shepherding moon Prometheus swings by it. The animation uses data obtained by the imaging cameras aboard NASA Cassini spacecraft.
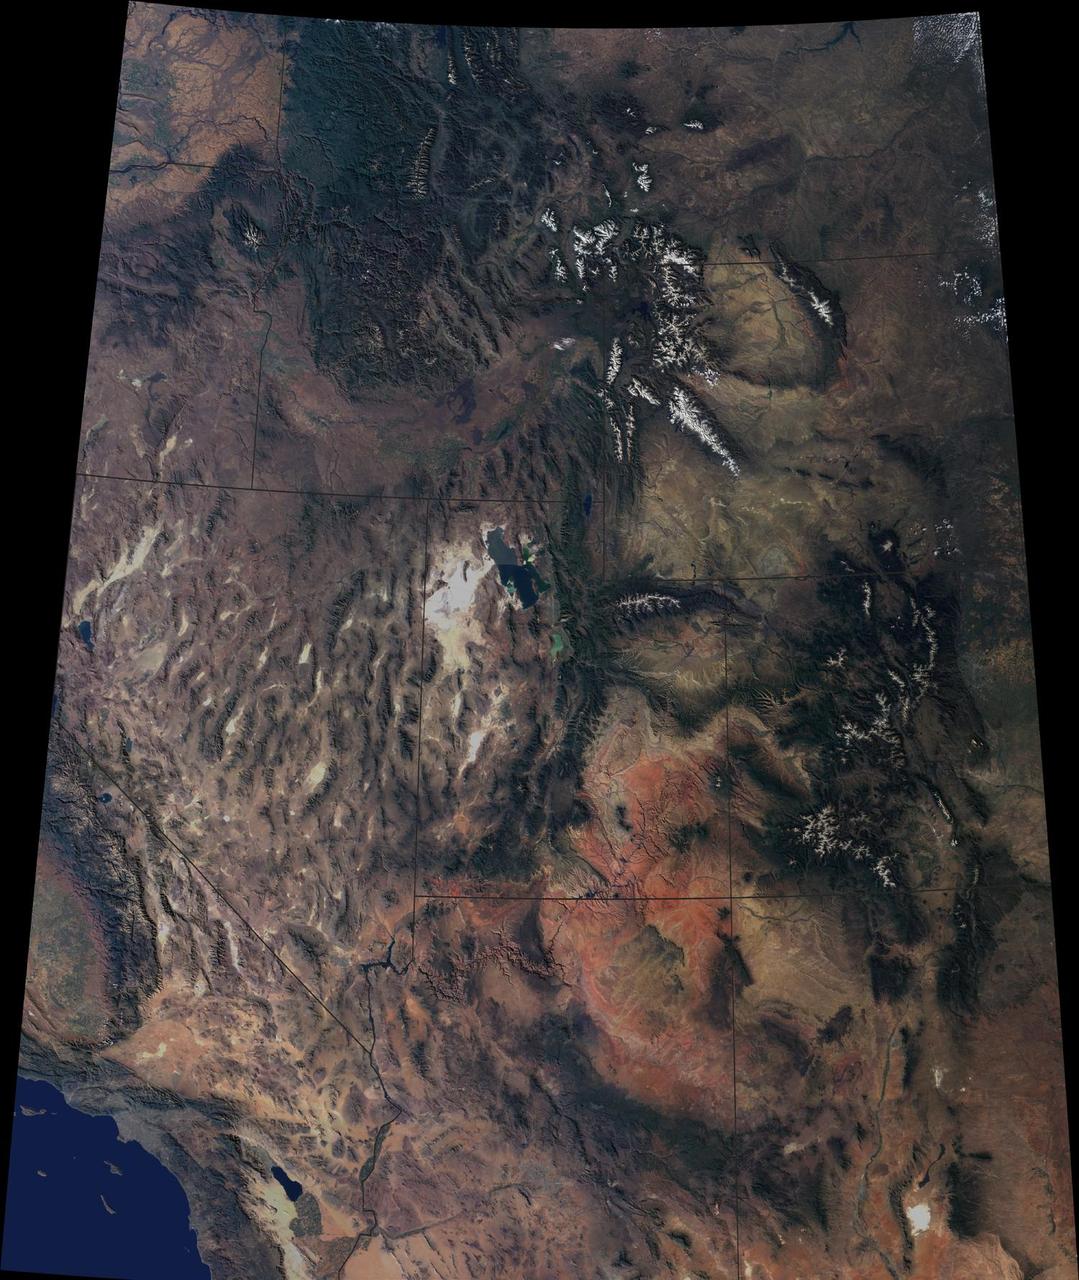
The breathtaking beauty of the western United States is apparent in this image from data acquired between April 2000 and September 2001 from the Multi-angle Imaging SpectroRadiometer on NASA Terra spacecraft.
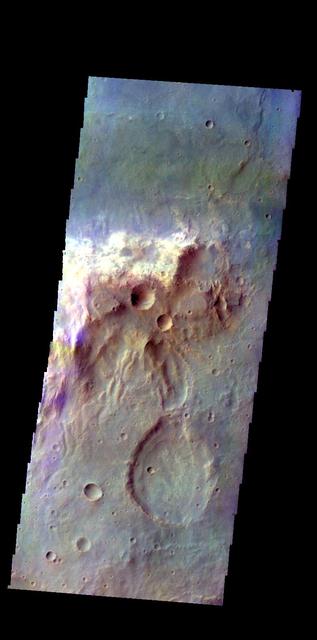
The THEMIS camera contains 5 filters. The data from different filters can be combined in multiple ways to create a false color image. This image from NASA 2001 Mars Odyssey spacecraft shows a hill in Tyrrhena Terra.
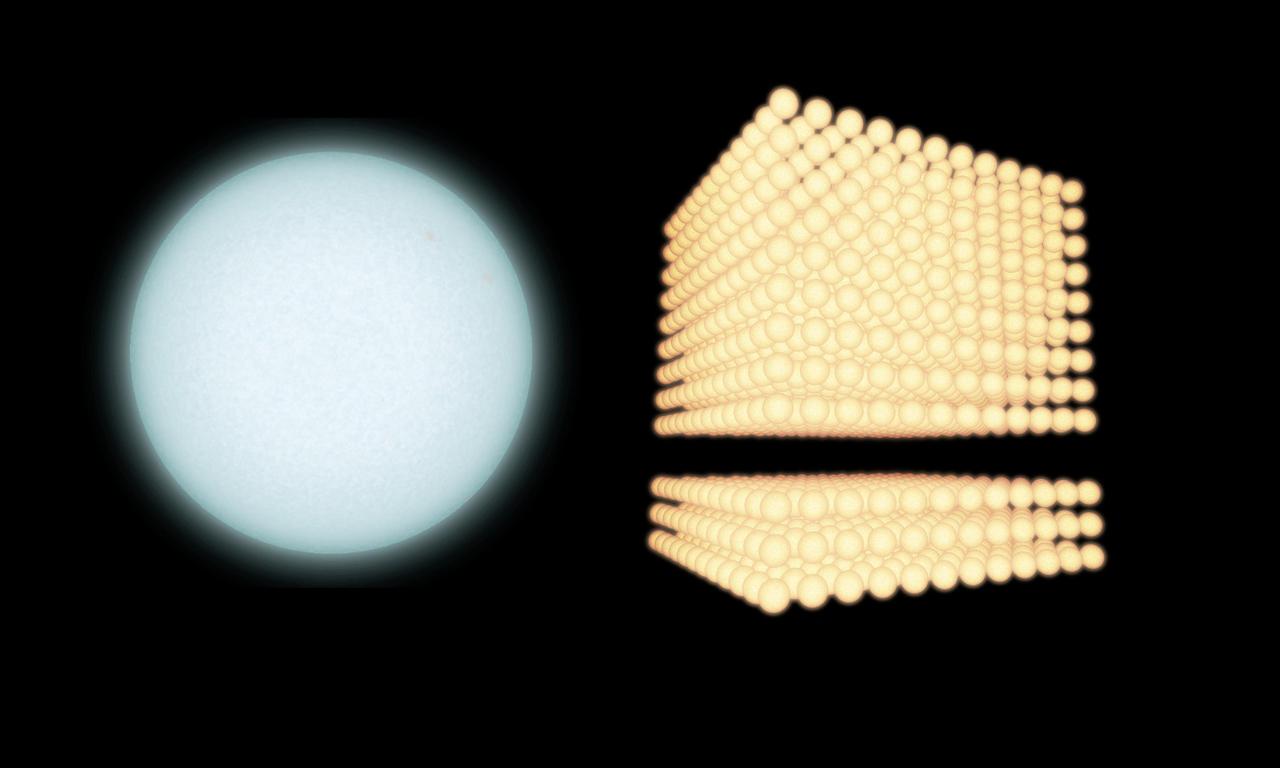
NASA Galaxy Evolution Explorer spacecraft and Cerro Tololo Inter-American Observatory combined data making this diagram illustratrating the extent to which astronomers have been underestimating the proportion of small to big stars in certain galaxies.
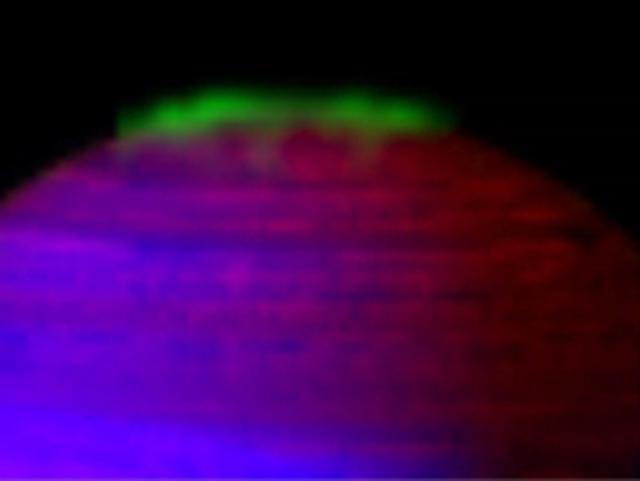
This frame from a movie, made from data obtained by NASA Cassini spacecraft, shows Saturn southern aurora shimmering over approximately 20 hours as the planet rotates. The video is available at the Photojournal.
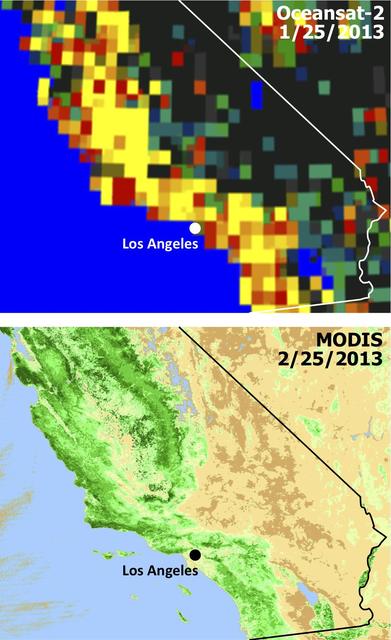
Extensive and persistent rains between Jan. 24 and Jan. 27, 2013, significantly increased soil moisture and enhanced vegetation growth in Southern California based on data from NASA Aqua spacecraft and ISRO Oceansat-2 satellite.
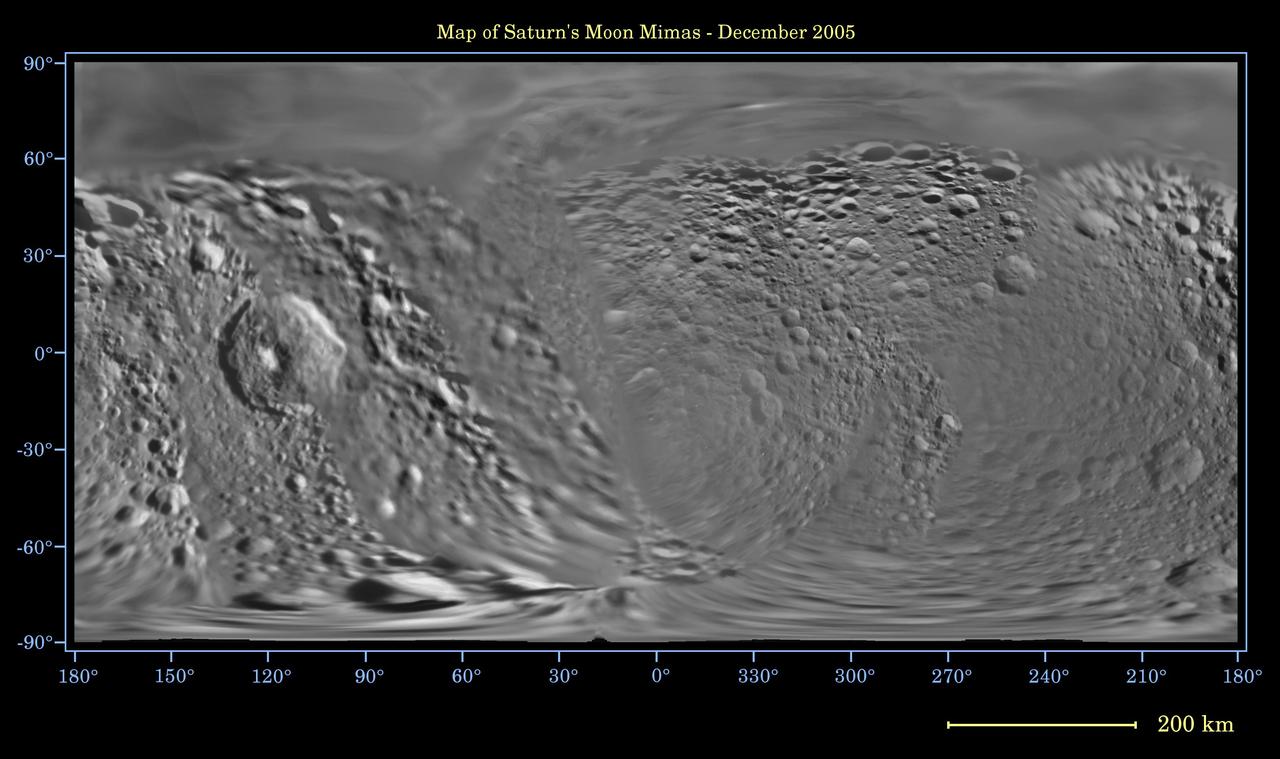
This global digital map of Saturn moon Mimas was created using data taken during Cassini and Voyager spacecraft flybys. The map is an equidistant projection and has a scale of 434 meters 1,424 feet per pixel
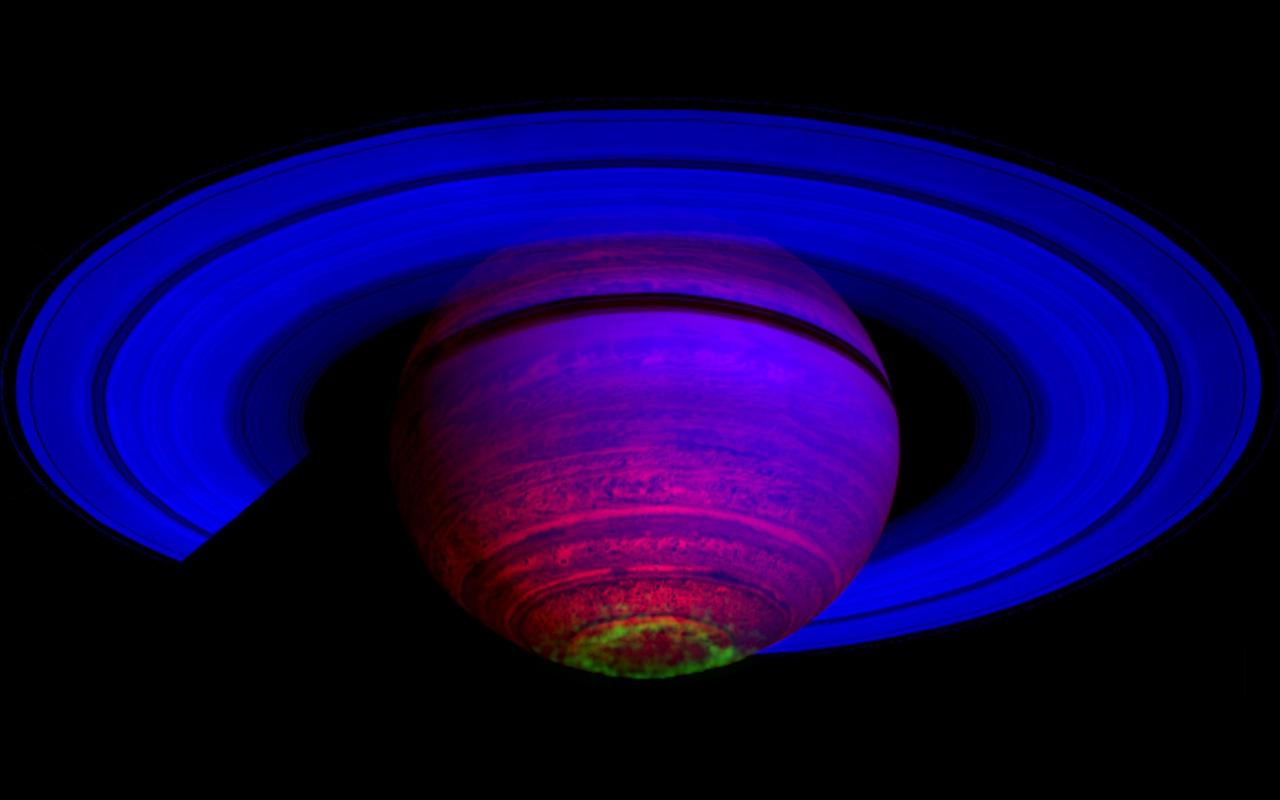
This false-color composite image, constructed from data obtained by NASA Cassini spacecraft, shows the glow of auroras streaking out about 1,000 kilometers 600 miles from the cloud tops of Saturn south polar region.
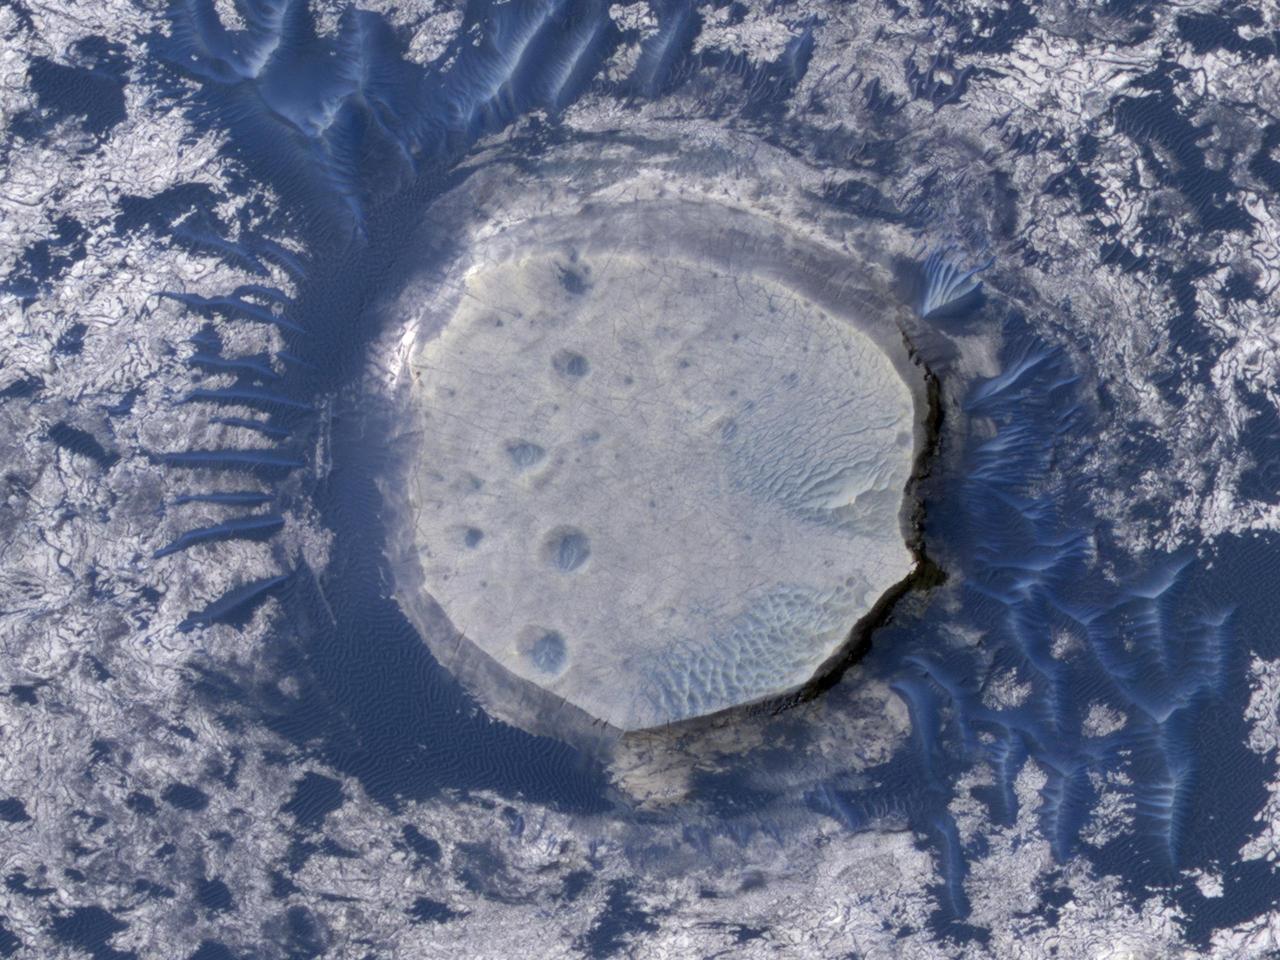
This view of an inverted crater in the Arabia Terra region of Mars is among the images taken by NASA Mars Reconnaissance Orbiter in early 2010 as the spacecraft approached the 100-terabit milestone in total data returned.
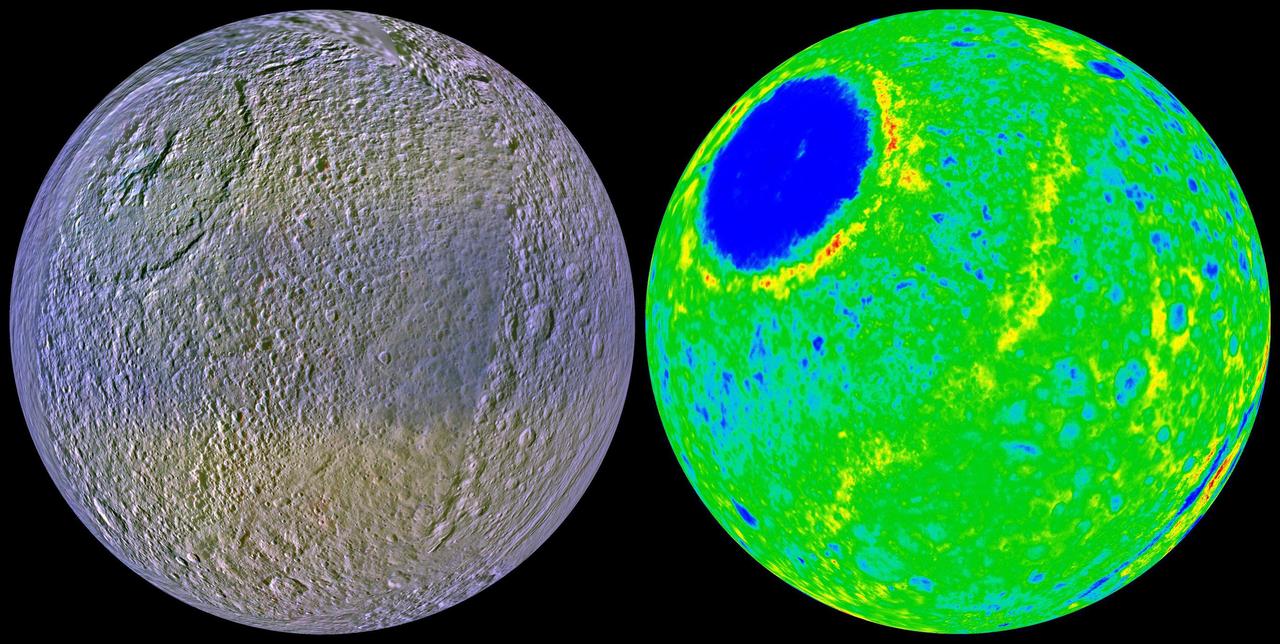
These two views of Tethys show the high-resolution color left and the topography right of the leading, or forward-facing, hemisphere of this ice-rich satellite. Data for these images is from NASA Cassini spacecraft.
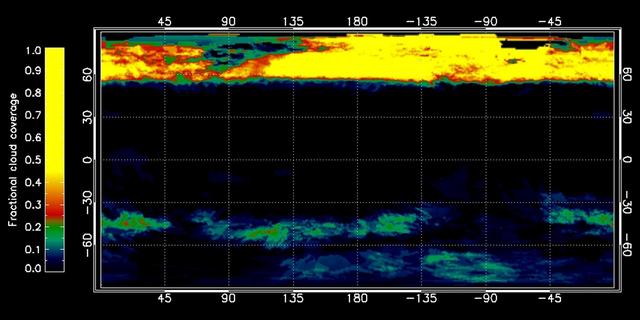
This graphic, constructed from data obtained by NASA Cassini spacecraft, shows the percentage of cloud coverage across the surface of Saturn moon Titan. The color scale from black to yellow signifies no cloud coverage to complete cloud coverage.
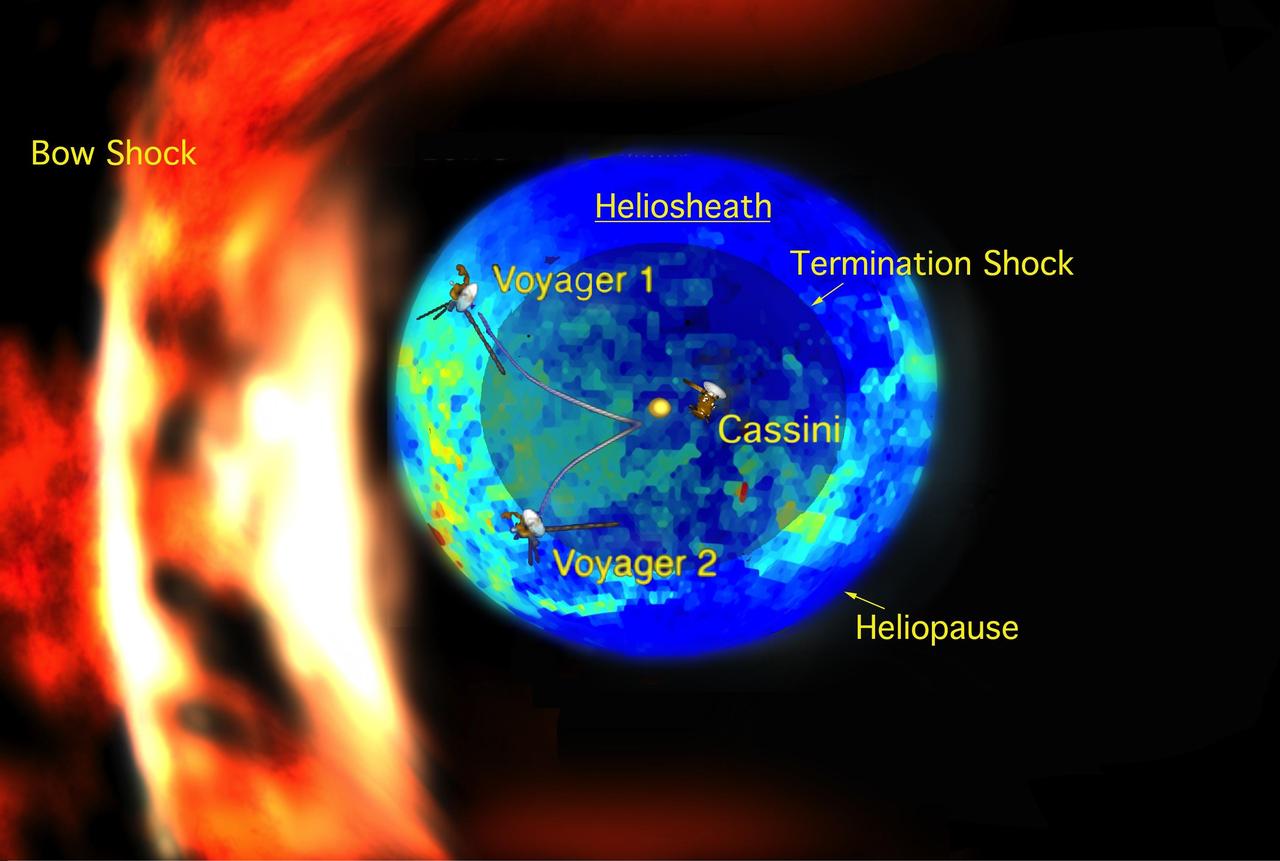
New data from NASA Cassini spacecraft suggest that the shape of our solar system moving through the local Milky Way galaxy looks like a bubble -- or a rat -- traveling through a boa constrictor belly.

This false-color mosaic, made from infrared data collected by NASA Cassini spacecraft, reveals the differences in the composition of surface materials around hydrocarbon lakes at Titan, Saturn largest moon.
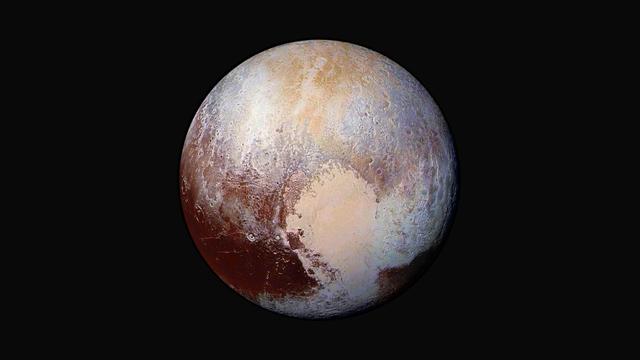
Four images from New Horizons Long Range Reconnaissance Imager LORRI were combined with color data from the spacecraft Ralph instrument to create this enhanced color global view of Pluto.