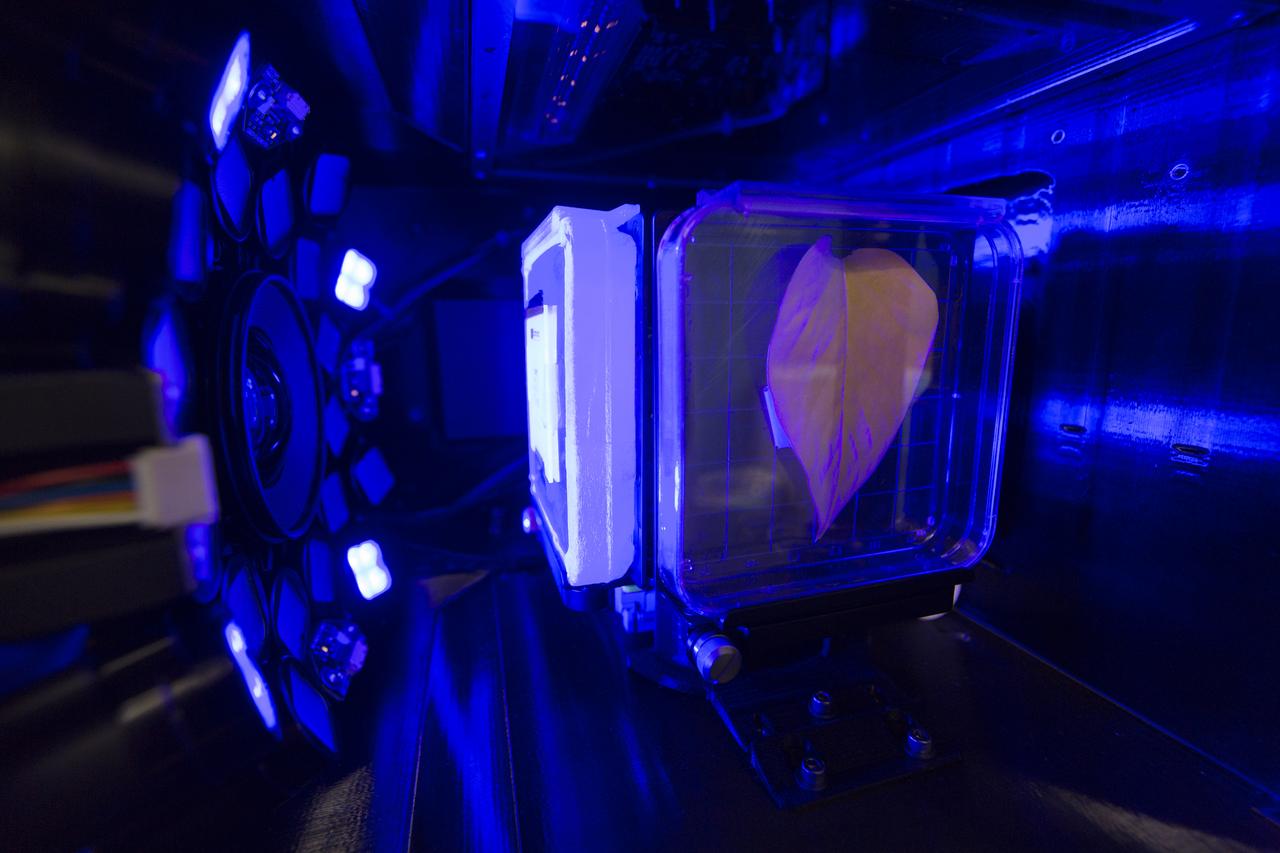
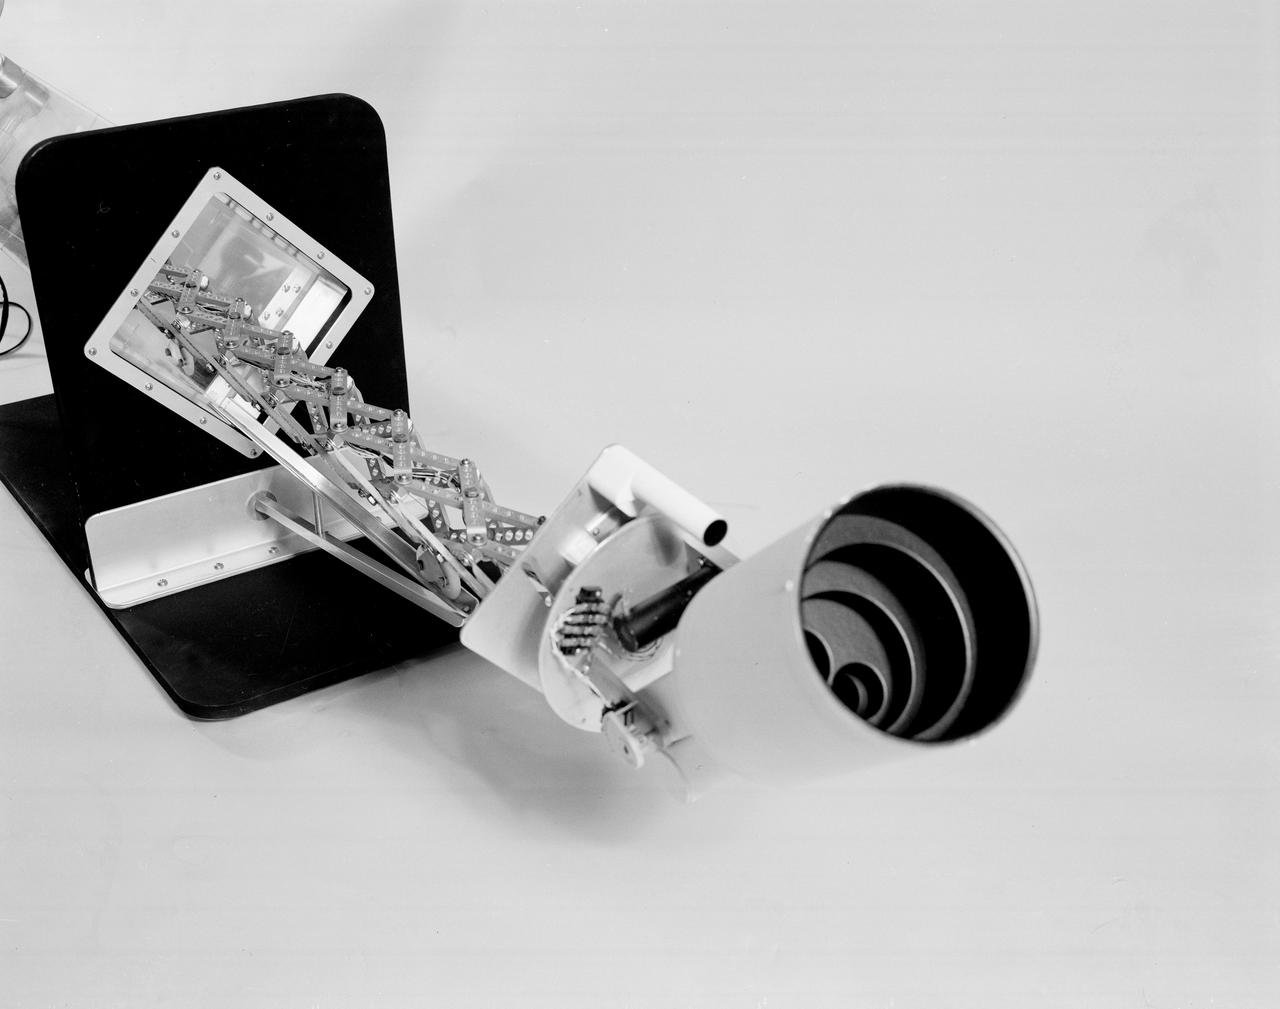
Inside the Spectrum prototype unit, organisms in a Petri plate are exposed to blue excitation lighting. The device works by exposing organisms to different colors of fluorescent light while a camera records what's happening with time-lapse photography. Results from the Spectrum project will shed light on which living things are best suited for long-duration flights into deep space.

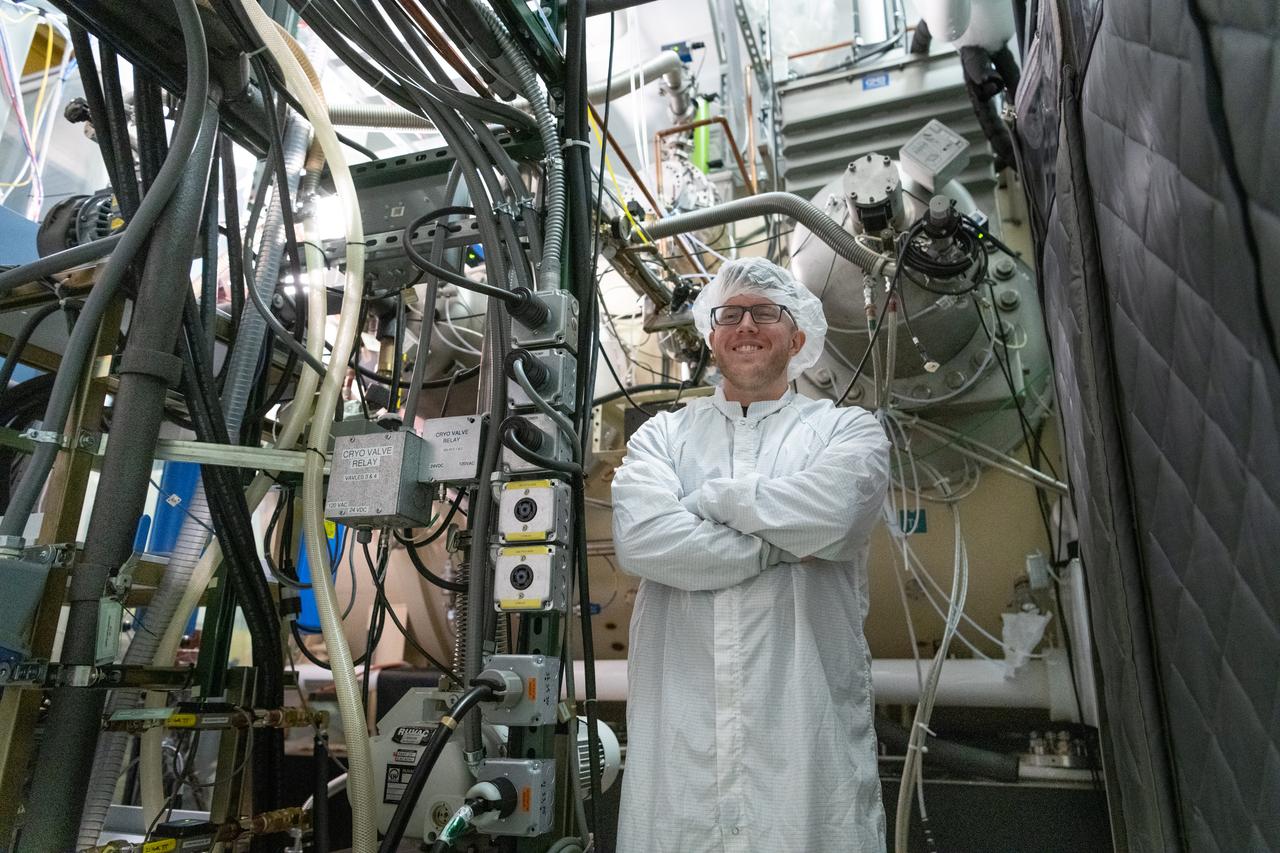
Dr. Scott Shipley of Ascentech Enterprises makes an adjustment to the Spectrum unit. He is the project engineer for the effort working under the Engineering Services Contract at NASA's Kennedy Space Center. The device is being built for use aboard the International Space Station and is designed to expose different organisms to different color of fluorescent light while a camera records what's happening with time-laps imagery. Results from the Spectrum project will shed light on which living things are best suited for long-duration flights into deep space.
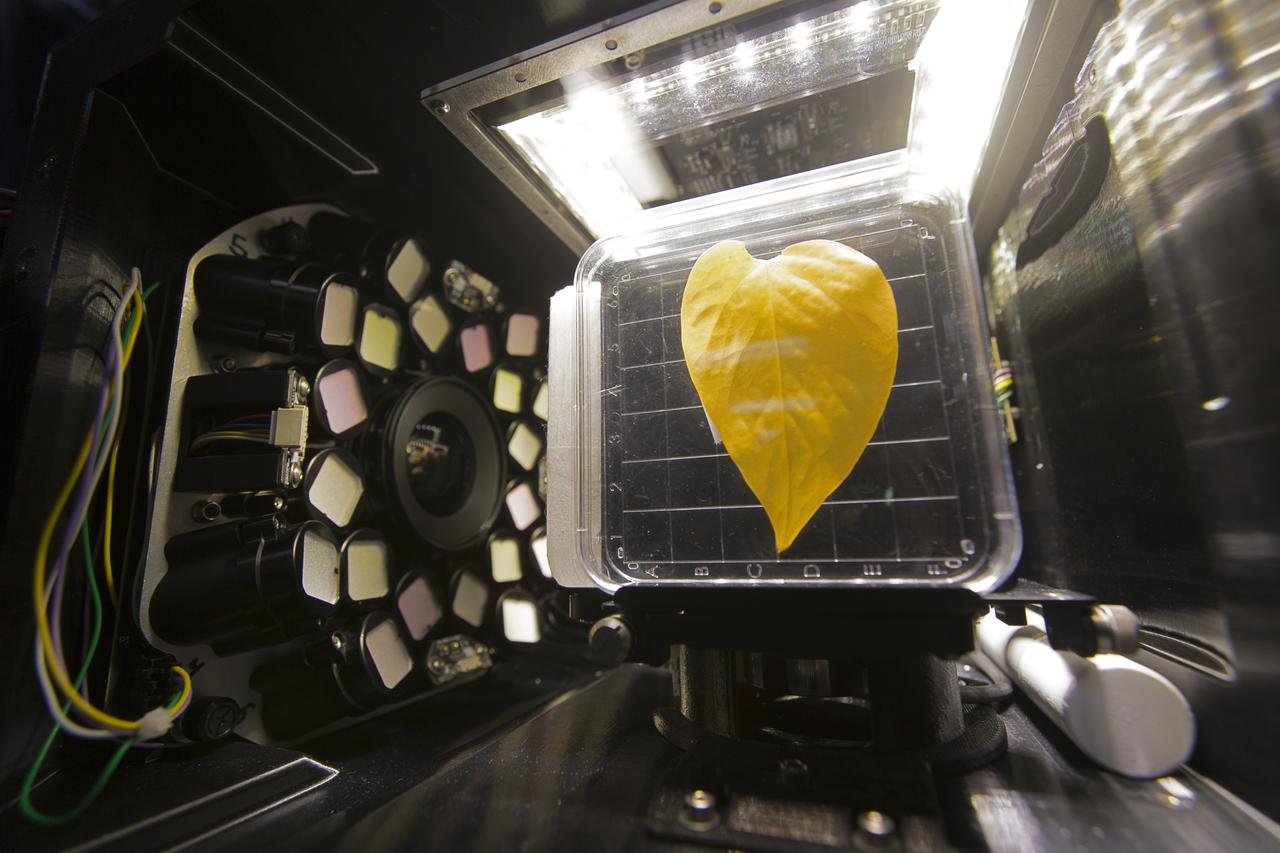
Inside the Spectrum prototype unit, organisms in a Petri plate are exposed to different colors of lighting. The device works by exposing organisms to different colors of fluorescent light while a camera records what's happening with time-lapse photography. Results from the Spectrum project will shed light on which living things are best suited for long-duration flights into deep space.

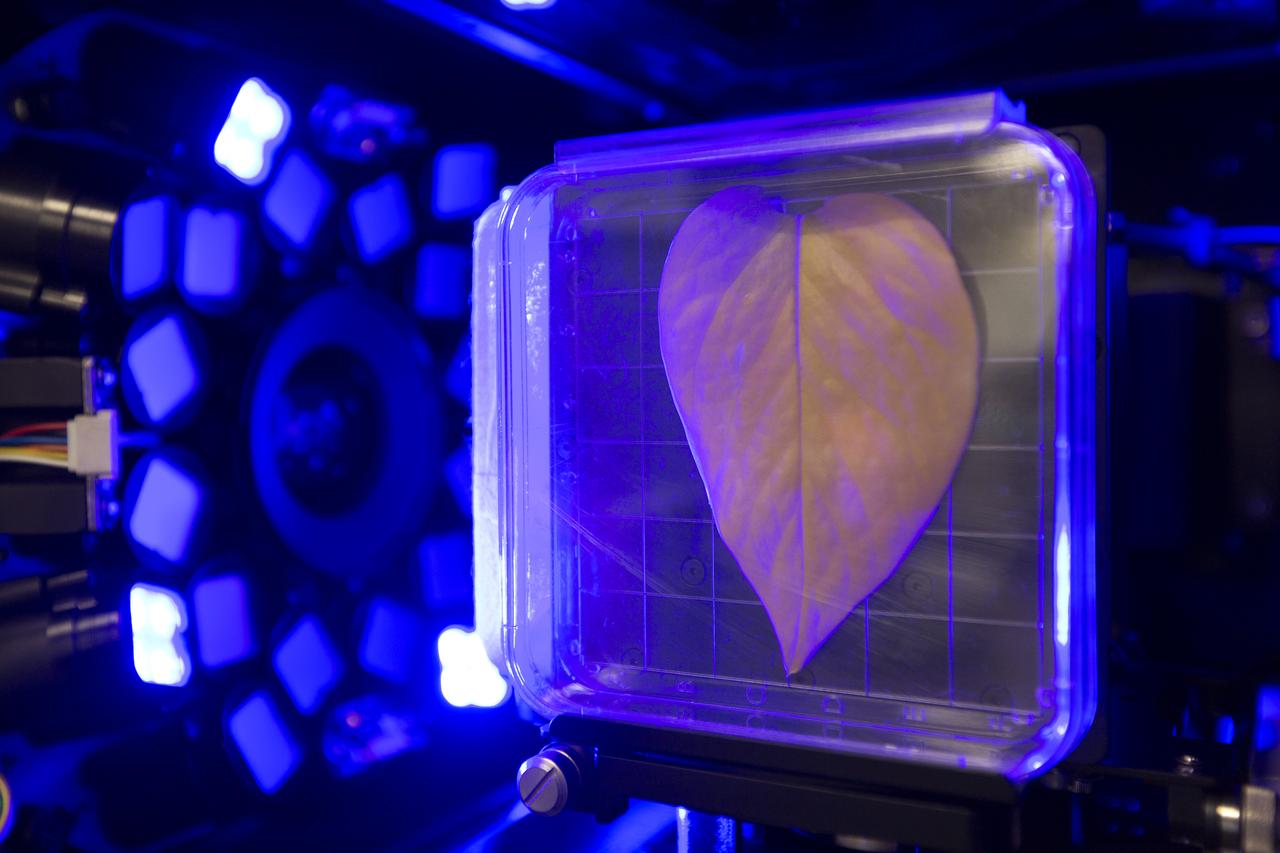
Inside the Spectrum prototype unit, organisms in a Petri plate are exposed to different colors of lighting. The device works by exposing organisms to different colors of fluorescent light while a camera records what's happening with time-lapse photography. Results from the Spectrum project will shed light on which living things are best suited for long-duration flights into deep space.
Inside the Spectrum prototype unit, organisms in a Petri plate are exposed to blue excitation lighting. The device works by exposing organisms to different colors of fluorescent light while a camera records what's happening with time-lapse photography. Results from the Spectrum project will shed light on which living things are best suited for long-duration flights into deep space.
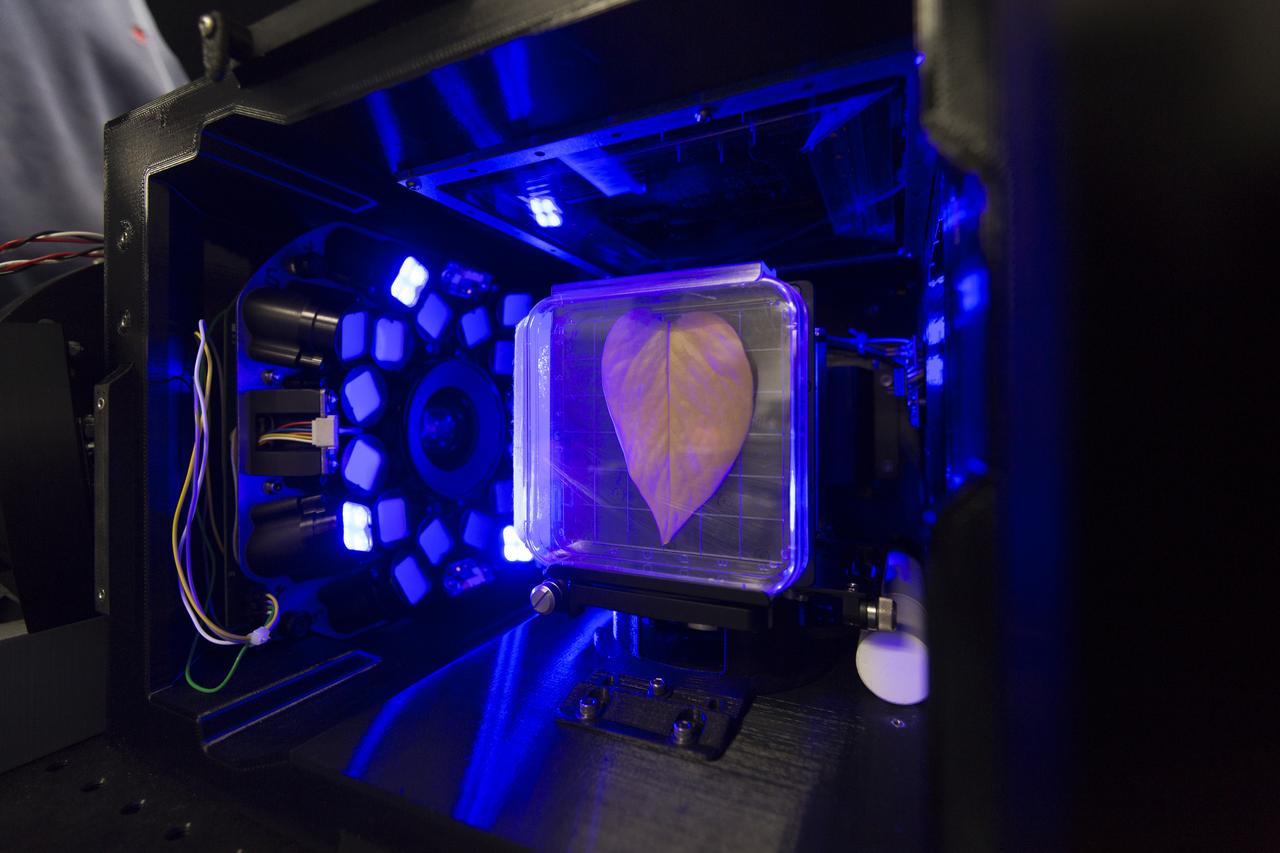
Inside the Spectrum prototype unit, organisms in a Petri plate are exposed to blue excitation lighting. The device works by exposing organisms to different colors of fluorescent light while a camera records what's happening with time-lapse photography. Results from the Spectrum project will shed light on which living things are best suited for long-duration flights into deep space.
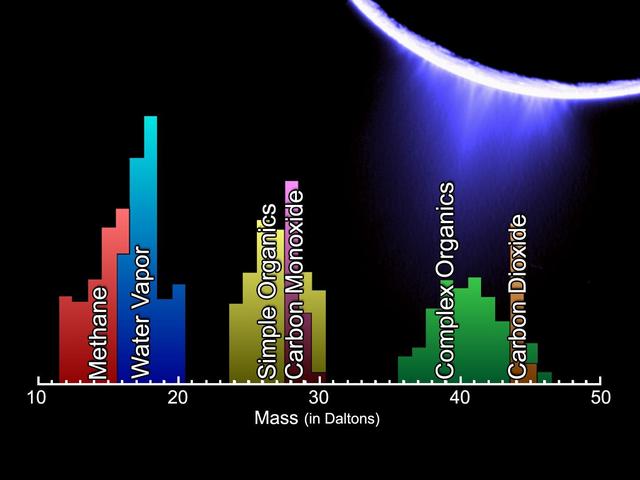
Enceladus Plume Neutral Mass Spectrum
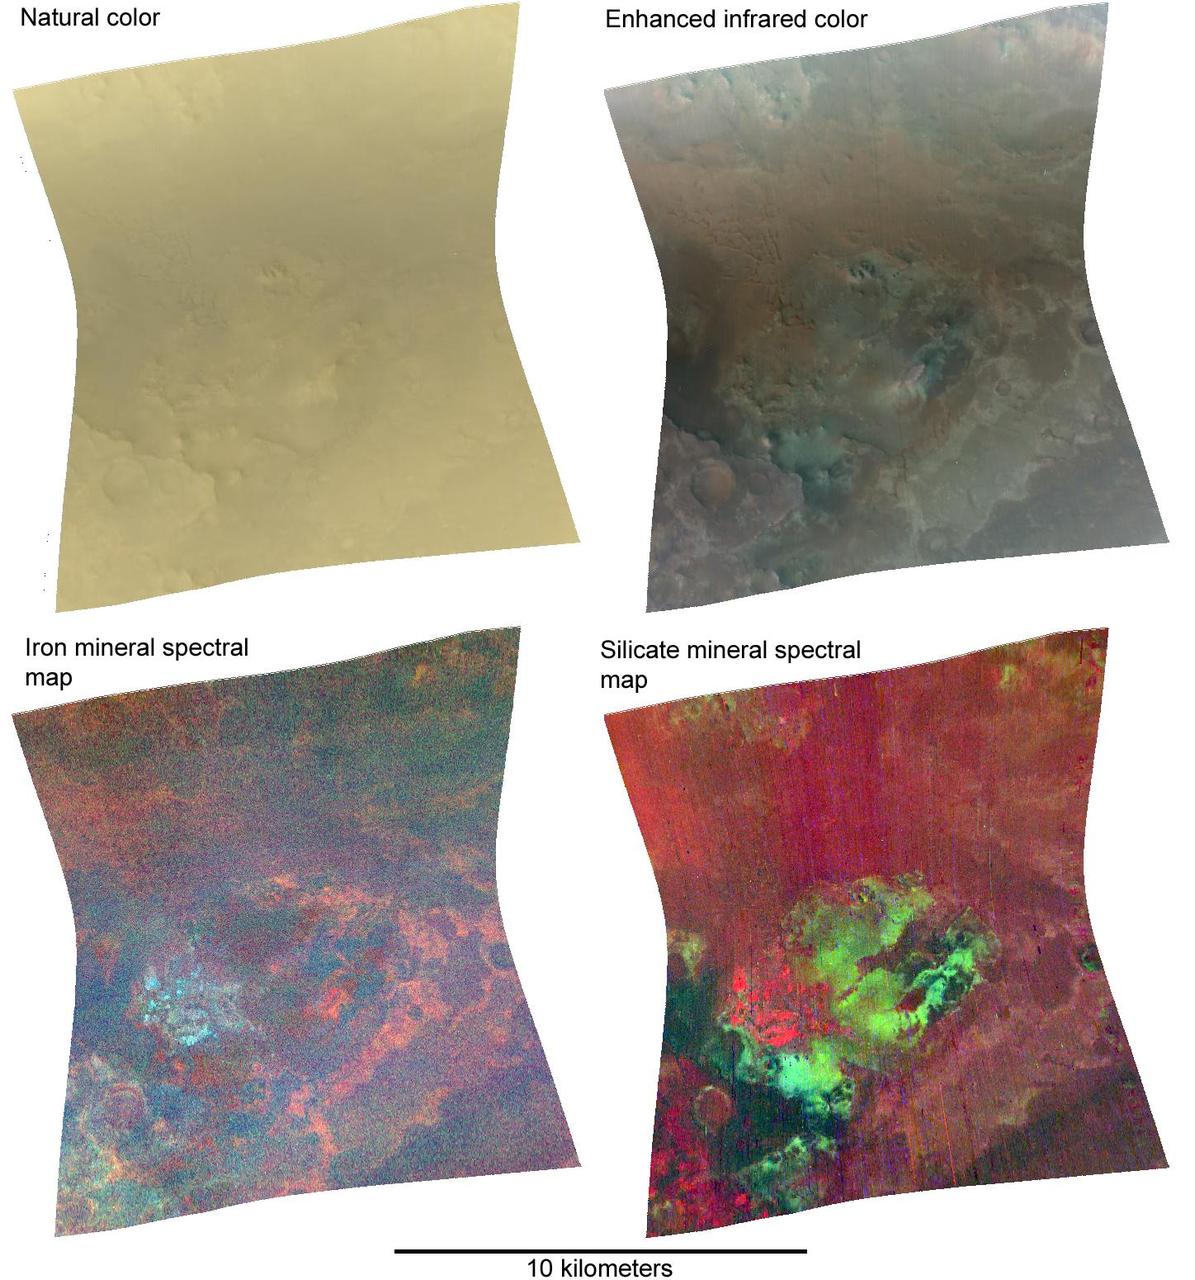
Nili Fossae in Natural Color and Across the Spectrum
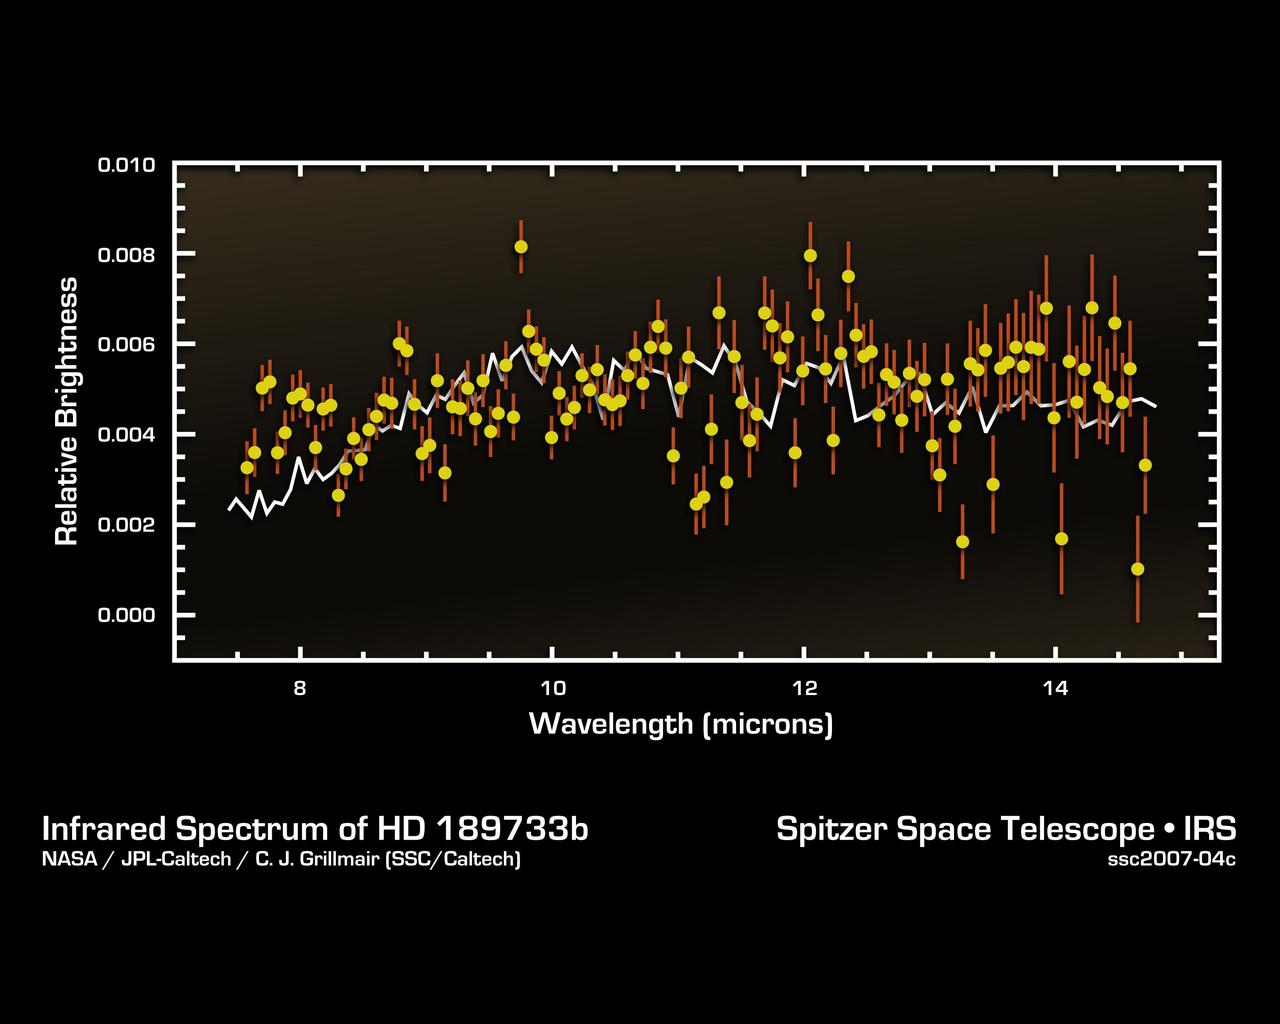
This infrared data from NASA's Spitzer Space Telescope -- called a spectrum -- tells astronomers that a distant gas planet, a so-called "hot Jupiter" called HD 189733b, might be smothered with high clouds. It is one of the first spectra of an alien world. A spectrum is created when an instrument called a spectrograph cracks light from an object open into a rainbow of different wavelengths. Patterns or ripples within the spectrum indicate the presence, or absence, of molecules making up the object. Astronomers using Spitzer's spectrograph were able to obtain infrared spectra for two so-called "transiting" hot-Jupiter planets using the "secondary eclipse" technique. In this method, the spectrograph first collects the combined infrared light from the planet plus its star, then, as the planet is eclipsed by the star, the infrared light of just the star. Subtracting the latter from the former reveals the planet's own rainbow of infrared colors. Astronomers were perplexed when they first saw the infrared spectrum above. It doesn't look anything like what theorists had predicted. Theorists thought the spectra of hot, Jupiter-like planets like this one would be filled with the signatures of molecules in the planets' atmospheres. But the spectrum doesn't show any molecules, and is instead what astronomers call "flat." For example, theorists thought there'd be a strong signature of water in the form of a big drop in the wavelength range between 7 and 10 microns. The fact that water is not detected may indicate that it is hidden underneath a thick blanket of high, dry clouds. The average brightness of the spectrum is also a bit lower than theoretical predictions, suggesting that very high winds are rapidly moving the terrific heat of the noonday sun from the day side of HD 189733b to the night side. This spectrum was produced by Dr. Carl Grillmair of NASA's Spitzer Science Center at the California Institute of Technology in Pasadena, Calif., and his colleagues. The data were taken by Spitzer's infrared spectrograph on November 22, 2006. http://photojournal.jpl.nasa.gov/catalog/PIA09199
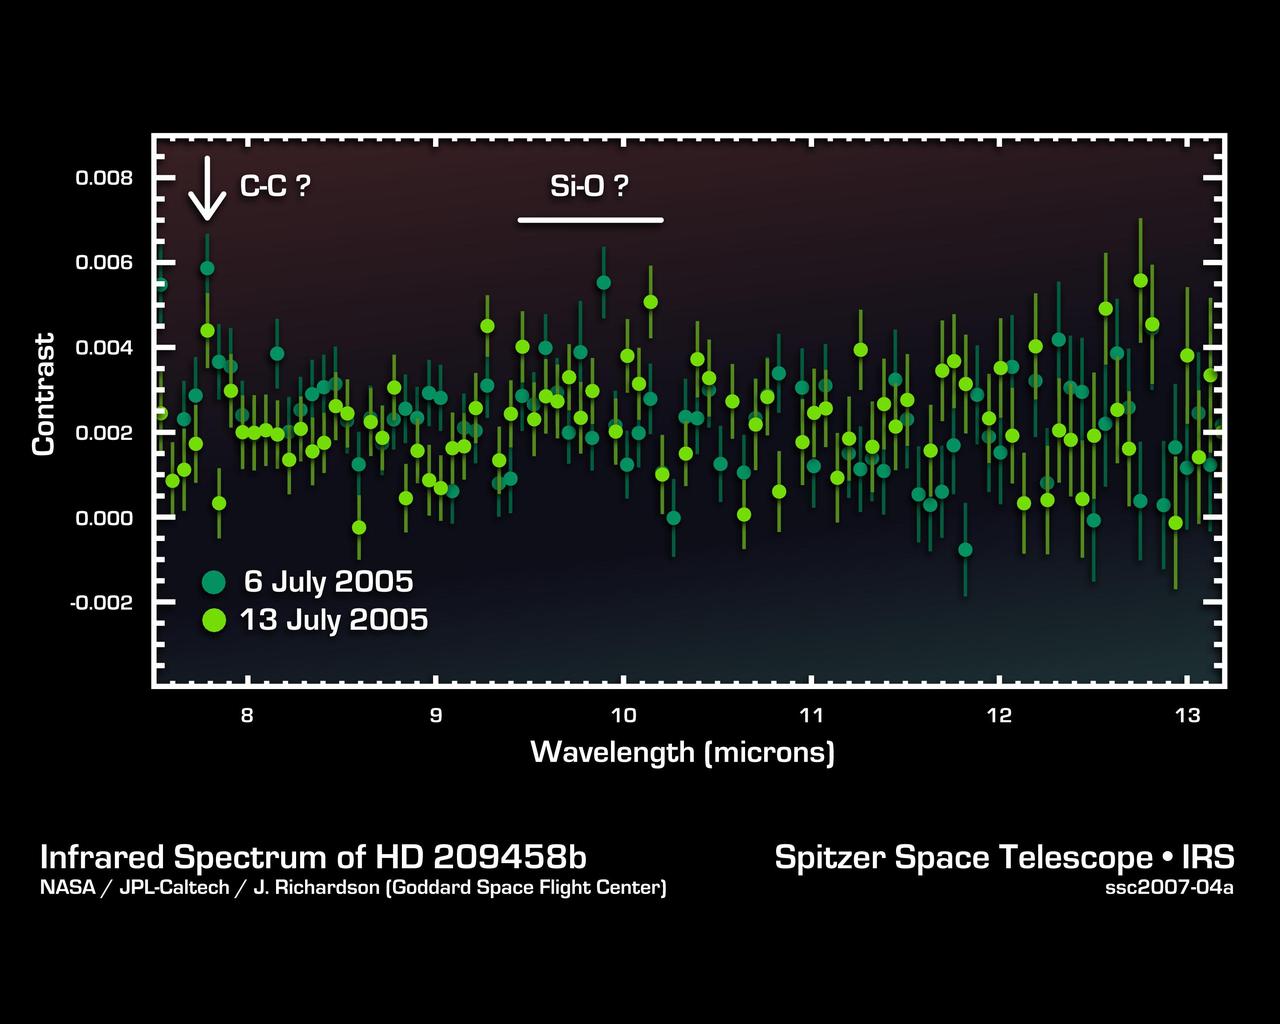
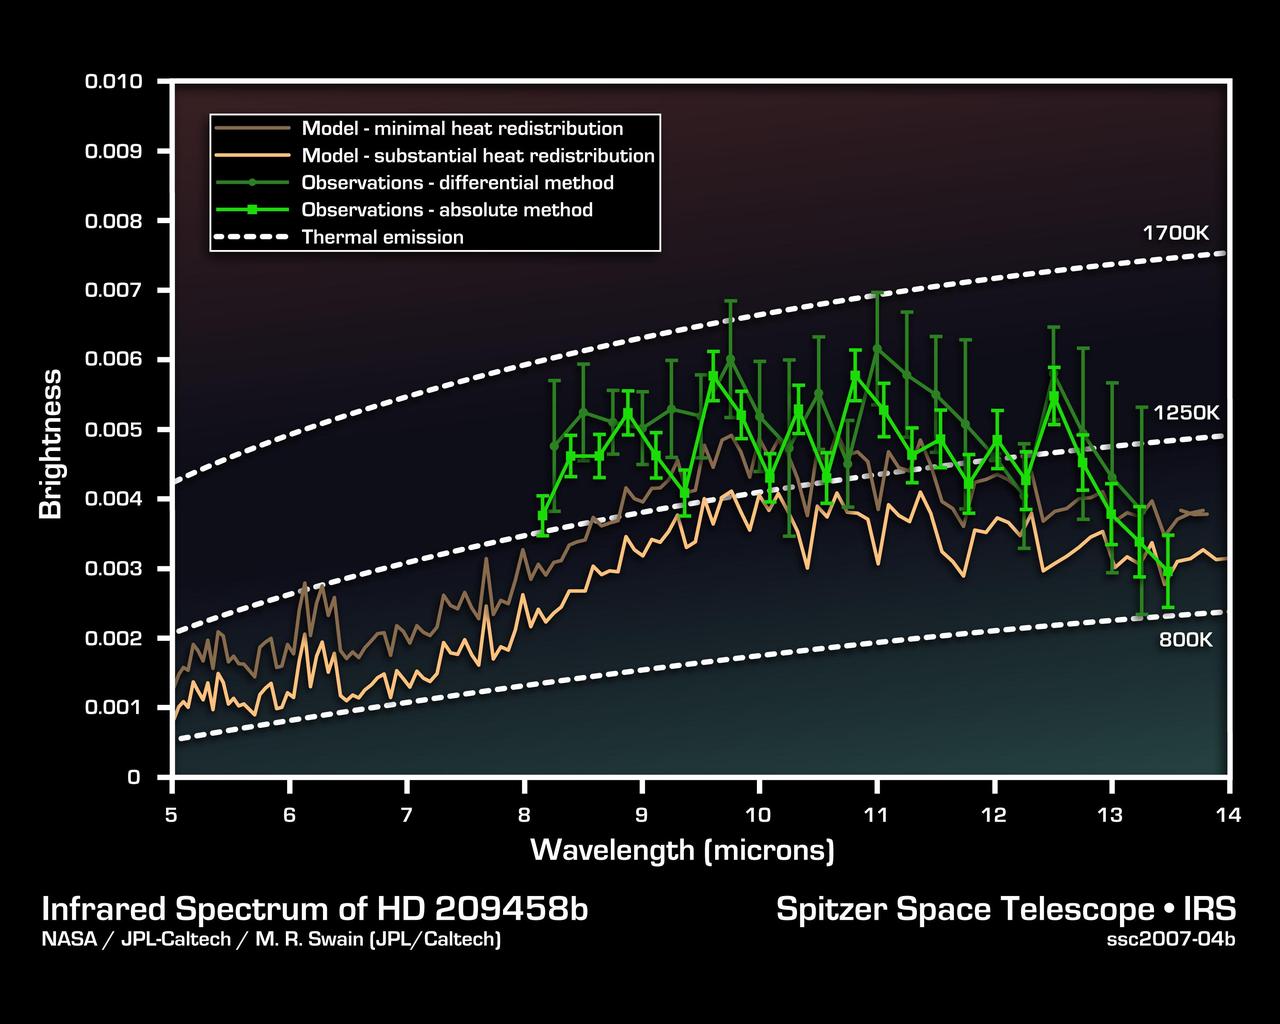
This infrared data from NASA's Spitzer Space Telescope -- called a spectrum -- tells astronomers that a distant gas planet, a so-called "hot Jupiter" called HD 209458b, might be smothered with high clouds. It is one of the first spectra of an alien world. A spectrum is created when an instrument called a spectrograph cracks light from an object open into a rainbow of different wavelengths. Patterns or ripples within the spectrum indicate the presence, or absence, of molecules making up the object. Astronomers using Spitzer's spectrograph were able to obtain infrared spectra for two so-called "transiting" hot-Jupiter planets using the "secondary eclipse" technique. In this method, the spectrograph first collects the combined infrared light from the planet plus its star, then, as the planet is eclipsed by the star, the infrared light of just the star. Subtracting the latter from the former reveals the planet's own rainbow of infrared colors. When astronomers first saw the infrared spectrum above, they were shocked. It doesn't look anything like what theorists had predicted. For example, theorists thought there'd be signatures of water in the wavelength ranges of 8 to 9 microns. The fact that water is not detected might indicate that it is hidden under a thick blanket of high, dry clouds. In addition, the spectrum shows signs of silicate dust -- tiny grains of sand -- in the wavelength range of 9 to 10 microns. This suggests that the planet's skies could be filled with high clouds of dust unlike anything seen in our own solar system. There is also an unidentified molecular signature at 7.78 microns. Future observations using Spitzer's spectrograph should be able to determine the nature of the mysterious feature. This spectrum was produced by Dr. Jeremy Richardson of NASA's Goddard Space Flight Center, Greenbelt, Md. and his colleagues. The data were taken by Spitzer's infrared spectrograph on July 6 and 13, 2005. http://photojournal.jpl.nasa.gov/catalog/PIA09197
This infrared data from NASA's Spitzer Space Telescope -- called a spectrum -- tells astronomers that a distant gas planet, a so-called "hot Jupiter" called HD 209458b, might be smothered with high clouds. It is one of the first spectra of an alien world. A spectrum is created when an instrument called a spectrograph cracks light from an object open into a rainbow of different wavelengths. Patterns or ripples within the spectrum indicate the presence, or absence, of molecules making up the object. Astronomers using Spitzer's spectrograph were able to obtain infrared spectra for two so-called "transiting" hot-Jupiter planets using the "secondary eclipse" technique. In this method, the spectrograph first collects the combined infrared light from the planet plus its star, then, as the planet is eclipsed by the star, the infrared light of just the star. Subtracting the latter from the former reveals the planet's own rainbow of infrared colors. When astronomers first saw the infrared spectrum above, they were shocked. It doesn't look anything like what theorists had predicted. For example, theorists thought there'd be signatures of water in the wavelength ranges of 8 to 9 microns. The fact that water is not detected might indicate that it is hidden under a thick blanket of high, dry clouds. In addition, the spectrum shows signs of silicate dust -- tiny grains of sand -- in the wavelength range of 9 to 10 microns. This suggests that the planet's skies could be filled with high clouds of dust unlike anything seen in our own solar system. There is also an unidentified molecular signature at 7.78 microns. Future observations using Spitzer's spectrograph should be able to determine the nature of the mysterious feature. This spectrum was produced by Dr. Jeremy Richardson of NASA's Goddard Space Flight Center, Greenbelt, Md. and his colleagues. The data were taken by Spitzer's infrared spectrograph on July 6 and 13, 2005. http://photojournal.jpl.nasa.gov/catalog/PIA09198
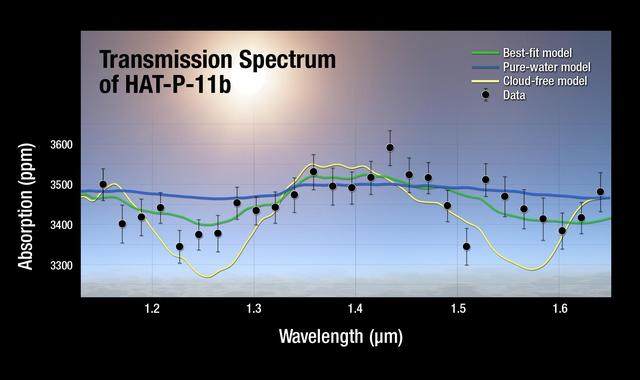
A plot of the transmission spectrum for exoplanet HAT-P-11b, with data from NASA Kepler, Hubble and Spitzer observatories combined. The results show a robust detection of water absorption in the Hubble data.
This graph shows a spectrum recorded by the Chemistry and Camera instrument ChemCam in NASA Curiosity Mars rover; it is is typical of Martian volcanic basalt material.
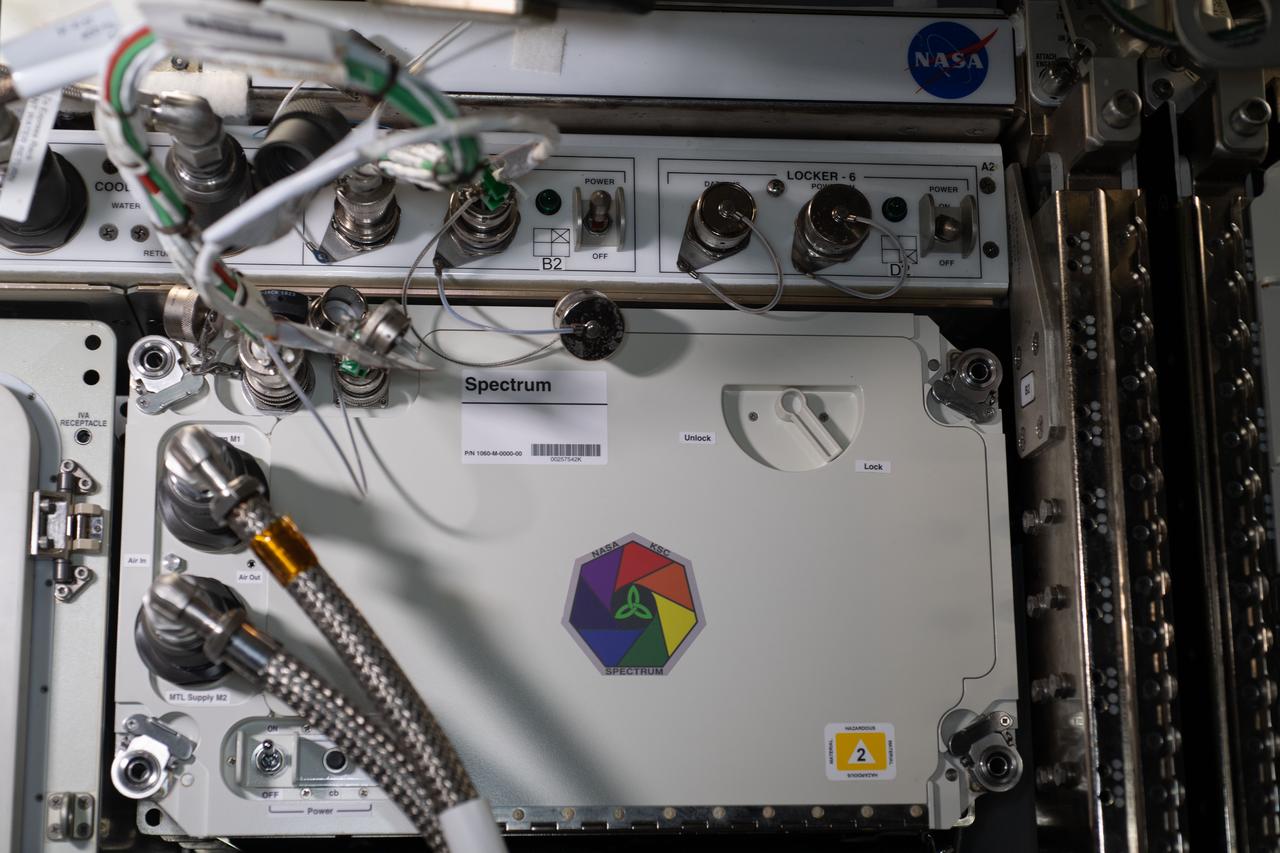
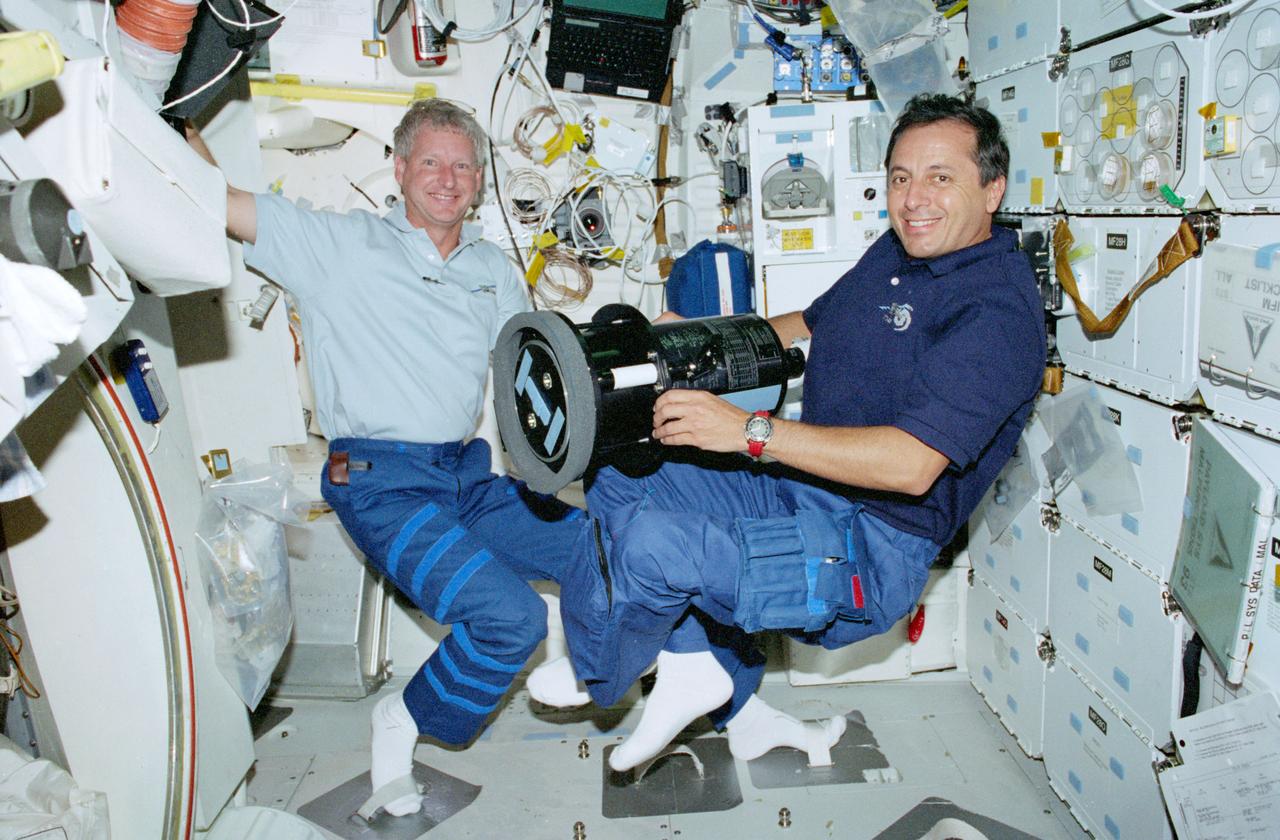
iss063e026090 (6/11/2020) --- A view during the Spectrum Facility installation into Expedite the Processing of Experiments to the Space Station (EXPRESS) Rack aboard the International space Station (ISS). Spectrum takes fluorescent images of biological specimens contained within a controlled environment. A high resolution, monochrome camera captures images of fluoresced proteins of plants within Petri plates.
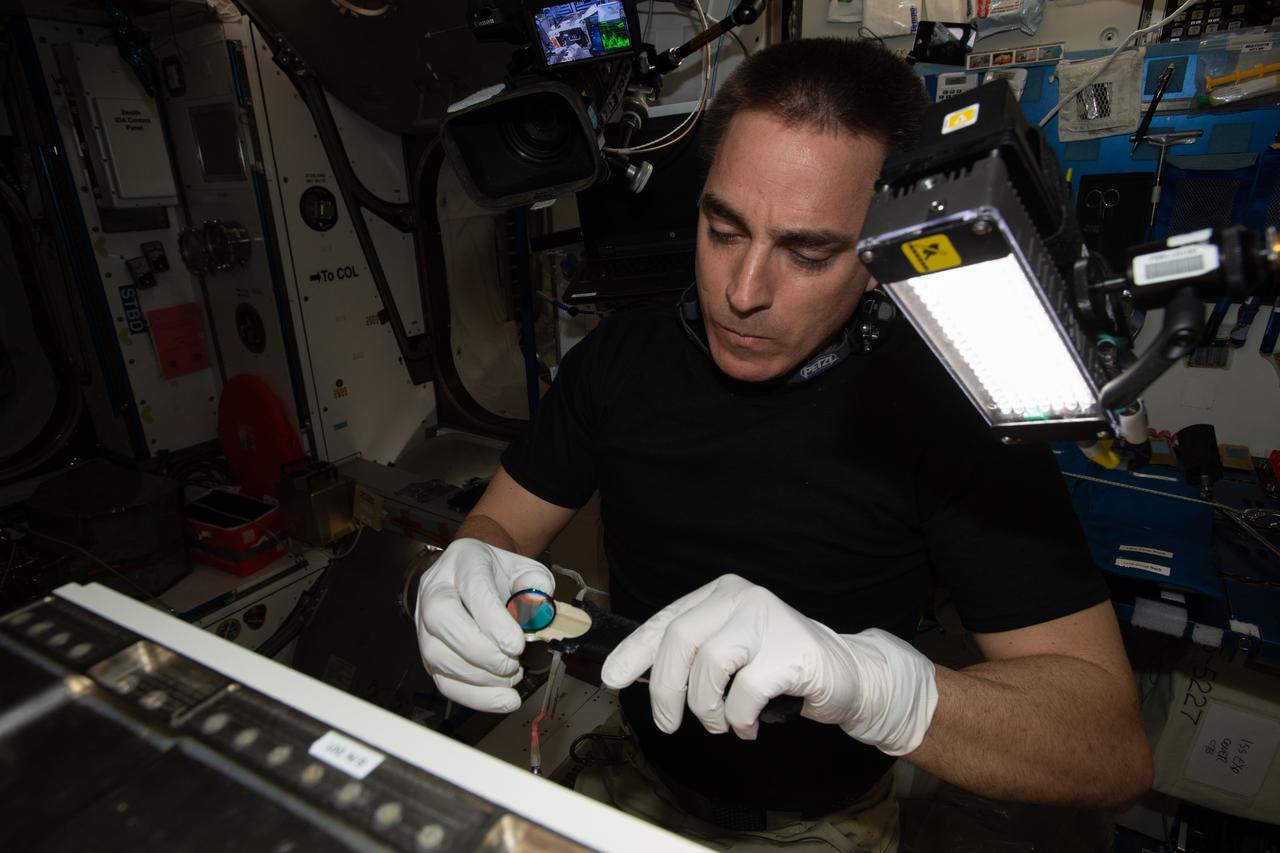
iss063e026156 (6/11/2020) --- A view of NASA Astronaut Chris Cassidy during the Spectrum Experiment hardware setup aboard the International Space Station (ISS). Spectrum takes fluorescent images of biological specimens contained within a controlled environment. A high resolution, monochrome camera captures images of fluoresced proteins of plants within Petri plates.
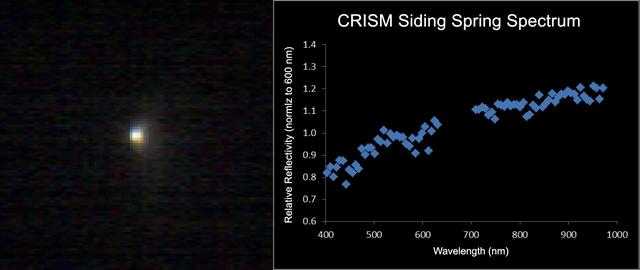
The Compact Reconnaissance Imaging Spectrometer for Mars CRISM aboard NASA Mars Reconnaissance Orbiter obtained this spectrum for comet C/2013 A1 Siding Spring during the comet close approach to Mars.

A transmission spectrum made from a single observation using Webb’s Near-Infrared Imager and Slitless Spectrograph (NIRISS) reveals atmospheric characteristics of the hot gas giant exoplanet WASP-96 b. A transmission spectrum is made by comparing starlight filtered through a planet’s atmosphere as it moves across the star, to the unfiltered starlight detected when the planet is beside the star. Each of the 141 data points (white circles) on this graph represents the amount of a specific wavelength of light that is blocked by the planet and absorbed by its atmosphere. In this observation, the wavelengths detected by NIRISS range from 0.6 microns (red) to 2.8 microns (in the near-infrared). The amount of starlight blocked ranges from about 13,600 parts per million (1.36 percent) to 14,700 parts per million (1.47 percent). Researchers are able to detect and measure the abundances of key gases in a planet’s atmosphere based on the absorption pattern – the locations and heights of peaks on the graph: each gas has a characteristic set of wavelengths that it absorbs. The temperature of the atmosphere can be calculated based in part on the height of the peaks: a hotter planet has taller peaks. Other characteristics, like the presence of haze and clouds, can be inferred based on the overall shape of different portions of the spectrum. The gray lines extending above and below each data point are error bars that show the uncertainty of each measurement, or the reasonable range of actual possible values. For a single observation, the error on these measurements is remarkably small. The blue line is a best-fit model that takes into account the data, the known properties of WASP-96 b and its star (e.g., size, mass, temperature), and assumed characteristics of the atmosphere. Researchers can vary the parameters in the model – changing unknown characteristics like cloud height in the atmosphere and abundances of various gases – to get a better fit and further understand what the atmosphere is really like. The difference between the best-fit model shown here and the data simply reflects the additional work to be done in analyzing and interpreting the data and the planet. Although full analysis of the spectrum will take additional time, it is possible to draw a number of preliminary conclusions. The labeled peaks in the spectrum indicate the presence of water vapor. The height of the water peaks, which is less than expected based on previous observations, is evidence for the presence of clouds that suppress the water vapor features. The gradual downward slope of the left side of the spectrum (shorter wavelengths) is indicative of possible haze. The height of the peaks along with other characteristics of the spectrum is used to calculate an atmospheric temperature of about 1350°F (725°C). This is the most detailed infrared exoplanet transmission spectrum ever collected, the first transmission spectrum that includes wavelengths longer than 1.6 microns with such high resolution and accuracy, and the first to cover the entire wavelength range from 0.6 microns (visible red light) to 2.8 microns (near-infrared) in a single shot. The speed with which researchers have been able to make confident interpretations of the spectrum is further testament to the quality of the data. The observation was made using NIRISS’s Single-Object Slitless Spectroscopy (SOSS) mode, which involves capturing the spectrum of a single bright object, like the star WASP-96, in a field of view. WASP-96 b is a hot gas giant exoplanet that orbits a Sun-like star roughly 1,150 light-years away, in the constellation Phoenix. The planet orbits extremely close to its star (less than 1/20th the distance between Earth and the Sun) and completes one orbit in less than 3½ Earth-days. The planet’s discovery, based on ground-based observations, was announced in 2014. The star, WASP-96, is somewhat older than the Sun, but is about the same size, mass, temperature, and color. The background illustration of WASP-96 b and its star is based on current understanding of the planet from both NIRISS spectroscopy and previous ground- and space-based observations. Webb has not captured a direct image of the planet or its atmosphere. NIRISS was contributed by the Canadian Space Agency. The instrument was designed and built by Honeywell in collaboration with the Université de Montréal and the National Research Council Canada.
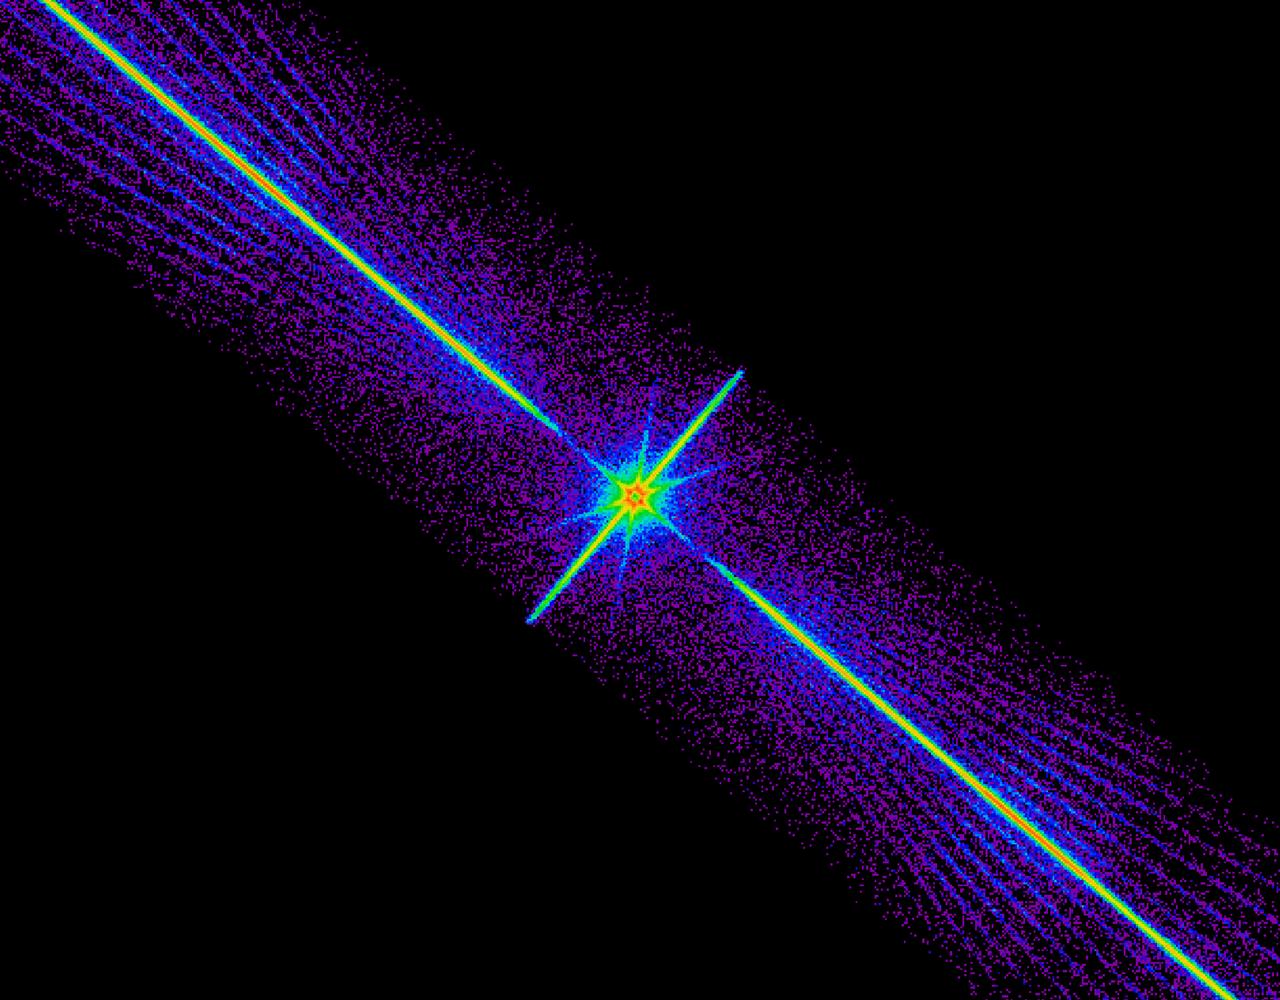
This Chandra X-Ray Observatory (CXO) image is a spectrum of a black hole, which is similar to the colorful spectrum of sunlight produced by a prism. The x-rays of interest are shown here recorded in bright stripes that run rightward and leftward from the center of the image. These x-rays are sorted precisely according to their energy with the highest-energy x-rays near the center of the image and the lower-energy x-rays farther out. The spectrum was obtained by using the Low Energy Transmission Grating (LETG), which intercepts x-rays and changes their direction by the amounts that depend sensitively on the x-ray energy. The assembly holds 540 gold transmission gratings. When in place behind the mirrors, the gratings intercept the x-rays reflected from the telescope. The bright spot at the center is due to a fraction of the x-ray radiation that is not deflected by the LETG. The spokes that intersect the central spot and the faint diagonal rays that flank the spectrum itself are artifacts due to the structure that supports the LETG grating elements. (Photo credit: NASA Cfa/J. McClintock et al)
![SCI2016_0001: SOFIA/GREAT [O I] spectrum at 4.7 THz (63 μm) superimposed on a picture of Mars. Absorption line depth is approximately 10% of the continuum. The abundance of atomic oxygen computed from the data is less than expected from the Forget et al. 1999 global circulation & photochemical model. Credit: SOFIA/GREAT spectrum: NASA/DLR/USRA/DSI/MPIfR/GREAT Consortium/MPIfS/Rezac et al. 2015; Mars image: NASA](https://images-assets.nasa.gov/image/ACD17-0168-003/ACD17-0168-003~medium.jpg)
SCI2016_0001: SOFIA/GREAT [O I] spectrum at 4.7 THz (63 μm) superimposed on a picture of Mars. Absorption line depth is approximately 10% of the continuum. The abundance of atomic oxygen computed from the data is less than expected from the Forget et al. 1999 global circulation & photochemical model. Credit: SOFIA/GREAT spectrum: NASA/DLR/USRA/DSI/MPIfR/GREAT Consortium/MPIfS/Rezac et al. 2015; Mars image: NASA
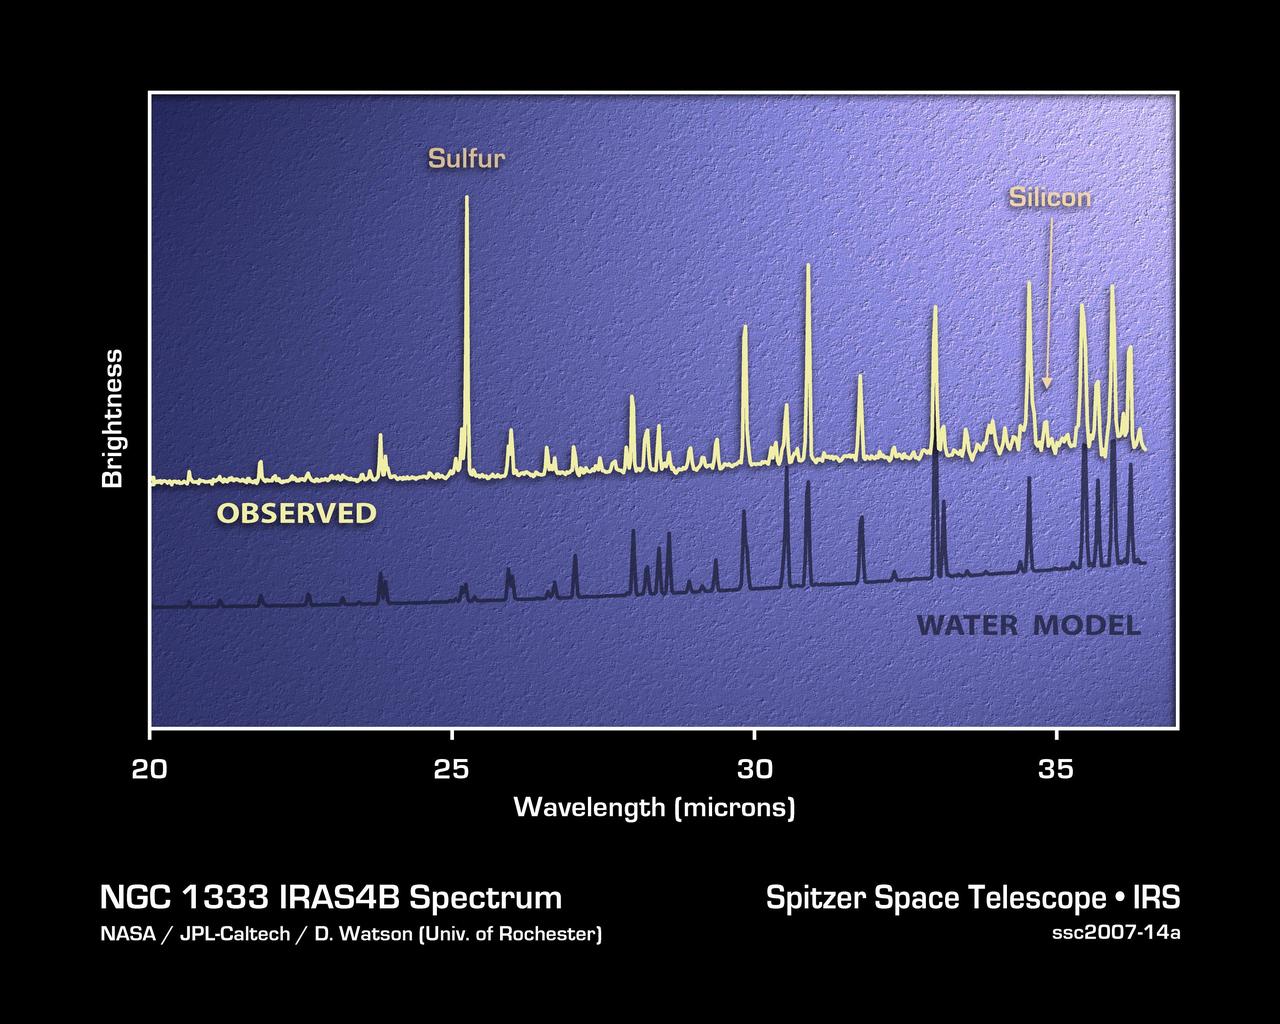
This plot of infrared data, called a spectrum, shows the strong signature of water vapor deep within the core of an embryonic star system, called NGC 1333-IRAS 4B. The data were captured by NASA Spitzer Space Telescope.
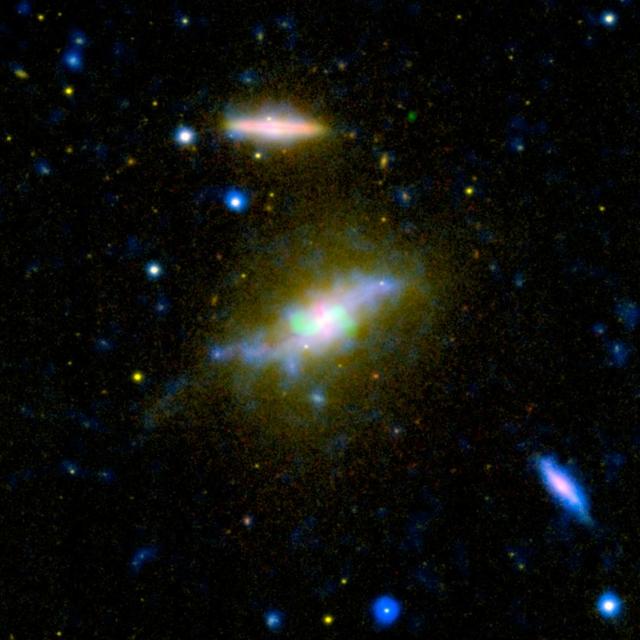
Time is running out for the galaxy NGC 3801, seen in this composite image from NASA Galaxy Evolution Explorer and other instruments combining light from across the spectrum, ranging from ultraviolet to radio.
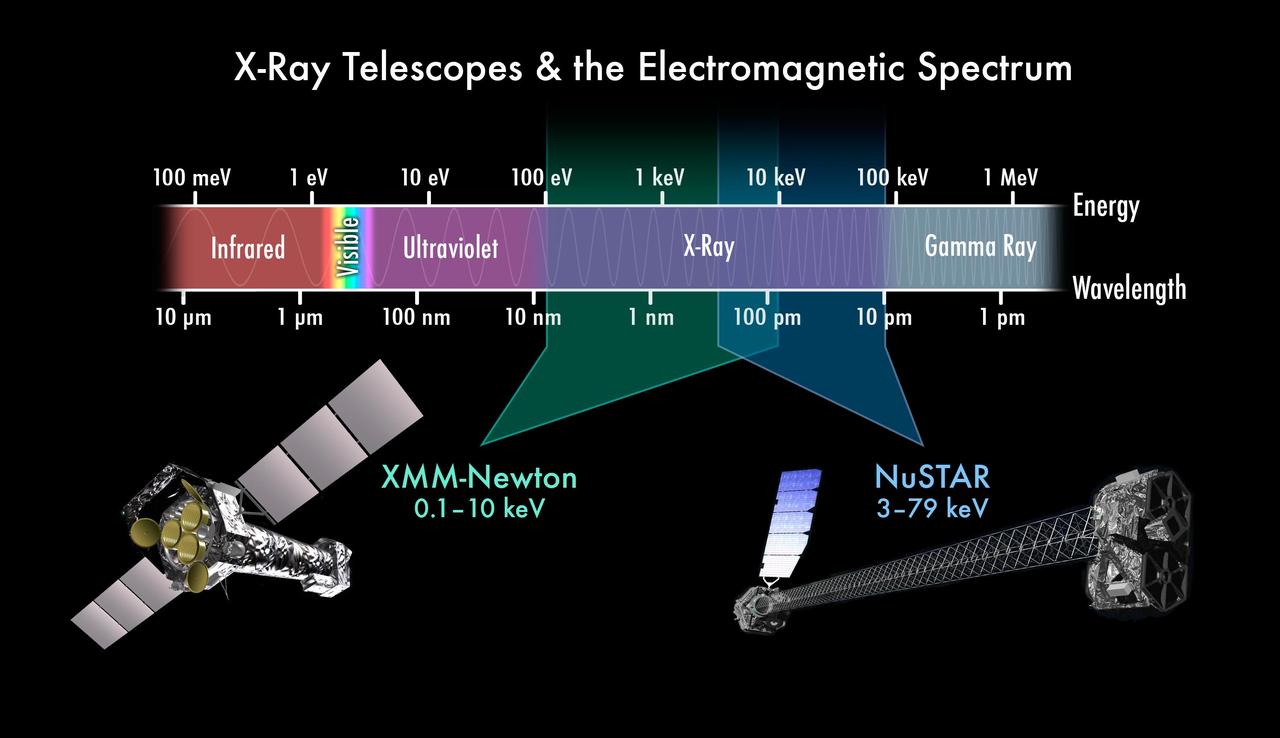
This chart depicts the electromagnetic spectrum, highlighting the X-ray portion. NASA NuSTAR and ESA XMM-Newton telescope complement each other by seeing different colors of X-ray light.
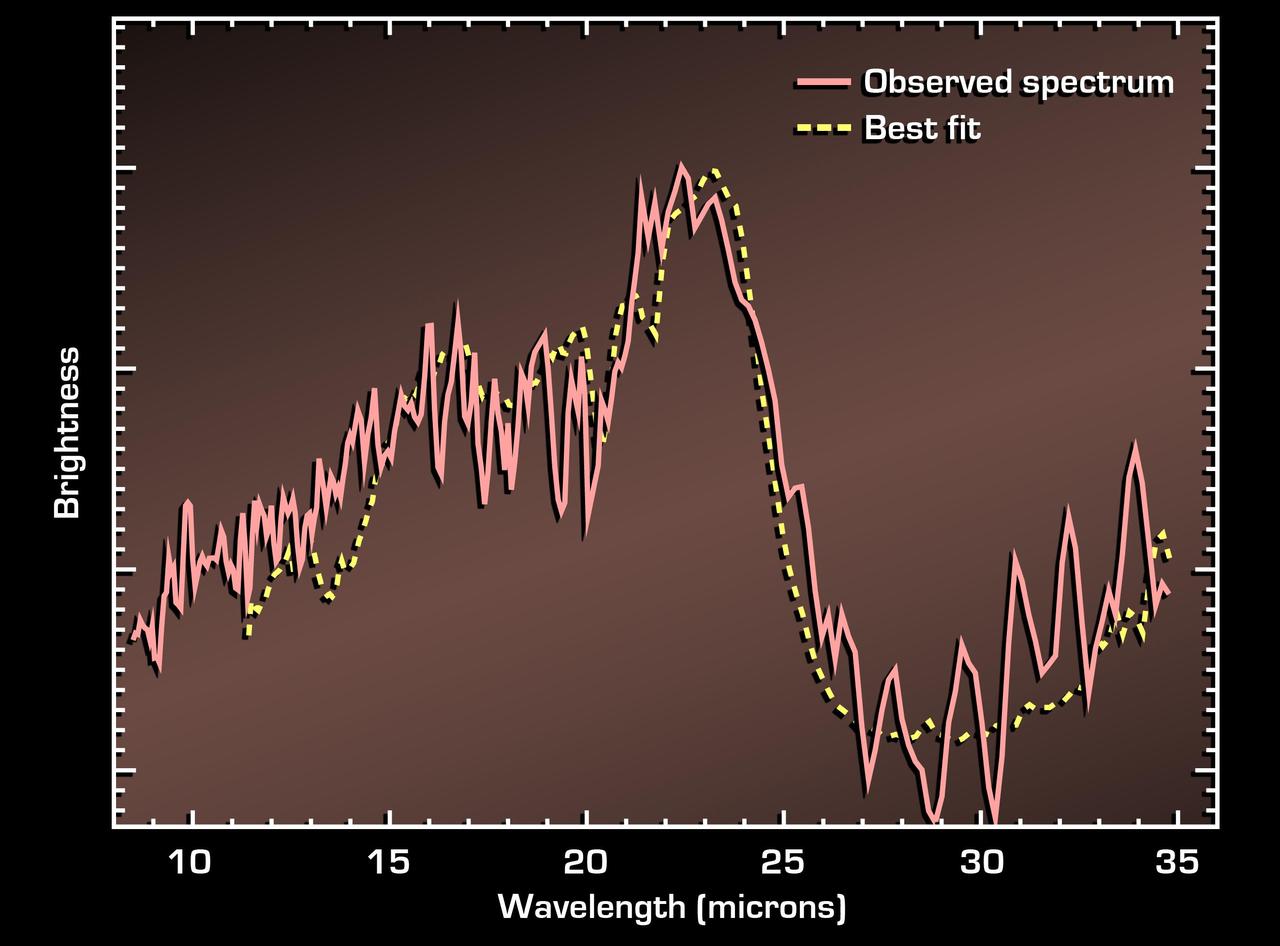
This spectrum shows the light from a dusty, distant galaxy located 11 billion light-years away. The galaxy is invisible to optical telescopes, but NASA Spitzer Space Telescope captured the light from it and dozens of other similar galaxies.
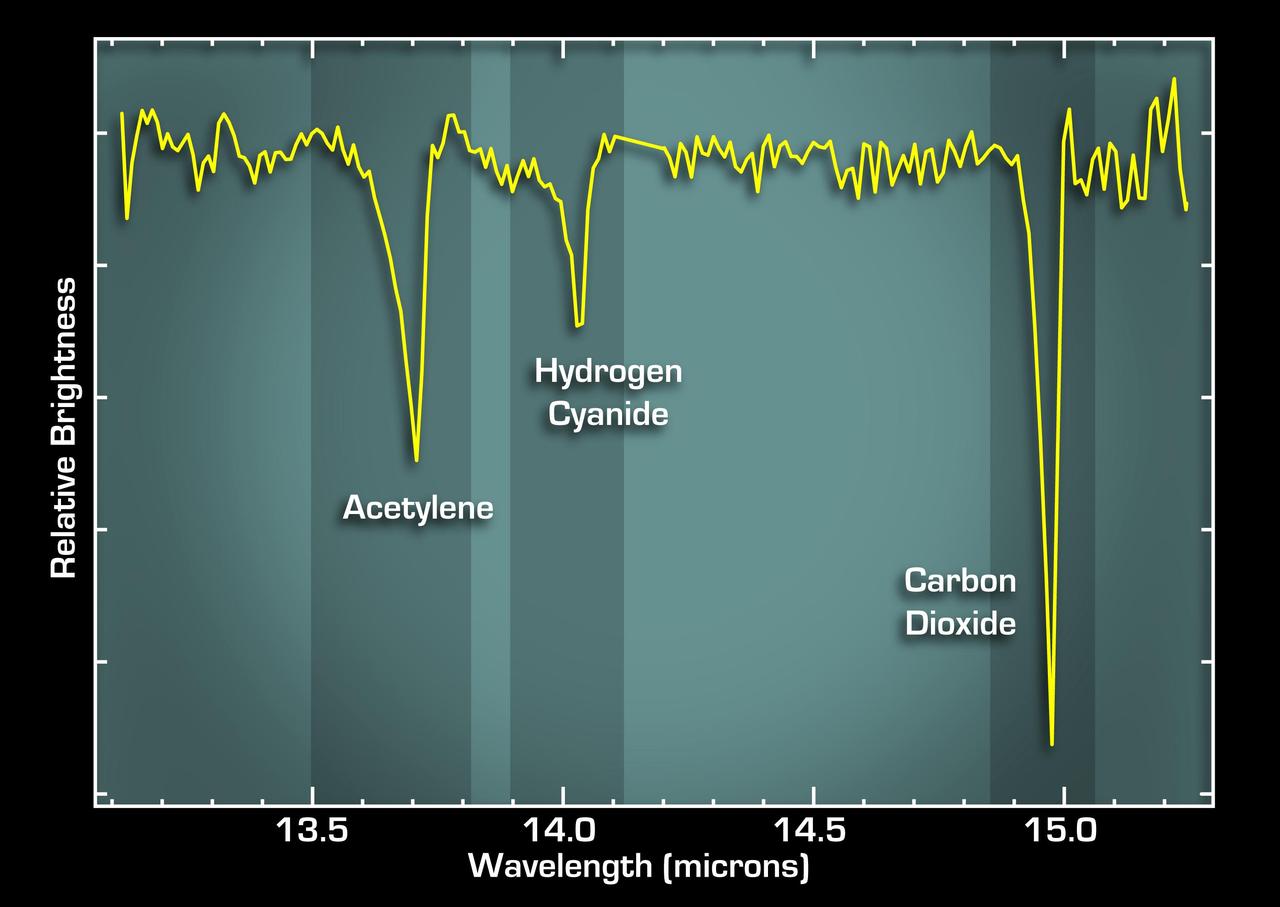
This graph, or spectrum, from NASA Spitzer Space Telescope tells astronomers that some of the most basic ingredients of DNA and protein are concentrated in a dusty planet-forming disk circling a young sun-like star called IRS 46.
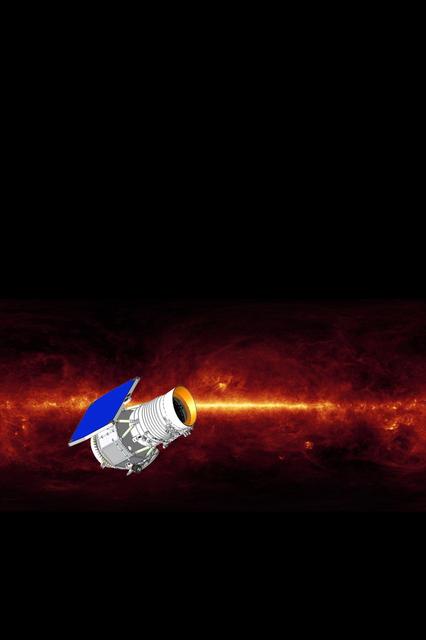
NASA Wide-field Infrared Survey Explorer mission will survey the entire sky in a portion of the electromagnetic spectrum called the mid-infrared with far greater sensitivity than any previous mission or program ever has.
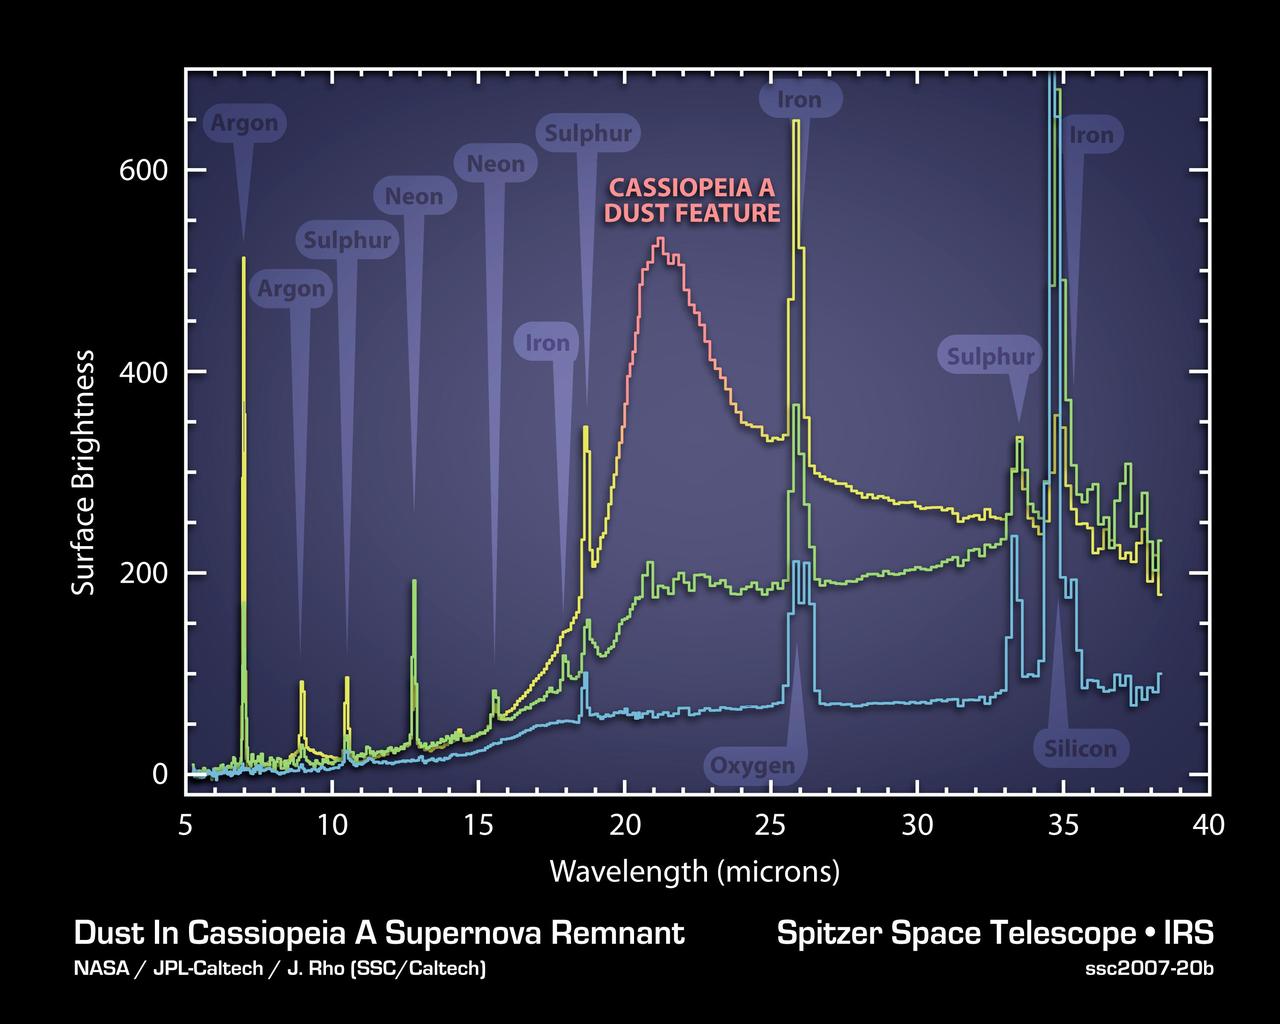
The elements and molecules that flew out of the Cassiopeia A star when it exploded about 300 years ago can be seen clearly for the first time in this plot of data, called a spectrum, taken by NASA Spitzer Space Telescope.
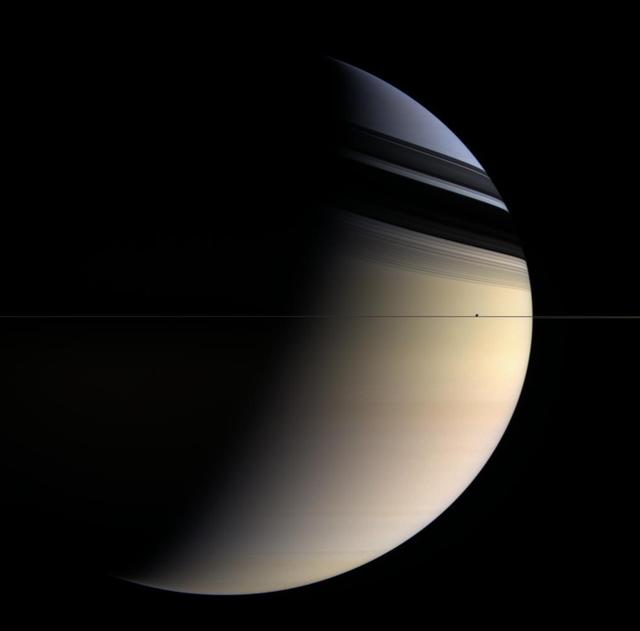
Dreamy colors ranging from pale rose to butterscotch to sapphire give this utterly inhospitable gas planet a romantic appeal. Shadows of the rings caress the northern latitudes whose blue color is presumed to be a seasonal effect
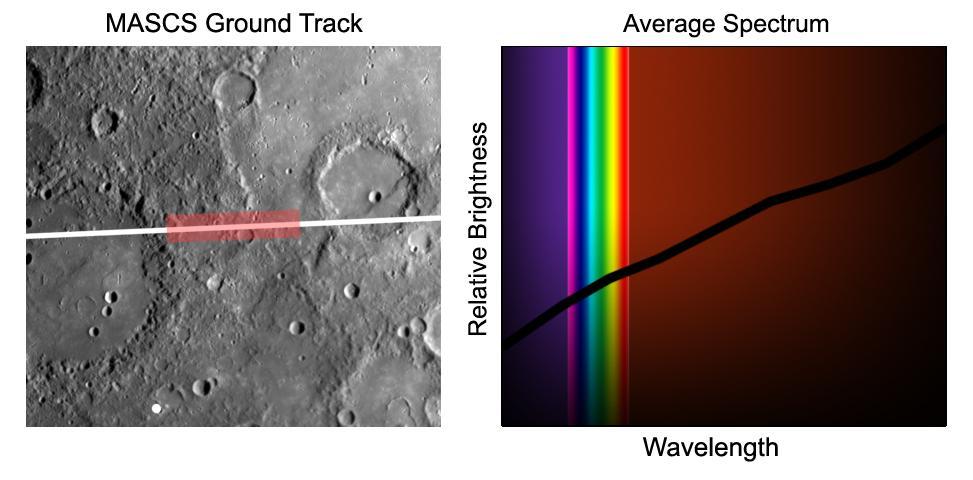
During its flyby of Mercury, on January 14, 2008 NASA MESSENGER spacecraft acquired the first high-resolution spectra of the planet surface in ultraviolet, visible, and near-infrared light.
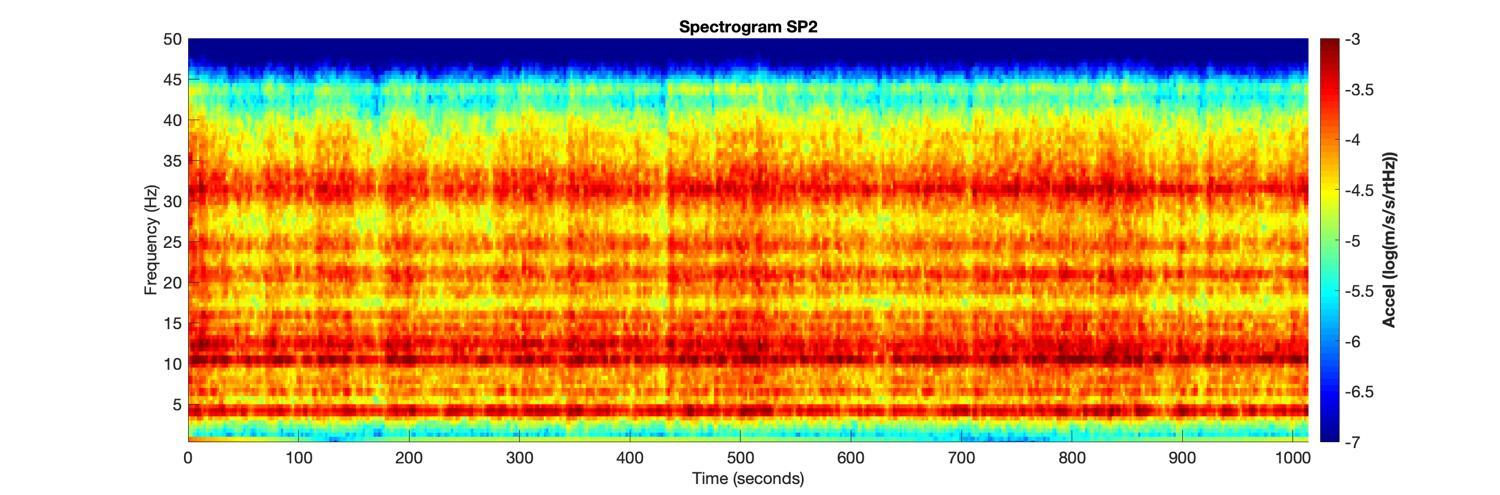
The spectrogram of vibrations (frequency spectrum over time) recorded by two of the three sensors of the short period seismometer on NASA's InSight lander on Mars. This spectrogram shows the first 1,000 seconds, roughly 20 minutes, of InSight's first seismic data from the Red Planet. The vibrations of the lander are due to the wind passing over the spacecraft, particularly the large solar arrays. https://photojournal.jpl.nasa.gov/catalog/PIA22925
This graph, or spectrum, from NASA Spitzer Space Telescope, charts light from a faraway galaxy located 10 billion light years from Earth. It tracks mid-infrared light from an extremely luminous galaxy when the universe was only 1/4 of its current age.
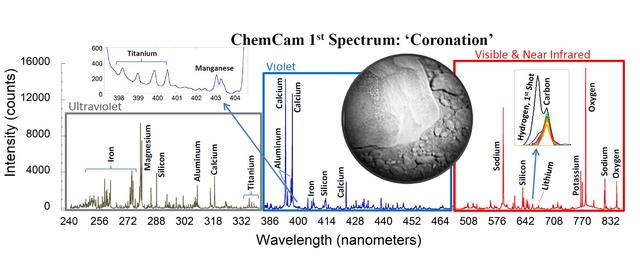
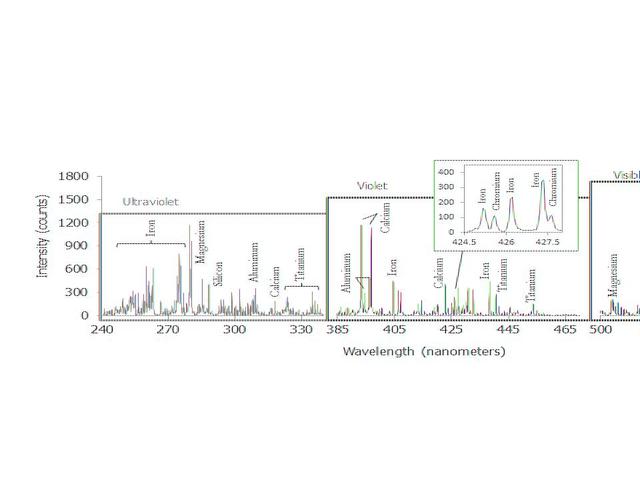
This is the first laser spectrum from the ChemCam instrument on NASA Curiosity rover, sent back from Mars on Aug. 19, 2012, showing emission lines from different elements present in the target, a rock near the rover landing site dubbed Coronation.

This diagram illustrates how astronomers using NASA Spitzer Space Telescope can capture the elusive spectra of hot-Jupiter planets. Spectra are an object light spread apart into its basic components, or wavelengths.
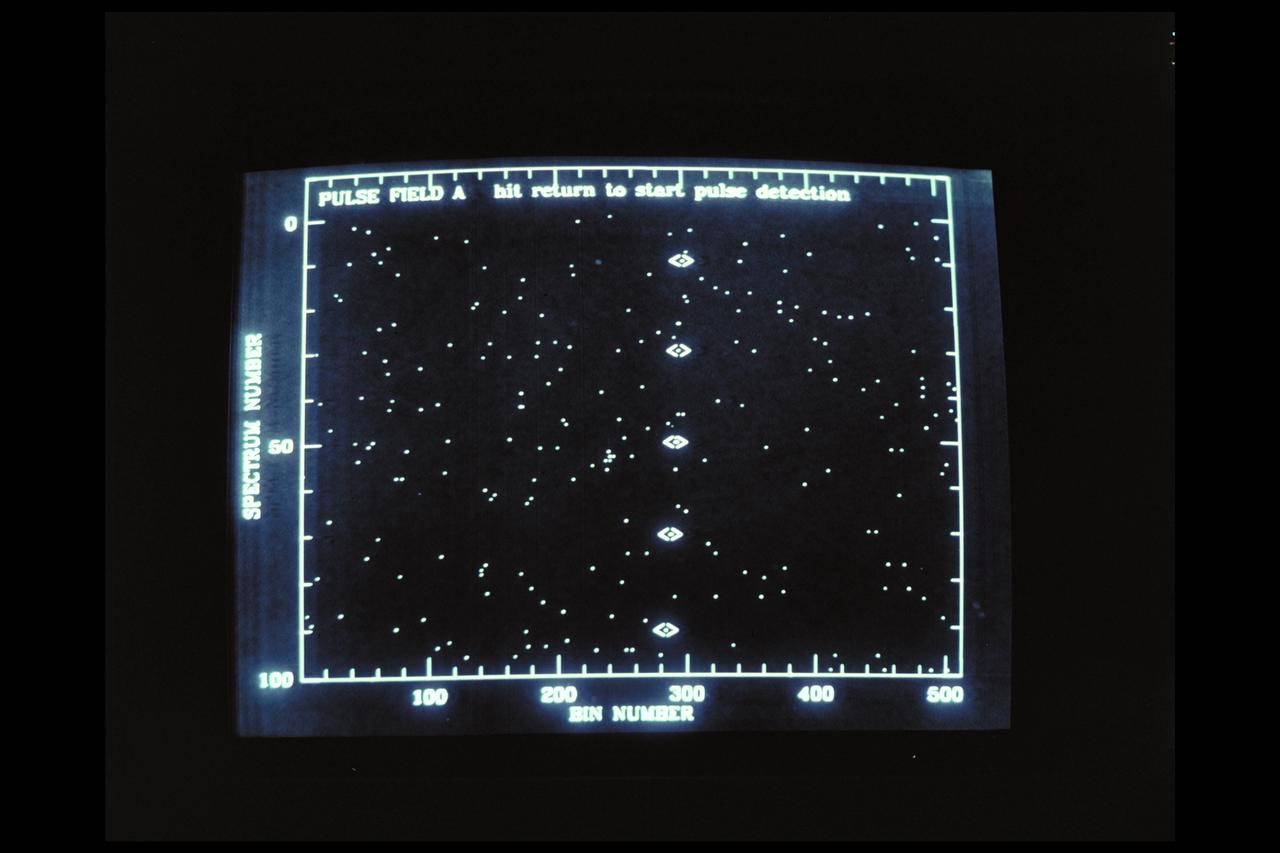
SETI (Search for Extraterrestrial Intelligence) Mulit-channel spectrum analyzer (MCSA) at Stanford University used in Ames 60 yr. History NASA SP-2000-4314
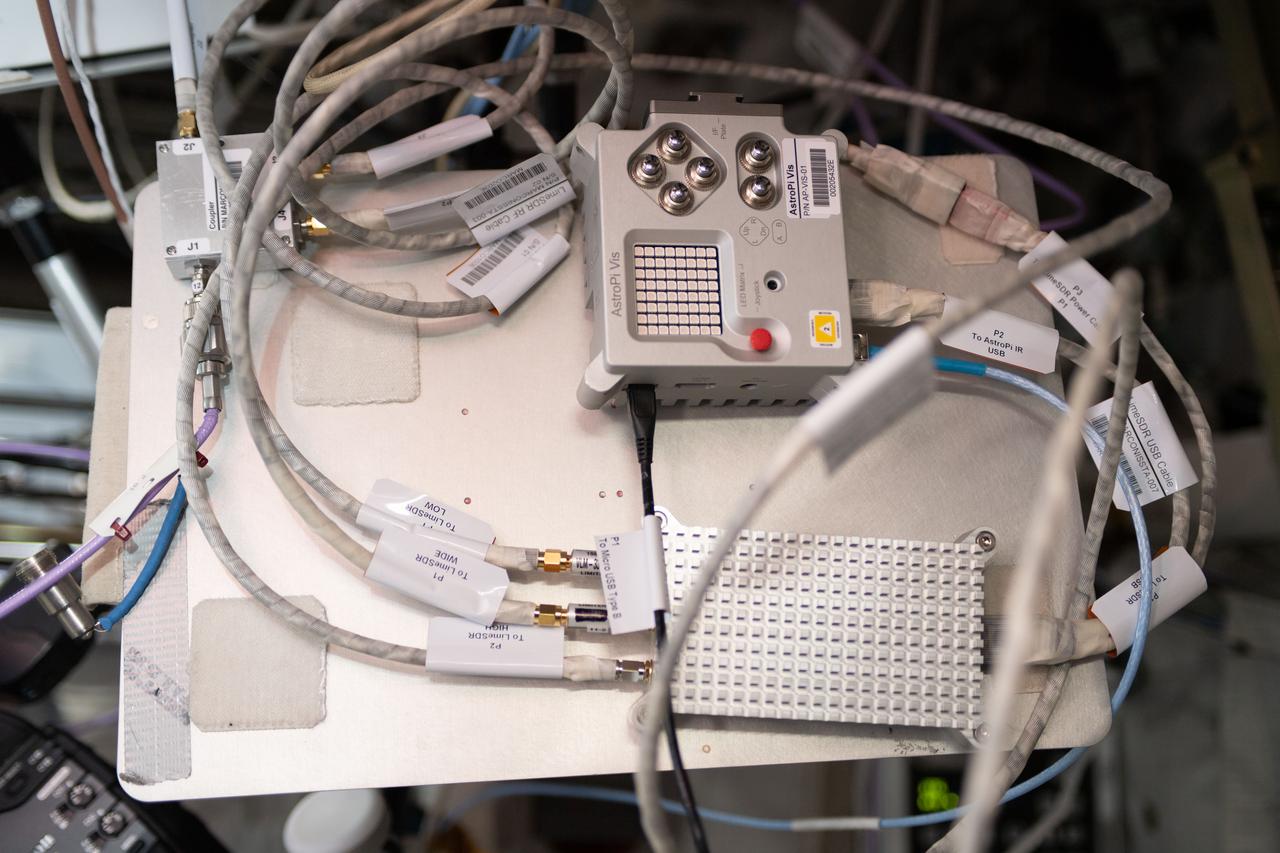
iss056e136189 (8/13/2020) --- A view of the Marconissta setup connected to the Amateur Radio on International Space Station (ARISS) antennas in the Columbus Module aboard the International Space Station (ISS). MarconISSta is a radio spectrum analyzer payload launched to ISS. MarconISSta monitors parts of the radio frequency spectrum in VHF, UHF, L, and S band in order to analyze current use and availability of bands for satellite communication.
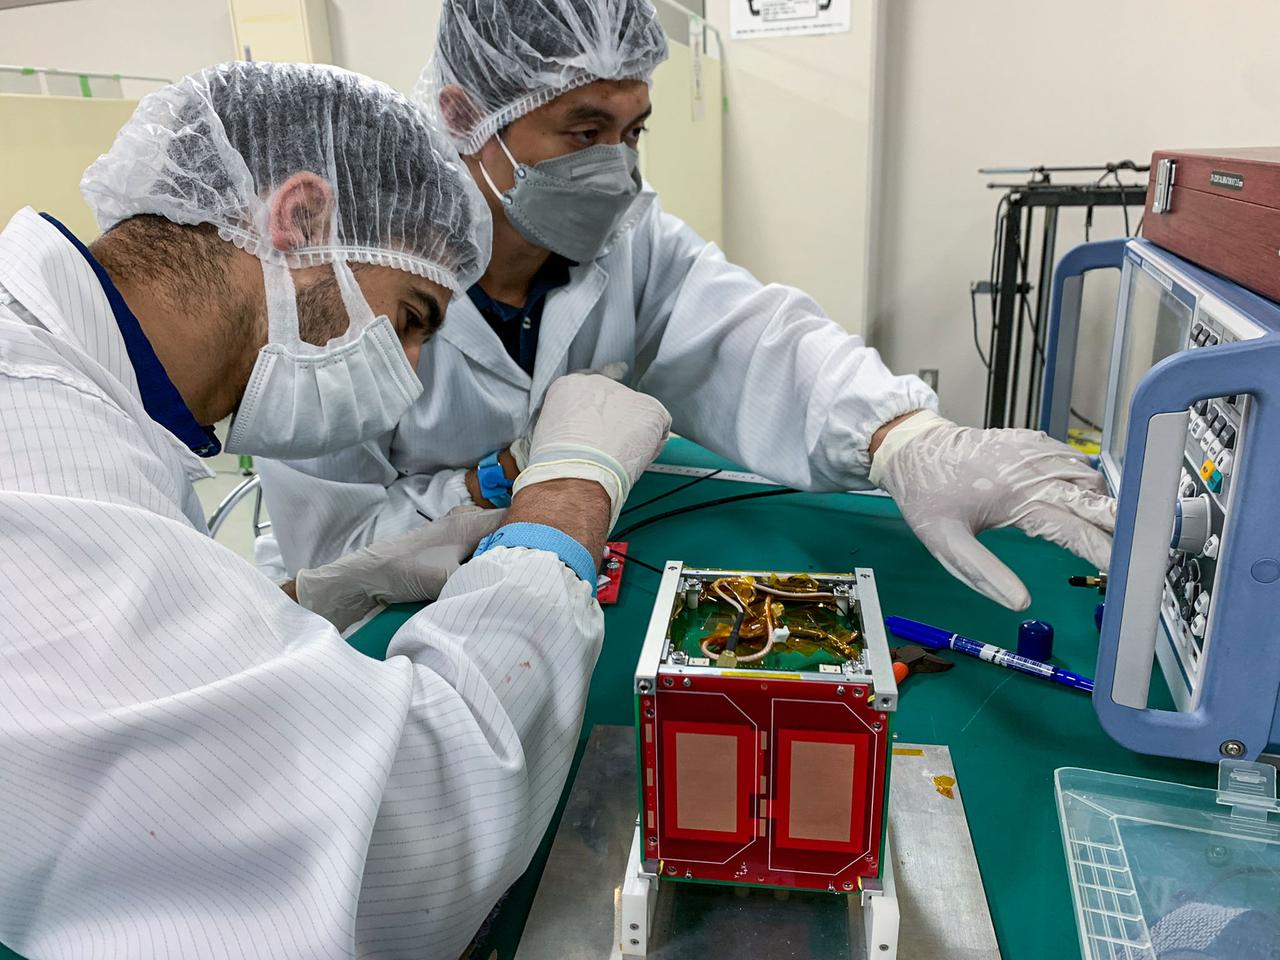
jsc2024e006084 (7/13/2022) --- The dipole antennas are being tuned using a spectrum analyzer in the clean room. From left to right : MOUMNI Fahd, ALMONTE John-Paul..Image Credit: MOUMNI Fahd.
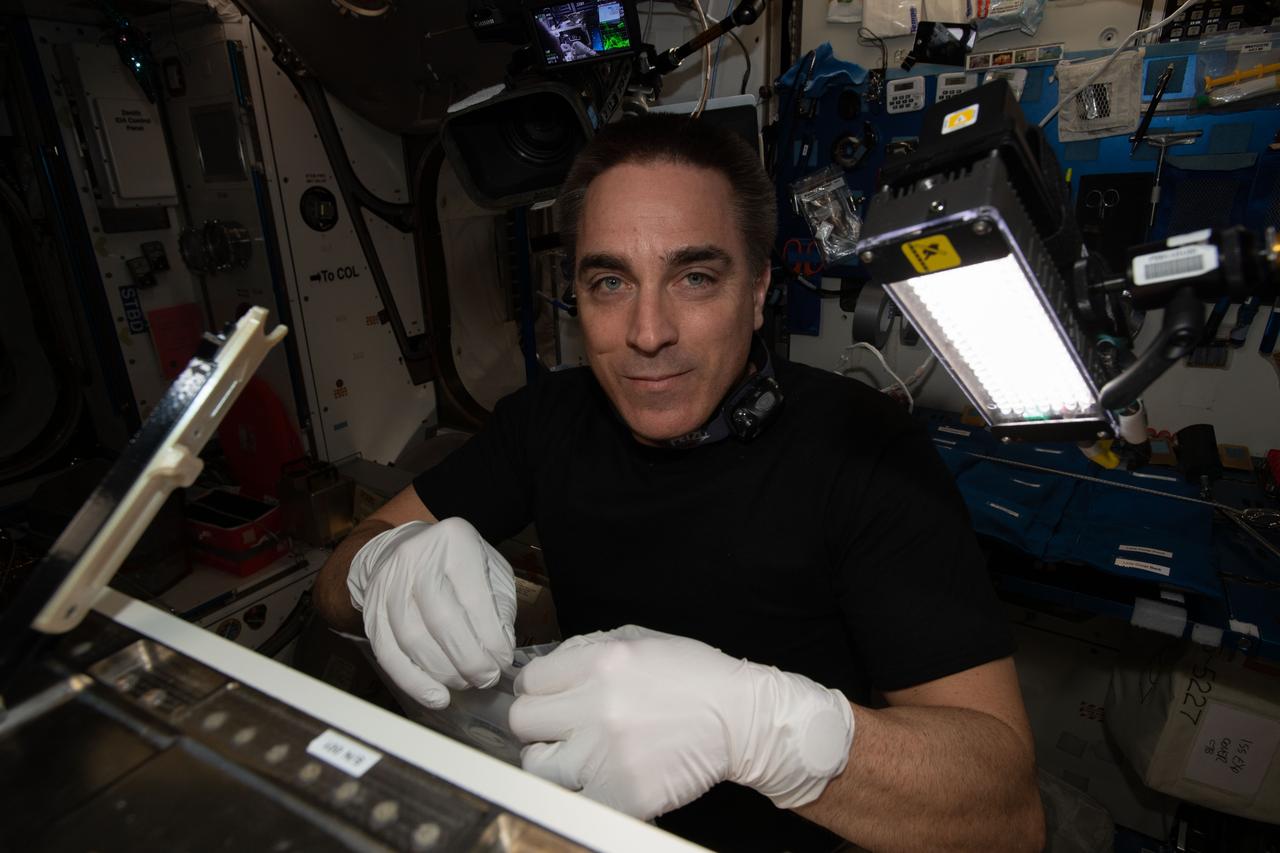
iss063e026157 (June 11, 2020) --- NASA astronaut and Expedition 63 Commander Chris Cassidy configures the new Spectrum imager that will view the cellular growth of plants in multiple wavelengths.
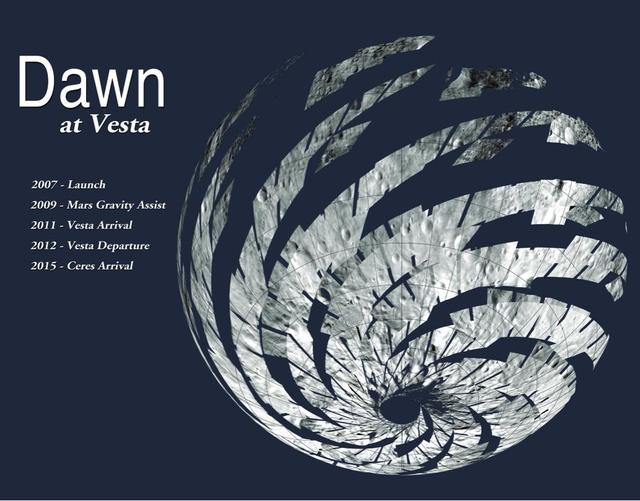
The mosaic of Visible and Infrared Spectrometer (VIR) data shows the location of the data acquired by VIR during the HAMO (high-altitude mapping orbit) phase of NASA's Dawn mission. VIR can image Vesta in a number of different wavelengths of light, ranging from the visible to the infrared part of the electromagnetic spectrum. This mosaic shows the images taken at a wavelength of 550 nanometers, which is in the visible part of the electromagnetic spectrum. During HAMO VIR obtained more than 4.6 million spectra of Vesta. It is clear from this image that the VIR observations are widely distributed across Vesta, which results in a global view of the spectral properties of Vesta's surface. http://photojournal.jpl.nasa.gov/catalog/PIA19368
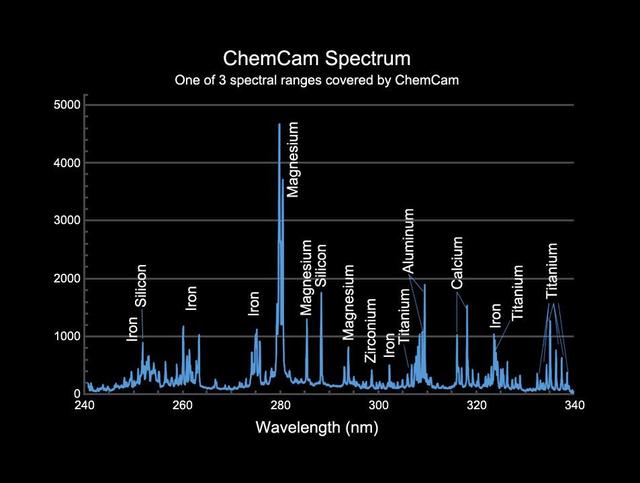
This image provides an example of the type of data collected by the Chemistry and Camera ChemCam instrument on NASA Mars Science Laboratory mission Curiosity rover.
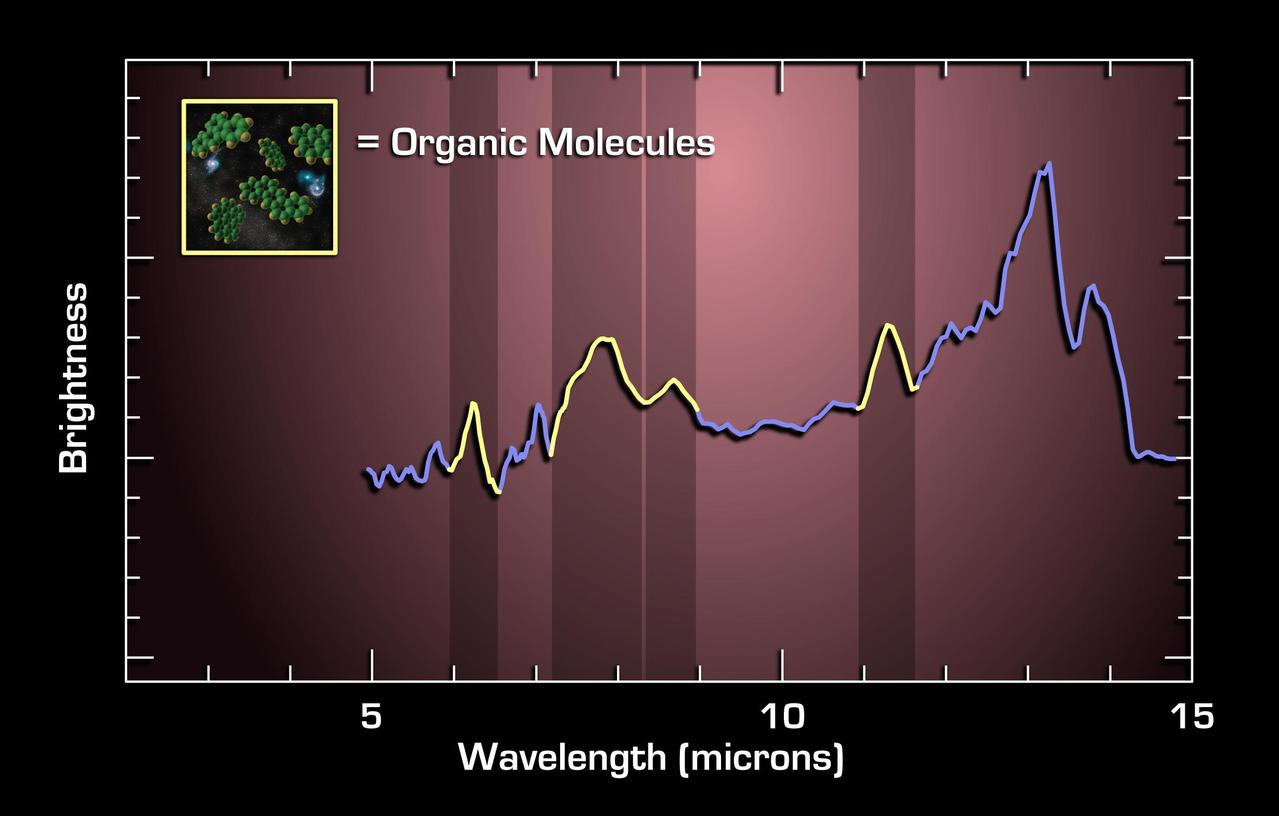
NASA Spitzer Space Telescope has detected the building blocks of life in the distant universe, albeit in a violent milieu.
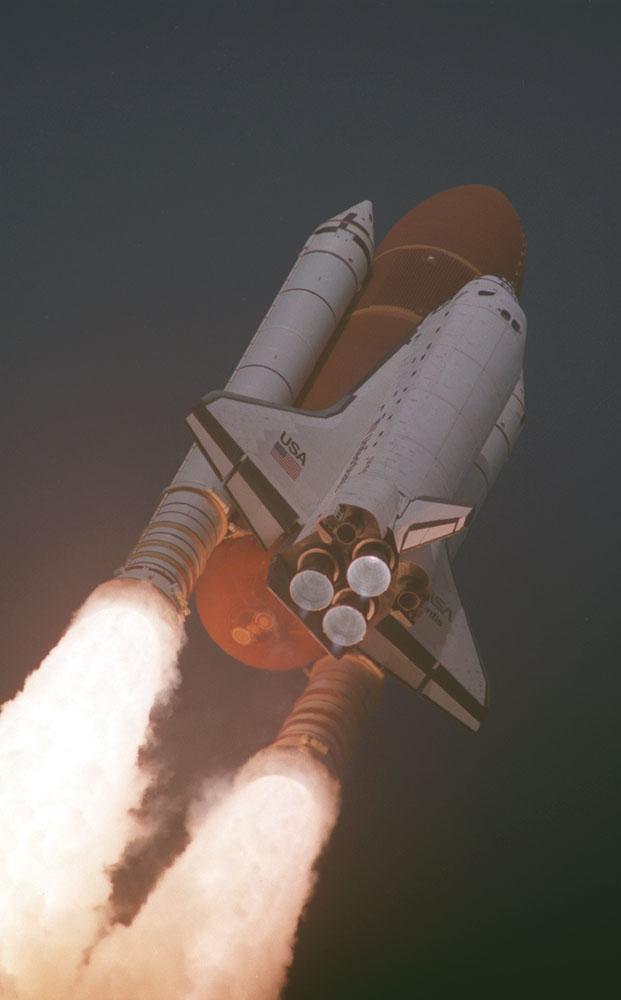
The Space Shuttle Atlantis (STS-45) roars into space in this photo showing a close-up of the Solid Rocket Boosters (SRBs) and the external tank. Atlantis' mission included experiments on the Atmospheric Lab for Applications and Sciences (ATLAS). ATLAS-1 measures long-term variability in the total energy radiated by the sun and determines the variability in the solar spectrum.
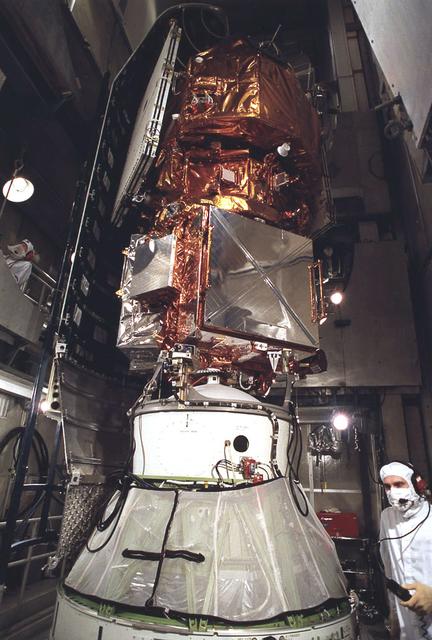
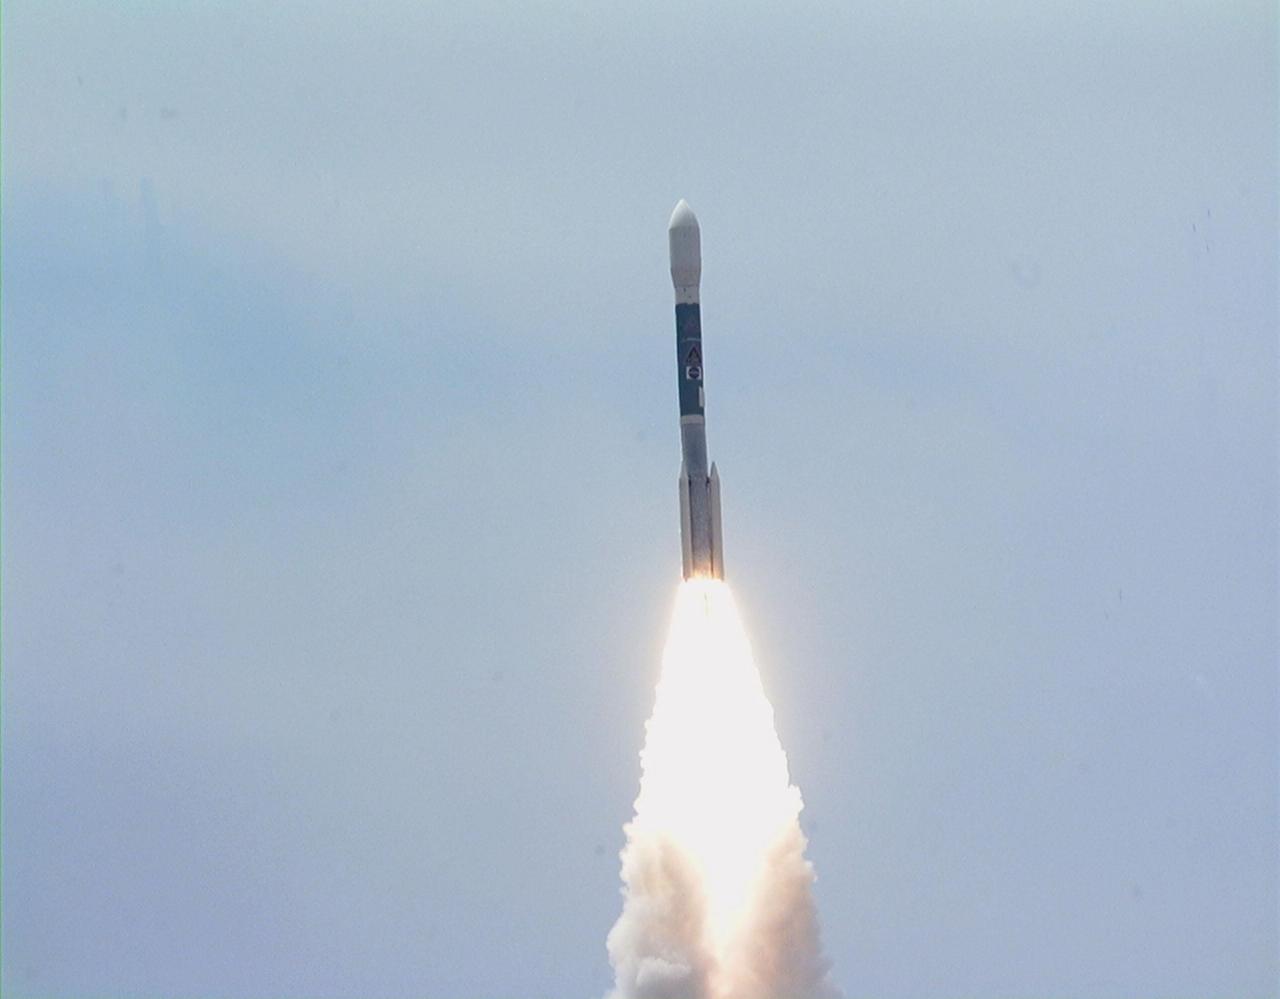
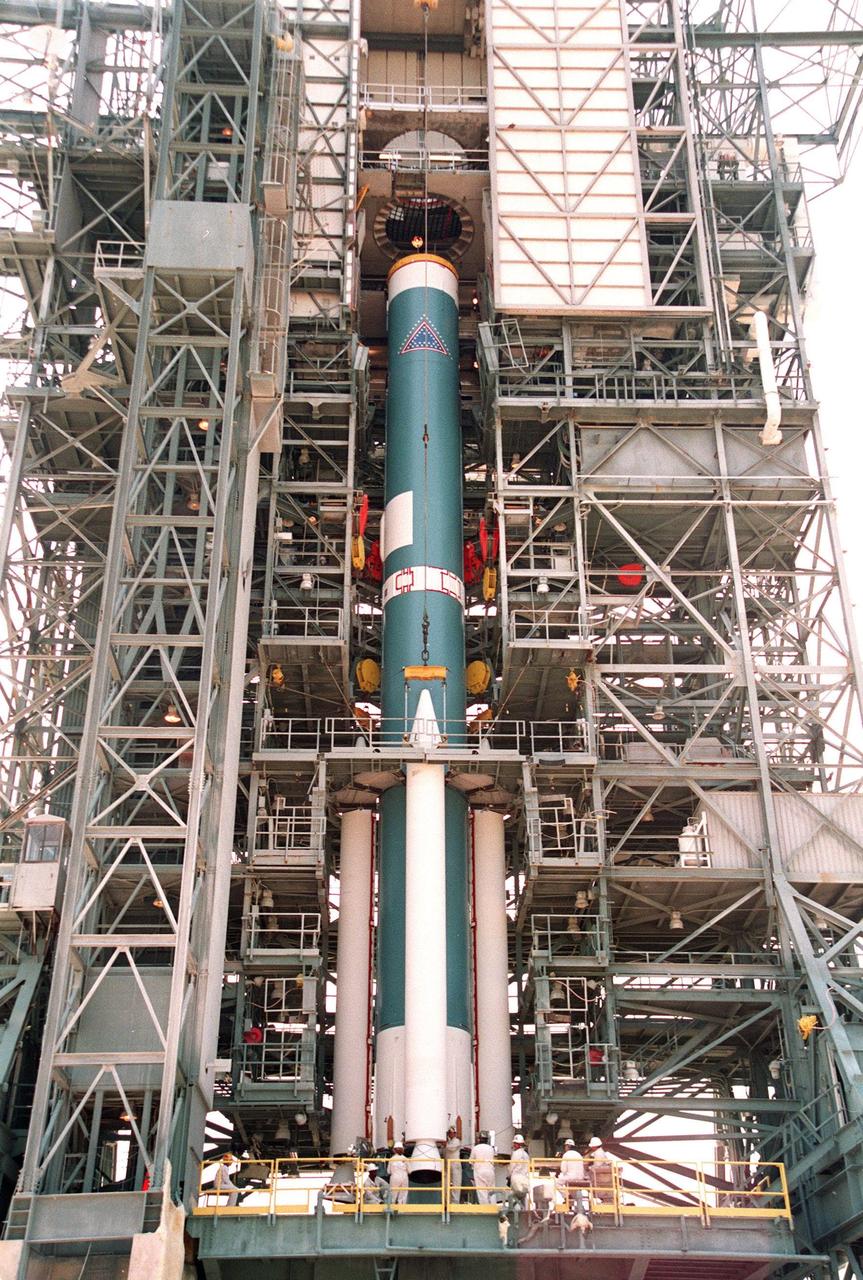
At Launch Complex 17 Pad A, Kennedy Space Center (KSC) workers are installing the payload fairing around the Extreme Ultraviolet Explorer (EUVE) mated to a Delta II rocket. The EUVE spacecraft is designed to study the extreme ultraviolet portion of the spectrum.
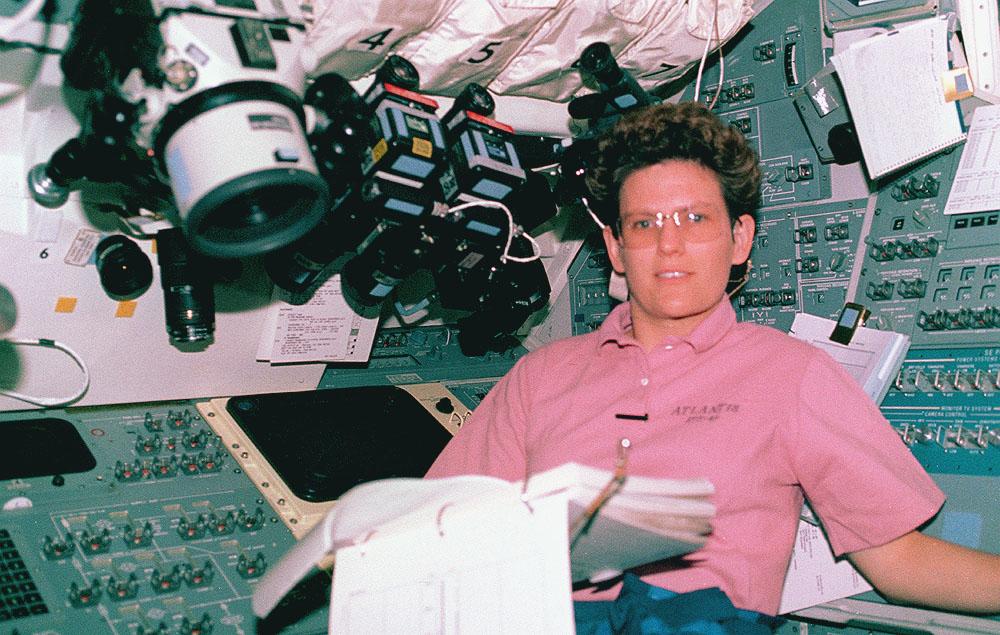
Space Shuttle Atlantis (STS-45) onboard photo of Mission Specialist Kathryn Sullivan working in the Atmospheric Laboratory for Applications and Science (Atlas-1) module. Atlas-1 flew in a series of Spacelab flights that measured long term variability in the total energy radiated by the Sun and determined the variability in the solar spectrum.

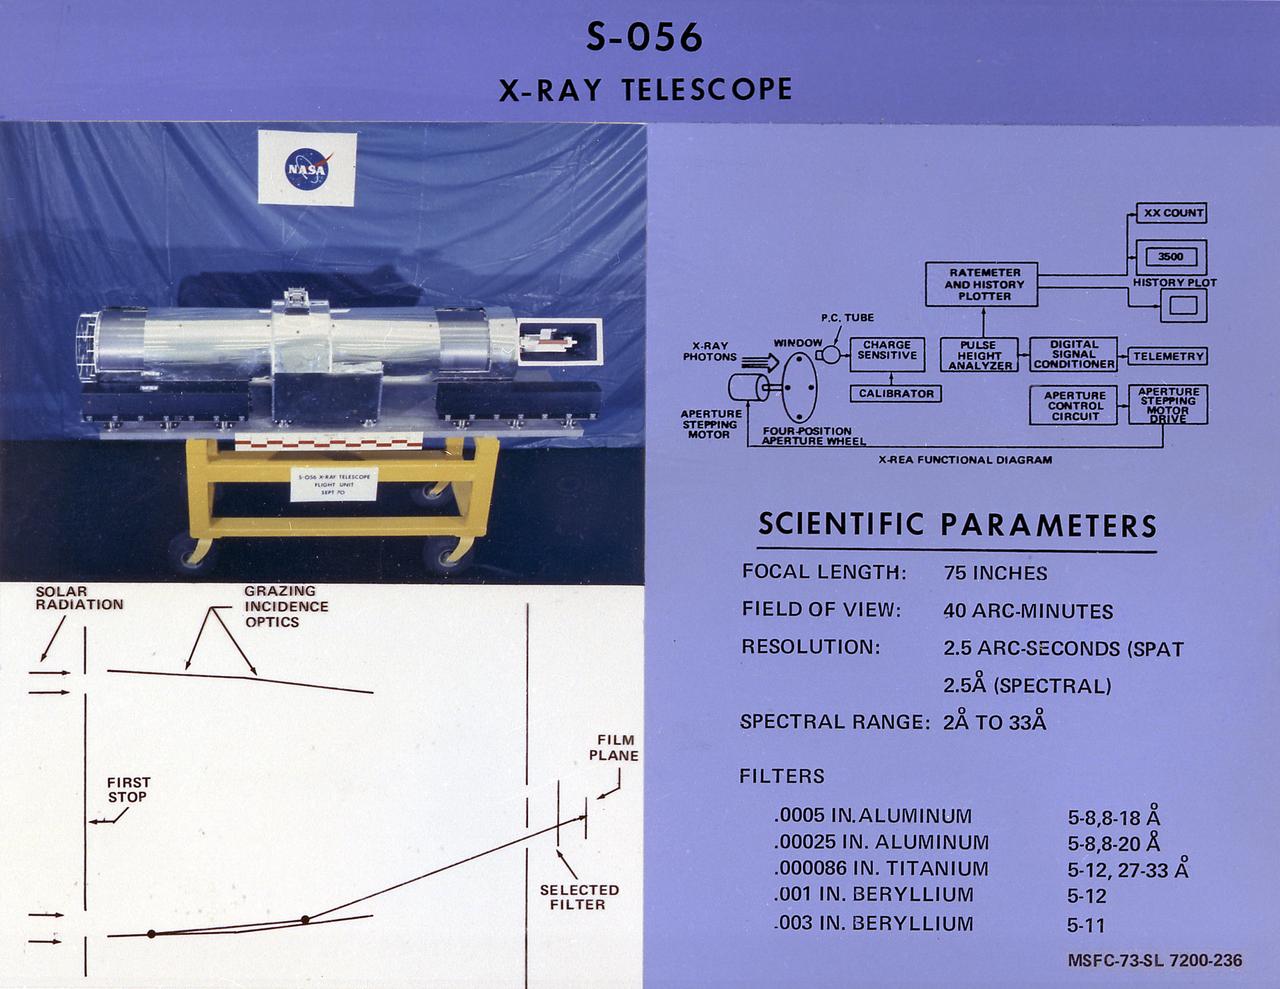
This chart details Skylab's X-Ray Spectrographic Telescope, an Apollo Telescope Mount facility. It was designed to sequentially photograph solar flares and other active regions in the x-ray spectrum. The Marshall Flight Center had program management responsibility for the development of Skylab hardware and experiments.
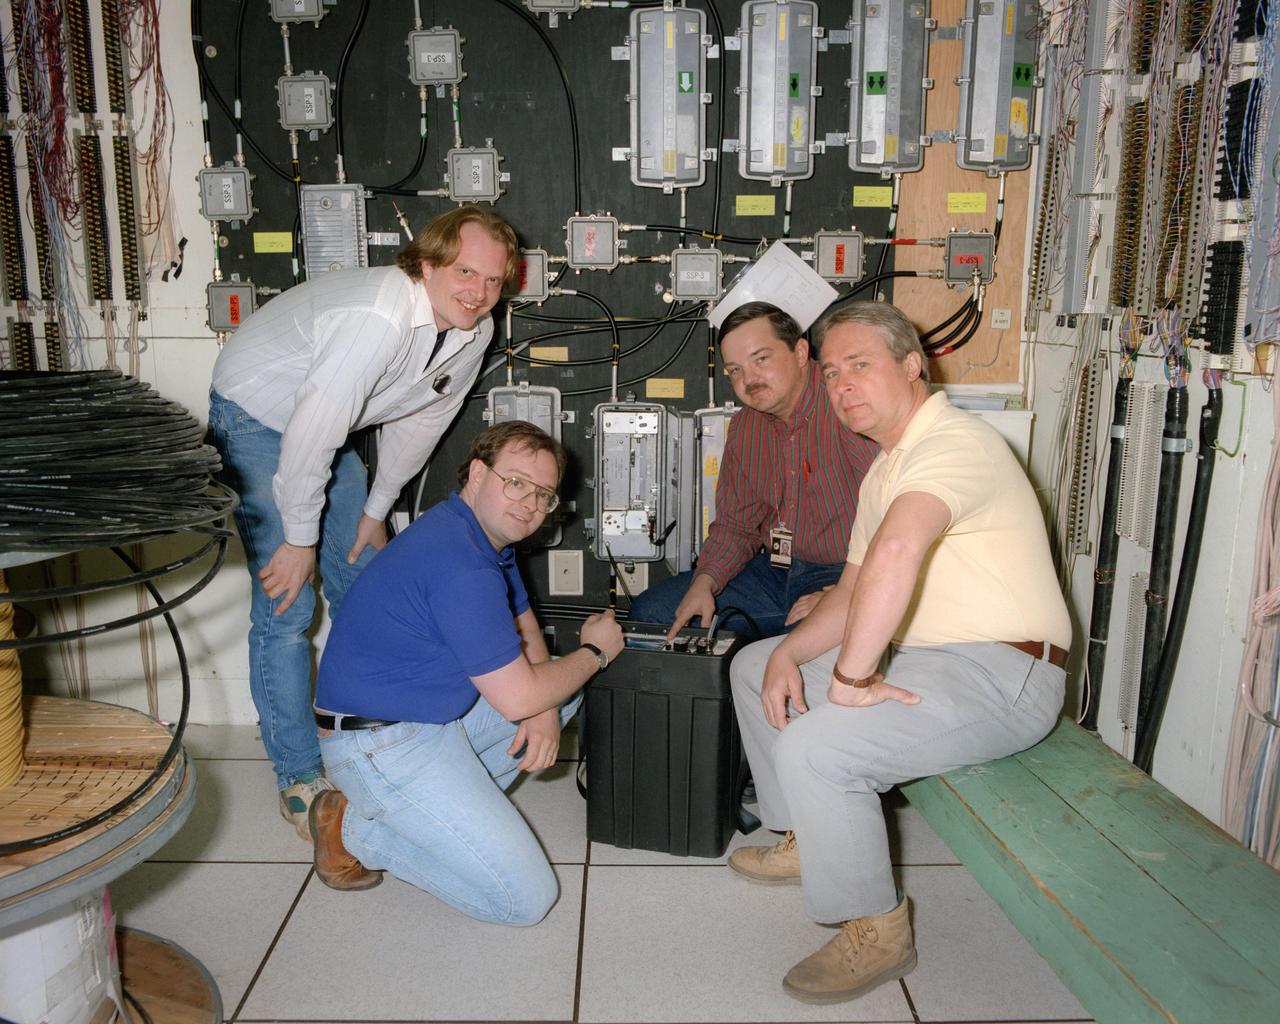
Pictured is the Communications room in the RAC building, Research Analysis Center. This is the hub for the CATV and Lynk system and also the telephone system as seen from the twisted pair wires. The test gear LAN 450 is on the floor and is a spectrum analyzer made specifically for CATV. The Large boxes on the wall are Trunk amps and the smaller boxes are Splitters or combiners.
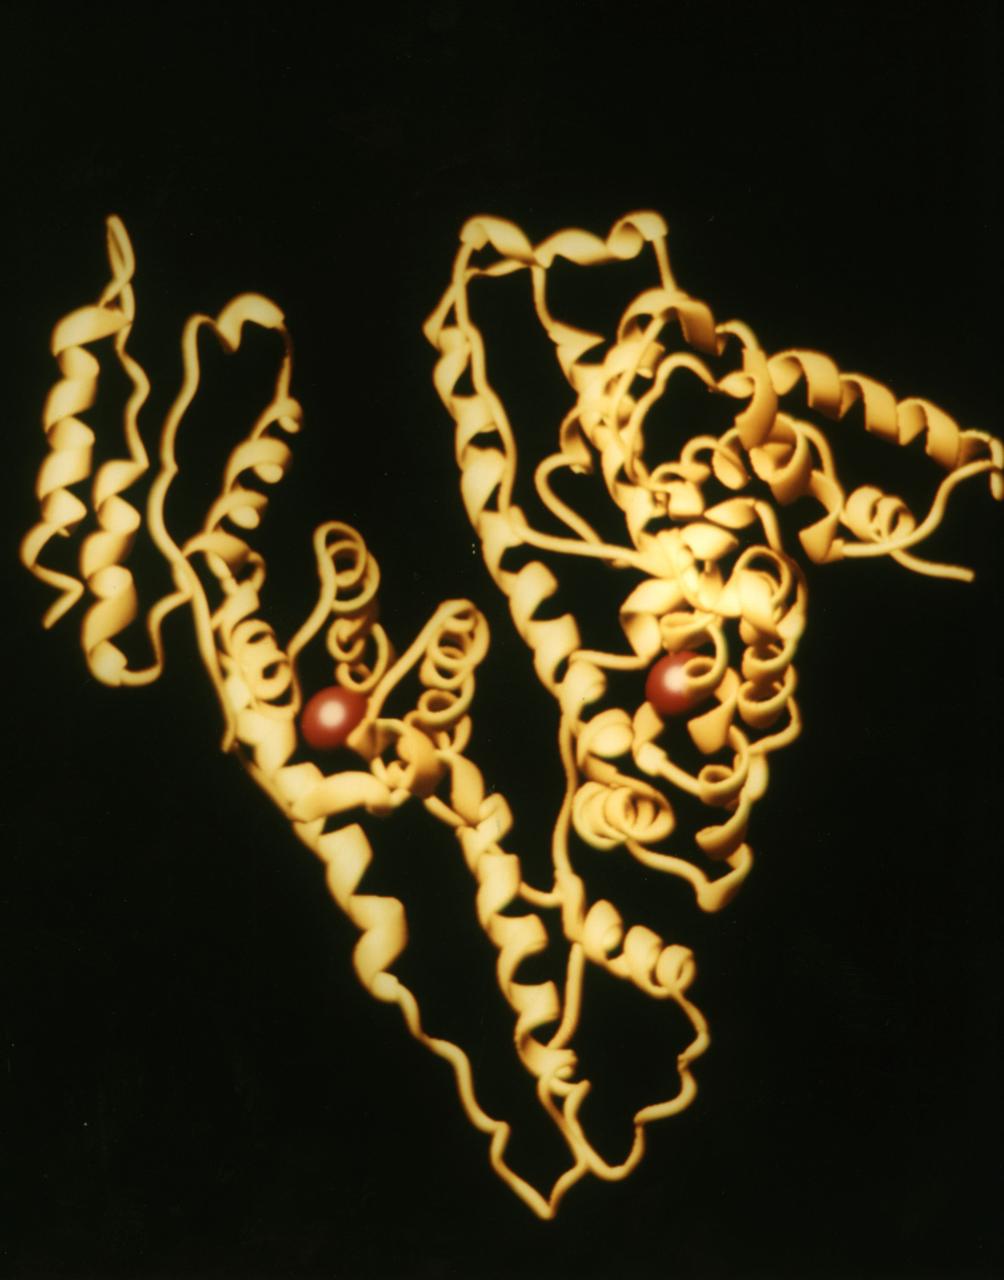
Contributes to many transport and regulatory processes and has multifunctional binding properties which range form various metals, to fatty acids, hormones, and a wide spectrum of therapeutic drugs. The most abundant protein of the circulatory system. It binds and transports an incredible variety of biological and pharmaceutical ligands throughout the blood stream. Principal Investigator was Larry DeLucas.
This photograph details Skylab's X-Ray Spectrographic Telescope, an Apollo Telescope Mount facility. It was designed to sequentially photograph solar flares and other active regions in x-ray spectrum. The Marshall Space Flight Center had program management responsibility for the development of Skylab hardware and experiments.
This is an onboard photo of space shuttle Atlantis (STS-66) crew member, French scientist Jean-Francois Clervoy working on the Atmospheric Laboratory for Applied Sciences (ATLAS-3) project. The ATLAS-3 measures the variances of the sun's solar radiation and the variability in the solar spectrum.
Space Shuttle Discovery (STS-56) onboard photo of Mission Specialist Michael Foale working in the Atmospheric Laboratory for Applications and Science (ATLAS-2). The ATLAS program was designed to measure the long term variability in the total energy radiated by the sun and determine the variability in the solar spectrum.
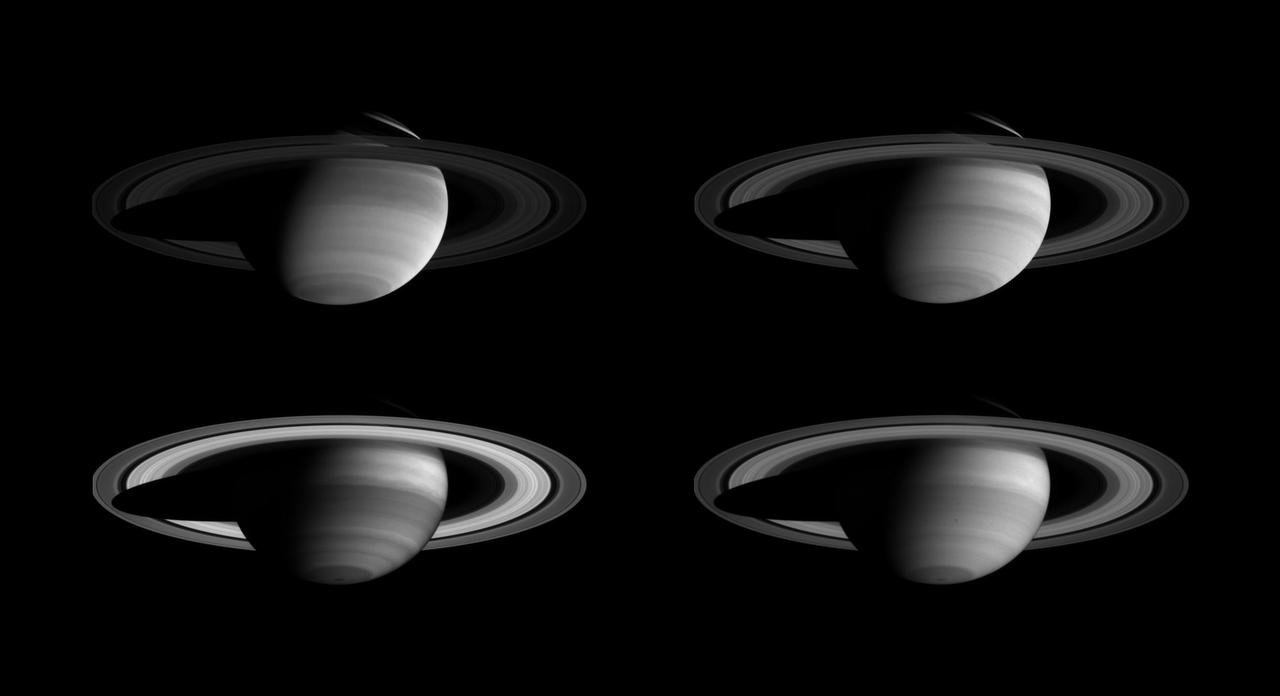
A montage of Cassini images, taken in four different regions of the spectrum from ultraviolet to near-infrared, demonstrates that there is more to Saturn than meets the eye. The pictures show the effects of absorption and scattering of light at different wavelengths by both atmospheric gas and clouds of differing heights and thicknesses. They also show absorption of light by colored particles mixed with white ammonia clouds in the planet's atmosphere. Contrast has been enhanced to aid visibility of the atmosphere. Cassini's narrow-angle camera took these four images over a period of 20 minutes on April 3, 2004, when the spacecraft was 44.5 million kilometers (27.7 million miles) from the planet. The image scale is approximately 267 kilometers (166 miles) per pixel. All four images show the same face of Saturn. In the upper left image, Saturn is seen in ultraviolet wavelengths (298 nanometers); at upper right, in visible blue wavelengths (440 nanometers); at lower left, in far red wavelengths just beyond the visible-light spectrum (727 nanometers; and at lower right, in near-infrared wavelengths (930 nanometers). The sliver of light seen in the northern hemisphere appears bright in the ultraviolet and blue (top images) and is nearly invisible at longer wavelengths (bottom images). The clouds in this part of the northern hemisphere are deep, and sunlight is illuminating only the cloud-free upper atmosphere. The shorter wavelengths are consequently scattered by the gas and make the illuminated atmosphere bright, while the longer wavelengths are absorbed by methane. Saturn's rings also appear noticeably different from image to image, whose exposure times range from two to 46 seconds. The rings appear dark in the 46-second ultraviolet image because they inherently reflect little light at these wavelengths. The differences at other wavelengths are mostly due to the differences in exposure times. http://photojournal.jpl.nasa.gov/catalog/PIA05388

Astronomers have produced a highly detailed image of the Crab Nebula, by combining data from telescopes spanning nearly the entire breadth of the electromagnetic spectrum, from radio waves seen by the Karl G. Jansky Very Large Array (VLA) to the powerful X-ray glow as seen by the orbiting Chandra X-ray Observatory. And, in between that range of wavelengths, the Hubble Space Telescope's crisp visible-light view, and the infrared perspective of the Spitzer Space Telescope. This composite image of the Crab Nebula, a supernova remnant, was assembled by combining data from five telescopes spanning nearly the entire breadth of the electromagnetic spectrum: the Very Large Array, the Spitzer Space Telescope, the Hubble Space Telescope, the XMM-Newton Observatory, and the Chandra X-ray Observatory. Credits: NASA, ESA, NRAO/AUI/NSF and G. Dubner (University of Buenos Aires) #nasagoddard #space #science
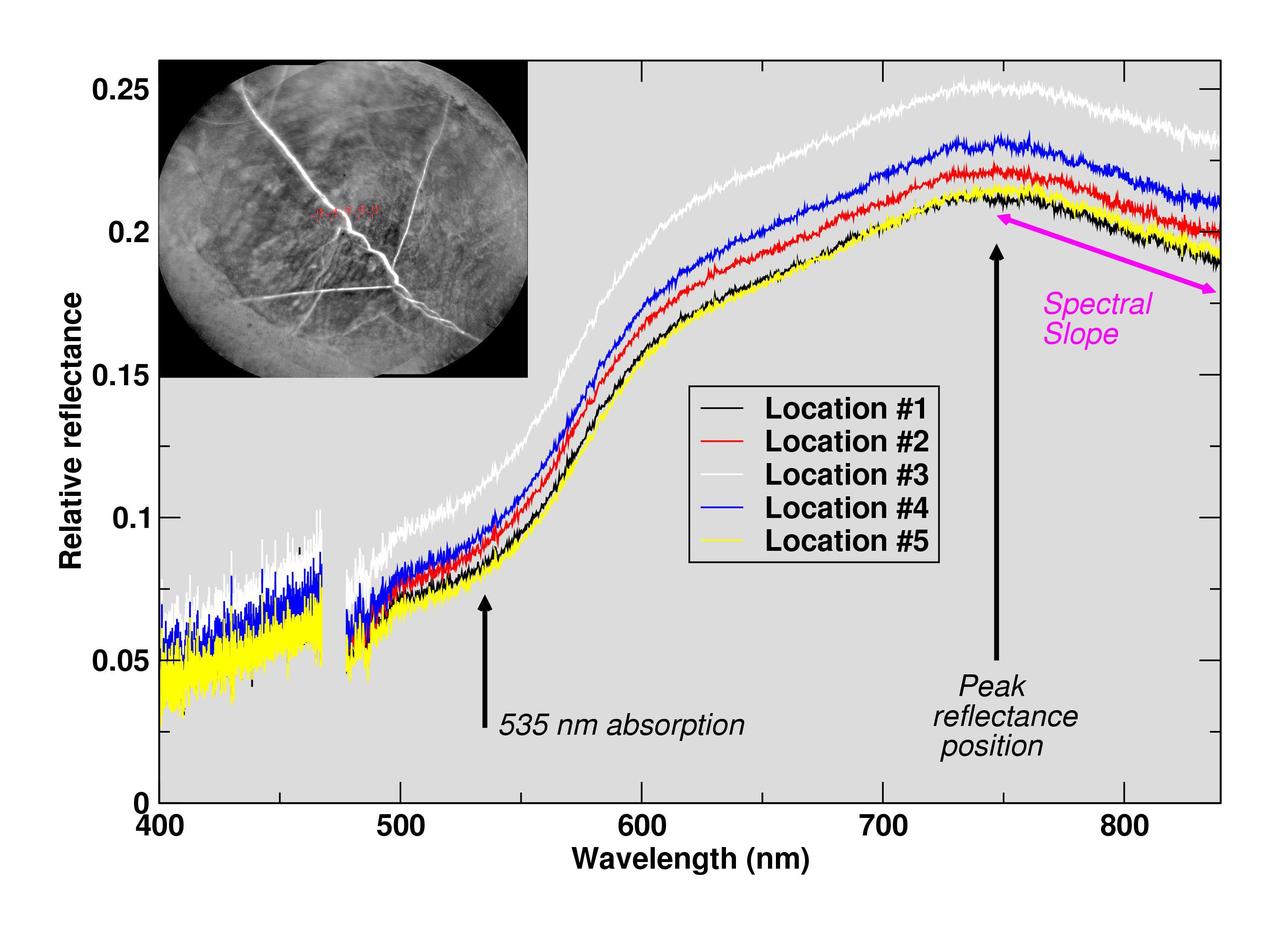
The Chemistry and Camera (ChemCam) instrument on NASA's Curiosity Mars rover examined a freshly brushed area on target rock "Christmas Cove" and found spectral evidence of hematite, an iron-oxide mineral. ChemCam sometimes zaps rocks with a laser, but can also be used, as in this case, in a "passive" mode. In this type of investigation, the instrument's telescope delivers to spectrometers the sunlight reflected from a small target point. The upper-left inset of this graphic is an image from ChemCam's Remote Micro-Imager with five labeled points that the instrument analyzed. The image covers an area about 2 inches (5 centimeters) wide, and the bright lines are fractures in the rock filled with calcium sulfate minerals. The five charted lines of the graphic correspond to those five points and show the spectrometer measurements of brightness at thousands of different wavelengths, from 400 nanometers (at the violet end of the visible-light spectrum) to 840 nanometers (in near-infrared). Sections of the spectrum measurements that are helpful for identifying hematite are annotated. These include a dip around 535 nanometers, the green-light portion of the spectrum at which fine-grained hematite tends to absorb more light and reflect less compared to other parts of the spectrum. That same green-absorbing characteristic of the hematite makes it appear purplish when imaged through special filters of Curiosity's Mast Camera and even in usual color images. The spectra also show maximum reflectance values near 750 nanometers, followed by a steep decrease in the spectral slope toward 840 nanometers, both of which are consistent with hematite. This ChemCam examination of Christmas Cove was part of an experiment to determine whether the rock had evidence of hematite under a tan coating of dust. The target area was brushed with Curiosity's Dust Removal Tool prior to these ChemCam passive observations on Sept. 17, 2017, during the 1,819th Martian day, or sol, of Curiosity's work on Mars. https://photojournal.jpl.nasa.gov/catalog/PIA22068
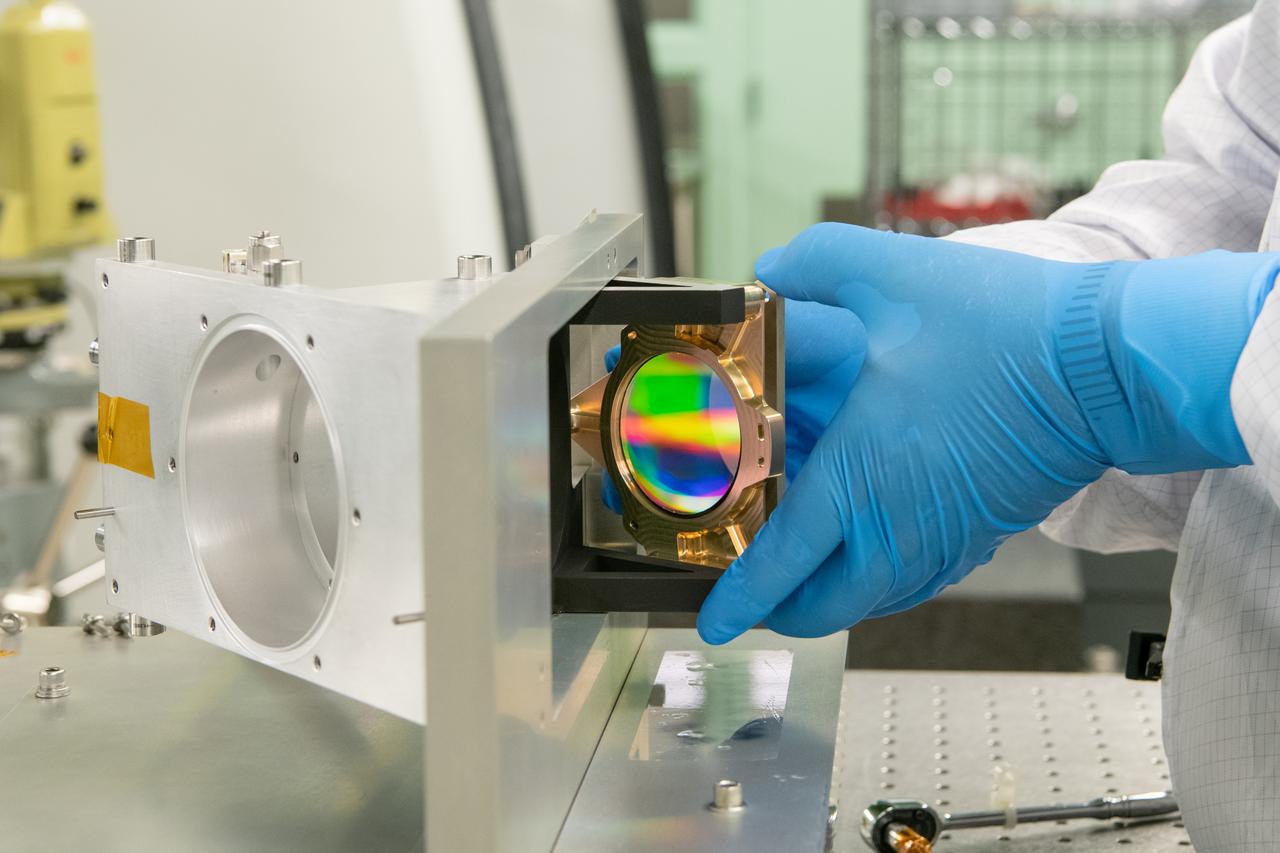
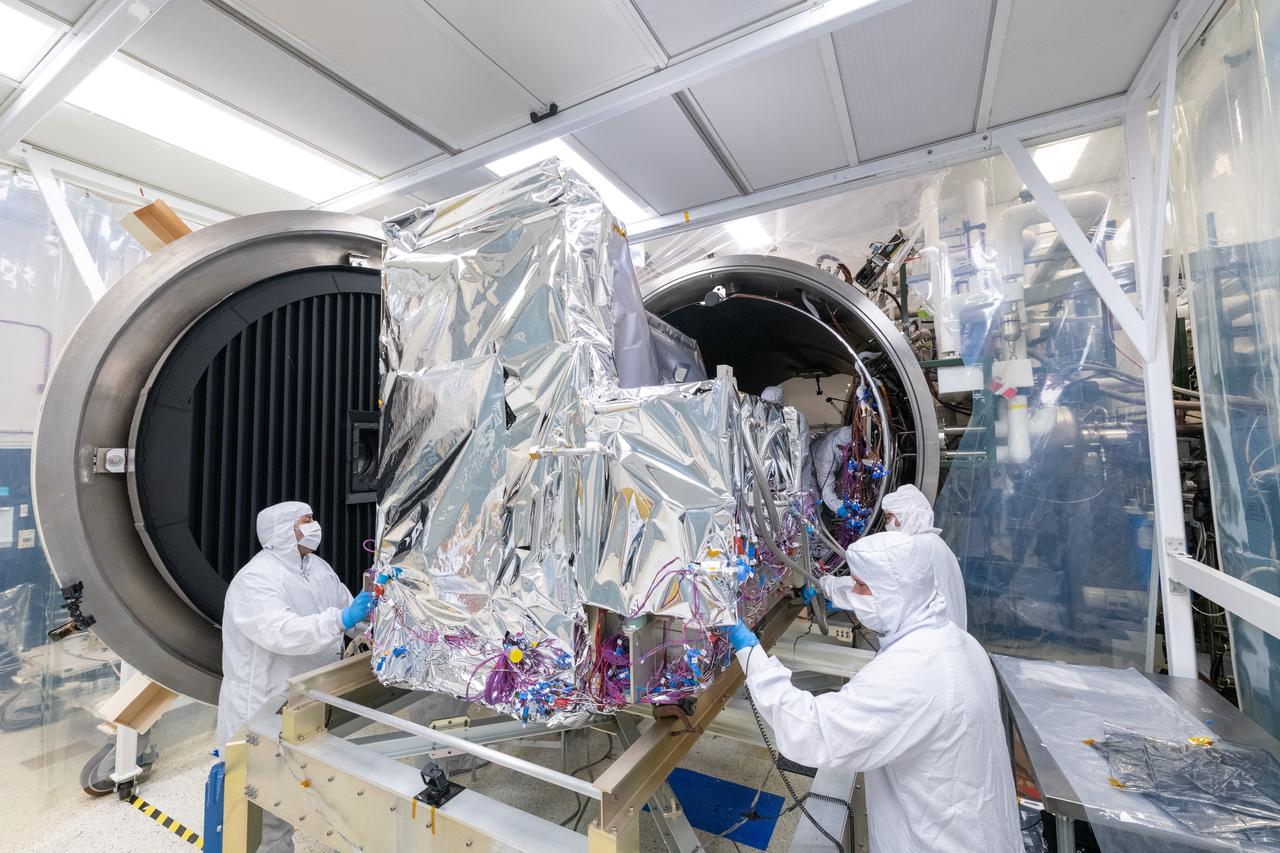
An Ocean Color Instrument (OCI) optical lens is installed into the flight housing hardware for alignment measurements. OCI is a highly advanced optical spectrometer that will be used to measure properties of light over portions of the electromagnetic spectrum. It will enable continuous measurement of light at finer wavelength resolution than previous NASA satellite sensors, extending key system ocean color data records for climate studies. OCI is PACE's (Plankton, Aerosol, Cloud, ocean Ecosystem) primary sensor built at Goddard Space Flight Center in Greenbelt, MD.
The Ocean Color Instrument (OCI) is installed on its transportation dolly and prepared for additional integration operations in a clean tent. OCI is a highly advanced optical spectrometer that will be used to measure properties of light over portions of the electromagnetic spectrum. It will enable continuous measurement of light at finer wavelength resolution than previous NASA satellite sensors, extending key system ocean color data records for climate studies. OCI is PACE's (Plankton, Aerosol, Cloud, ocean Ecosystem) primary sensor built at Goddard Space Flight Center in Greenbelt, MD.
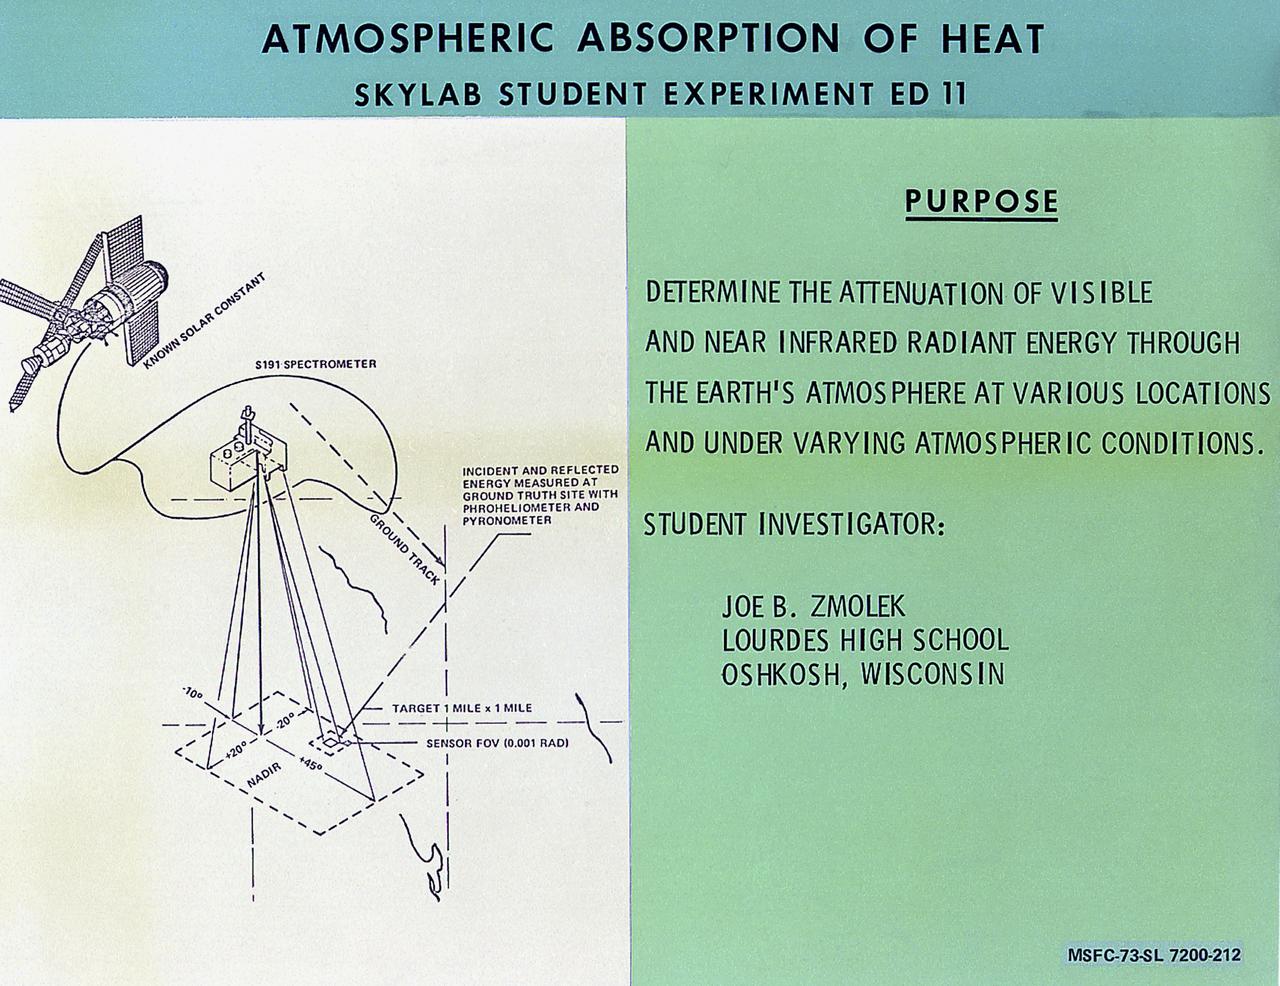
This chart describes the Skylab student experiment, Atmospheric Absorption of Heat, proposed by Joe B. Zmolek of Oshkosh, Wisconsin. This experiment utilized Skylab's Earth Resources Experiment spectrometers to determine the attenuation of radiant energy in the visible and near-infrared spectrums for both densely and sparsely populated areas. In March 1972, NASA and the National Science Teachers Association selected 25 experiment proposals for flight on Skylab. Science advisors from the Marshall Space Flight Center aided and assisted the students in developing the proposals for flight on Skylab.
Mechanical technicians crane lift the Ocean Color Instrument (OCI) onto the Tilt Mechanism. OCI is a highly advanced optical spectrometer that will be used to measure properties of light over portions of the electromagnetic spectrum. It will enable continuous measurement of light at finer wavelength resolution than previous NASA satellite sensors, extending key system ocean color data records for climate studies. OCI is PACE's (Plankton, Aerosol, Cloud, ocean Ecosystem) primary sensor built at Goddard Space Flight Center in Greenbelt, MD.
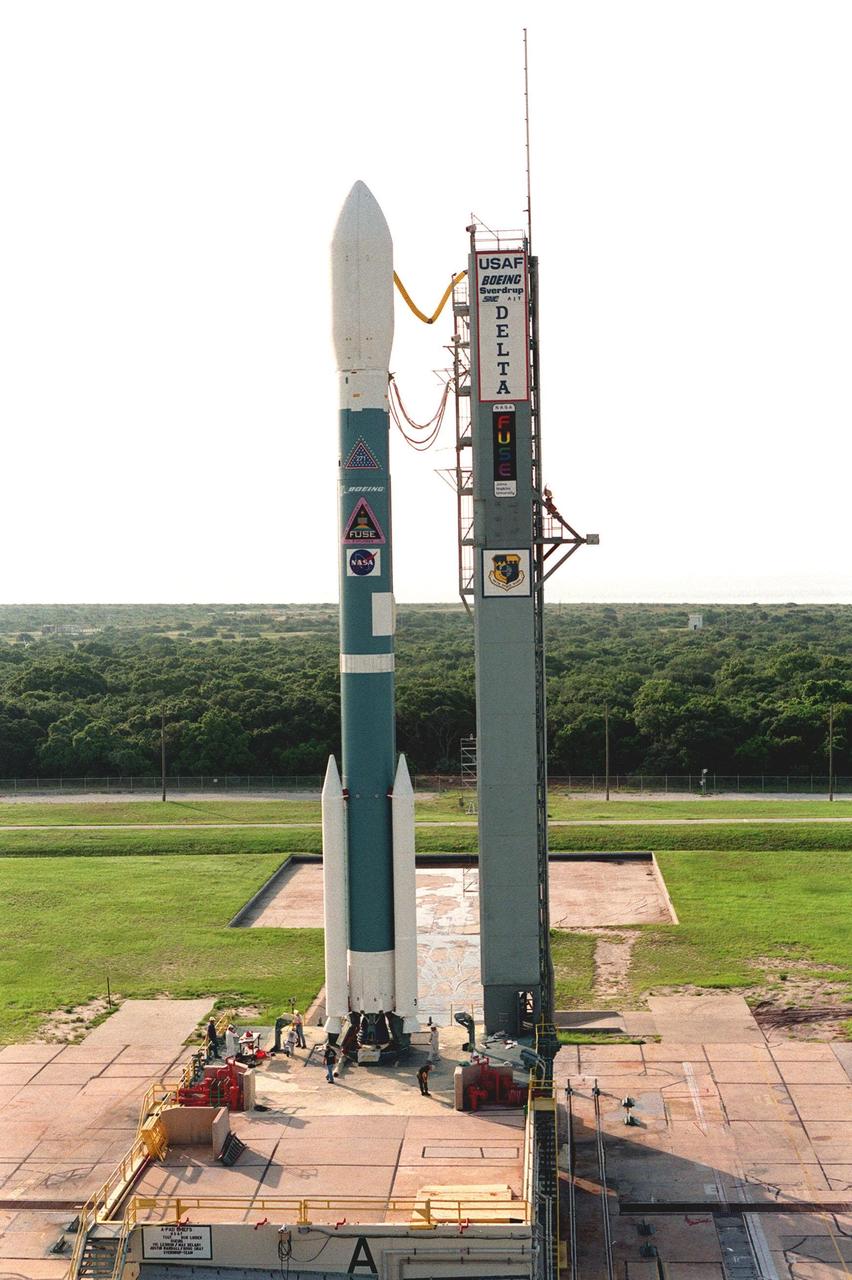
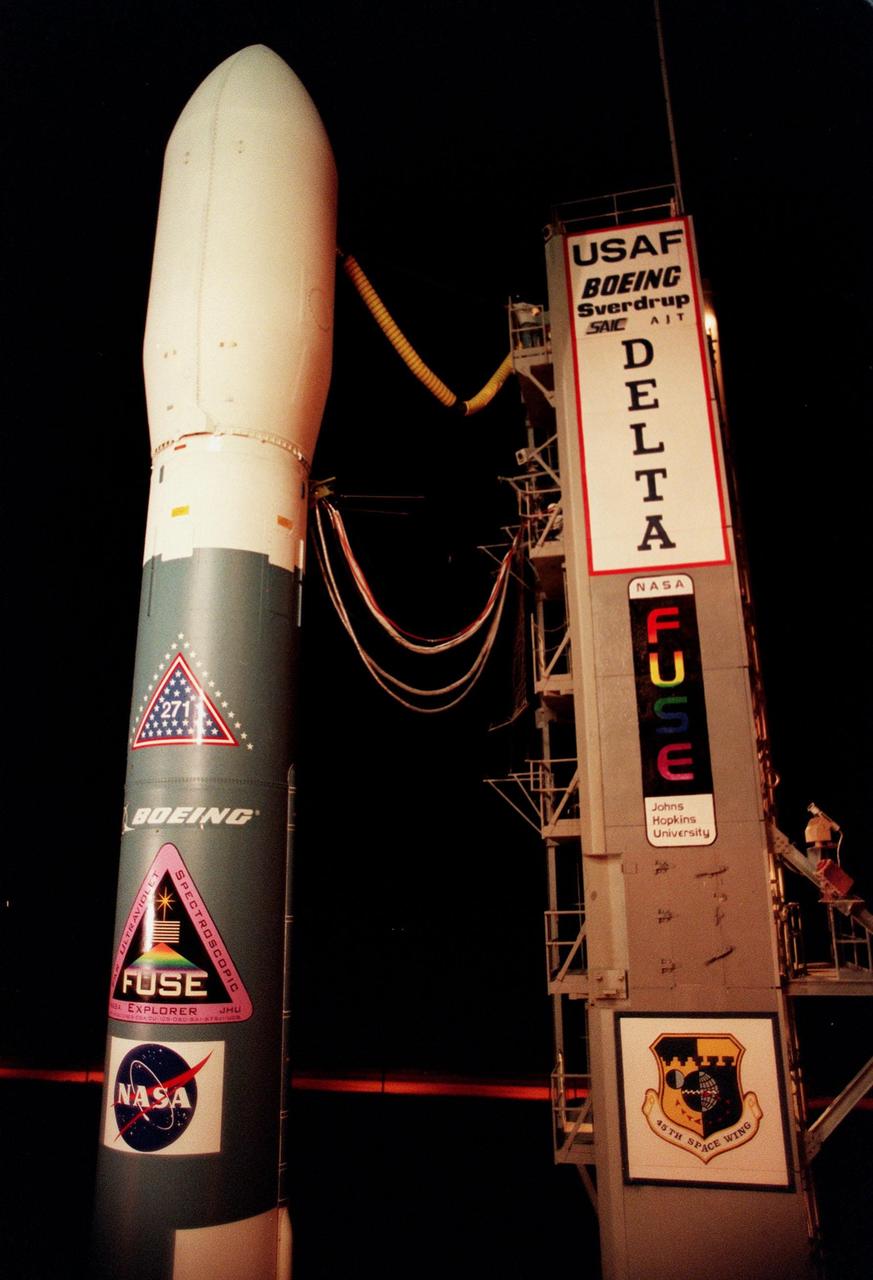
NASA's Far Ultraviolet Spectroscopic Explorer (FUSE) satellite sits on Launch Pad 17A, Cape Canaveral Air Station, aboard the Boeing Delta II rocket waiting for launch. Liftoff is scheduled for 11:39 a.m. EDT. FUSE was developed to investigate the origin and evolution of the lightest elements in the universe hydrogen and deuterium. In addition, the FUSE satellite will examine the forces and process involved in the evolution of the galaxies, stars and planetary systems by investigating light in the far ultraviolet portion of the electromagnetic spectrum
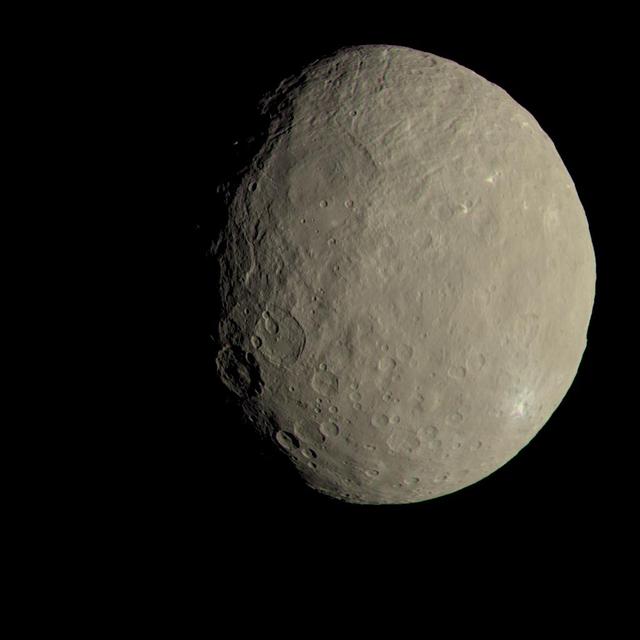
This image of Ceres approximates how the dwarf planet's colors would appear to the eye. This view of Ceres, produced by the German Aerospace Center in Berlin, combines images taken during Dawn's first science orbit in 2015 using the framing camera's red, green and blue spectral filters. The color was calculated using a reflectance spectrum, which is based on the way that Ceres reflects different wavelengths of light and the solar wavelengths that illuminate Ceres. http://photojournal.jpl.nasa.gov/catalog/PIA21079
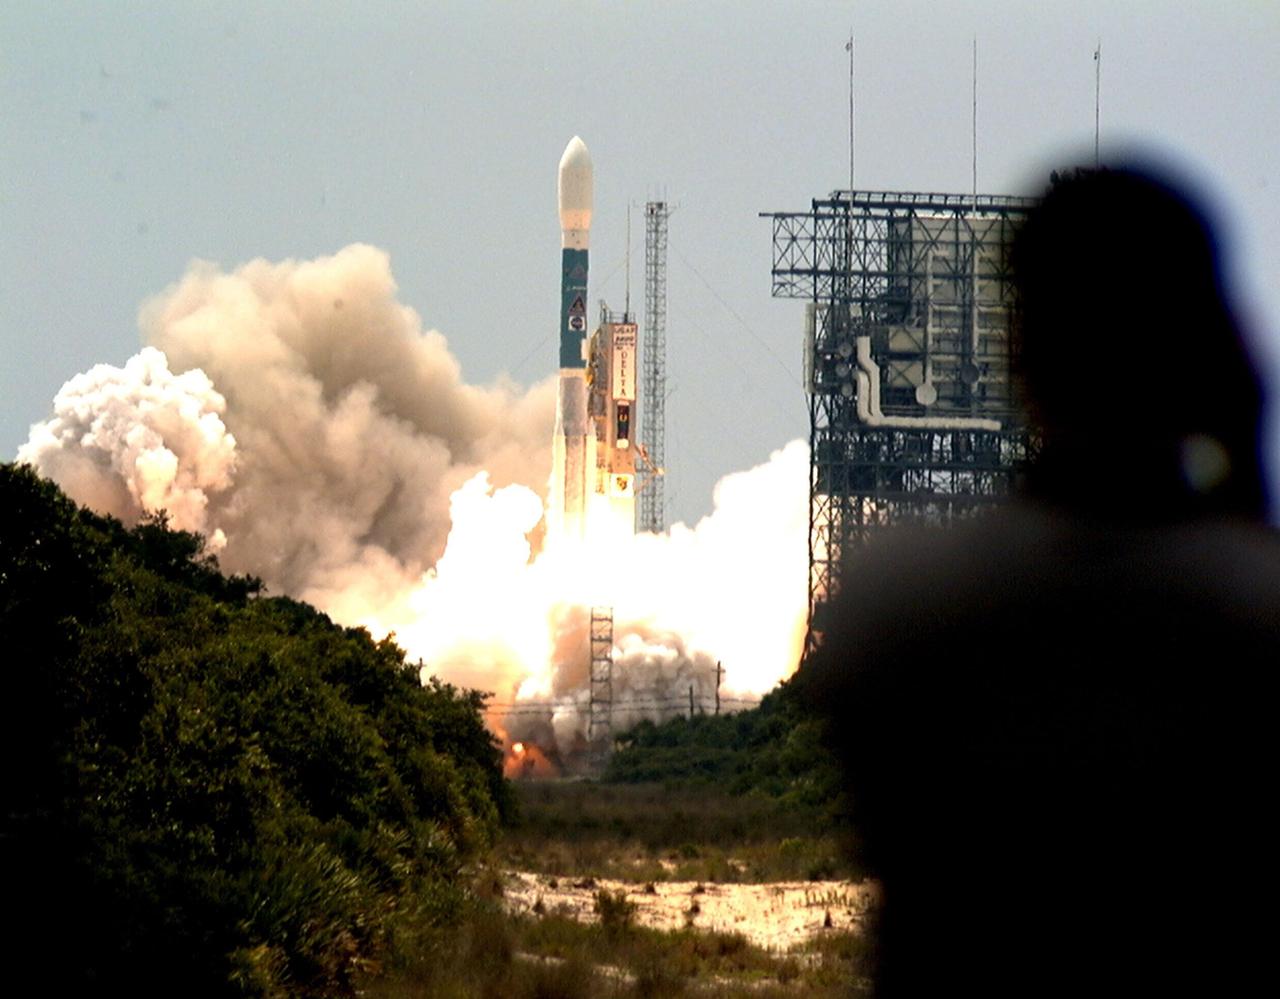
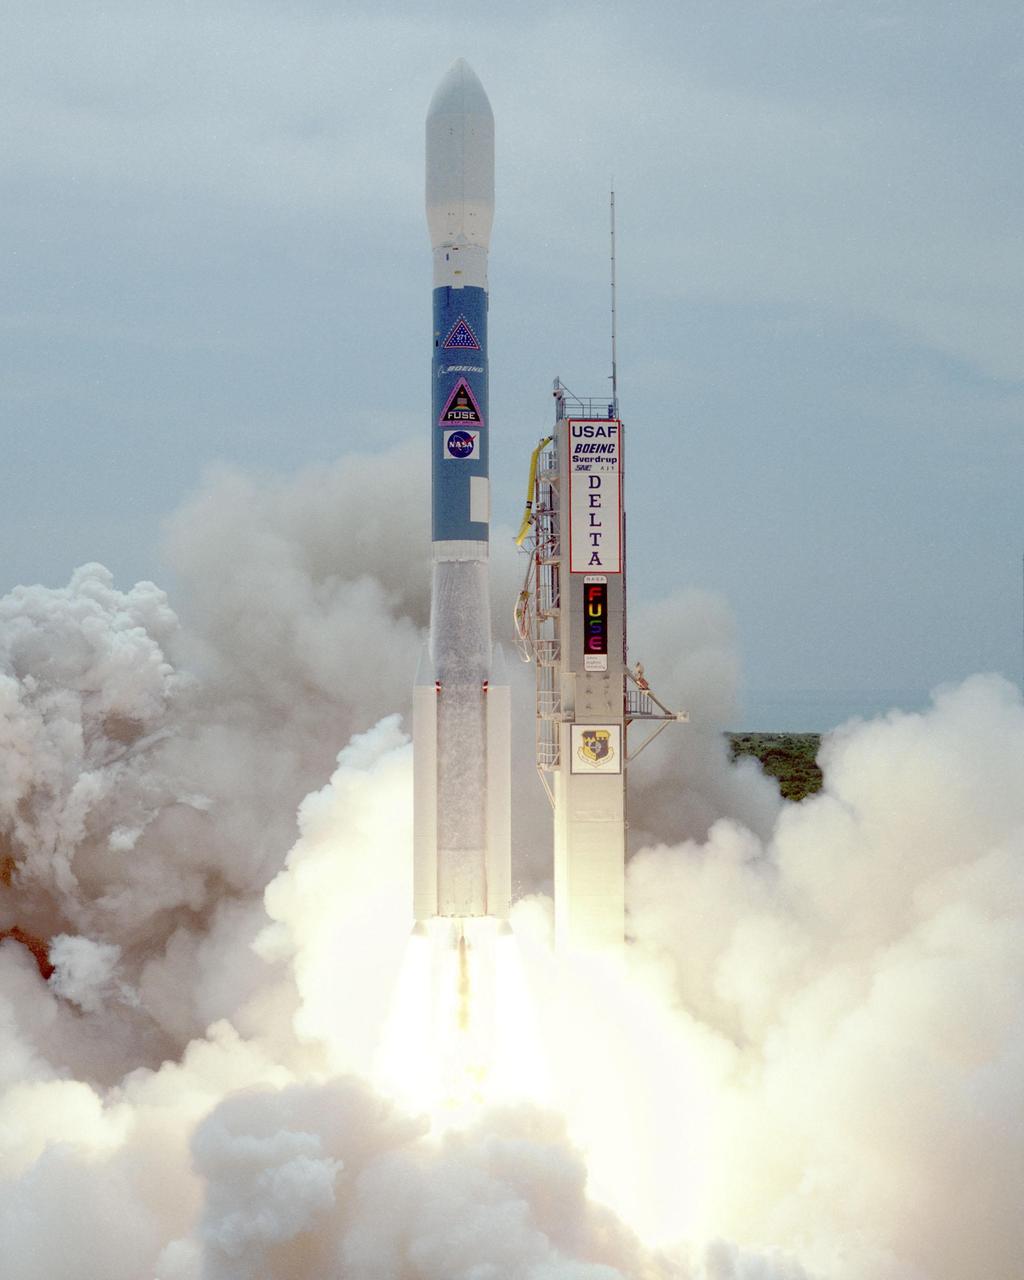
The shadow of a photographer (right) is caught watching the perfect launch of the Boeing Delta II rocket in the background after it lifted off at 11:44 a.m. EDT. The rocket carries NASA's Far Ultraviolet Spectroscopic Explorer (FUSE) satellite, which was developed to investigate the origin and evolution of the lightest elements in the universe hydrogen and deuterium. In addition, the FUSE satellite will examine the forces and process involved in the evolution of the galaxies, stars and planetary systems by investigating light in the far ultraviolet portion of the electromagnetic spectrum
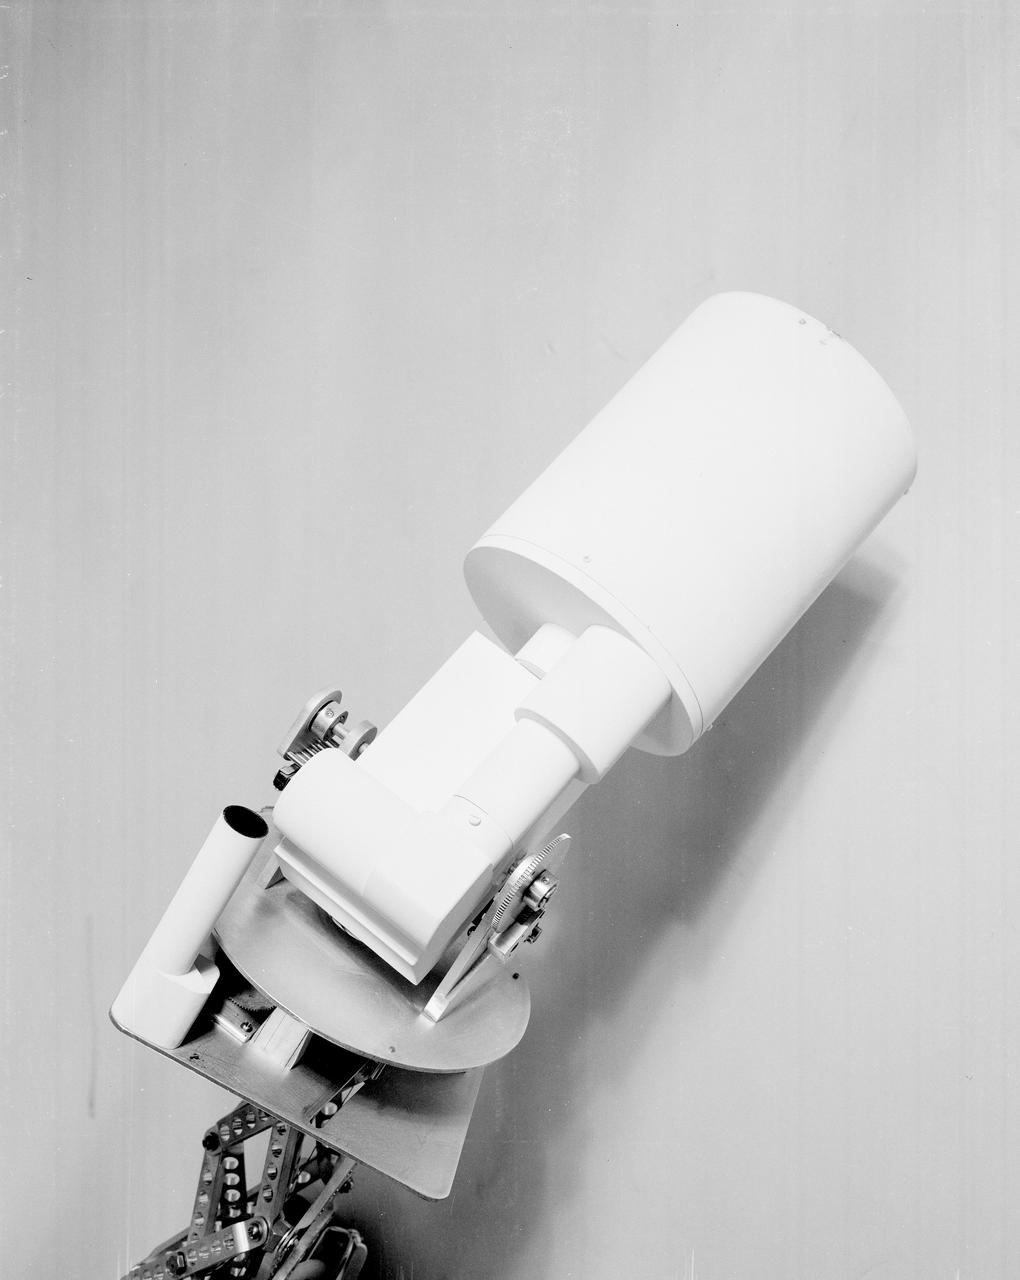
The Apollo Telescope Mount (ATM), designed and developed by the Marshall Space Flight Center, served as the primary scientific instrument unit aboard the Skylab. The ATM contained eight complex astronomical instruments designed to observe the Sun over a wide spectrum from visible light to x-rays. This photo depicts a mockup of the ATM contamination monitor camera and photometer.
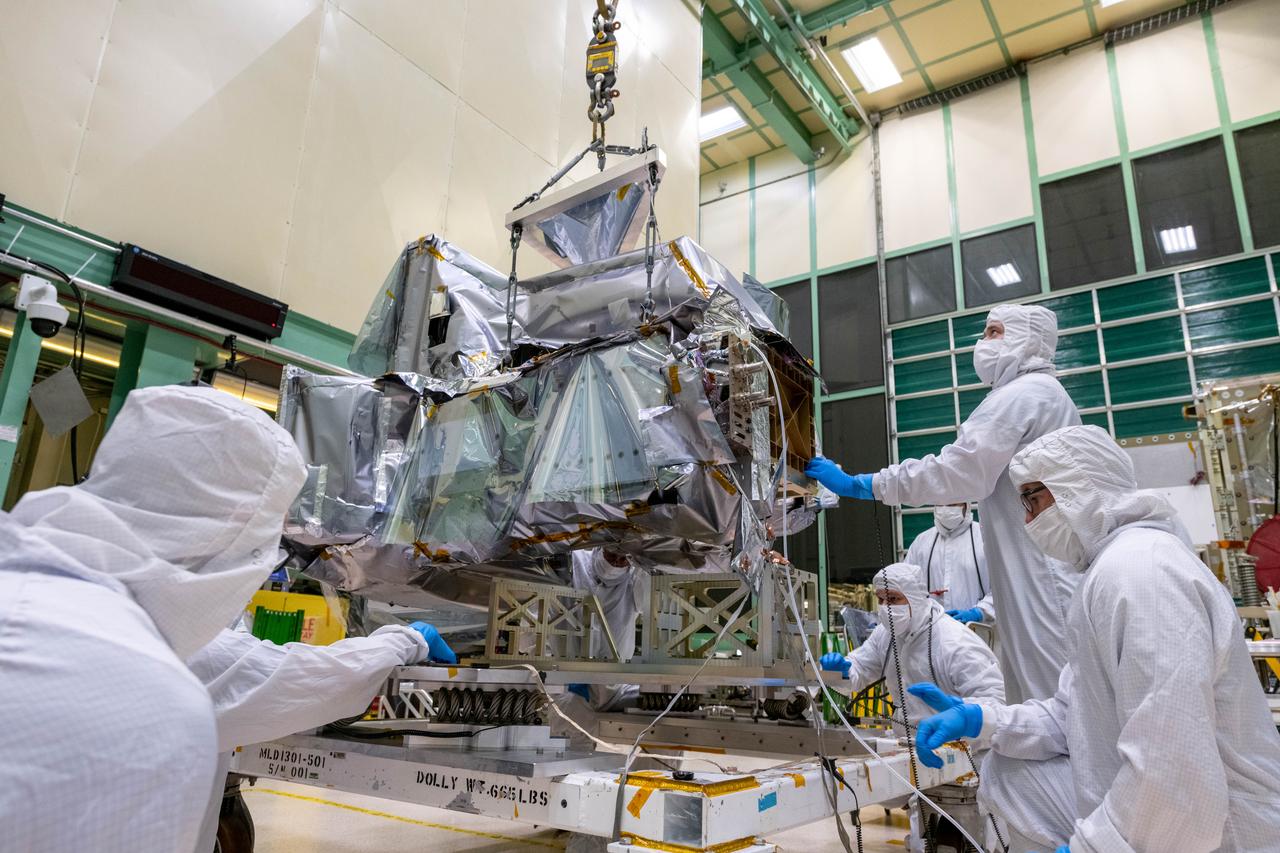
Mechanical technicians crane lift the Ocean Color Instrument (OCI) off of the transportation dolly. OCI is a highly advanced optical spectrometer that will be used to measure properties of light over portions of the electromagnetic spectrum. It will enable continuous measurement of light at finer wavelength resolution than previous NASA satellite sensors, extending key system ocean color data records for climate studies. OCI is PACE's (Plankton, Aerosol, Cloud, ocean Ecosystem) primary sensor built at Goddard Space Flight Center in Greenbelt, MD.
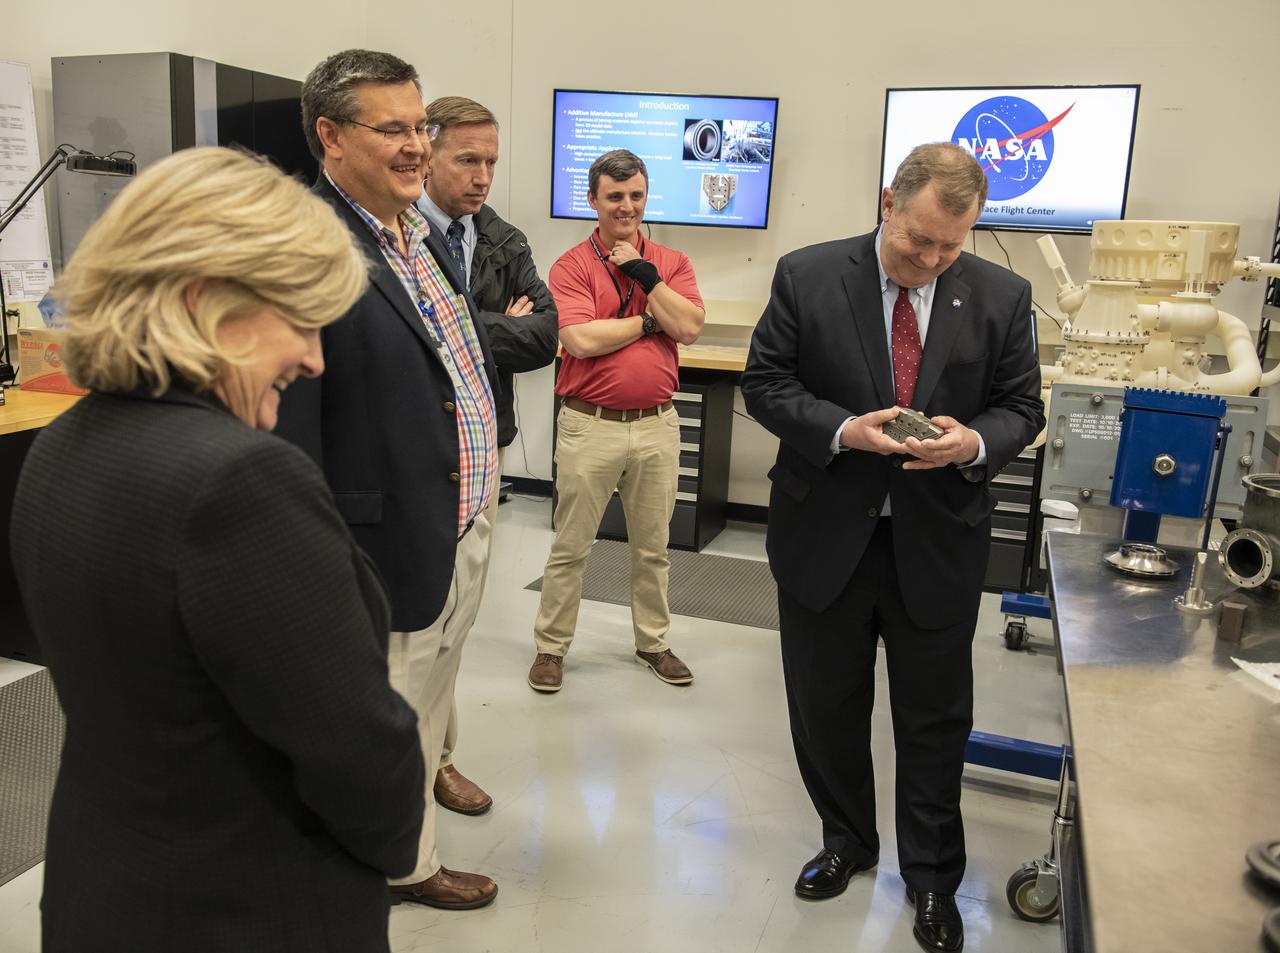
NASA Deputy Administrator James Morhard, right, tours Marshall's Additive Manufacturing Facility with, from left, Marshall Director Jody Singer; Larry Leopard, director of the Engineering Directorate; Marshall Associate Director Steve Miley; and Michael Allison, lead systems engineer for additive manufacturing assembly and integration. Morhard visited Marshall facilities to see first-hand the broad spectrum of engineering, science and exploration work here.
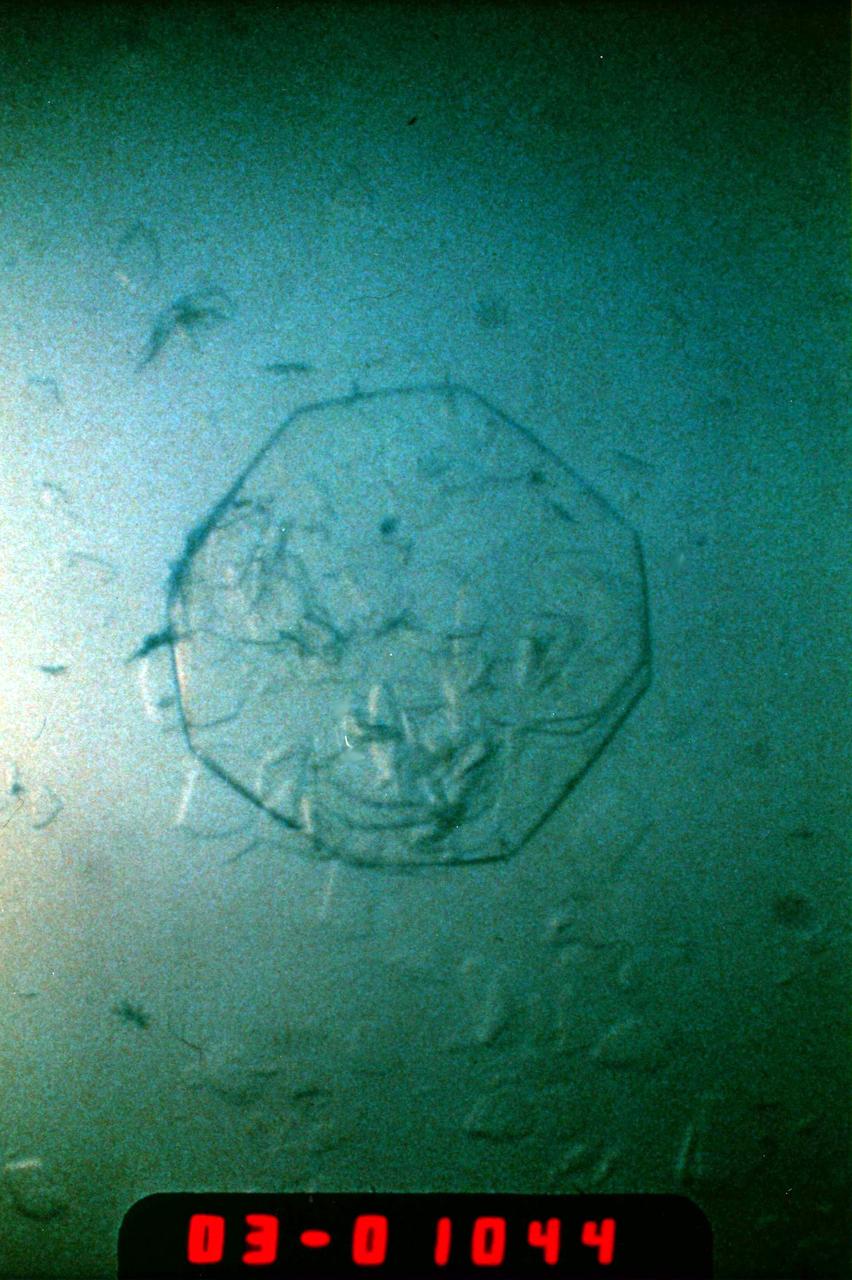
(PCG) Protein Crystal Growth Human Serum Albumin. Contributes to many transport and regulatory processes and has multifunctional binding properties which range from various metals, to fatty acids, hormones, and a wide spectrum of therapeutic drugs. The most abundant protein of the circulatory system. It binds and transports an incredible variety of biological and pharmaceutical ligands throughout the blood stream. Principal Investigator on STS-26 was Larry DeLucas.
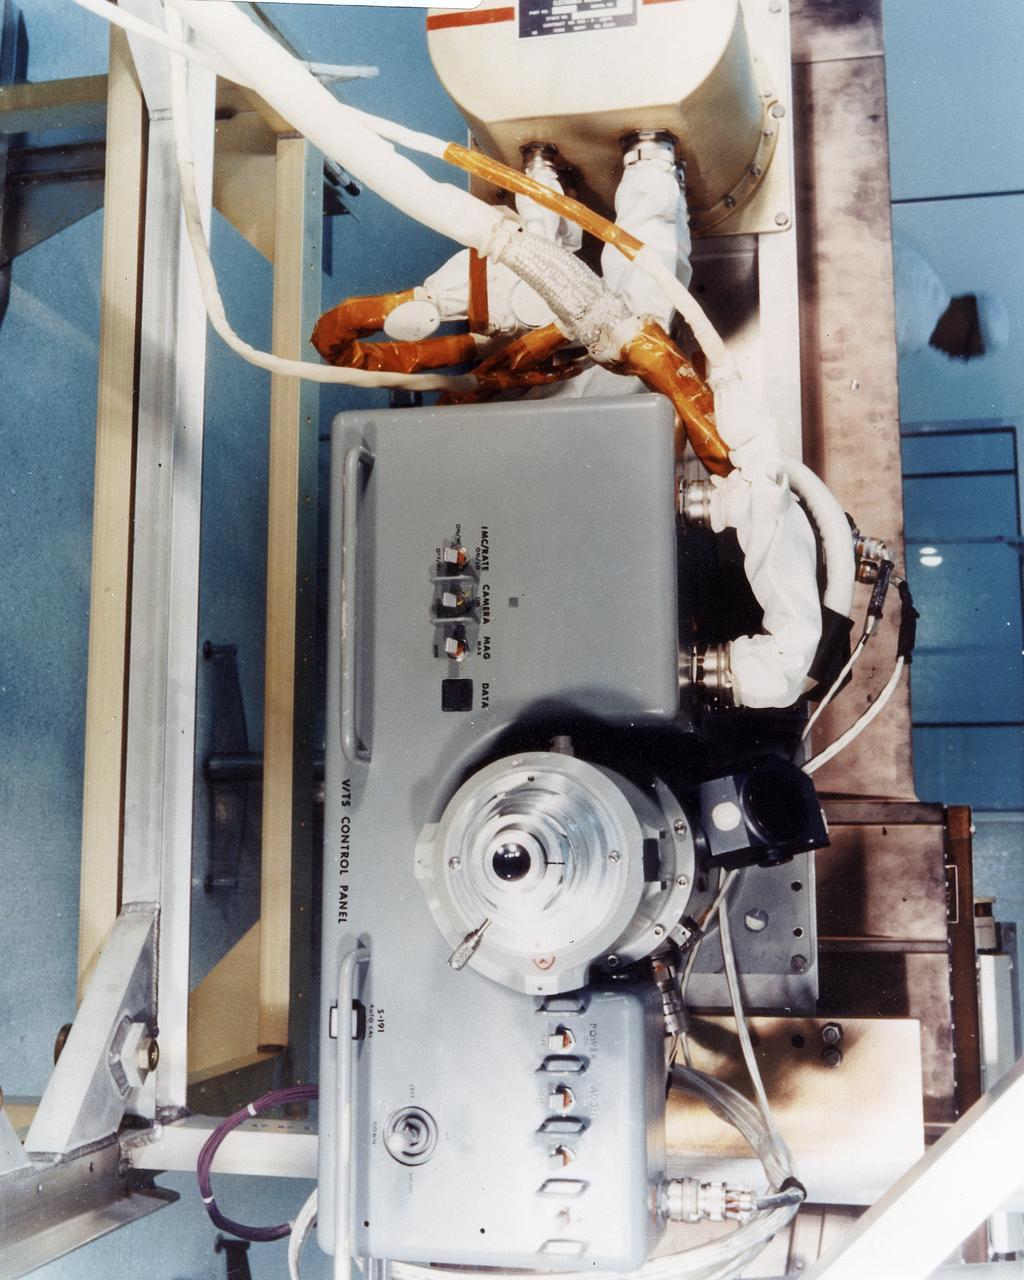
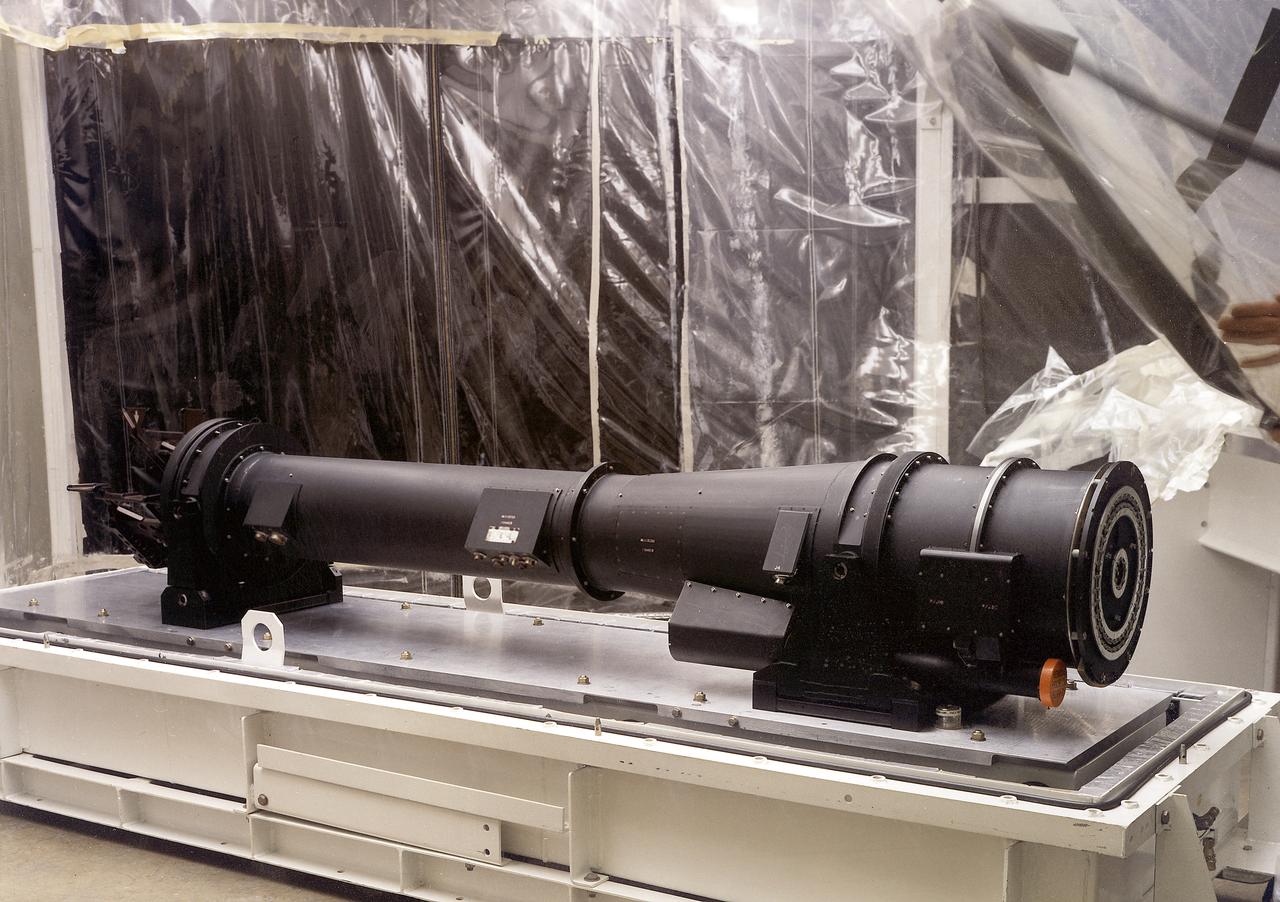
This 1970 photograph shows Skylab's Infrared Spectrometer Viewfinder Tracking System, a major component of an Earth Resources Experiment Package (EREP). It was designed to evaluate Earth resources sensors for specific regions of the the visible and infrared spectra and assess the value of real time identification of ground sites. The overall purpose of the EREP was to test the use of sensors that operated in the visible, infrared, and microwave portions of the electromagnetic spectrum to monitor and study Earth resources. The Marshall Space Flight Center had program management responsibility for the development of Skylab hardware and experiments.
As light peers over the horizon at the crack of dawn, NASA's Far Ultraviolet Spectroscopic Explorer (FUSE) satellite waits for launch on Launch Pad 17A, Cape Canaveral Air Station, aboard the Boeing Delta II rocket. Liftoff is scheduled for 11:39 a.m. EDT. FUSE was developed to investigate the origin and evolution of the lightest elements in the universe hydrogen and deuterium. In addition, the FUSE satellite will examine the forces and process involved in the evolution of the galaxies, stars and planetary systems by investigating light in the far ultraviolet portion of the electromagnetic spectrum

This chart describes the Skylab student experiment Ultraviolet (UV) from Quasars, proposed by John C. Hamilton of Aiea, Hawaii. This experiment utilized Skylab's Ultraviolet Stellar Astronomy equipment to photograph quasars in the UV spectrum and compare those images to existing radio and visible data. In March 1972 NASA and the National Science Teachers Association selected 25 experiment proposals for flight on Skylab. Science advisors from the Marshall Space Flight Center aided and assisted the students in developing the proposals for flight on Skylab.
The Apollo Telescope Mount (ATM), designed and developed by the Marshall Space Flight Center, served as the primary scientific instrument unit aboard the Skylab. The ATM contained eight complex astronomical instruments designed to observe the Sun over a wide spectrum from visible light to x-rays. This photo depicts a side view is of a fully extended ATM contamination monitor mockup.
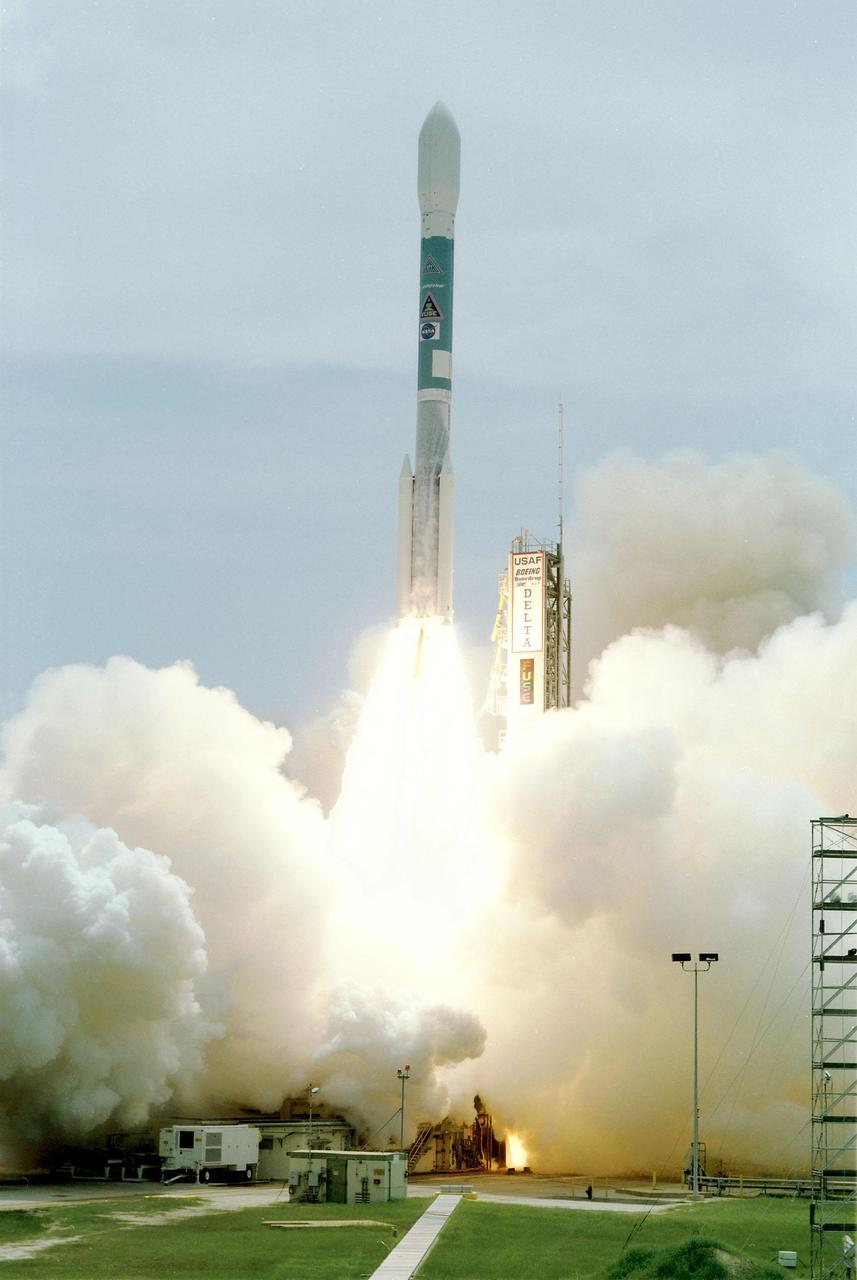
The Boeing Delta II rocket carrying NASA's Far Ultraviolet Spectroscopic Explorer (FUSE) satellite clears the tower after liftoff at 11:44 a.m. EDT from Launch Pad 17A, Cape Canaveral Air Station. FUSE was developed to investigate the origin and evolution of the lightest elements in the universe hydrogen and deuterium. In addition, the FUSE satellite will examine the forces and process involved in the evolution of the galaxies, stars and planetary systems by investigating light in the far ultraviolet portion of the electromagnetic spectrum

This 1970 photograph shows the flight unit for Skylab's White Light Coronagraph, an Apollo Telescope Mount (ATM) facility that photographed the solar corona in the visible light spectrum. A TV camera in the instrument provided real-time pictures of the occulted Sun to the astronauts at the control console and also transmitted the images to the ground. The Marshall Space Flight Center had program management responsibility for the development of Skylab hardware and experiments.

Phillip Stallcup with Agilent Technologies in Huntsville, Ala., talks with NASA employees Leslie Ladner (l) and Kelly Sullivan about spectrum analyzers and other test equipment during the Stennis Technology Expo on May 26. The expo was hosted by NASA Solutions for Enterprise-Wide Procurement and featured various exhibitors demonstrating the latest in a range of technologies, such as training equipment, secure data storage, video networks, distance learning and data management.
Clouds of smoke and steam billow around the Boeing Delta II rocket as it roars into the sky after liftoff at 11:44 a.m. EDT from Launch Pad 17A, Cape Canaveral Air Station. The rocket is carrying NASA's Far Ultraviolet Spectroscopic Explorer (FUSE) satellite. FUSE was developed to investigate the origin and evolution of the lightest elements in the universe hydrogen and deuterium. In addition, the FUSE satellite will examine the forces and process involved in the evolution of the galaxies, stars and planetary systems by investigating light in the far ultraviolet portion of the electromagnetic spectrum

This animation shows the overlap of the field of view of Juno's Stellar Reference Unit (SRU) star camera (in yellow) and Juno's Microwave Radiometer (MWR) Antenna-1 beam (in red). The animation depicts Juno flying over Jupiter's North pole where the planet's massive northern aurora is located. Juno observes Jupiter's lightning using multiple instruments which detect lightning at different parts of its spectrum. Animation avaiable at https://photojournal.jpl.nasa.gov/catalog/PIA22967
The Apollo Telescope Mount (ATM), designed and developed by the Marshall Space Flight Center, served as the primary scientific instrument unit aboard the Skylab. The ATM contained eight complex astronomical instruments designed to observe the Sun over a wide spectrum from visible light to x-rays. This angle view is of an ATM contamination monitor meter mockup.
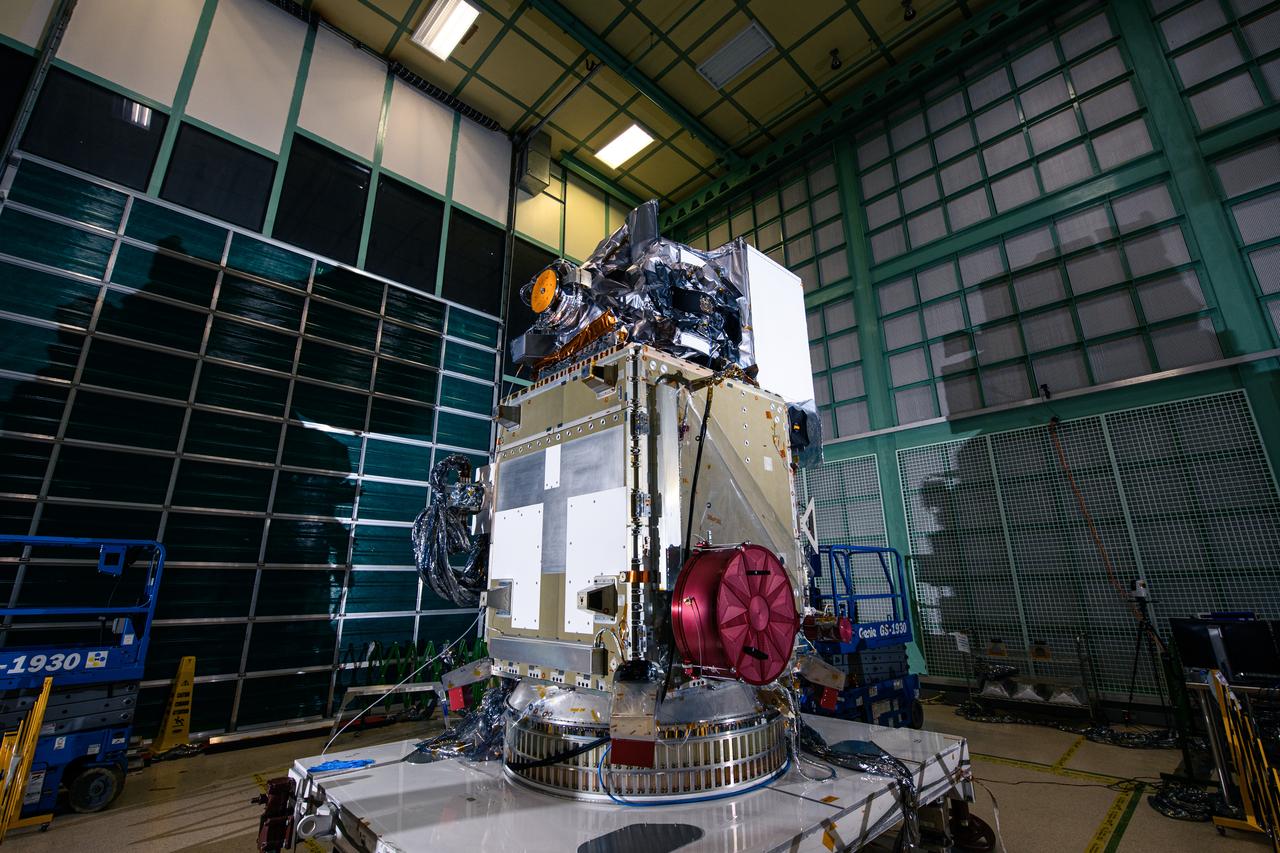
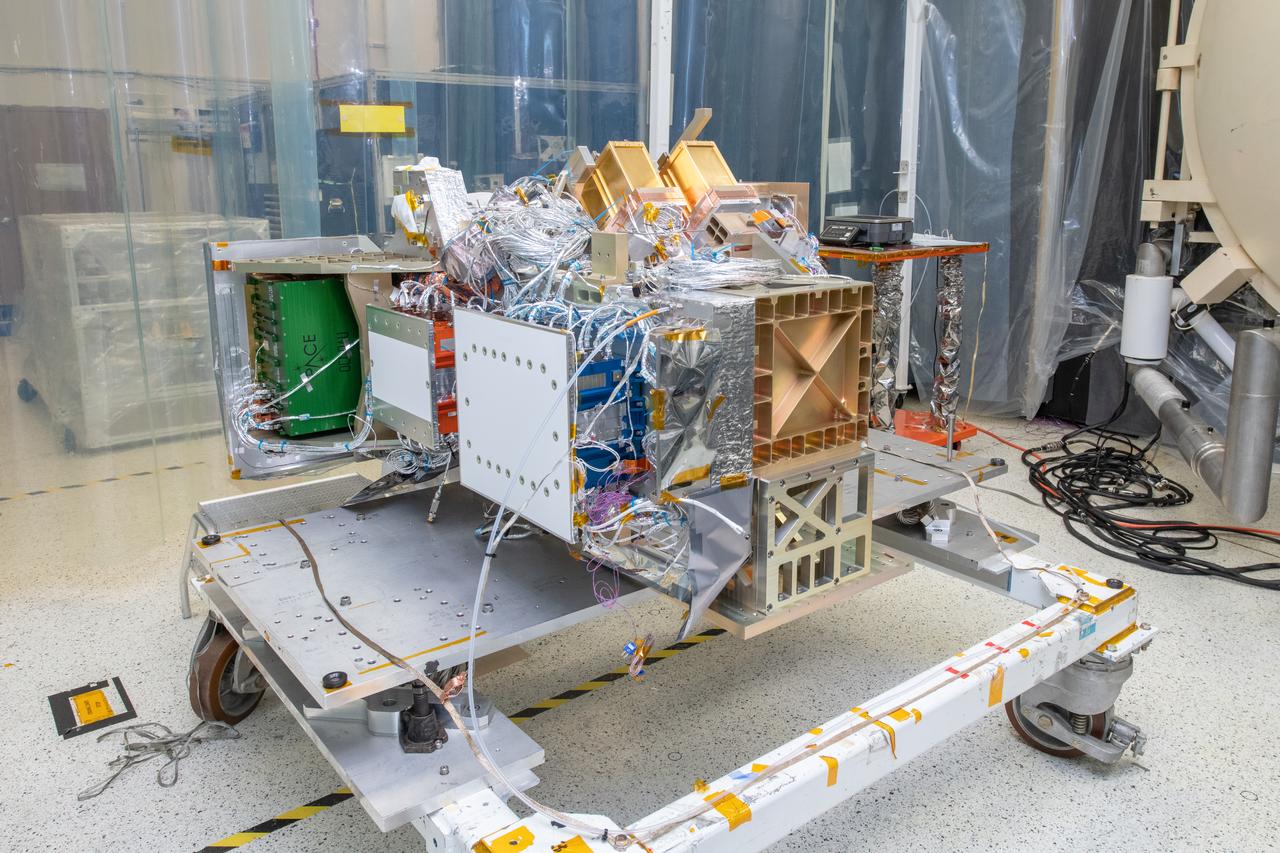
The Ocean Color Instrument (OCI) is installed on the Plankton, Aerosol, Cloud, ocean Ecosystem (PACE) observatory spacecraft. OCI is a highly advanced optical spectrometer that will be used to measure properties of light over portions of the electromagnetic spectrum. It will enable continuous measurement of light at finer wavelength resolution than previous NASA satellite sensors, extending key system ocean color data records for climate studies. OCI is PACE's primary sensor built at Goddard Space Flight Center in Greenbelt, MD.
This 1970 photograph shows Skylab's Microwave Radiometer/Scatterometer and Altimeter, one of the major components for an Earth Resources Experiment Package (EREP). It was designed to study varying ocean surface, soil erosion, sea and lake ice, snow cover, seasonal vegetational changes, flooding, rainfall and soil types. The overall purpose of the EREP was to test the use of sensors that operated in the visible, infrared, and microwave portions of the electromagnetic spectrum to monitor and study Earth resources. The Marshall Space Flight Center had program management responsibility for the development of Skylab hardware and experiments.
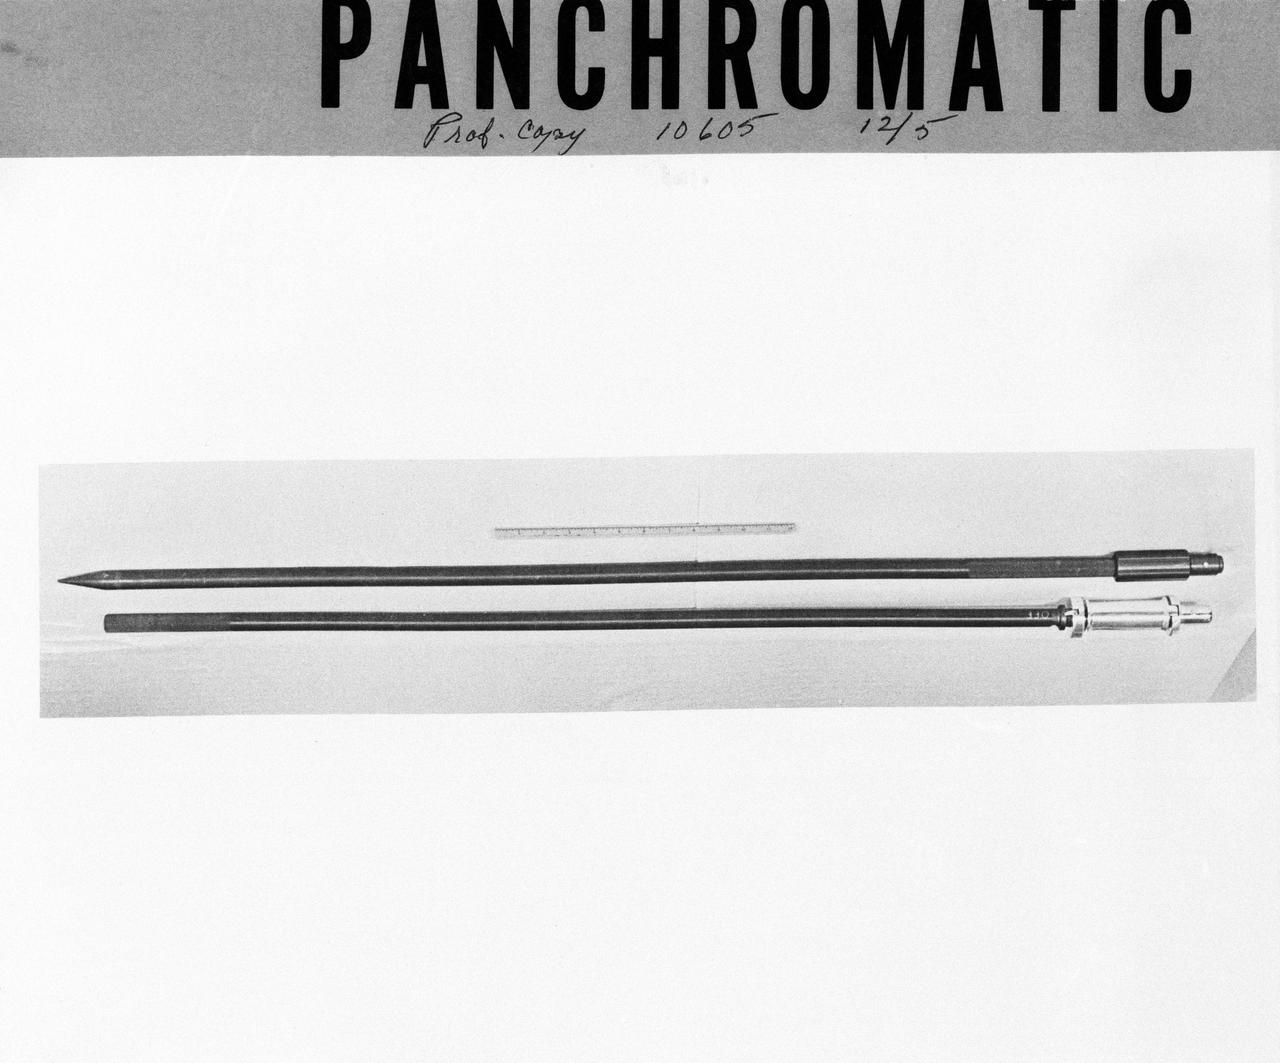
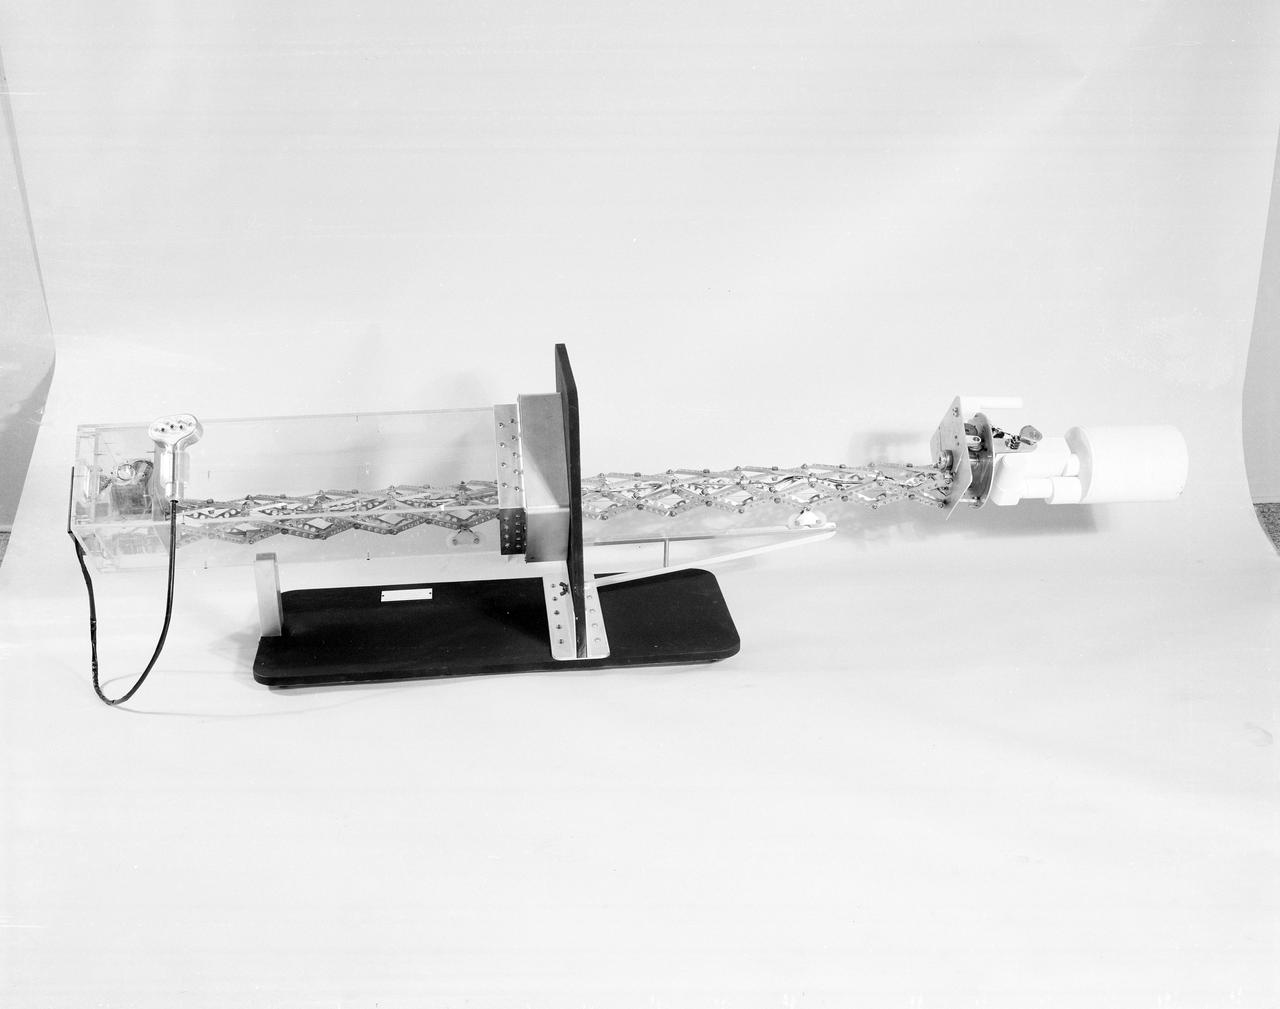
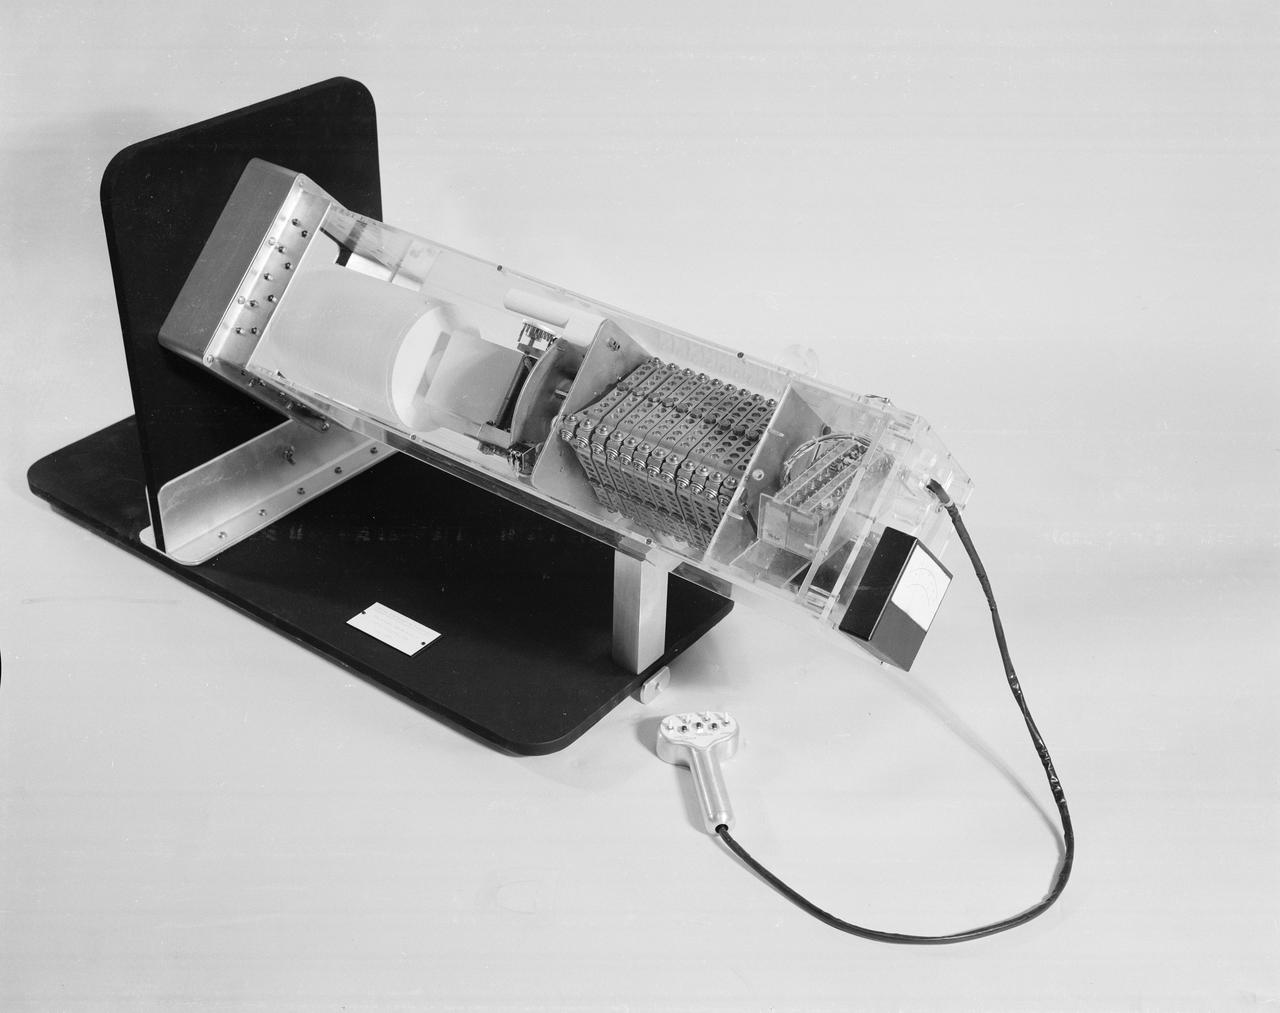
S72-53949 (November 1972) --- The upper and bottom sections of the Lunar Neutron Probe Experiment (S-229), in a stowed configuration, which will be used at the Taurus-Littrow landing site by the Apollo 17 crewmen. The purpose of this experiment is to measure neutron capture rates in the lunar regolith, measure variation of neutron capture rates as a function of depth beneath the lunar surface, and gain information on the lunar neutron energy spectrum.

ISS045E014236 (09/17/2015) – A Japanese Small Satellite is deployed from outside the Japanese Experiment Module on Sept. 17, 2015. Two satellites were sent into Earth orbit by the Small Satellite Orbital Deployer. The first satellite is designed to observe the Ultraviolet (UV) spectrum during the Orionid meteor shower in October. The second satellite, sponsored by the University of Brasilia and the Brazilian government, focuses on meteorological data collection.

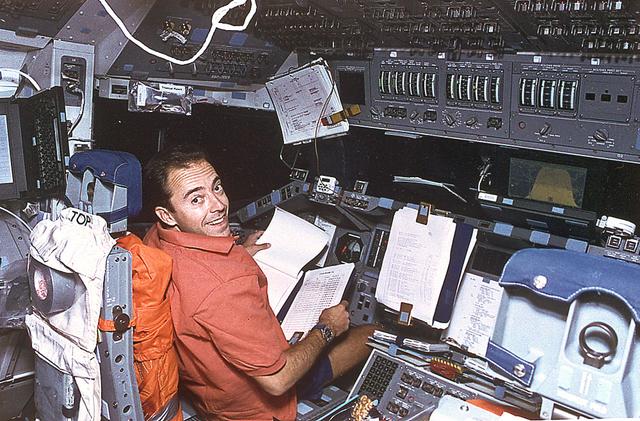
STS009-123-340 (28 Nov 1983) --- Astronaut Owen K. Garriott, STS-9 mission specialist, left, and Ulf Merbold, payload specialist, take a break from monitoring experimentation aboard Spacelab to be photographed. Dr. Garriott, holds in his left hand a data/log book for the solar spectrum experiment. Dr. Merbold, holds a map in his left hand for the monitoring of ground objectives of the metric camera.
The Apollo Telescope Mount (ATM), designed and developed by the Marshall Space Flight Center, served as the primary scientific instrument unit aboard the Skylab. The ATM contained eight complex astronomical instruments designed to observe the Sun over a wide spectrum from visible light to x-rays. This photo of the ATM contamination monitor mockup offers an extended view of the sunshield interior.
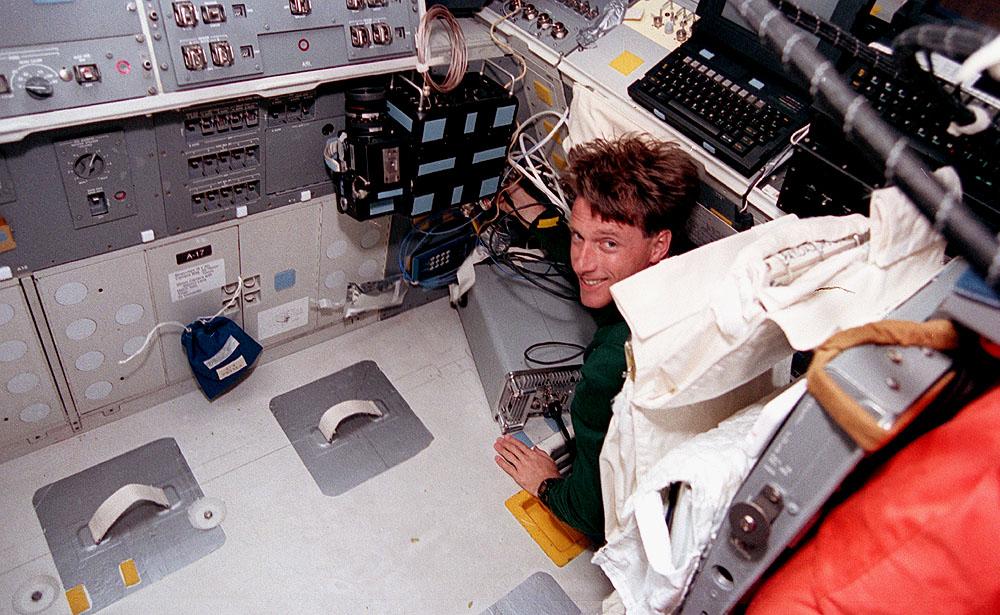
STS093-347-027 (23-27 July 1999) --- Astronauts Steven A. Hawley (left) and Michel Tognini, mission specialists, are pictured with the Southwest Ultraviolet Imaging System (SWUIS) on the middeck of the Space Shuttle Columbia. SWUIS was used during the mission to image planets and other solar system bodies in order to explore their atmospheres and surfaces in ultraviolet (UV) region of the spectrum, which astronomers value for diagnostic work. Tognini represents the Centre National d'Etudes Spatiales (CNES) of France.
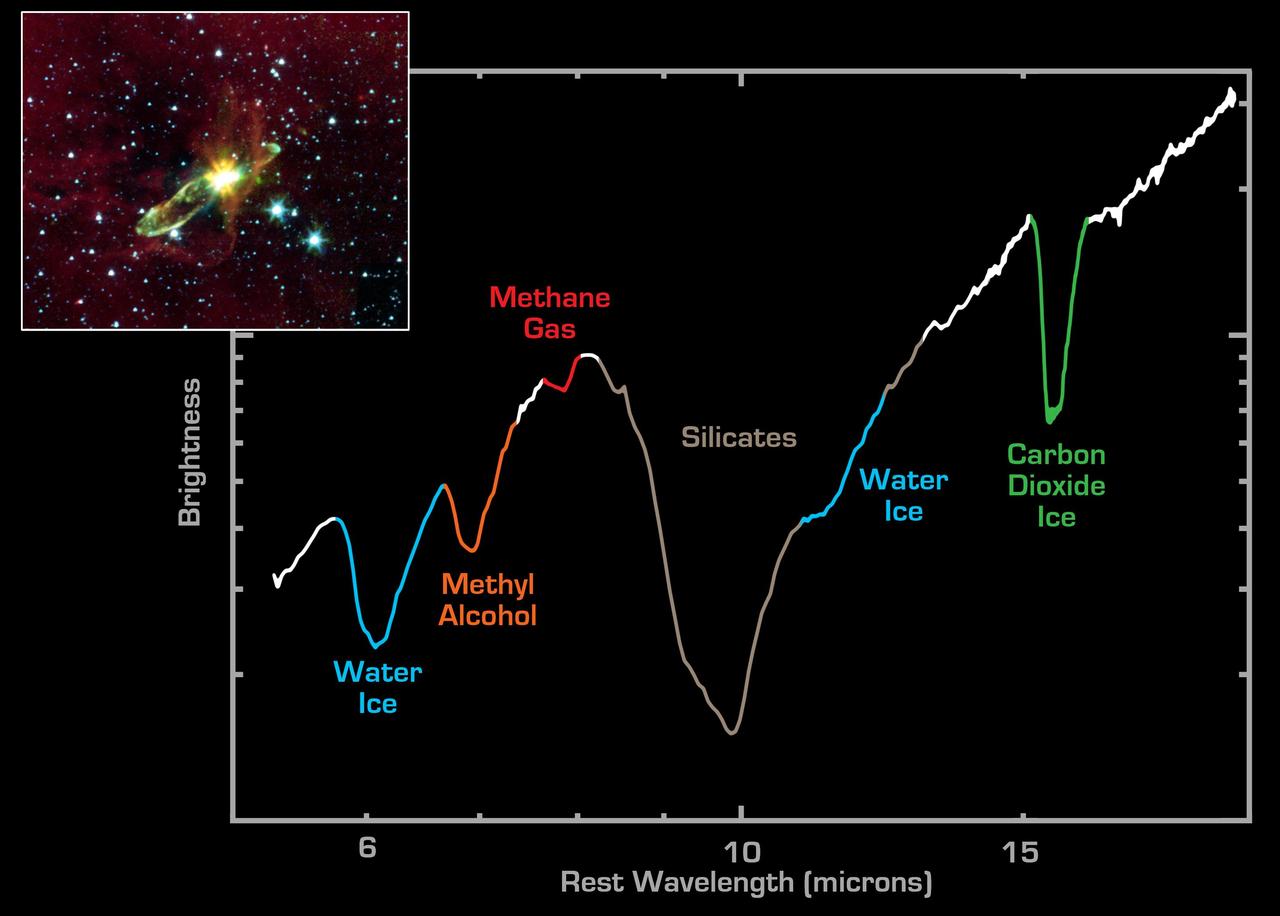
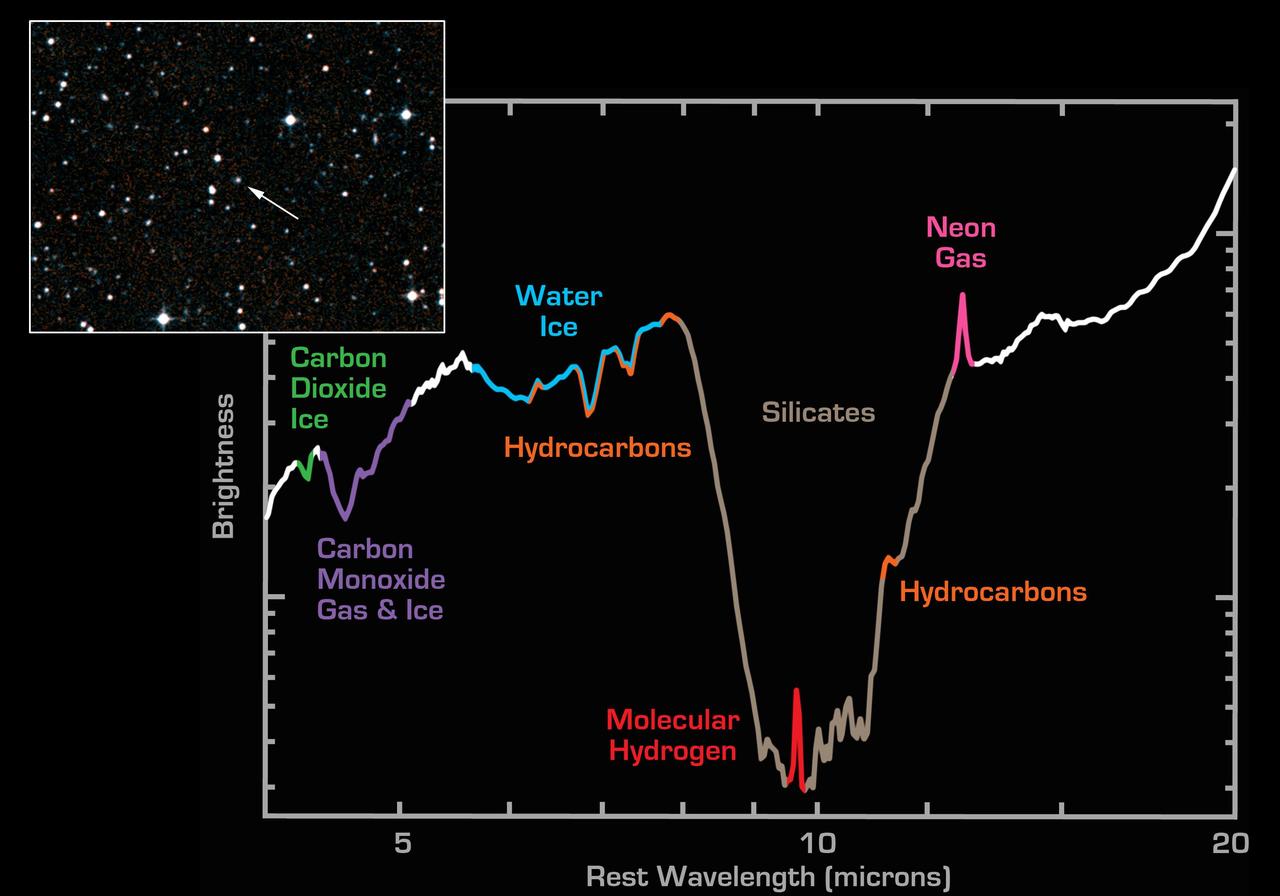
NASA Spitzer Space Telescope has lifted the cosmic veil to see an otherwise hidden newborn star, while detecting the presence of water and carbon dioxide ices, as well as organic molecules.
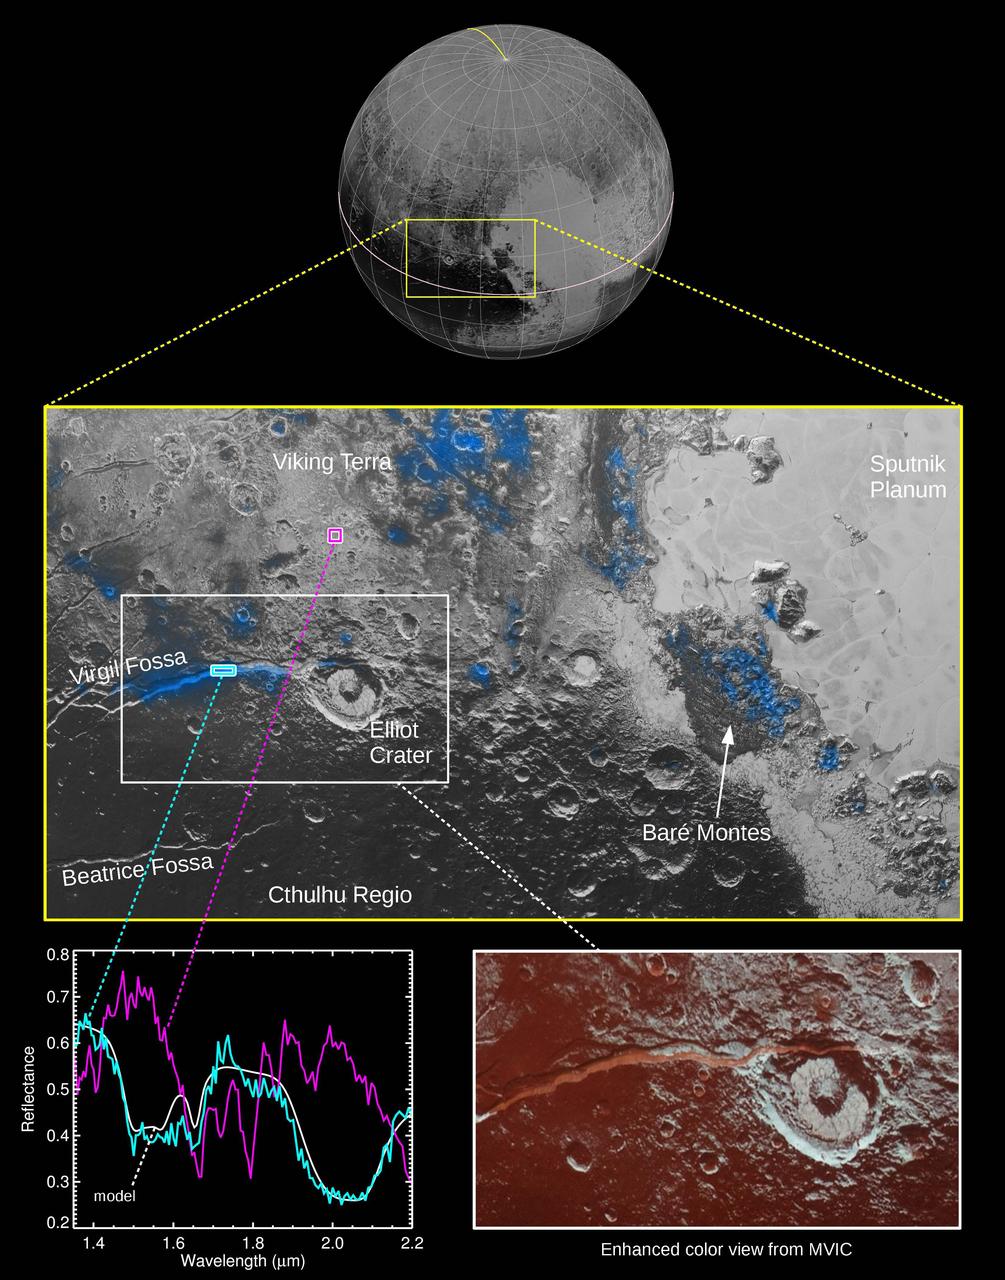
The Ralph instrument on NASA's New Horizons spacecraft detected water ice on Pluto's surface, picking up on the ice's near-infrared spectral characteristics. (See featured image from Oct. 8, 2015.) The middle panel shows a region west of Pluto's "heart" feature -- which the mission team calls Tombaugh Regio -- about 280 miles (450 kilometers) across. It combines visible imagery from Ralph's Multispectral Visible Imaging Camera (MVIC) with infrared spectroscopy from the Linear Etalon Imaging Spectral Array (LEISA). Areas with the strongest water ice spectral signature are highlighted in blue. Major outcrops of water ice occur in regions informally called Viking Terra, along Virgil Fossa west of Elliot crater, and in Baré Montes. Numerous smaller outcrops are associated with impact craters and valleys between mountains. In the lower left panel, LEISA spectra are shown for two regions indicated by cyan and magenta boxes. The white curve is a water ice model spectrum, showing similar features to the cyan spectrum. The magenta spectrum is dominated by methane ice absorptions. The lower right panel shows an MVIC enhanced color view of the region in the white box, with MVIC's blue, red and near-infrared filters displayed in blue, green and red channels, respectively. The regions showing the strongest water ice signature are associated with terrains that are actually a lighter shade of red. http://photojournal.jpl.nasa.gov/catalog/PIA20030
This 1973 chart details Skylab's Ultraviolet (UV) Spectrograph, an Apollo Telescope Mount instrument. Its telescope, with camera and TV capability, photographed the Sun in selected ultraviolet wavelengths. The spectrograph was used to record the spectrum of UV emissions, such as flares or filaments, from a small individual feature on the solar disc. Real-time TV was used by the crew to monitor performance of the telescope, transmit to the ground and record. The exposed films were retrieved by astronaut extravehicular activities. The Marshall Space Flight Center had program management responsibility for the development of the Skylab hardware and experiments.
Mechanical technicians and thermal engineers work together to carefully feed the lines of a Loop Heat Pipe onto the Ocean Color Instrument (OCI). This integration operation will allow proper heat transfer throughout the instrument. OCI is a highly advanced optical spectrometer that will be used to measure properties of light over portions of the electromagnetic spectrum. It will enable continuous measurement of light at finer wavelength resolution than previous NASA satellite sensors, extending key system ocean color data records for climate studies. OCI is PACE's (Plankton, Aerosol, Cloud, ocean Ecosystem) primary sensor built at Goddard Space Flight Center in Greenbelt, MD.
KENNEDY SPACE CENTER, FLA. -- Against a light summer sky, the Boeing Delta II rocket carrying NASA's Far Ultraviolet Spectroscopic Explorer (FUSE) satellite roars into the atmosphere after liftoff at 11:44 a.m. EDT from Launch Pad 17A, Cape Canaveral Air Station. FUSE was developed to investigate the origin and evolution of the lightest elements in the universe hydrogen and deuterium. In addition, the FUSE satellite will examine the forces and process involved in the evolution of the galaxies, stars and planetary systems by investigating light in the far ultraviolet portion of the electromagnetic spectrum
At Launch Pad 17A, Cape Canaveral Air Station (CCAS), the launch tower again encircles the Boeing Delta II rocket after being mated with its solid rocket boosters. The rocket is targeted to launch NASA's Far Ultraviolet Spectroscopic Explorer (FUSE) on June 23 at CCAS. Developed by The Johns Hopkins University under contract to Goddard Space Flight Center, Greenbelt, Md., FUSE will investigate the origin and evolution of the lightest elements in the universe hydrogen and deuterium. In addition, the FUSE satellite will examine the forces and process involved in the evolution of the galaxies, stars and planetary systems by investigating light in the far ultraviolet portion of the electromagnetic spectrum
Thermal vacuum technician, Sean Cook, monitors the Ocean Color Instrument (OCI) thermal vacuum chamber temperatures during the environmental test campaign. OCI is a highly advanced optical spectrometer that will be used to measure properties of light over portions of the electromagnetic spectrum. It will enable continuous measurement of light at finer wavelength resolution than previous NASA satellite sensors, extending key system ocean color data records for climate studies. OCI is PACE's (Plankton, Aerosol, Cloud, ocean Ecosystem) primary sensor built at Goddard Space Flight Center in Greenbelt, MD.
Designed by the mission crew members, the STS-66 emblem depicts the Space Shuttle Atlantis launching into Earth orbit to study global environmental change. The payload for the Atmospheric Laboratory for Applications and Science (ATLAS-3) and complementary experiments were part of a continuing study of the atmosphere and the Sun's influence on it. The Space Shuttle is trailed by gold plumes representing the astronaut symbol and is superimposed over Earth, much of which is visible from the flight's high inclination orbit. Sensitive instruments aboard the ATLAS pallet in the Shuttle payload bay and on the free-flying Cryogenic Infrared Spectrometers and Telescopes for the Atmospheric-Shuttle Pallet Satellite (CHRISTA-SPAS) that gazed down on Earth and toward the Sun, are illustrated by the stylized sunrise and visible spectrum.
Mechanical technician, Dan Dizon, tightens bolts on the loop heat pipe radiator on the Ocean Color Instrument (OCI) in a clean tent where the final hardware of the OCI are installed and tested. OCI is a highly advanced optical spectrometer that will be used to measure properties of light over portions of the electromagnetic spectrum. It will enable continuous measurement of light at finer wavelength resolution than previous NASA satellite sensors, extending key system ocean color data records for climate studies. OCI is PACE's (Plankton, Aerosol, Cloud, ocean Ecosystem) primary sensor built at Goddard Space Flight Center in Greenbelt, MD.

At Hangar AE, Cape Canaveral Air Station (CCAS), workers check the installation of a solar panel on NASA's Far Ultraviolet Spectroscopic Explorer (FUSE) satellite. FUSE was developed by The Johns Hopkins University under contract to Goddard Space Flight Center, Greenbelt, Md., to investigate the origin and evolution of the lightest elements in the universe hydrogen and deuterium. In addition, the FUSE satellite will examine the forces and process involved in the evolution of the galaxies, stars and planetary systems by investigating light in the far ultraviolet portion of the electromagnetic spectrum. FUSE is targeted for launch June 23 from Launch Pad 17A, CCAS, aboard a Boeing Delta II rocket
At Hangar AE, Cape Canaveral Air Station (CCAS), workers on scaffolding pull down a weather-proofing cover over the canister surrounding NASA's Far Ultraviolet Spectroscopic Explorer (FUSE) satellite. The satellite will next be moved to Launch Pad 17A, CCAS, for its scheduled launch June 23 aboard a Boeing Delta II rocket. FUSE was developed by The Johns Hopkins University under contract to Goddard Space Flight Center, Greenbelt, Md., to investigate the origin and evolution of the lightest elements in the universe hydrogen and deuterium. In addition, the FUSE satellite will examine the forces and process involved in the evolution of the galaxies, stars and planetary systems by investigating light in the far ultraviolet portion of the electromagnetic spectrum
The Ocean Color Instrument (OCI) mechanical team aligns the instrument on a transportation sled and slowly pushes the instrument into a thermal vacuum chamber to prepare it for a sixty day thermal test to ensure the instrument will perform effectively once it launches into the airless environment of space. OCI is a highly advanced optical spectrometer that will be used to measure properties of light over portions of the electromagnetic spectrum. It will enable continuous measurement of light at finer wavelength resolution than previous NASA satellite sensors, extending key system ocean color data records for climate studies. OCI is PACE's (Plankton, Aerosol, Cloud, ocean Ecosystem) primary sensor built at Goddard Space Flight Center in Greenbelt, MD.
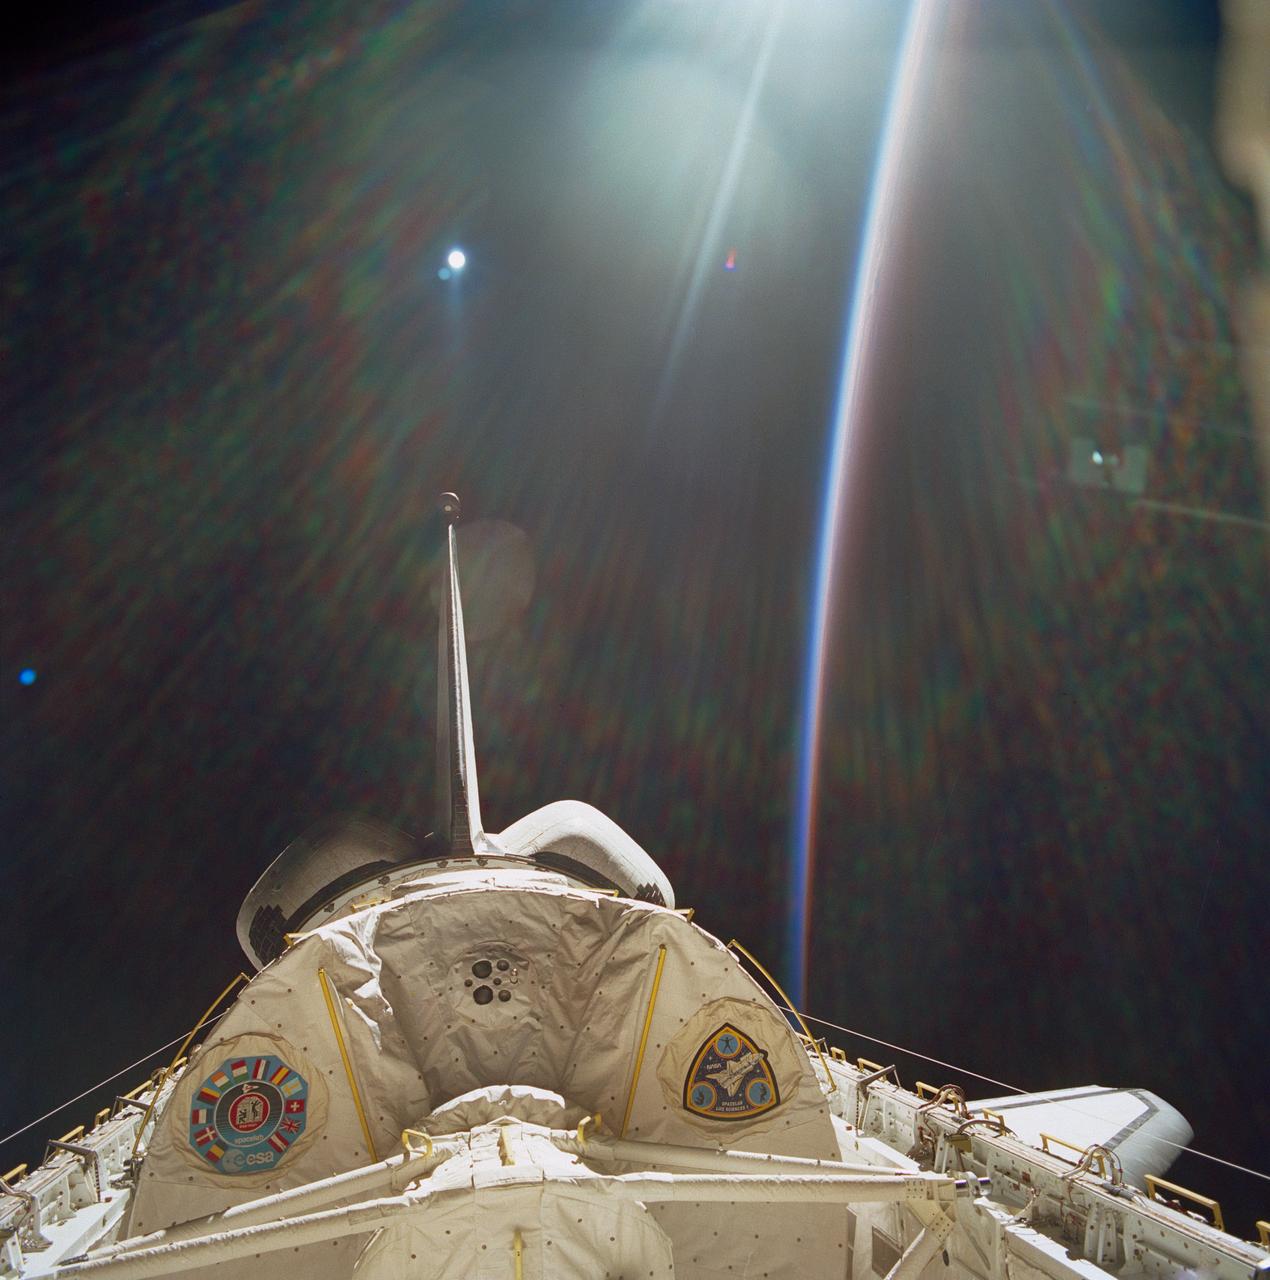
STS040-612-005 (5-14 June 1991) --- This view showing the Spacelab Life Sciences (SLS-1) module in Columbia's cargo bay was taken through windows on the aft flight deck. Under some lighting conditions the multi-layered Shuttle windows have internal reflections that provide a kaleidoscopic effect. In this image the sunrays as seen on the clouds also appear to be present in space. Note how the white sunlight toward the Sun at the Earth's limb becomes separated into the colors of the visible spectrum towards that part of the limb further into darkness due to atmosphere acting as a natural prism.
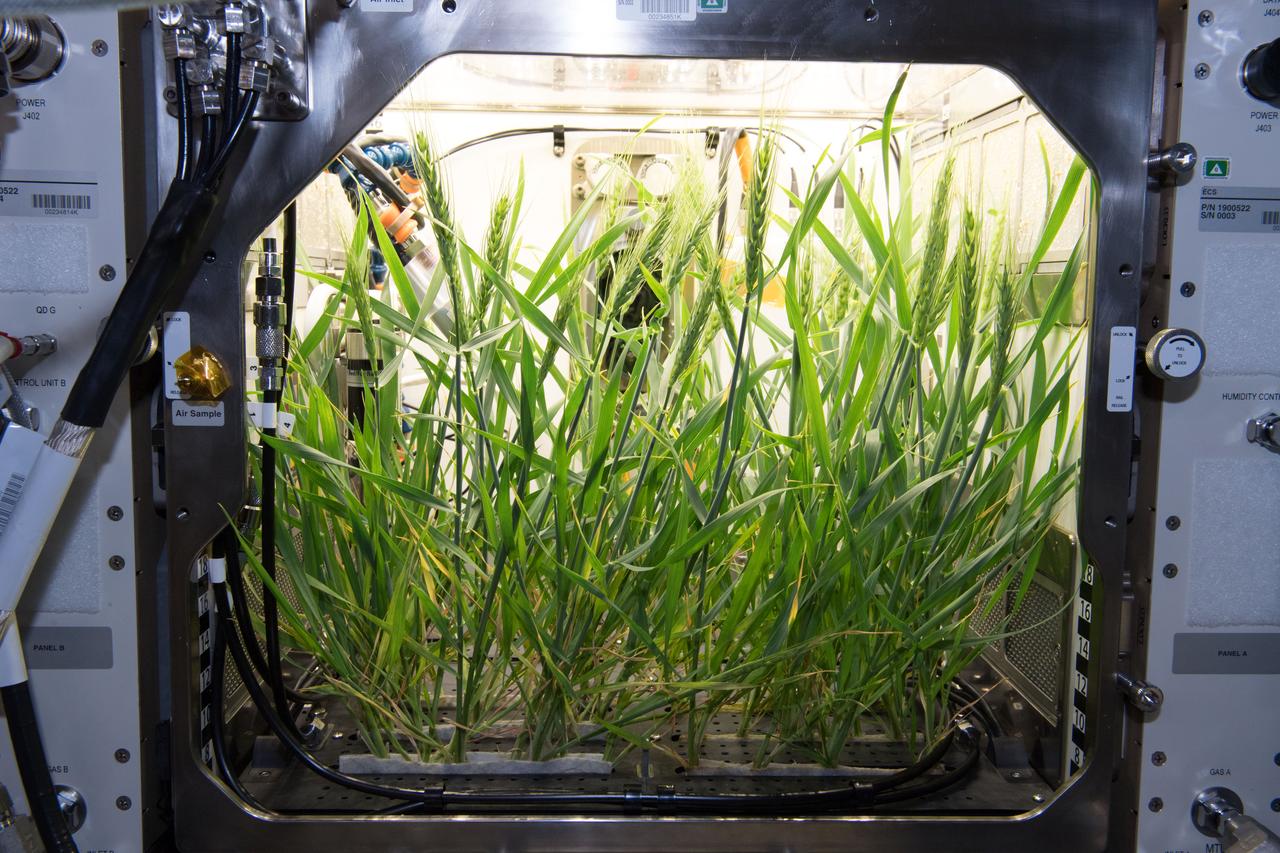
The first growth test of crops in the Advanced Plant Habitat aboard the International Space Station yielded great results. Arabidopsis seeds – small flowering plants related to cabbage and mustard – grew for about six weeks and the dwarf wheat for five weeks. The APH is now ready to support large plant testing on ISS. APH is a fully enclosed, closed-loop system with an environmentally controlled growth chamber. It uses red, blue and green LED lights, and broad spectrum white LED lights. The system's more than 180 sensors will relay real-time information, including temperature, oxygen content and moisture levels back to the team at Kennedy Space Center.
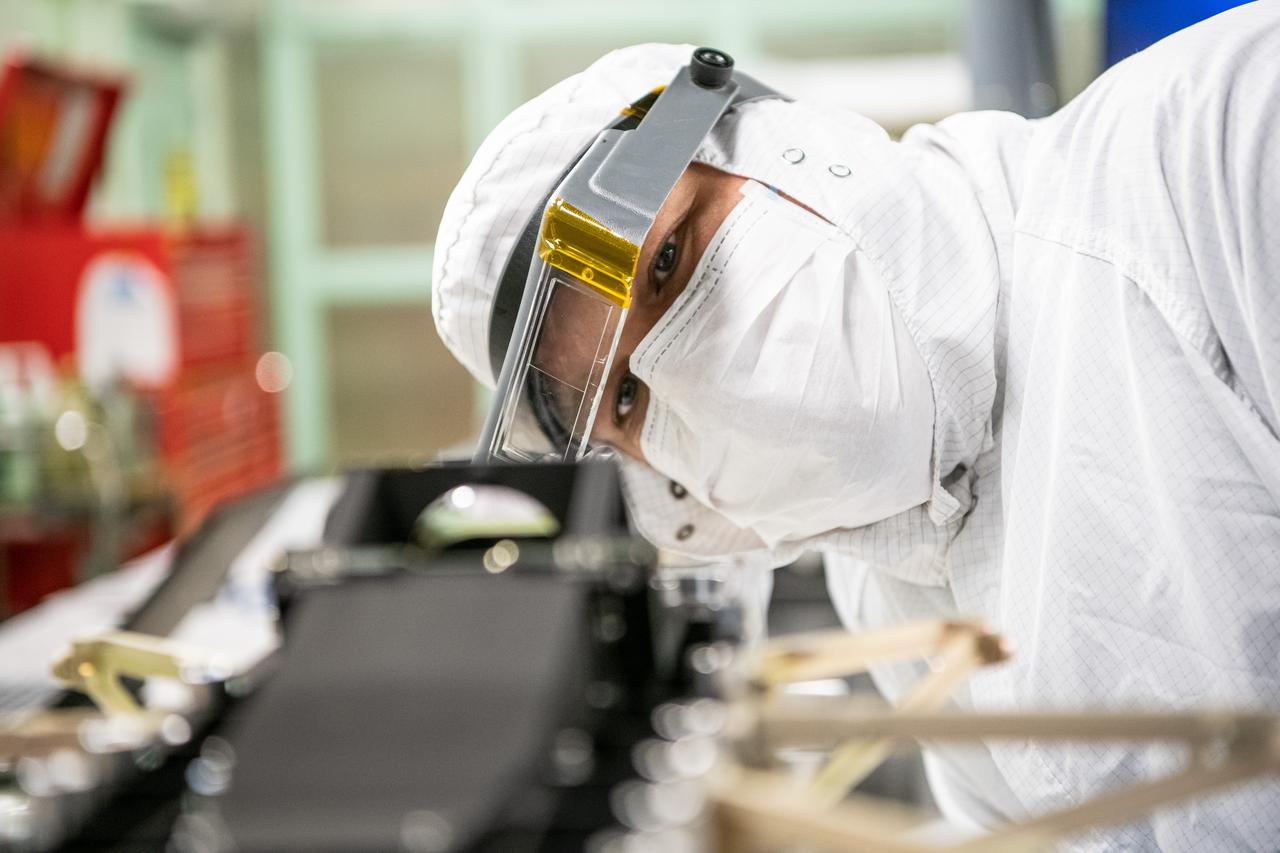
Mechanical technician, Andrew Scharmann, installs a shim and inspects an optic on the Ocean Color Instrument (OCI) rotating telescope prior to integrating other hardware and optical components. OCI is a highly advanced optical spectrometer that will be used to measure properties of light over portions of the electromagnetic spectrum. It will enable continuous measurement of light at finer wavelength resolution than previous NASA satellite sensors, extending key system ocean color data records for climate studies. OCI is PACE's (Plankton, Aerosol, Cloud, ocean Ecosystem) primary sensor built at Goddard Space Flight Center in Greenbelt, MD.

At Hangar AE, Cape Canaveral Air Station (CCAS), workers move segments of the canister that will be installed around NASA's Far Ultraviolet Spectroscopic Explorer (FUSE) satellite in the background. The satellite is being prepared for its transfer to Launch Pad 17A, CCAS, and its scheduled launch June 23 aboard a Boeing Delta II rocket. FUSE was developed by The Johns Hopkins University under contract to Goddard Space Flight Center, Greenbelt, Md., to investigate the origin and evolution of the lightest elements in the universe hydrogen and deuterium. In addition, the FUSE satellite will examine the forces and process involved in the evolution of the galaxies, stars and planetary systems by investigating light in the far ultraviolet portion of the electromagnetic spectrum
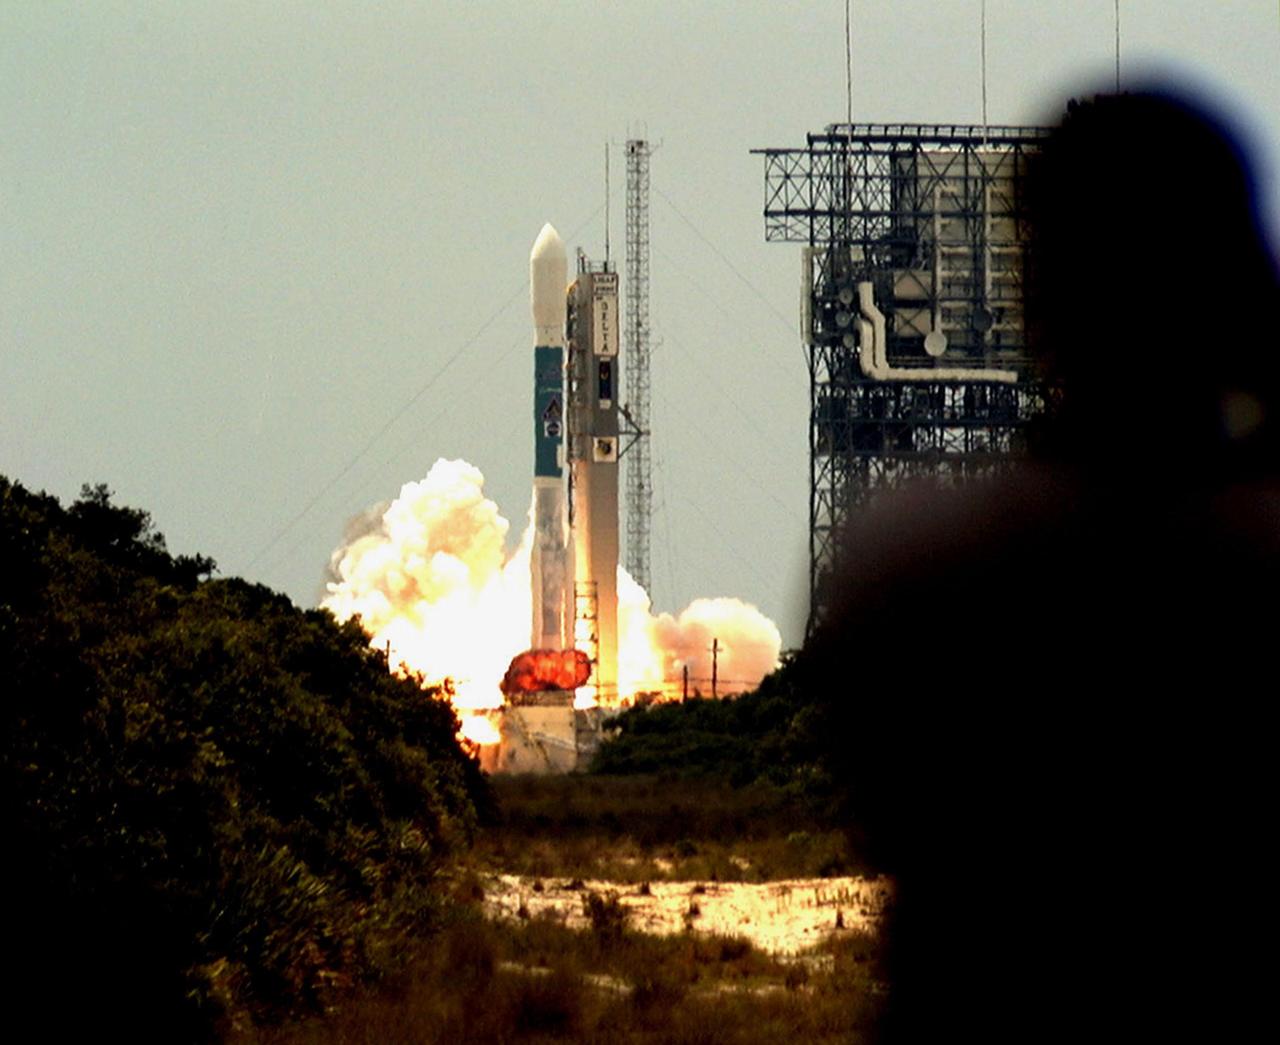
KENNEDY SPACE CENTER, FLA. -- A fireball erupts under the Boeing Delta II rocket, amid clouds of smoke and steam, as it lifts off from Launch Pad 17A, Cape Canaveral Air Station, at 11:44 a.m. EDT. The shadow of a photographer (right) is caught watching the perfect launch. The rocket carries NASA's Far Ultraviolet Spectroscopic Explorer (FUSE) satellite, which was developed to investigate the origin and evolution of the lightest elements in the universe hydrogen and deuterium. In addition, the FUSE satellite will examine the forces and process involved in the evolution of the galaxies, stars and planetary systems by investigating light in the far ultraviolet portion of the electromagnetic spectrum
This chart details Skylab's Dual X-Ray Telescopes, one of eight Apollo Telescope Mount facilities. It was designed to gather solar radiation data in the x-ray region of the solar spectrum and provide information on physical processes within the solar atmosphere. In support of the two primary telescopes, auxiliary instruments provided a continuous record of the total x-ray flux in two bands. A flare detector was also provided at the control console as an aid to astronauts for monitoring solar activity. The Marshall Space Flight Center had program management responsibility for the development of Skylab hardware and experiments.
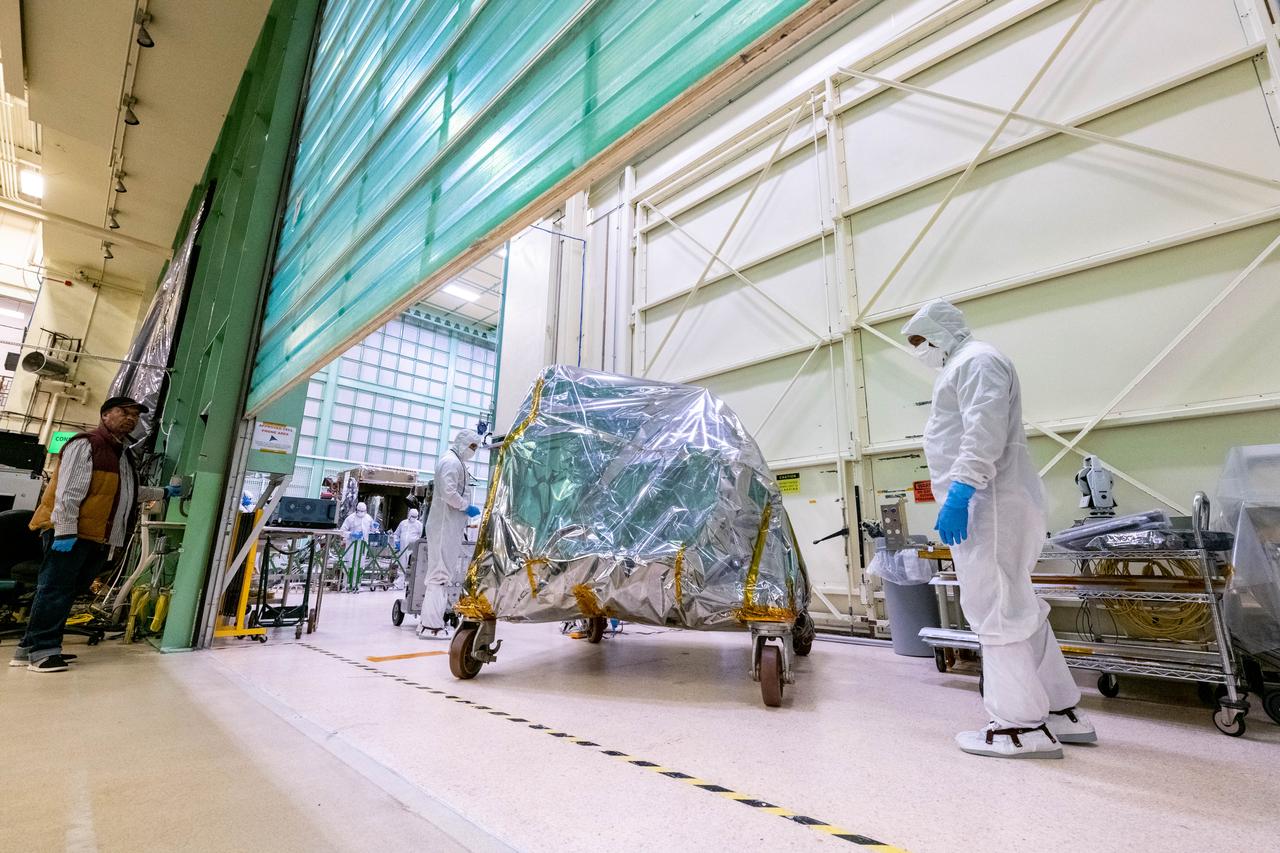
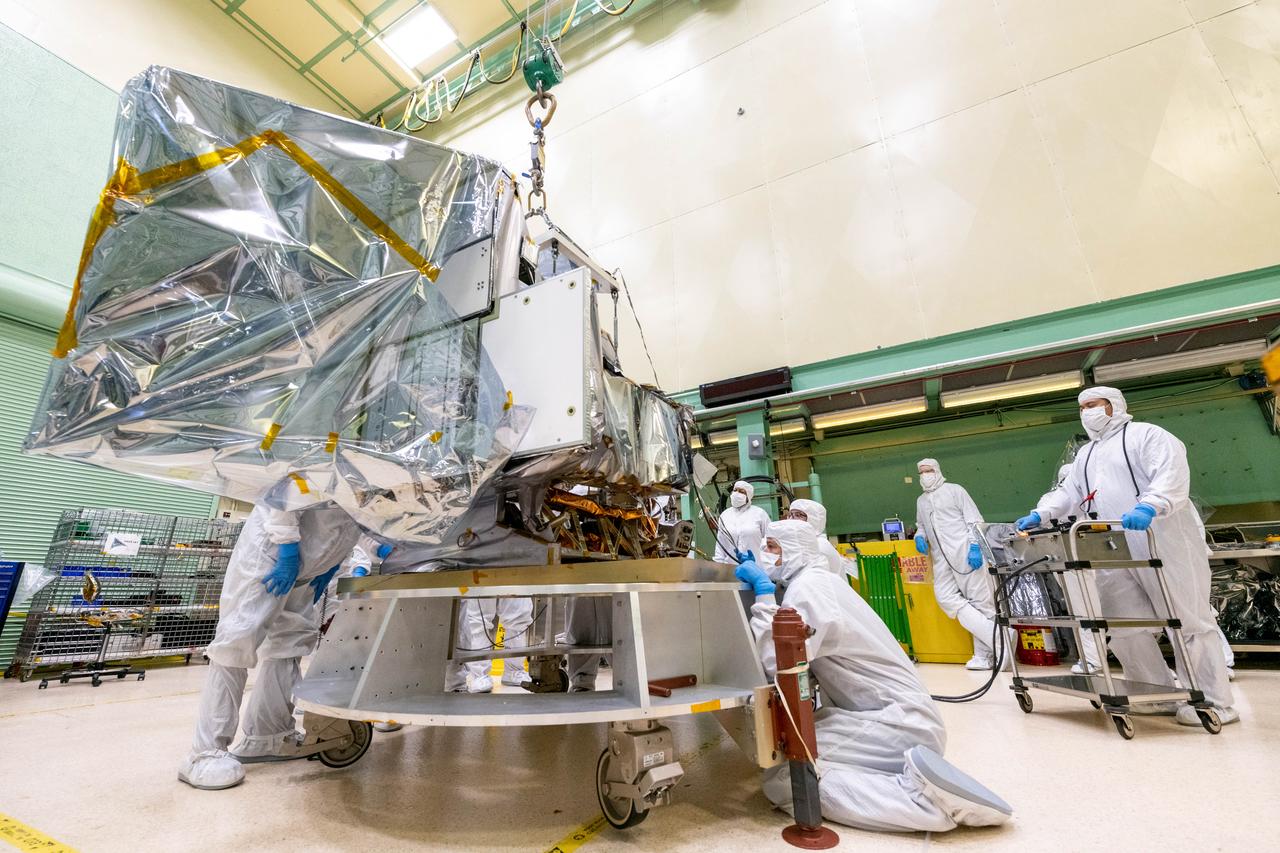
The Ocean Color Instrument (OCI) team transports the instrument on its dolly to a cleanroom at Goddard Space Flight Center for final operations prior to integration to the Plankton, Aerosol, Cloud, ocean Ecosystem (PACE) spacecraft. OCI is a highly advanced optical spectrometer that will be used to measure properties of light over portions of the electromagnetic spectrum. It will enable continuous measurement of light at finer wavelength resolution than previous NASA satellite sensors, extending key system ocean color data records for climate studies. OCI is PACE's primary sensor built at Goddard Space Flight Center in Greenbelt, MD.
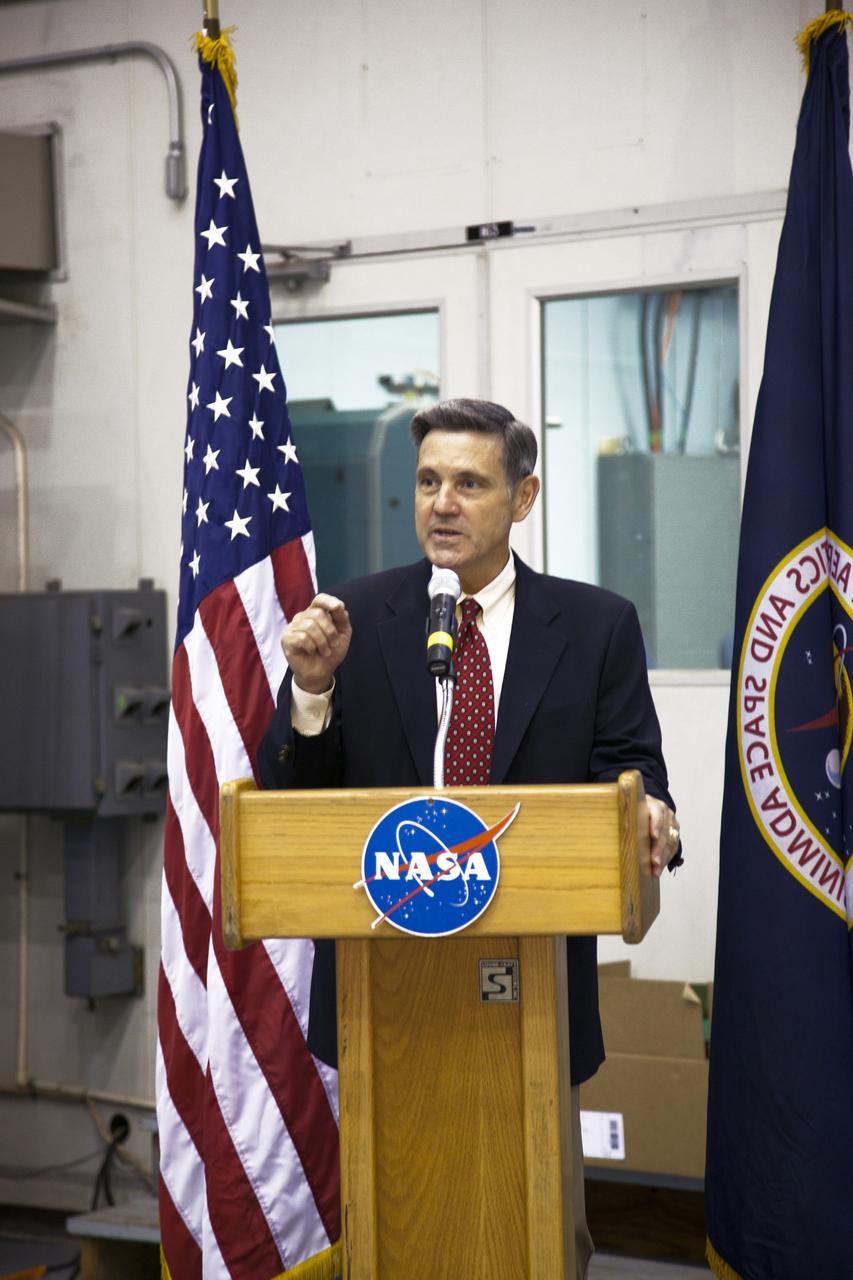
CAPE CANAVERAL, Fla. -- At NASA's Kennedy Space Center in Florida, Center Director Bob Cabana talks to workers at the Launch Equipment Test Facility (LETF), which recently underwent a $35 million comprehensive upgrade that lasted four years. The LETF was established in the 1970s to support the qualification of the Space Shuttle Program’s umbilical and T-0 mechanisms. Throughout the years, it has supported the development of systems for shuttle and the International Space Station, Delta and Atlas rockets, and various research and development programs. The LETF has unique capabilities to evolve into a versatile test and development area that supports a wide spectrum of programs. For information on NASA's future plans, visit www.nasa.gov. Photo credit: NASA/Dimitri Gerondidakis
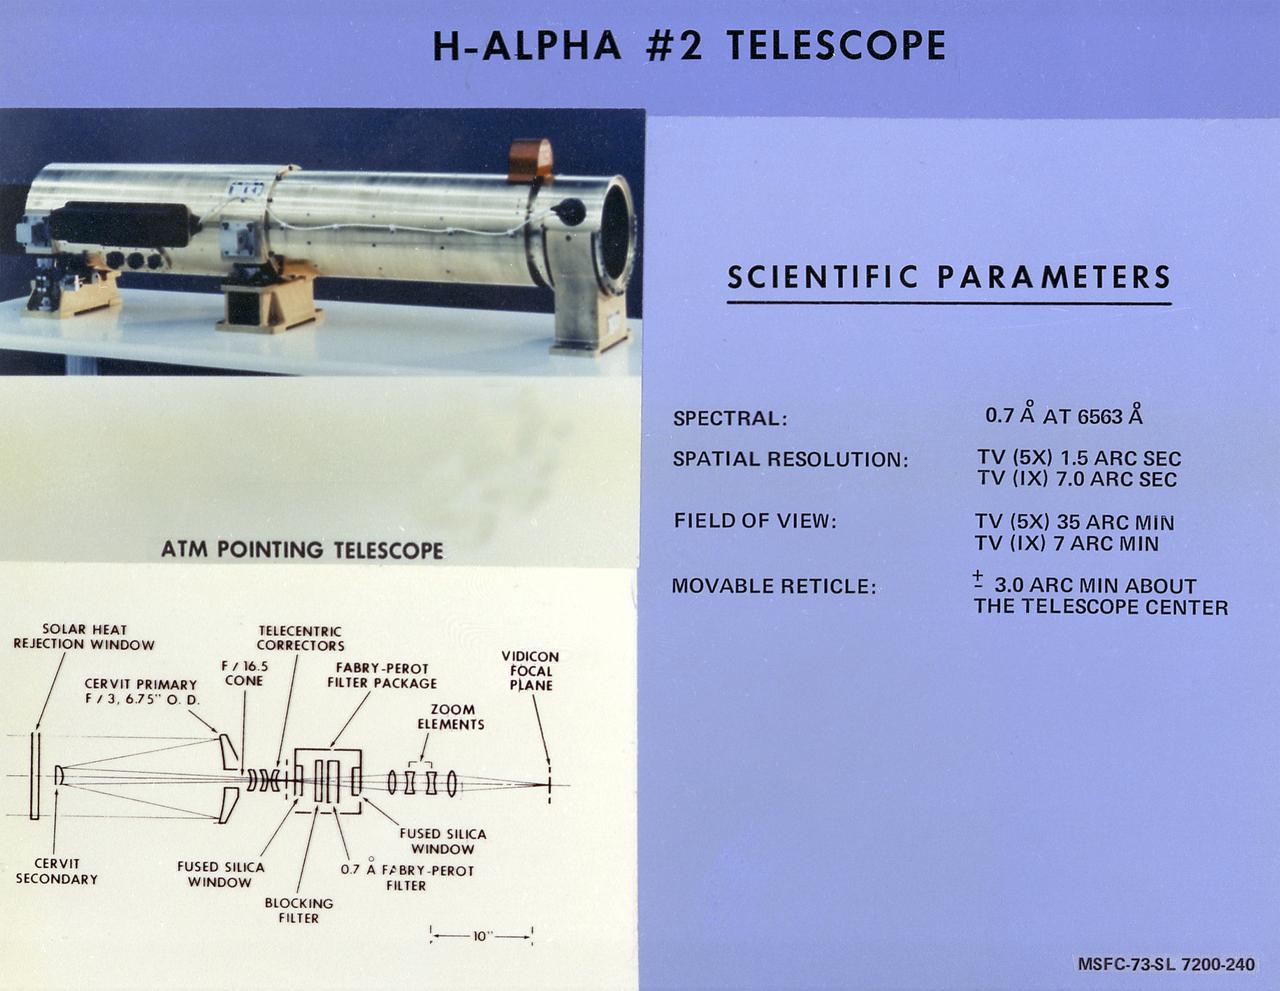
This chart describes the Hydrogen-Alpha (H-Alpha) #2 Telescope, one of eight major solar study facilities on the Skylab Apollo Telescope Mount (ATM). There were two H-Alpha telescopes on the ATM that were used primarily to point the ATM and keep a continuous photographic record during solar observation periods. Both telescopes gave the Skylab astronauts a real-time picture of the Sun in the red light of the H-Alpha spectrum through a closed-circuit television. The H-Alpha #1 telescope provided simultaneous photographic and ultraviolet (UV) pictures, while the #2 telescope operated only in the TV mode. The Marshall Space Flight Center was responsible for development of the H-Alpha Telescopes.