
This illustration depicts NASA's Juno spacecraft in orbit above Jupiter's Great Red Spot. https://photojournal.jpl.nasa.gov/catalog/PIA21770
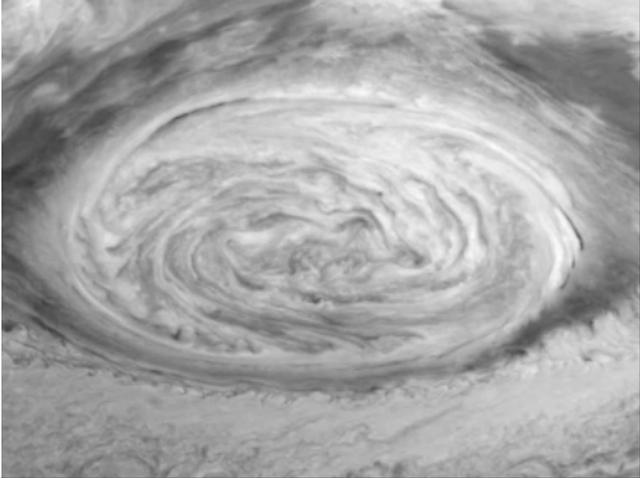
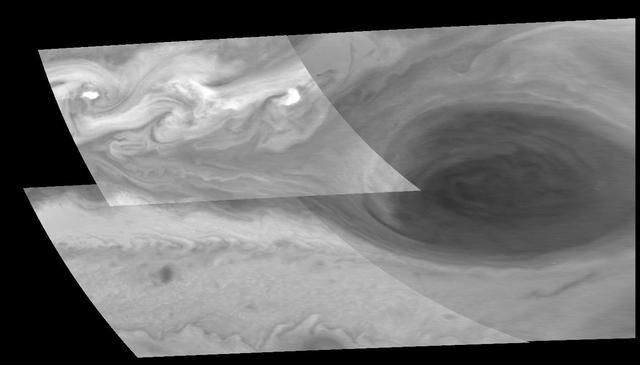
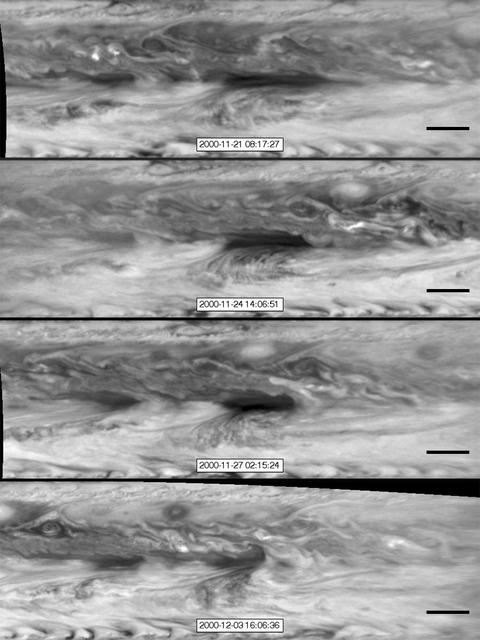
Dynamics of Jupiter's Great Red Spot in the NIR filter (756 nm) of the Galileo imaging system. Each of the three frames is a mosaic of six images that have been map-projected to a uniform grid of latitude and longitude. North is at the top. There is a nine-hour separation between the first two frames and seventy minutes between the next two. All of the images were taken on June 26, 1996. The Red Spot is 20,000 km long and has been followed by observers on Earth since the telescope was invented 300 years ago. It is a huge storm made visible by variations in the composition of the cloud particles and the amount of cloud cover. Winds in the outer part of the Red Spot reach 250 mph while the center remains quiescent. These Galileo data will help scientists understand what drives this storm and why it persists for so many years. http://photojournal.jpl.nasa.gov/catalog/PIA01083
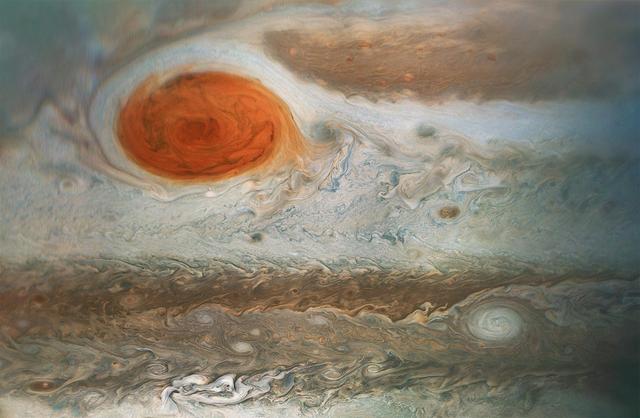
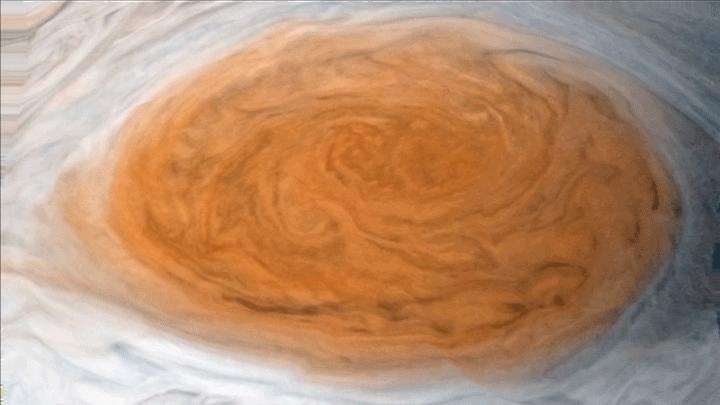
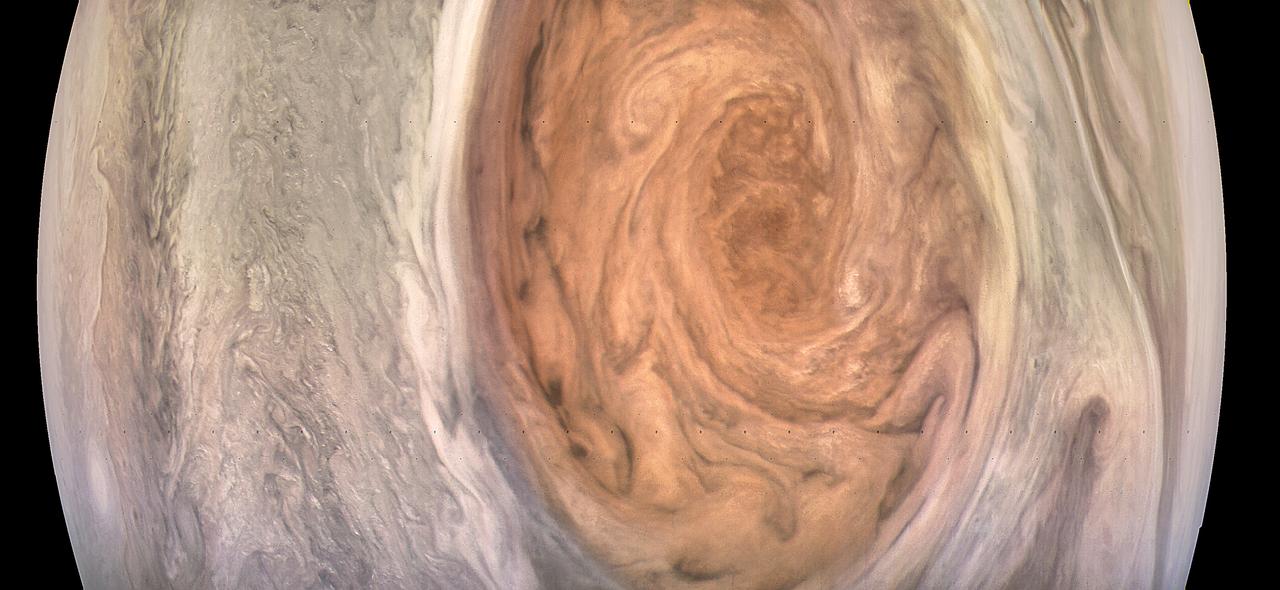
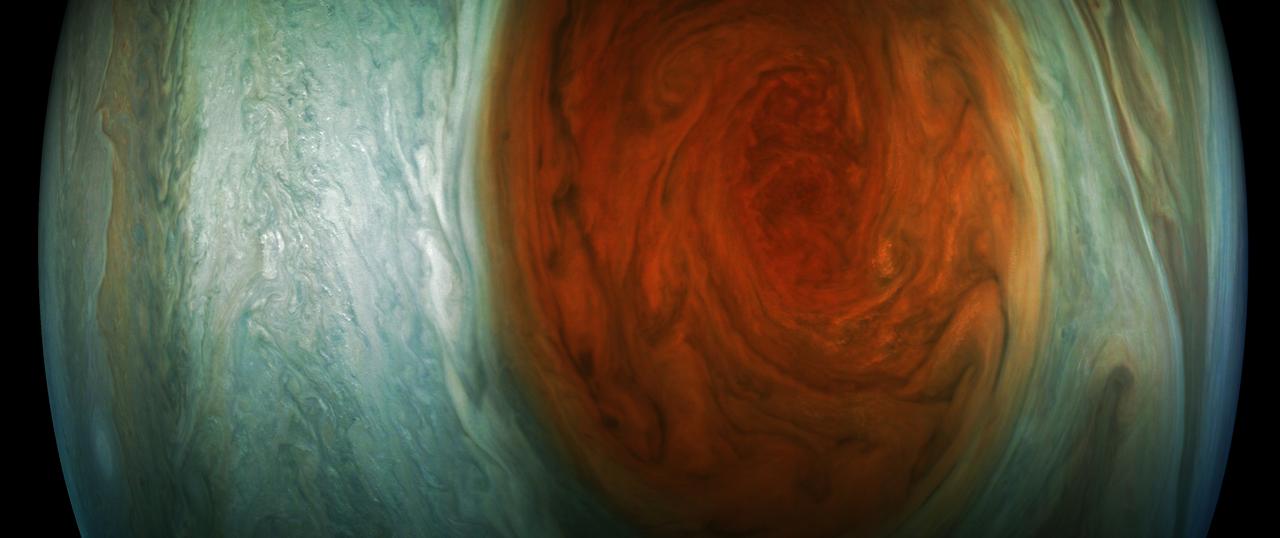
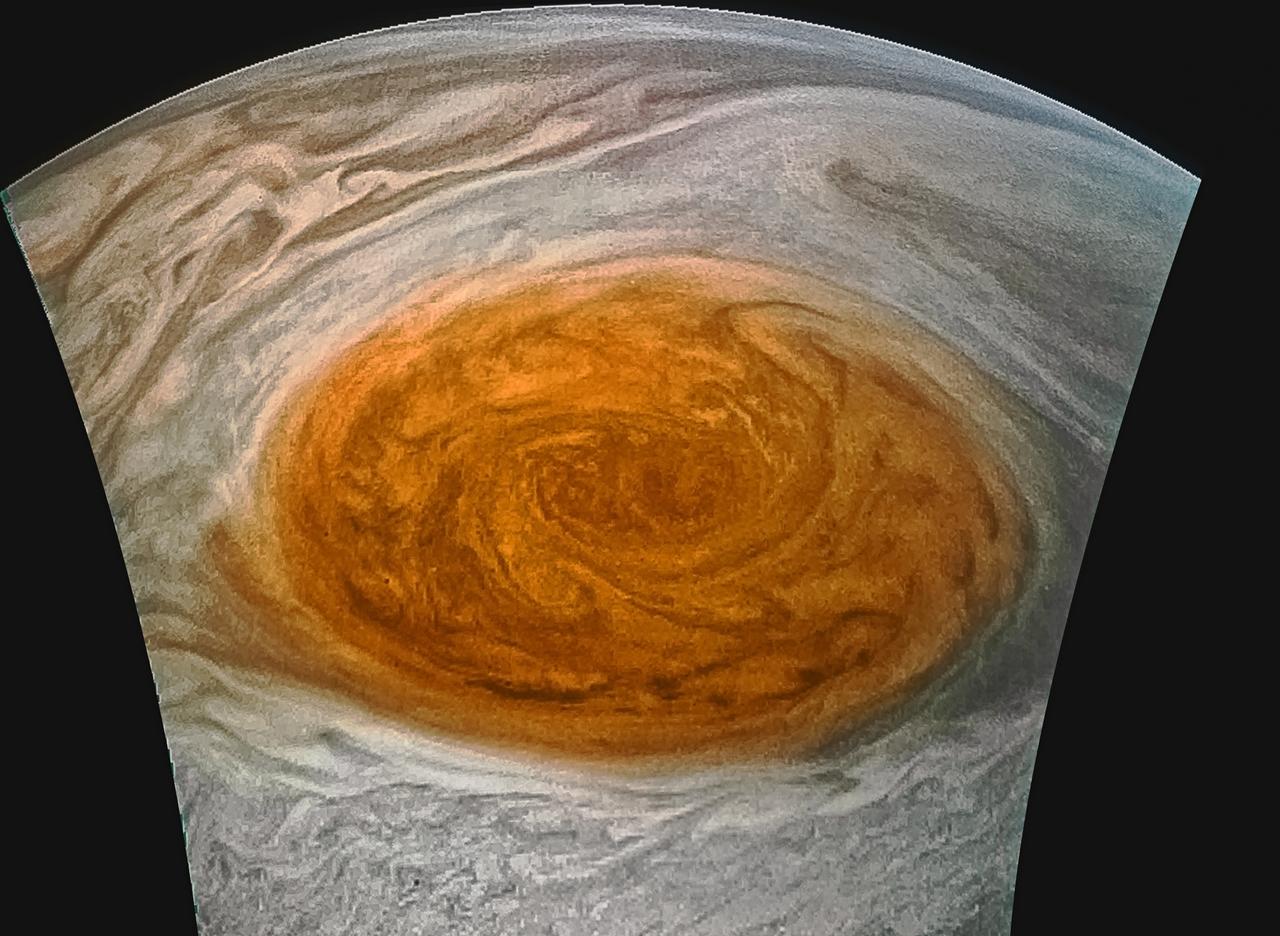
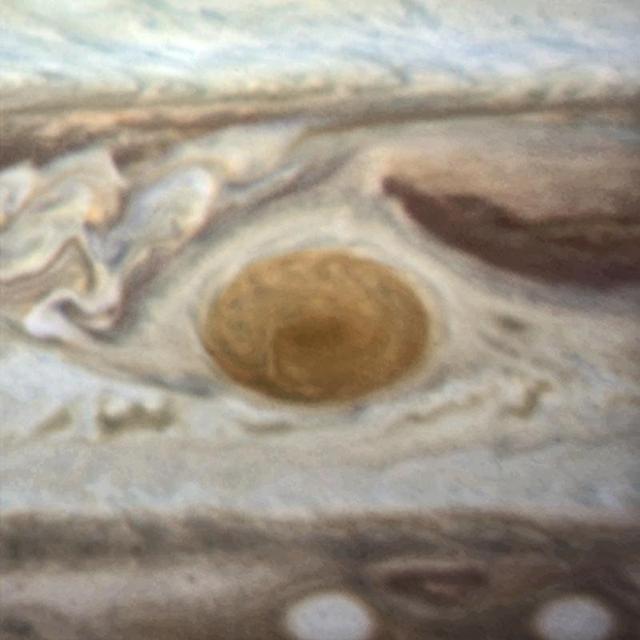
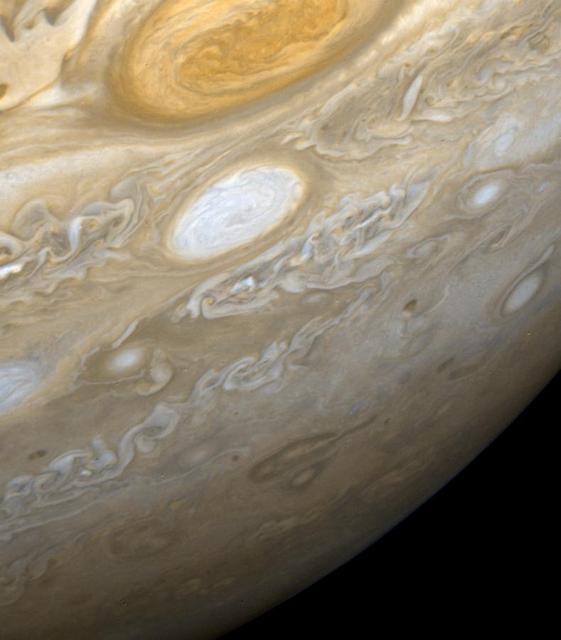
This image of Jupiter's iconic Great Red Spot and surrounding turbulent zones was captured by NASA's Juno spacecraft. The color-enhanced image is a combination of three separate images taken on April 1 between 3:09 a.m. PDT (6:09 a.m. EDT) and 3:24 a.m. PDT (6:24 a.m. EDT), as Juno performed its 12th close flyby of Jupiter. At the time the images were taken, the spacecraft was 15,379 miles (24,749 kilometers) to 30,633 miles (49,299 kilometers) from the tops of the clouds of the planet at a southern latitude spanning 43.2 to 62.1 degrees. Citizen scientists Gerald Eichstädt and Seán Doran processed this image using data from the JunoCam imager. https://photojournal.jpl.nasa.gov/catalog/PIA21985
NASA Voyager 2 shows the Great Red Spot and the south equatorial belt extending into the equatorial region. At right is an interchange of material between the south equatorial belt and the equatorial zone. The clouds in the equatorial zone are more diffuse and do not display the structures seen in other locations. Considerable structure is evident within the Great Red Spot. http://photojournal.jpl.nasa.gov/catalog/PIA00456
Spotting Prometheus
Defrosting Spots
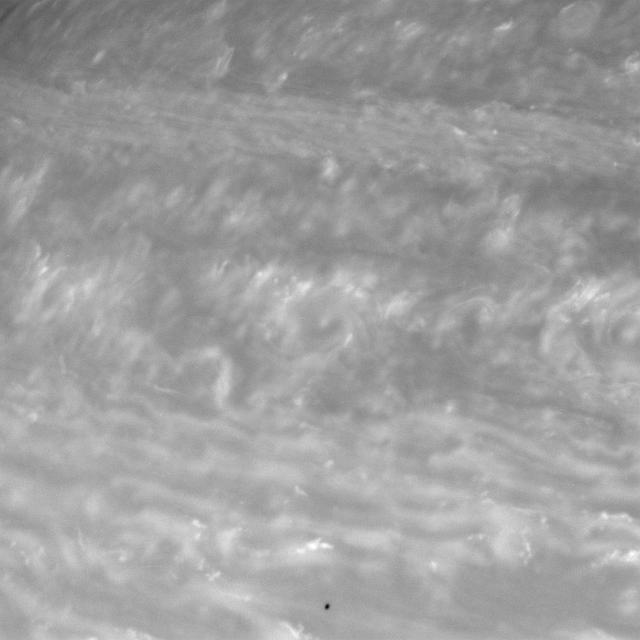
Polar Spots
Spotting the Shepherd
Stormy Spot
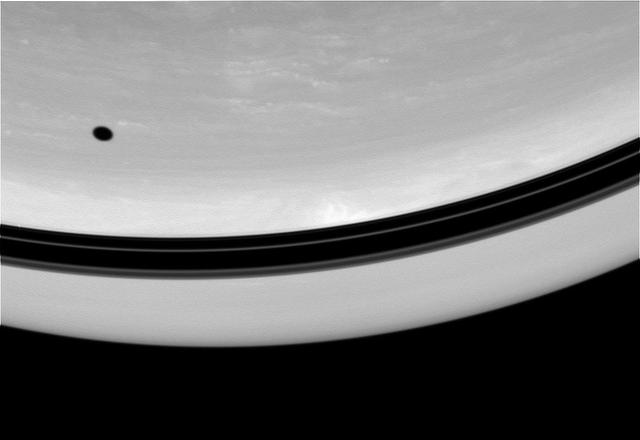
Moon Spot
Shadow Spot
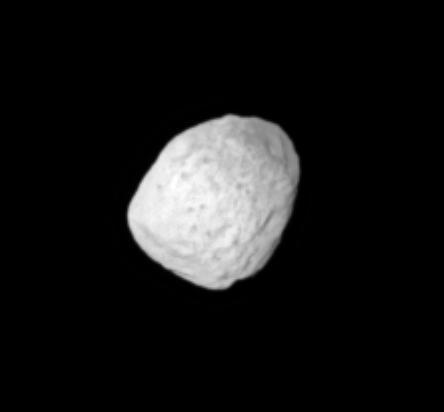
Spots on Janus
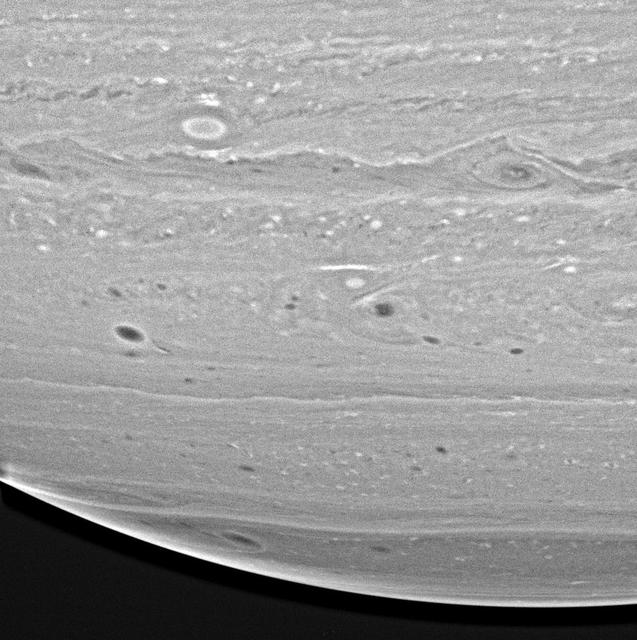
Spotting the Storms
Winds around Jupiter's Great Red Spot are simulated in this JunoCam view that has been animated using a model of the winds there. The wind model, called a velocity field, was derived from data collected by NASA's Voyager spacecraft and Earth-based telescopes. NASA's Juno spacecraft acquired the original, static view during passage over the spot on July 10, 2017. Citizen scientists Gerald Eichstädt and Justin Cowart turned the JunoCam data into a color image mosaic. Juno scientists Shawn Ewald and Andrew Ingersoll applied the velocity data to the image to produce a looping animation. An animation is available at https://photojournal.jpl.nasa.gov/catalog/PIA22178

This frame from an animation takes the viewer on a simulated flight into, and then out of, Jupiter's upper atmosphere at the location of the Great Red Spot. The perspective begins about 2,000 miles (3,000 kilometers) above the cloud tops of the planet's southern hemisphere. The bar at far left indicates altitude during the quick descent; a second gauge next to that depicts the dramatic increase in temperature that occurs as the perspective dives deeper down. The clouds turn crimson as the perspective passes through the Great Red Spot. Finally, the view ascends out of the spot. This video was created by combining an image from the JunoCam imager on NASA's Juno spacecraft with a computer-generated animation. The animation is available at https://photojournal.jpl.nasa.gov/catalog/PIA22176. - Enhanced image by Gerald Eichstädt / Justin Cowart based on images provided courtesy of NASA/JPL-Caltech/SwRI/MSSS
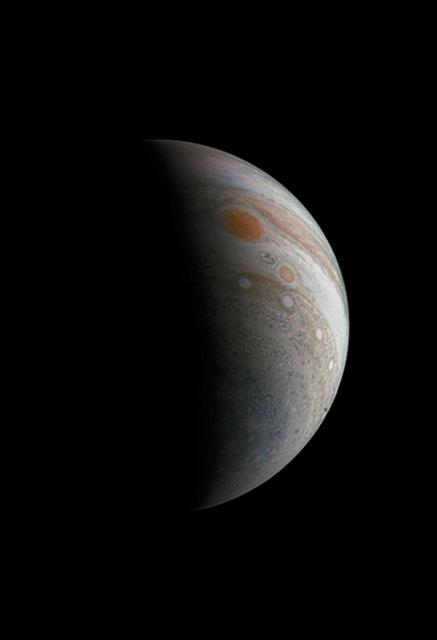
This image of a crescent Jupiter and the iconic Great Red Spot was created by a citizen scientist (Roman Tkachenko) using data from Juno's JunoCam instrument. You can also see a series of storms shaped like white ovals, known informally as the "string of pearls." Below the Great Red Spot a reddish long-lived storm known as Oval BA is visible. The image was taken on Dec. 11, 2016 at 2:30 p.m. PST (5:30 p.m. EST), as the Juno spacecraft performed its third close flyby of Jupiter. At the time the image was taken, the spacecraft was about 285,100 miles (458,800 kilometers) from the planet. http://photojournal.jpl.nasa.gov/catalog/PIA21376 . - Enhanced image by Roman Tkachenko (CC-BY) based on images provided courtesy of NASA/JPL-Caltech/SwRI/MSSS
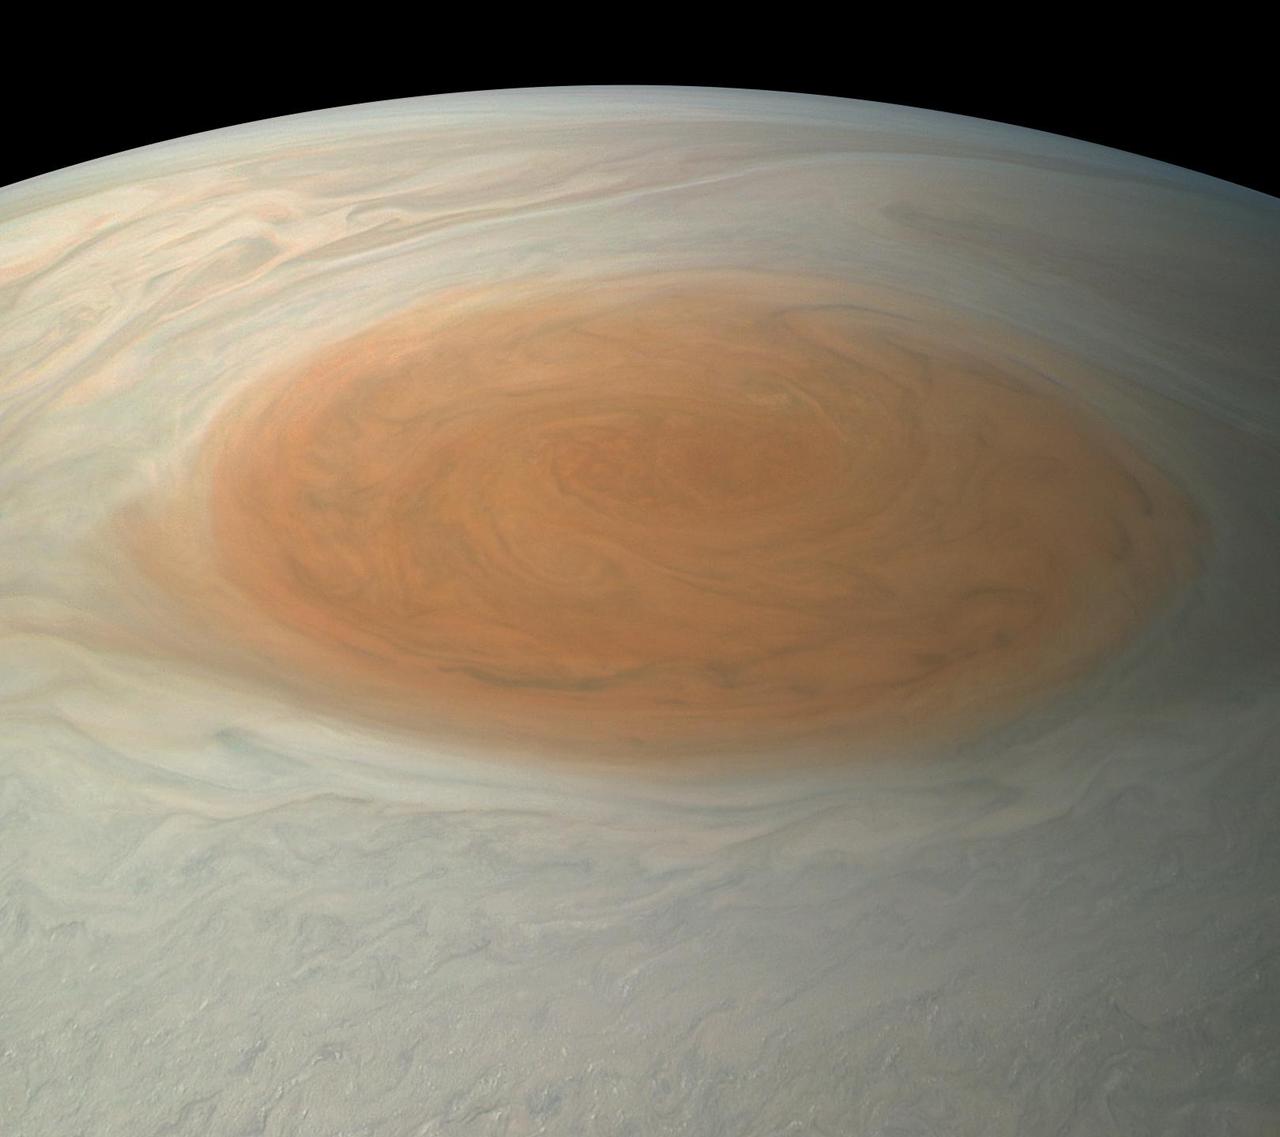
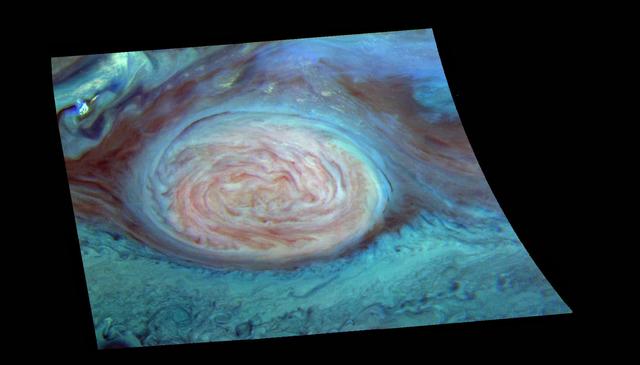
This image of Jupiter's iconic Great Red Spot (GRS) was created by citizen scientist Björn Jónsson using data from the JunoCam imager on NASA's Juno spacecraft. This true-color image offers a natural color rendition of what the Great Red Spot and surrounding areas would look like to human eyes from Juno's position. The tumultuous atmospheric zones in and around the Great Red Spot are clearly visible. The image was taken on July 10, 2017 at 07:10 p.m. PDT (10:10 p.m. EDT), as the Juno spacecraft performed its seventh close flyby of Jupiter. At the time the image was taken, the spacecraft was about 8,648 miles (13,917 kilometers) from the tops of the clouds of the planet at a latitude of -32.6 degrees. https://photojournal.jpl.nasa.gov/catalog/PIA21775. - Enhanced image by Björn Jónsson (CC-NC-SA) based on images provided courtesy of NASA/JPL-Caltech/SwRI/MSSS
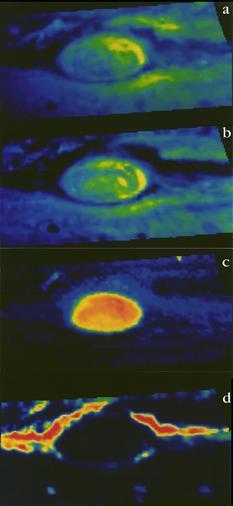
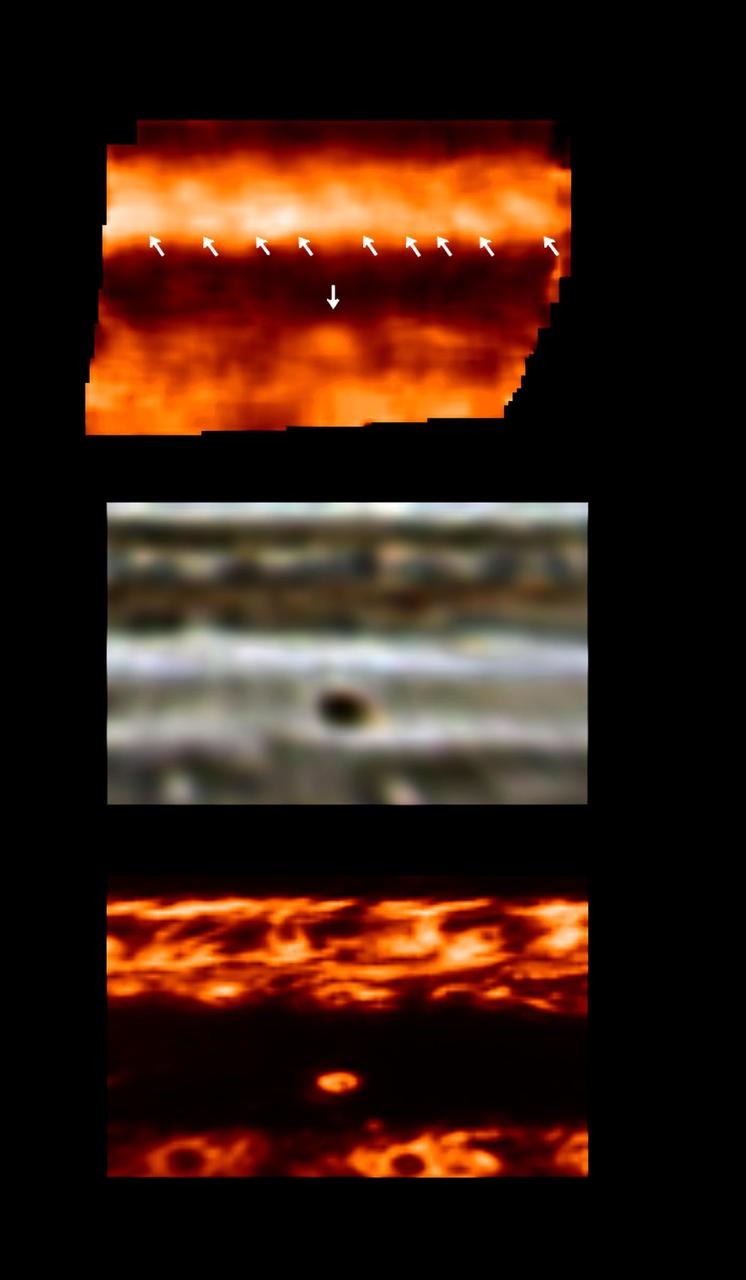
The Near-Infrared Mapping Spectrometer (NIMS) instrument looks at Jupiter's Great Red Spot, in these views from June 26, 1996. NIMS studies infrared wavelengths of light that our eye cannot see. These maps are at four different infrared wavelengths, each one picked to reveal something different about the atmosphere. The top image is a false color map of a wavelength that is at the red edge of our ability to see. It shows the shapes of features that we would see with our eyes. The second map is of ammonia ice, red showing where the most ice is, blue where none exists. The differences between this and the first image are due to the amount and size of ammonia ice crystals. The third map down is from a wavelength that shows cloud heights, with the highest clouds in red, and the lowest in blue. The bottom map uses a wavelength that shows the hot Jupiter shining through the clouds. Red represents the thinnest clouds, and blue is thickest where it is more difficult to see below. Comparing the bottom two images, note that the highest clouds are in the center of the Great Red Spot, while there are relatively few clouds around the edges. http://photojournal.jpl.nasa.gov/catalog/PIA00501
This enhanced-color image of Jupiter's Great Red Spot was created by citizen scientist Kevin Gill using data from the JunoCam imager on NASA's Juno spacecraft. The image was taken on July 10, 2017 at 07:07 p.m. PDT (10:07 p.m. EDT), as the Juno spacecraft performed its 7th close flyby of Jupiter. At the time the image was taken, the spacecraft was about 6,130 miles (9,866 kilometers) from the tops of the clouds of the planet. https://photojournal.jpl.nasa.gov/catalog/PIA21395 . - Enhanced image by Kevin M. Gill (CC-BY) based on images provided courtesy of NASA/JPL-Caltech/SwRI/MSSS

This photograph shows the last face on view of the Great Dark Spot that Voyager will make with the narrow angle camera. The image was shuttered 45 hours before closest approach at a distance of 2.8 million kilometers (1.7 million miles). The smallest structures that can be seen are of an order of 50 kilometers (31 miles). The image shows feathery white clouds that overlie the boundary of the dark and light blue regions. The pinwheel (spiral) structure of both the dark boundary and the white cirrus suggest a storm system rotating counterclockwise. Periodic small scale patterns in the white cloud, possibly waves, are short lived and do not persist from one Neptunian rotation to the next. This color composite was made from the clear and green filters of the narrow-angle camera. http://photojournal.jpl.nasa.gov/catalog/PIA00052
X Marks the Spot
Jovian Dark Spot
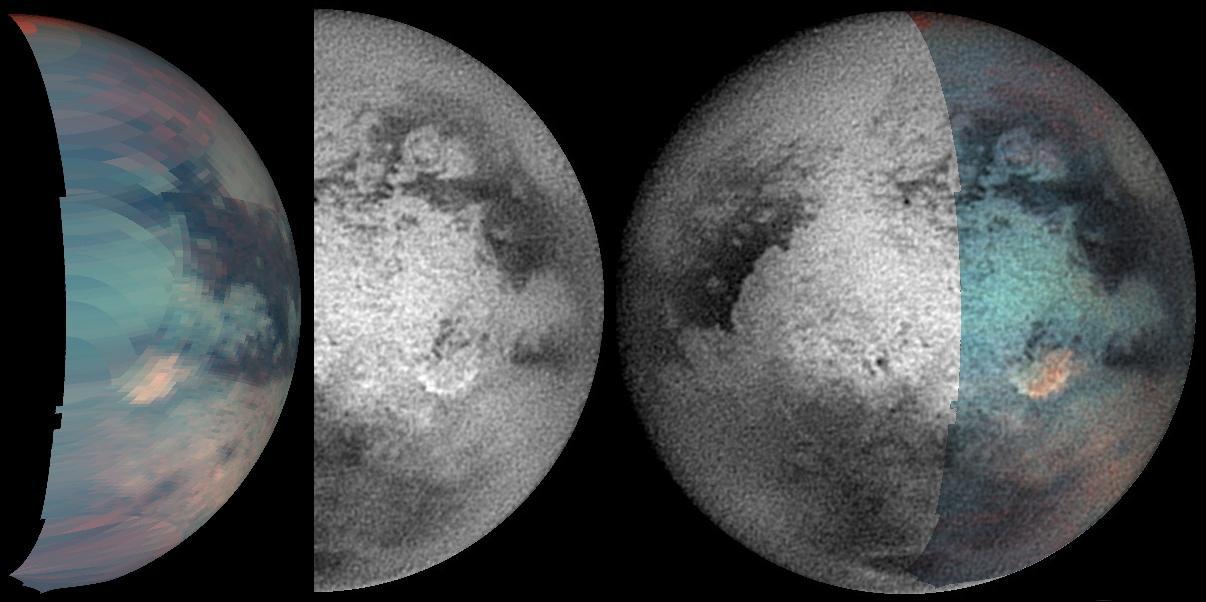
Red Spot on Titan
Sweet Spot for Landing on Mars
Saturn Red Spot

Jupiter Great Red Spot
Angular Bright Spot
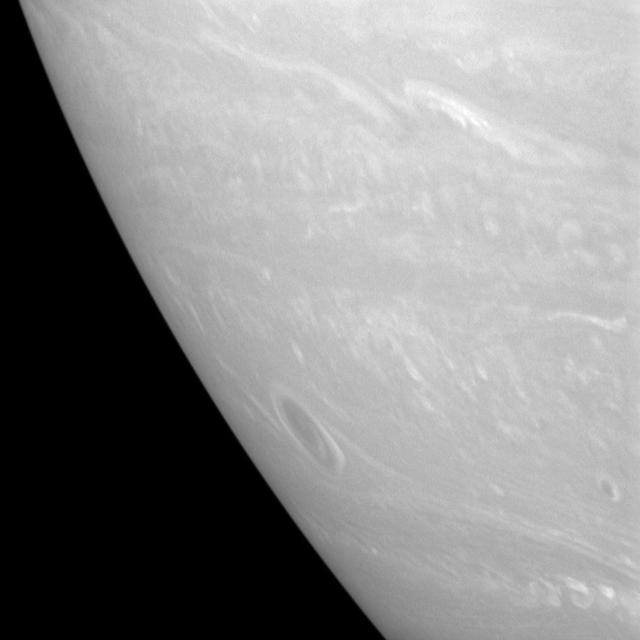
Saturn Hot Spot
Polar Dunes, Spotted
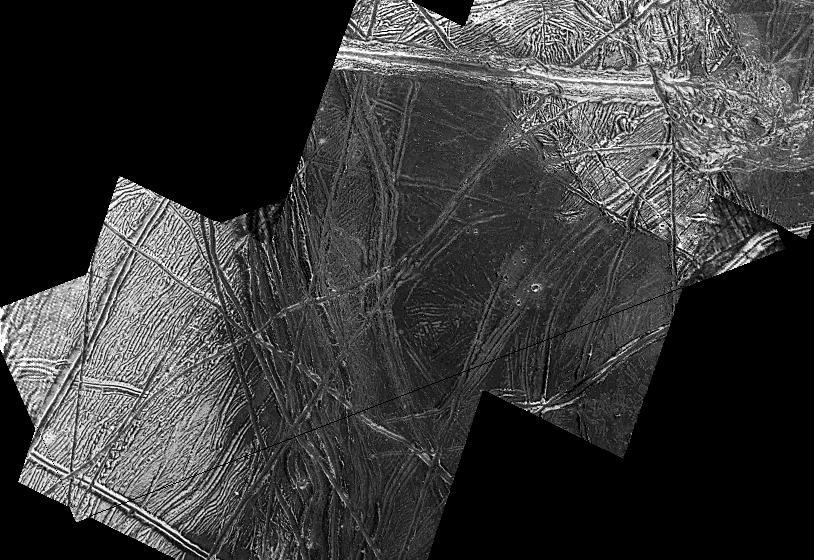
A Dark Spot on Europa
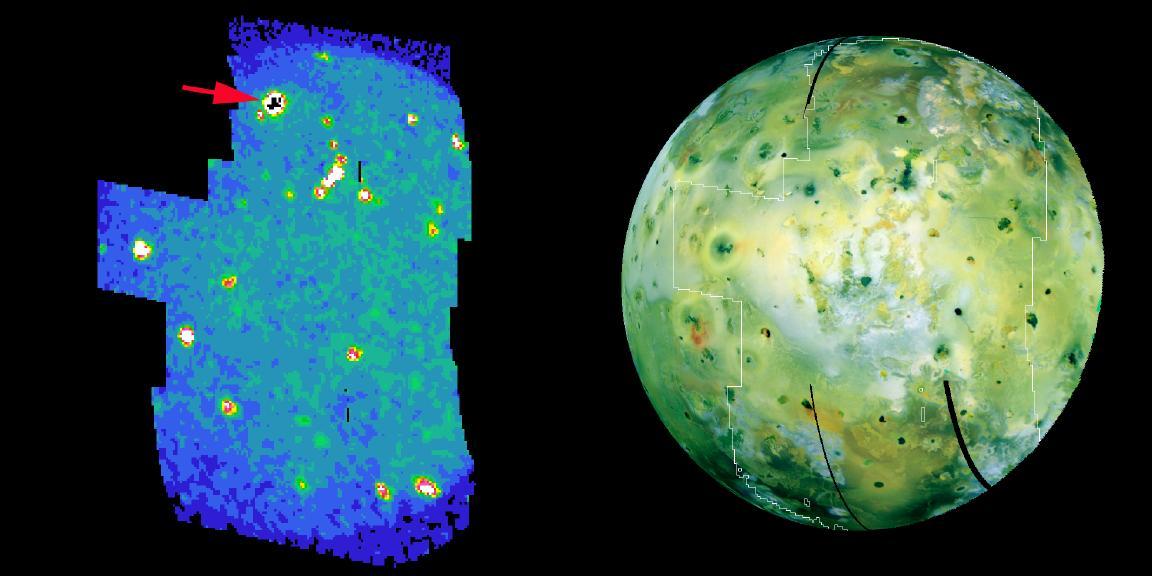
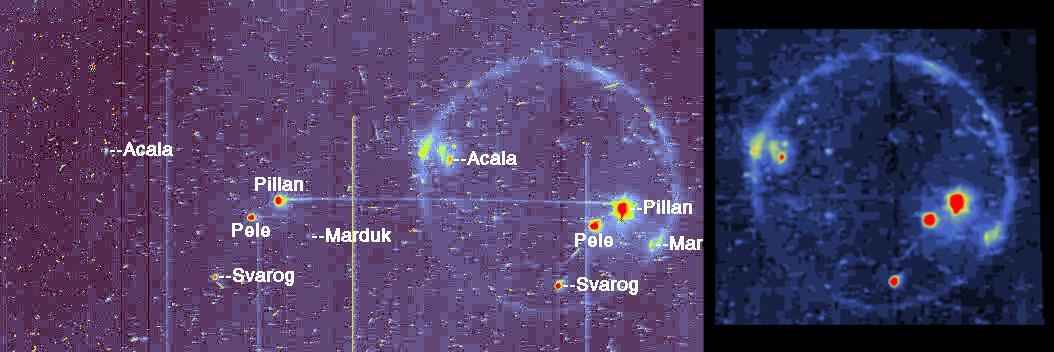
Hot Spots on Io
Red Marks the Spot
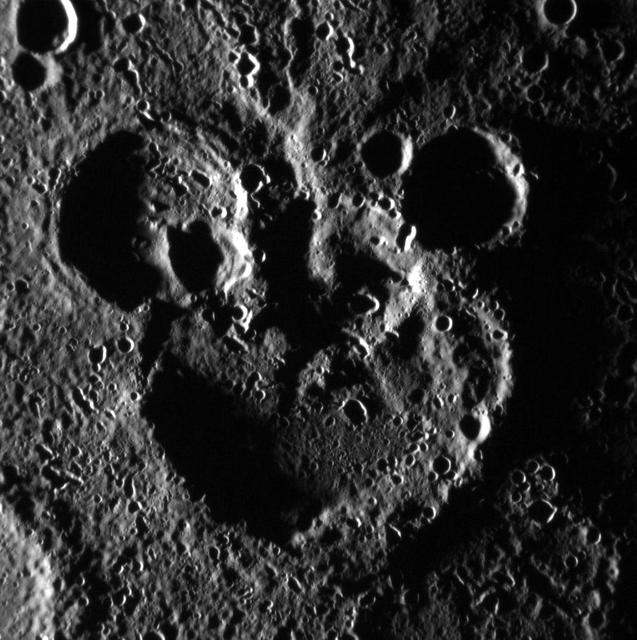
Mickey Mouse Spotted on Mercury!
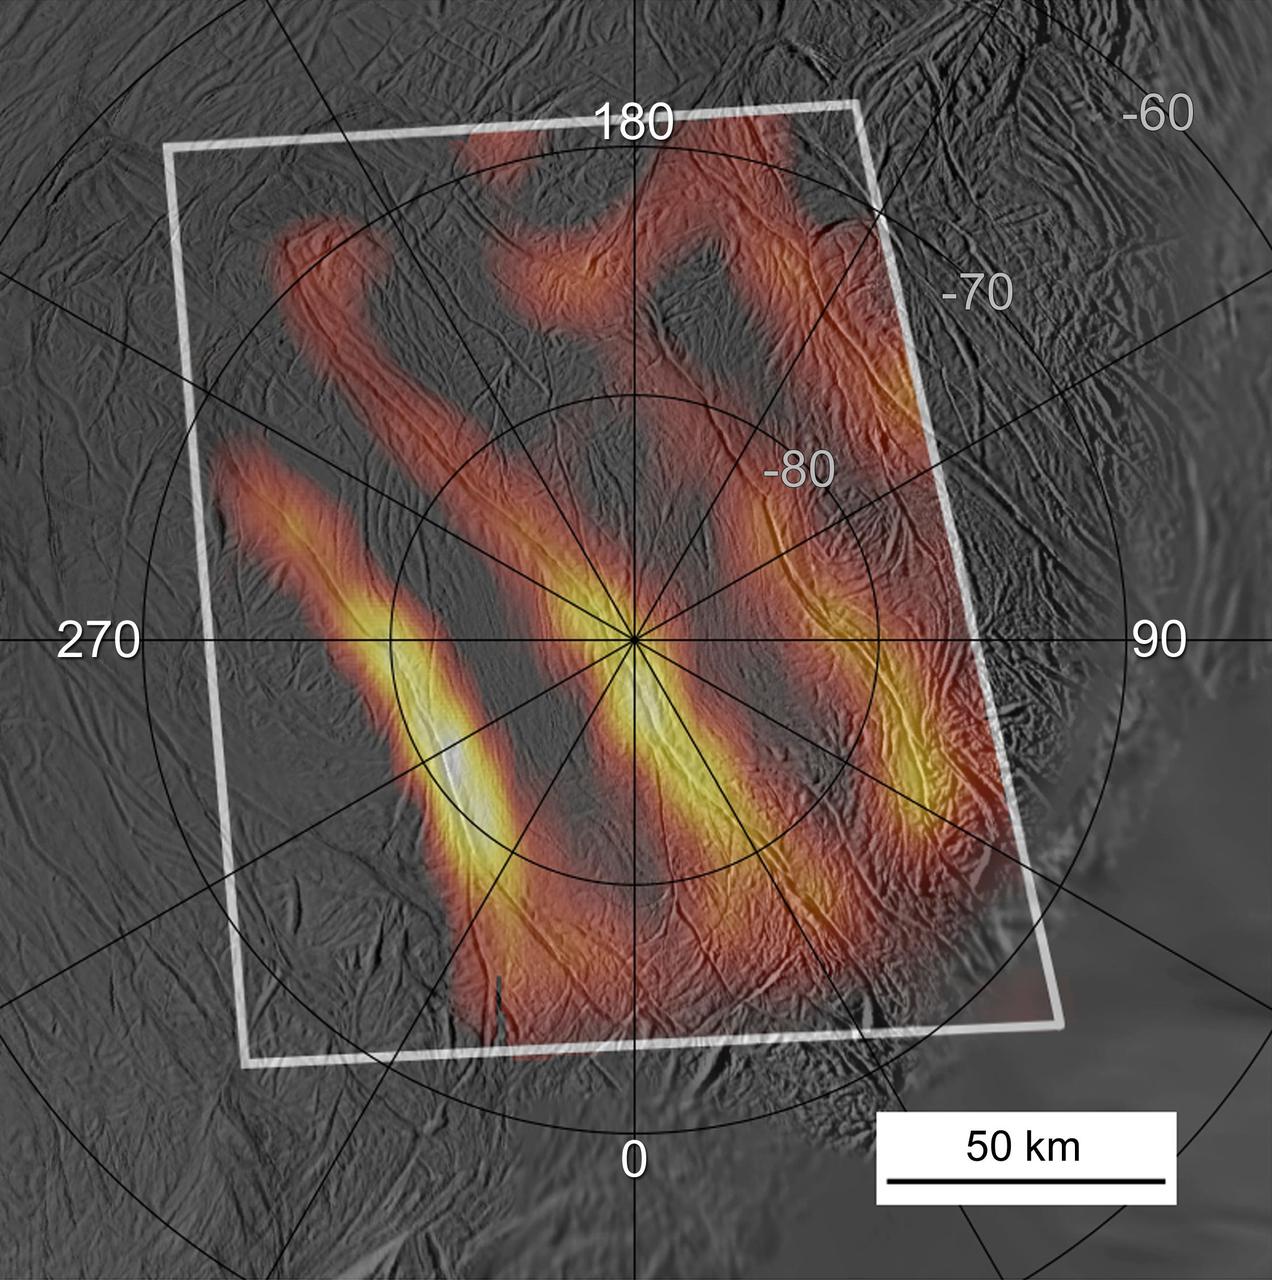
Jet Spots in Tiger Stripes
A Bright Spot in the Latest Imaging
This enhanced-color image of Jupiter's Great Red Spot was created by citizen scientist Gerald Eichstädt using data from the JunoCam imager on NASA's Juno spacecraft. The image was taken on July 10, 2017 at 07:10 p.m. PDT (10:10 p.m. EDT), as the Juno spacecraft performed its 7th close flyby of Jupiter. At the time the image was taken, the spacecraft was about 8,648 miles (13,917 kilometers) from the tops of the clouds of the planet. https://photojournal.jpl.nasa.gov/catalog/PIA21772. - Enhanced image by Gerald Eichstädt based on images provided courtesy of NASA/JPL-Caltech/SwRI/MSSS
This enhanced-color image of Jupiter's Great Red Spot was created by citizen scientist Jason Major using data from the JunoCam imager on NASA's Juno spacecraft. The image was taken on July 10, 2017 at 07:10 p.m. PDT (10:10 p.m. EDT), as the Juno spacecraft performed its 7th close flyby of Jupiter. At the time the image was taken, the spacecraft was about 8,648 miles (13,917 kilometers) from the tops of the clouds of the planet. https://photojournal.jpl.nasa.gov/catalog/PIA21772 . - Enhanced image by Jason Major based on images provided courtesy of NASA/JPL-Caltech/SwRI/MSSS

Jupiter - Southeast of Great Red Spot
Large Brown Spot in Saturn Atmosphere
Titan Odd Spot Baffles Scientists

This false-color image of Jupiter was taken on May 18, 2017, with a mid-infrared filter centered at a wavelength of 8.8 microns, at the Subaru Telescope in Hawaii, in collaboration with observations of Jupiter by NASA's Juno mission. The selected wavelength is sensitive to Jupiter's tropospheric temperatures and the thickness of a cloud near the condensation level of ammonia gas. The Great Red Spot appears distinctively at the lower center of the planet as a cold region with a thick cloud layer. It is surrounded by a warm and relatively clear periphery. To its northwest is a turbulent and chaotic region where bands of gas that is warm and dry alternate with bands of gas that is cold and moist. This image, taken a few hours before Juno's sixth close approach to Jupiter, shows the detailed atmospheric structure of the Great Red Spot and its surroundings that the Juno mission will encounter on its seventh closest approach to Jupiter on July 10, 2017, Pacific Time (July 11, Universal Time). The instrument used to take this image is Cooled Mid-Infrared Camera and Spectrometer (COMICS) of the National Astronomical Observatory of Japan's Subaru Telescope on Hawaii's Maunakea peak. https://photojournal.jpl.nasa.gov/catalog/PIA21714
This image is one of two images from NASA Hubble Space Telescope comparing the movement of Jupiter clouds. The movement of Jupiter's clouds can be seen by comparing the first map to the second one in this animated pair of images. Zooming in on the Great Red Spot at blue (below, at left) and red (below, at right) wavelengths reveals a unique filamentary feature not previously seen. http://photojournal.jpl.nasa.gov/catalog/PIA19648
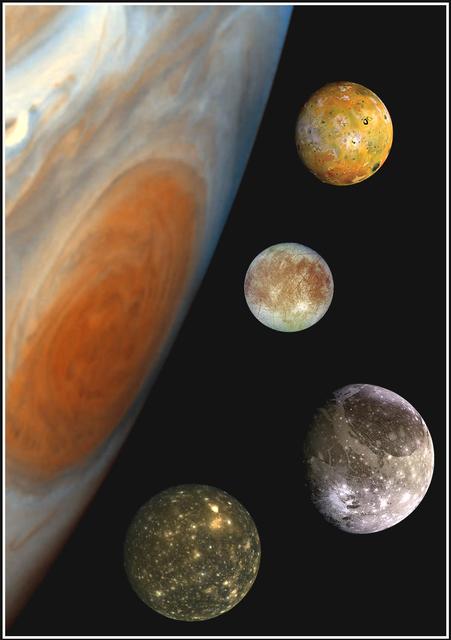
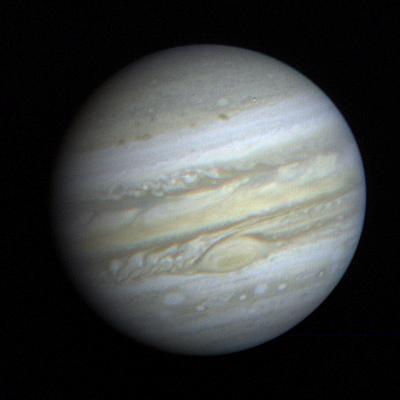
This "family portrait," a composite of the Jovian system, includes the edge of Jupiter with its Great Red Spot, and Jupiter's four largest moons, known as the Galilean satellites. From top to bottom, the moons shown are Io, Europa, Ganymede and Callisto. The Great Red Spot, a storm in Jupiter's atmosphere, is at least 300 years old. Winds blow counterclockwise around the Great Red Spot at about 400 kilometers per hour (250 miles per hour). The storm is larger than one Earth diameter from north to south, and more than two Earth diameters from east to west. In this oblique view, the Great Red Spot appears longer in the north-south direction. Europa, the smallest of the four moons, is about the size of Earth's moon, while Ganymede is the largest moon in the solar system. North is at the top of this composite picture in which the massive planet and its largest satellites have all been scaled to a common factor of 15 kilometers (9 miles) per picture element. The Solid State Imaging (CCD) system aboard NASA's Galileo spacecraft obtained the Jupiter, Io and Ganymede images in June 1996, while the Europa images were obtained in September 1996. Because Galileo focuses on high resolution imaging of regional areas on Callisto rather than global coverage, the portrait of Callisto is from the 1979 flyby of NASA's Voyager spacecraft. http://photojournal.jpl.nasa.gov/catalog/PIA00600

This composite image shows a hot spot in Jupiter's atmosphere. In the image on the left, taken on Sept. 16, 2020, by the Gemini North telescope on the island of Hawaii, the hot spot appears bright in the infrared at a wavelength of 5 microns. In the inset image on the right, taken by Juno's JunoCam visible-light imager, also on Sept. 16 during Juno's 29th perijove pass, the hot spot appears dark. Scientists have known of Jupiter's hot spots for a long time. On Dec. 7, 1995, the Galileo probe likely descended into a similar hot spot. To the naked eye, Jupiter's hot spots appear as dark, cloud-free areas in Jupiter's equatorial belt, but at infrared wavelengths, which are invisible to the human eye, they are extremely bright, revealing the warm, deep atmosphere below the clouds. High-resolution images of hot spots such as these are key both to understanding the role of storms and waves in Jupiter's atmosphere. Citizen scientist Brian Swift processed the images to enhance the color and contrast, with further processing by Tom Momary to map the JunoCam image to the Gemini data. The international Gemini North telescope is a 26.6-foot-diameter (8.1-meter-diameter) optical/infrared telescope optimized for infrared observations, and is managed for the NSF by the Association of Universities for Research in Astronomy (AURA). https://photojournal.jpl.nasa.gov/catalog/PIA24299
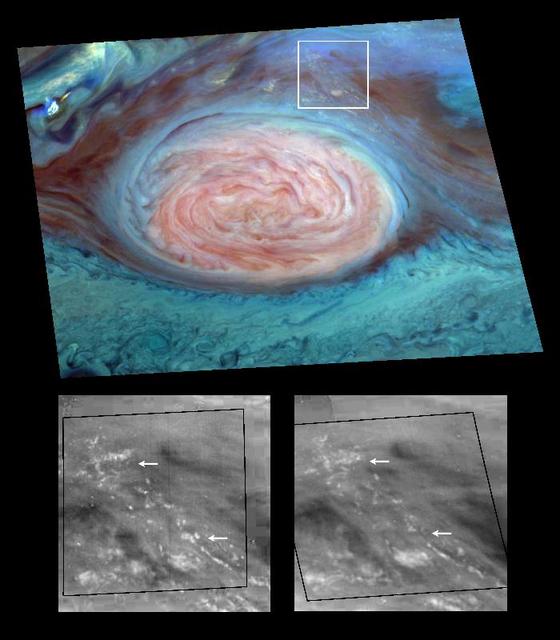
A south tropical disturbance has just passed Jupiter's iconic Great Red Spot and is captured stealing threads of orange haze from the Great Red Spot in this series of color-enhanced images from NASA's Juno spacecraft. From left to right, this sequence of images was taken between 2:57 a.m. and 3:36 a.m. PDT (5:57 a.m. and 6:36 a.m. EDT) on April 1, 2018, as the spacecraft performed its 12th close flyby of Jupiter. Citizen scientists Gerald Eichstädt and Seán Doran created this image using data from the spacecraft's JunoCam imager. https://photojournal.jpl.nasa.gov/catalog/PIA22937 ** Image Credit: Enhanced Image by Gerald Eichstädt and Seán Doran (CC BY-NC-SA) based on images provided courtesy of NASA/JPL-Caltech/SwRI/MSSS

This composite image shows a hot spot in Jupiter's atmosphere. In the image on the left, taken on Nov. 8, 2020, by NASA's Infrared Telescope Facility (IRTF) on the island of Hawaii, the hot spot appears bright in the infrared. The inset image on the right, taken by the JunoCam visible-light imager (also on Nov. 8, during Juno's 30th perijove pass), the hot spot appears dark and is flanked by high light-colored clouds to the south and a bright white storm to the west. Jupiter's hot spots have been known for a long time. On Dec. 7, 1995, the Galileo probe likely descended into a similar hot spot. To the naked eye, Jupiter's hot spots appear as dark, cloud-free spots in Jupiter's equatorial belt, but at infrared wavelengths, they are extremely bright, revealing the warm, deep atmosphere below the clouds. High-resolution images of hot spots such as these are key to understanding the role of storms and waves in Jupiter's atmosphere and to solving the mystery of Jupiter's elusive water. Citizen scientist Kevin Gill processed the image to enhance the color and contrast, with further processing by Tom Momary to map the JunoCam image to the IRTF data. The NASA IRTF is a 10.5-foot-diameter (3.2-meter-diameter) telescope optimized for infrared observations and is managed for NASA by the Institute for Astronomy at the University of Hawai'i. https://photojournal.jpl.nasa.gov/catalog/PIA24300

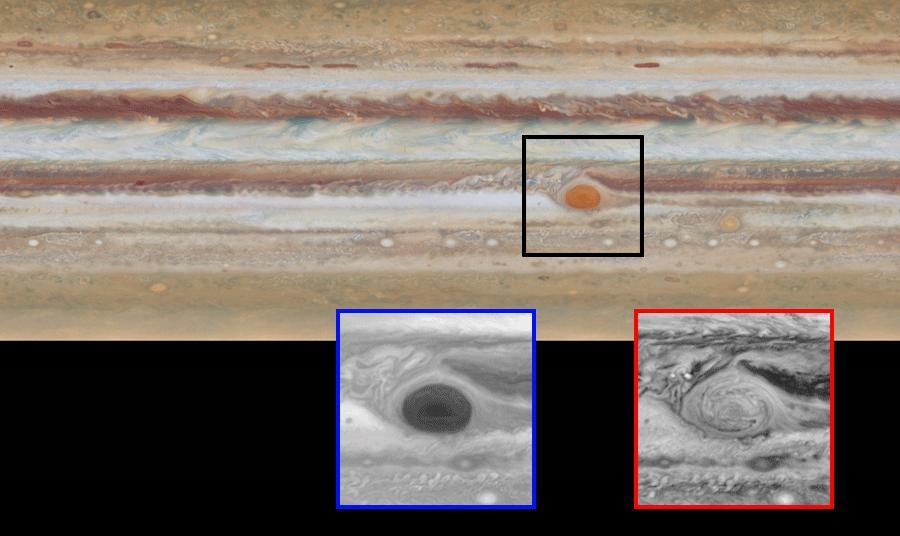
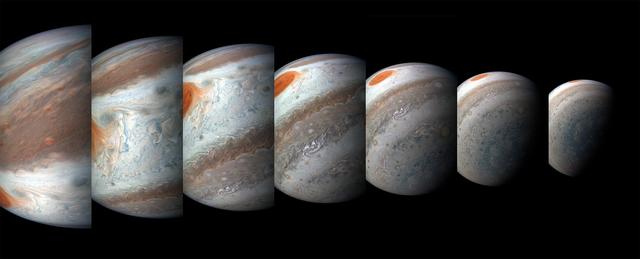
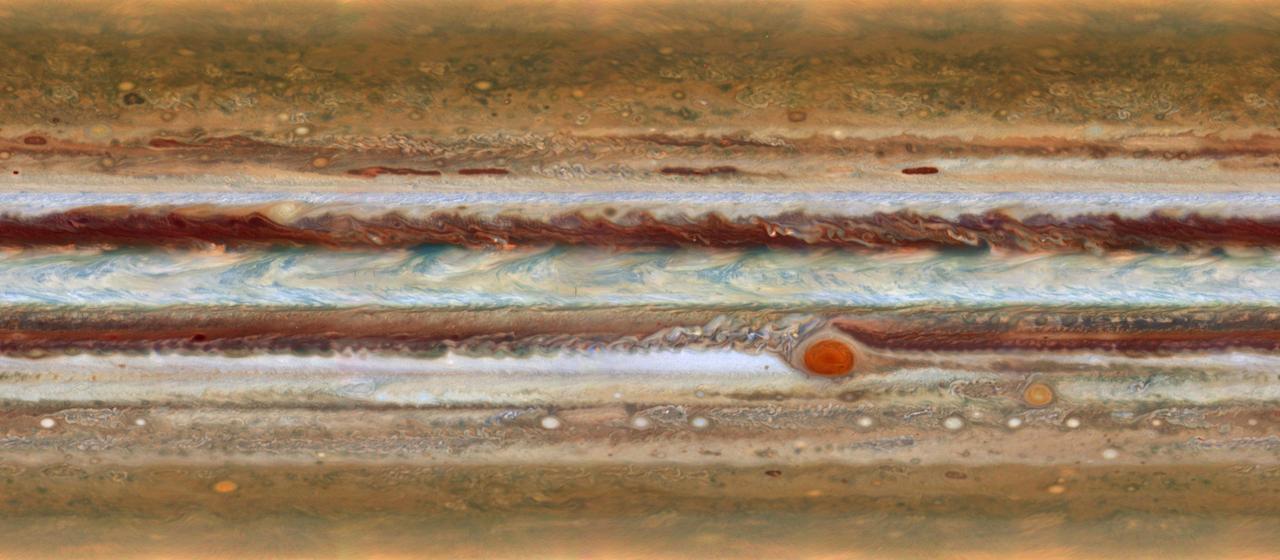
Jupiter's iconic Great Red Spot is a 10,000-mile-wide (16,000-kilometer-wide) storm that has been raging since at least the 1800s — and possibly for more than 350 years. Observations with NASA's Juno spacecraft previously indicated that the vertical extent of the Great Red Spot is over 120 miles (200 kilometers), consistent with a storm feature that develops deep in Jupiter's atmosphere. Since NASA's Voyager spacecraft visited Jupiter in 1979, the Great Red Spot has shrunk from about the size of 1.8 Earths to the size of about 1.3 Earths today. NASA's Juno spacecraft has imaged the Great Red Spot numerous times, providing unique information on the details of how the Great Red Spot dynamically changes while it is shrinking. This montage includes five map-projected mosaics of the giant storm, processed from images obtained by the JunoCam imager during several orbits between July 2017 and July 2019. The mosaics show how the Great Red Spot and nearby areas have changed over the course of the Juno mission. Will the Great Red Spot continue to shrink? Only time will tell, but as we study Jupiter's atmosphere, we learn more about how weather systems work, both on giant planets such as Jupiter and Saturn and also on our own home, Earth. Citizen scientist Björn Jónsson created this montage using JunoCam data. The images cover latitudes from about 5 degrees to 38 degrees south. Enhanced image by Björn Jónsson (CC-NC-SA) based on images provided courtesy of NASA/JPL-Caltech/SwRI/MSSS
Defrosting Polar Dunes--Dark Spots and Wind Streaks

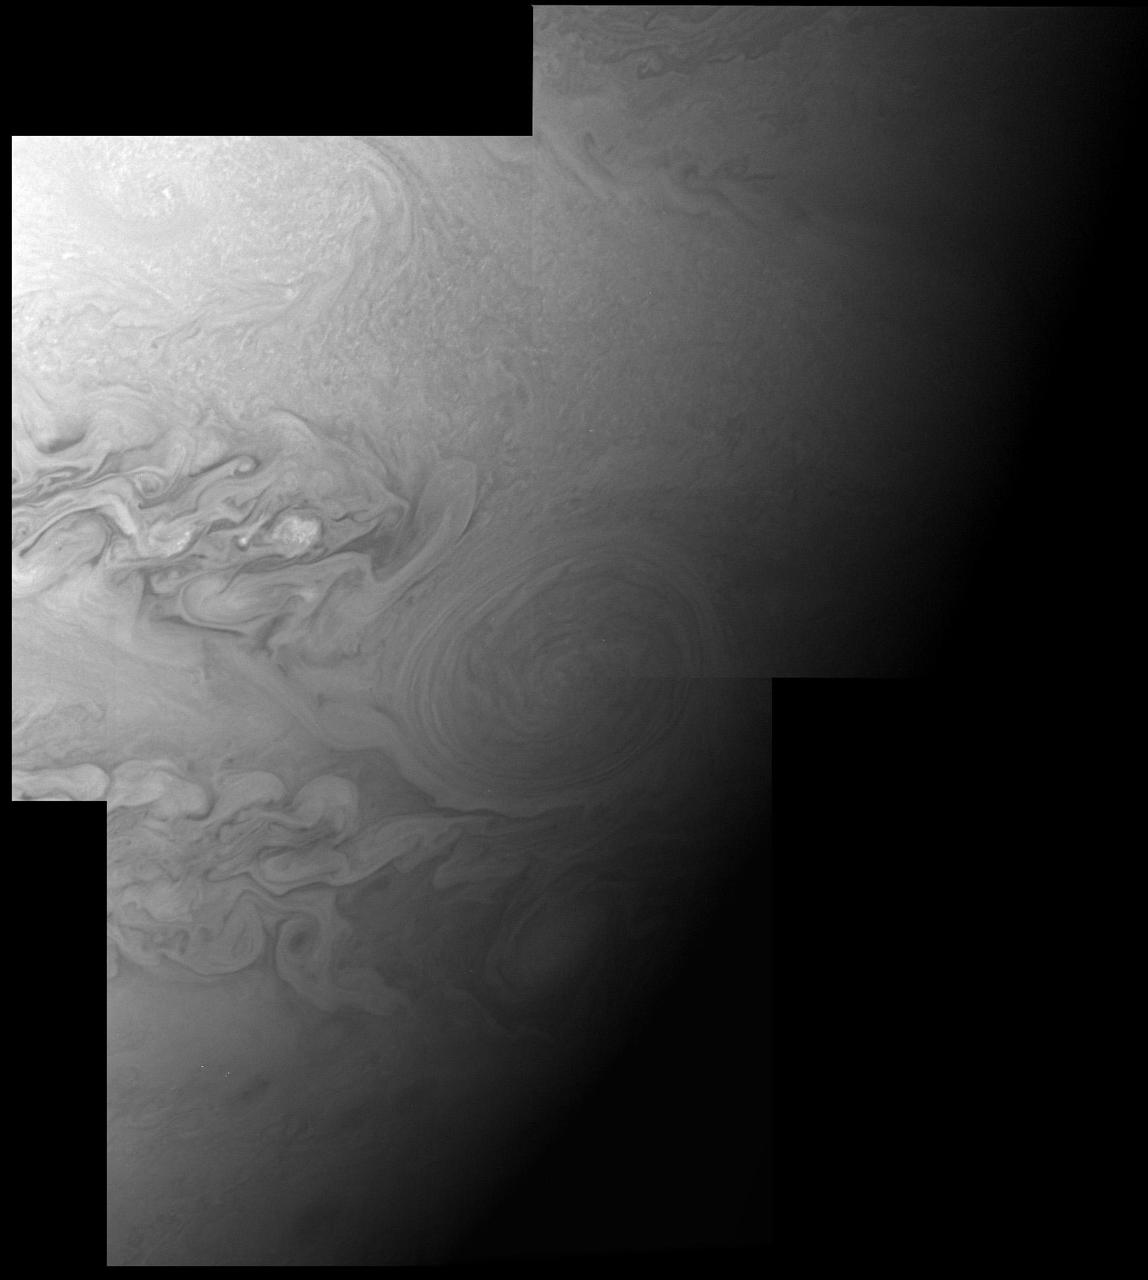
Turbulent Region Near Jupiter Great Red Spot
Best Color Image of Jupiter Little Red Spot
Jupiter Great Red Spot and White Ovals
Io in Eclipse reveals High Temperature Hot Spots
Water Cloud Thunderstorm Northwest of Great Red Spot
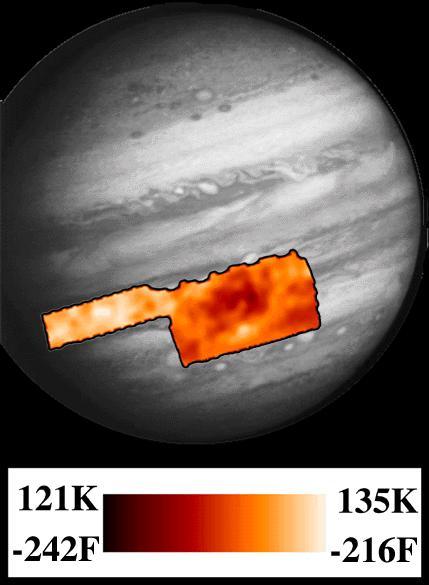
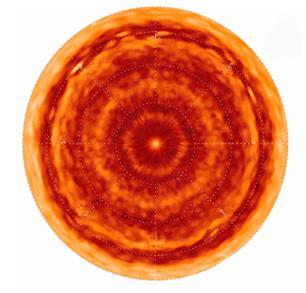
PPR Great Red Spot Temperature Map

Ammonia Ice near Jupiter Great Red Spot

Hubble Discovers Bright New Spot on Io
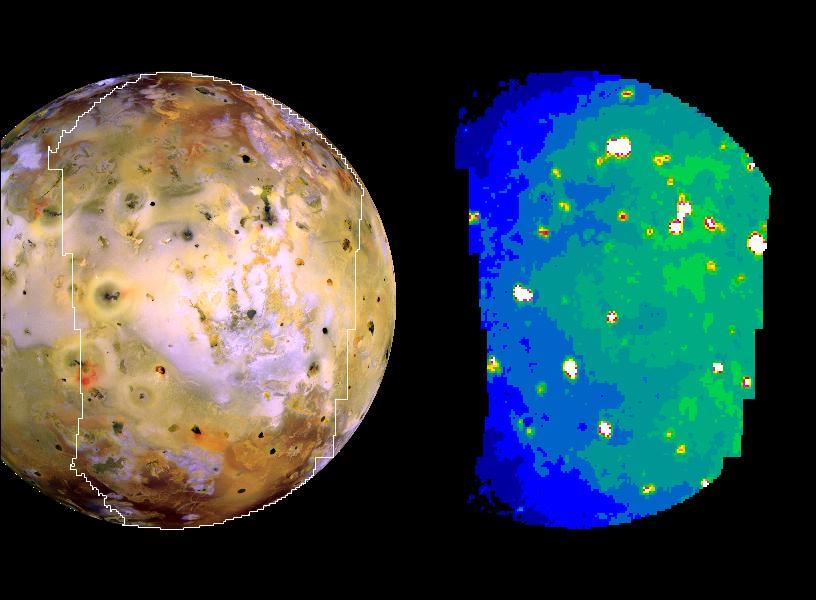
Io in Infrared with Giant Plume New Hot Spot
Saturn North Pole Hot Spot and Hexagon
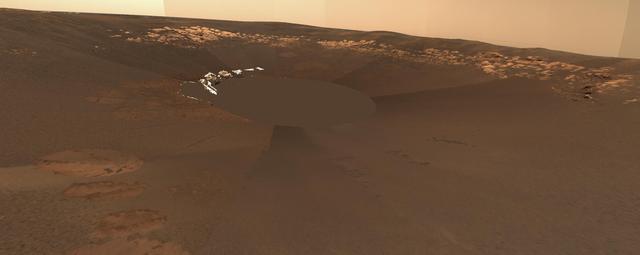
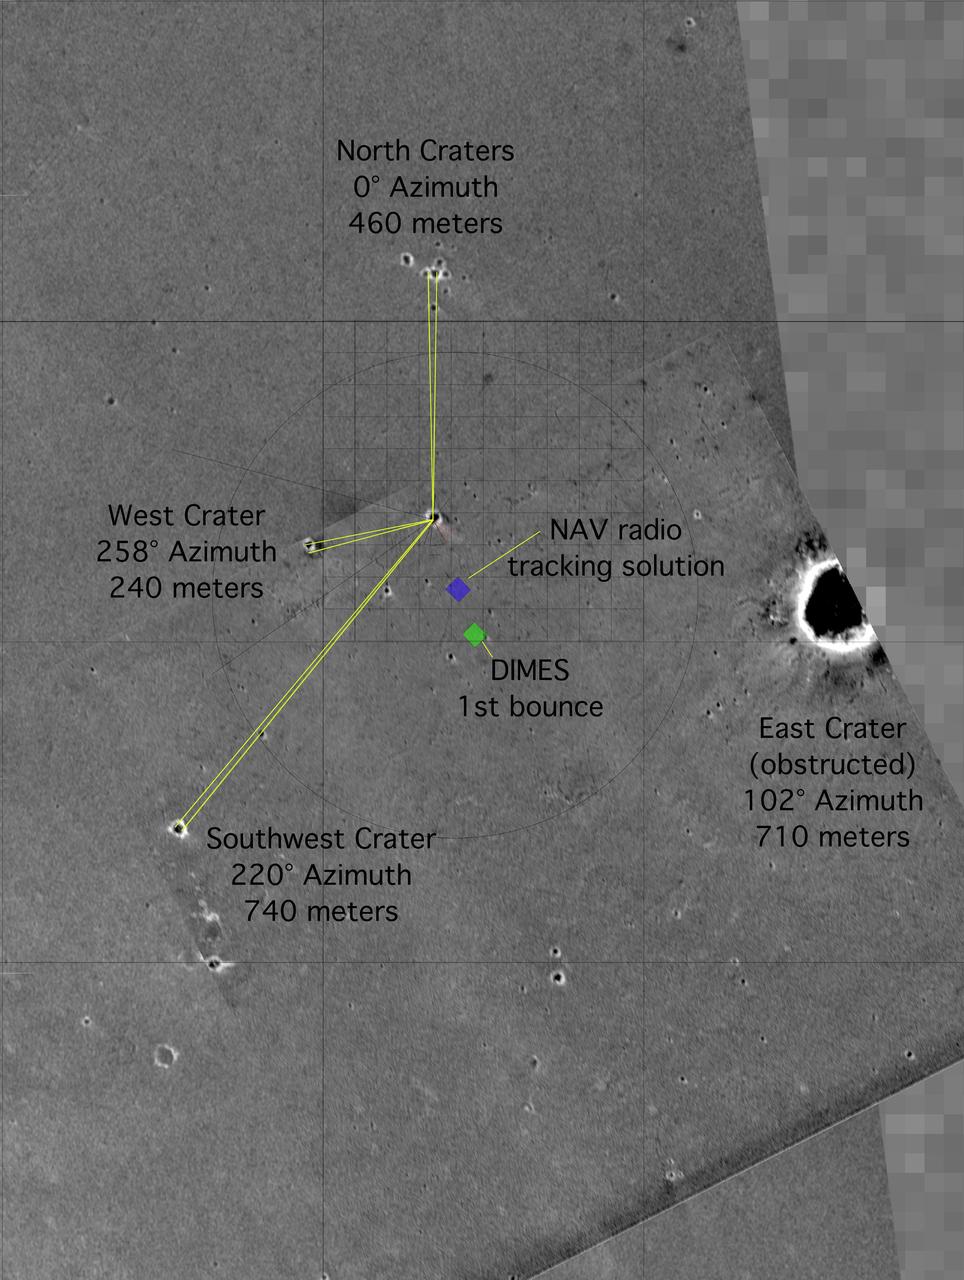
Opportunity Landing Spot Panorama 3-D Model
The Little Red Spot: Closest View Yet

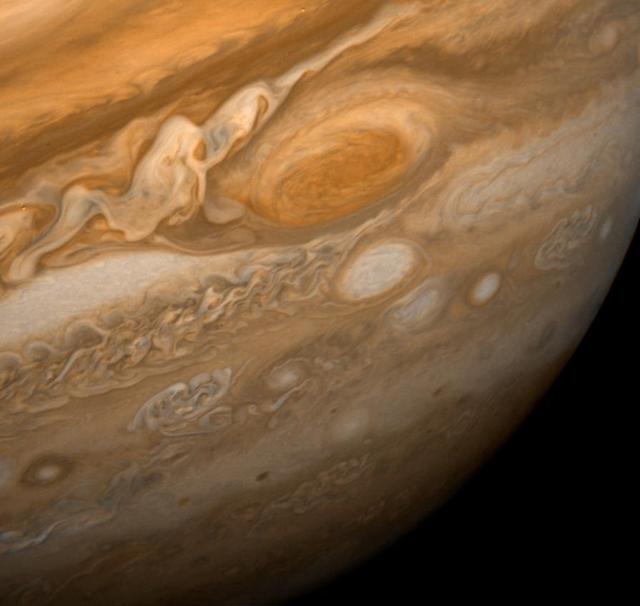
This view of Jupiter Great Red Spot is a mosaic of two images taken by NASA Galileo spacecraft. The Great Red Spot is a storm in Jupiter atmosphere and is at least 300 years-old. The image was taken on June 26, 1996. http://photojournal.jpl.nasa.gov/catalog/PIA00296

This picture of Neptune was produced from the last whole planet images taken through the green and orange filters on NASA's Voyager 2 narrow angle camera. The images were taken at a range of 4.4 million miles from the planet, 4 days and 20 hours before closest approach. The picture shows the Great Dark Spot and its companion bright smudge; on the west limb the fast moving bright feature called Scooter and the little dark spot are visible. These clouds were seen to persist for as long as Voyager's cameras could resolve them. North of these, a bright cloud band similar to the south polar streak may be seen. http://photojournal.jpl.nasa.gov/catalog/PIA01492
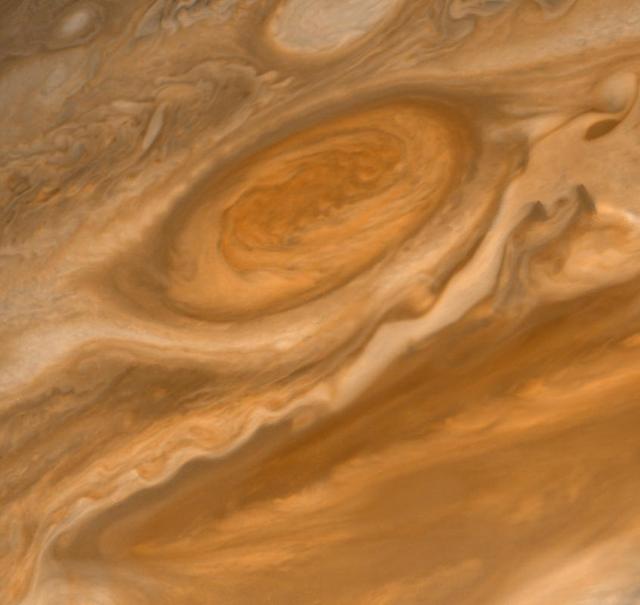
This dramatic view of Jupiter Great Red Spot and its surroundings was obtained by NASA Voyager 1 on Feb. 25, 1979. The colorful, wavy cloud pattern to the left of the Red Spot is a region of extraordinarily complex end variable wave motion. http://photojournal.jpl.nasa.gov/catalog/PIA00014
Turbulent region west of Jupiter Great Red Spot. This four image mosaic shows the Great Red Spot on Jupiter eastern edge or limb as seen by NASA Galileo orbiter d on June 26, 1996.
False color representation of Jupiter Great Red Spot GRS taken by NASA Galileo imaging system. The Great Red Spot appears pink and the surrounding region blue because of the particular color coding used in this representation.
This image is a still frame, created from images taken by NASA Cassini spacecraft, shows a turbulent region west of Jupiter Great Red Spot. The small, bright white spots are believed to be thunderstorms.
This image is a still frame, created from images taken by NASA Cassini spacecraft, shows small spots slipping over each other east of Jupiter Great Red Spot.
This photo, taken on Jan. 9, 1979 by NASA Voyager 1, is dominated by the Great Red Spot. Swirling, storm-like features possibly associated with wind shear can be seen both to the left and above the Red Spot.
In this series of images from NASA Cassini spacecraft, a dark, rectangular hot spot interacts with a line of vortices that approaches from on the upper-right side. The interaction distorts the shape of the hot spot, leaving it diminished.

This view of Jupiter was taken by Voyager 1. This image was taken through color filters and recombined to produce the color image. This photo was assembled from three black and white negatives by the Image Processing Lab at Jet Propulsion Laboratory. http://photojournal.jpl.nasa.gov/catalog/PIA01384

New imagery from the Hubble Space Telescope is revealing details never before seen on Jupiter. Hubble’s new Jupiter maps were used to create this Ultra HD animation. These new maps and spinning globes of Jupiter were made from observations performed with NASA’s Hubble Space Telescope. They are the first products to come from a program to study the solar system’s outer planets – Jupiter, Uranus, Neptune and, later, Saturn – each year using Hubble. The observations are designed to capture a broad range of features, including winds, clouds, storms and atmospheric chemistry. These annual studies will help current and future scientists see how these giant worlds change over time. Scientists at NASA’s Goddard Space Flight Center, the Jet Propulsion Laboratory, and the University of California at Berkeley produced two global maps of Jupiter from the observations, which were made using Hubble’s high-performance Wide Field Camera 3. The two maps represent nearly back-to-back rotations of the planet, making it possible to determine the speeds of Jupiter’s winds. Already, the images have revealed a rare wave just north of the planet’s equator and a unique filament-like feature in the core of the Great Red Spot that had not been seen previously. In addition, the new images confirm that the Great Red Spot continues to shrink and become more circular, as it has been doing for years. The long axis of this characteristic storm is about 150 miles (240 kilometers) shorter now than it was in 2014. Recently, the storm had been shrinking at a faster-than-usual rate, but the latest change is consistent with the long-term trend. Read more:http://www.nasa.gov/press-release/goddard/hubble-s-planetary-portrait-captures-new-changes-in-jupiter-s-great-red-spot Credits: NASA/ESA/Goddard/UCBerkeley/JPL-Caltech/STScI <b><a href="http://www.nasa.gov/audience/formedia/features/MP_Photo_Guidelines.html" rel="nofollow">NASA image use policy.</a></b> <b><a href="http://www.nasa.gov/centers/goddard/home/index.html" rel="nofollow">NASA Goddard Space Flight Center</a></b> enables NASA’s mission through four scientific endeavors: Earth Science, Heliophysics, Solar System Exploration, and Astrophysics. Goddard plays a leading role in NASA’s accomplishments by contributing compelling scientific knowledge to advance the Agency’s mission. <b>Follow us on <a href="http://twitter.com/NASAGoddardPix" rel="nofollow">Twitter</a></b> <b>Like us on <a href="http://www.facebook.com/pages/Greenbelt-MD/NASA-Goddard/395013845897?ref=tsd" rel="nofollow">Facebook</a></b> <b>Find us on <a href="http://instagrid.me/nasagoddard/?vm=grid" rel="nofollow">Instagram</a></b>
New imagery from the Hubble Space Telescope is revealing details never before seen on Jupiter. Hubble’s new Jupiter maps were used to create this Ultra HD animation. These new maps and spinning globes of Jupiter were made from observations performed with NASA’s Hubble Space Telescope. They are the first products to come from a program to study the solar system’s outer planets – Jupiter, Uranus, Neptune and, later, Saturn – each year using Hubble. The observations are designed to capture a broad range of features, including winds, clouds, storms and atmospheric chemistry. These annual studies will help current and future scientists see how these giant worlds change over time. Scientists at NASA’s Goddard Space Flight Center, the Jet Propulsion Laboratory, and the University of California at Berkeley produced two global maps of Jupiter from the observations, which were made using Hubble’s high-performance Wide Field Camera 3. The two maps represent nearly back-to-back rotations of the planet, making it possible to determine the speeds of Jupiter’s winds. Already, the images have revealed a rare wave just north of the planet’s equator and a unique filament-like feature in the core of the Great Red Spot that had not been seen previously. In addition, the new images confirm that the Great Red Spot continues to shrink and become more circular, as it has been doing for years. The long axis of this characteristic storm is about 150 miles (240 kilometers) shorter now than it was in 2014. Recently, the storm had been shrinking at a faster-than-usual rate, but the latest change is consistent with the long-term trend. Read more: <a href="http://www.nasa.gov/press-release/goddard/hubble-s-planetary-portrait-captures-new-changes-in-jupiter-s-great-red-spot" rel="nofollow">www.nasa.gov/press-release/goddard/hubble-s-planetary-por...</a> Credits: NASA/ESA/Goddard/UCBerkeley/JPL-Caltech/STScI <b><a href="http://www.nasa.gov/audience/formedia/features/MP_Photo_Guidelines.html" rel="nofollow">NASA image use policy.</a></b> <b><a href="http://www.nasa.gov/centers/goddard/home/index.html" rel="nofollow">NASA Goddard Space Flight Center</a></b> enables NASA’s mission through four scientific endeavors: Earth Science, Heliophysics, Solar System Exploration, and Astrophysics. Goddard plays a leading role in NASA’s accomplishments by contributing compelling scientific knowledge to advance the Agency’s mission. <b>Follow us on <a href="http://twitter.com/NASAGoddardPix" rel="nofollow">Twitter</a></b> <b>Like us on <a href="http://www.facebook.com/pages/Greenbelt-MD/NASA-Goddard/395013845897?ref=tsd" rel="nofollow">Facebook</a></b> <b>Find us on <a href="http://instagrid.me/nasagoddard/?vm=grid" rel="nofollow">Instagram</a></b>
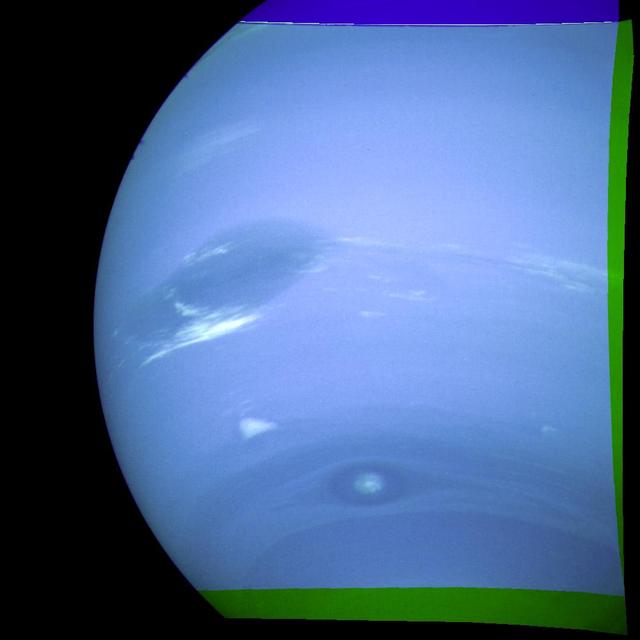
This photograph of Neptune was reconstructed from two images taken by NASA Voyager 2. At the north top is the Great Dark Spot. http://photojournal.jpl.nasa.gov/catalog/PIA00049
Dark spots left and fans appear to scribble dusty hieroglyphics on top of the Martian south polar cap in two high-resolution Mars Global Surveyor, Mars Orbiter Camera images taken in southern spring
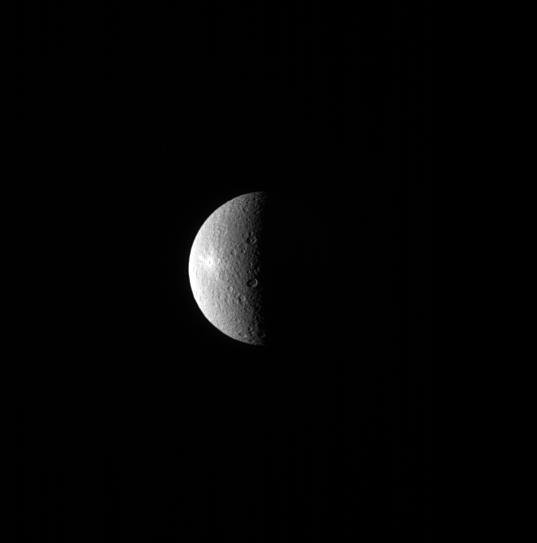
A bright spot can be seen on the left side of Rhea in this image. The spot is the crater Inktomi, named for a Lakota spider spirit. Inktomi is believed to be the youngest feature on Rhea (949 miles or 1527 kilometers across). The relative youth of the feature is evident by its brightness. Material that is newly excavated from below the moon's surface and tossed across the surface by a cratering event, appears bright. But as the newly exposed surface is subjected to the harsh space environment, it darkens. This is one technique scientists use to date features on surfaces. This view looks toward the trailing hemisphere of Rhea. North on Rhea is up and rotated 21 degrees to the left. The image was taken in visible light with the Cassini spacecraft narrow-angle camera on July 29, 2013. The view was obtained at a distance of approximately 1.0 million miles (1.6 million kilometers) fro http://photojournal.jpl.nasa.gov/catalog/PIA18300
An image of Jupiter's Great Red Spot taken in 2014 with Hubble's WFC3 camera. The spot has a diameter here of 16 000km. -- Jupiter's trademark Great Red Spot -- a swirling anti-cyclonic storm larger than Earth -- has shrunk to its smallest size ever measured. According to Amy Simon of NASA's Goddard Space Flight Center in Greenbelt, Maryland, recent NASA Hubble Space Telescope observations confirm the Great Red Spot now is approximately 10,250 miles across. Astronomers have followed this downsizing since the 1930s. Historic observations as far back as the late 1800s gauged the storm to be as large as 25,500 miles on its long axis. NASA Voyager 1 and Voyager 2 flybys of Jupiter in 1979 measured it to be 14,500 miles across. In 1995, a Hubble photo showed the long axis of the spot at an estimated 13,020 miles across. And in a 2009 photo, it was measured at 11,130 miles across. Beginning in 2012, amateur observations revealed a noticeable increase in the rate at which the spot is shrinking -- by 580 miles per year -- changing its shape from an oval to a circle. Read more: <a href="http://1.usa.gov/1mvuo0R" rel="nofollow">1.usa.gov/1mvuo0R</a> Credit: NASA/ESA <b><a href="http://www.nasa.gov/audience/formedia/features/MP_Photo_Guidelines.html" rel="nofollow">NASA image use policy.</a></b> <b><a href="http://www.nasa.gov/centers/goddard/home/index.html" rel="nofollow">NASA Goddard Space Flight Center</a></b> enables NASA’s mission through four scientific endeavors: Earth Science, Heliophysics, Solar System Exploration, and Astrophysics. Goddard plays a leading role in NASA’s accomplishments by contributing compelling scientific knowledge to advance the Agency’s mission. <b>Follow us on <a href="http://twitter.com/NASAGoddardPix" rel="nofollow">Twitter</a></b> <b>Like us on <a href="http://www.facebook.com/pages/Greenbelt-MD/NASA-Goddard/395013845897?ref=tsd" rel="nofollow">Facebook</a></b> <b>Find us on <a href="http://instagram.com/nasagoddard?vm=grid" rel="nofollow">Instagram</a></b>

This photo of Jupiter Great Red Spot was taken by Voyager 1 in early March 1979.
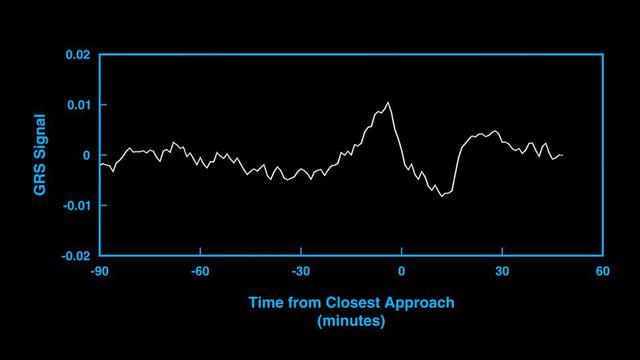
This animation and audio represent the subtle gravitational signal acquired by an antenna of NASA's Deep Space Network as the agency's Juno spacecraft performed a close flyby of Jupiter's Great Red Spot in July 2019. The changes in the signal frequency represent the changes in the local gravity as the spacecraft flew low overhead. Juno flew twice over the Great Red Spot in 2019, with the goal of picking up the subtle gravitational signal of the vortex. The concentration of mass caused by the powerful winds surrounding the Great Red Spot minutely change the spacecraft's velocity, inducing a Doppler shift on the radio signals relayed back to Earth. Movie available at https://photojournal.jpl.nasa.gov/catalog/PIA24963
Numerous small, bright spots appear on asteroid Vesta, as seen in this image from NASA Dawn spacecraft. This region is just north of the equator, to the west of Marcia crater.
Dark spots appear on the south polar ice cap just after the sun starts to shine in this image captured by NASA Mars Odyssey.
This picture from NASA Voyager 2 shows a region of the southern hemisphere extending from the Great Red Spot to the south pole. The white oval is seen beneath the Great Red Spot, and several small scale spots are visible farther to the south. http://photojournal.jpl.nasa.gov/catalog/PIA00372
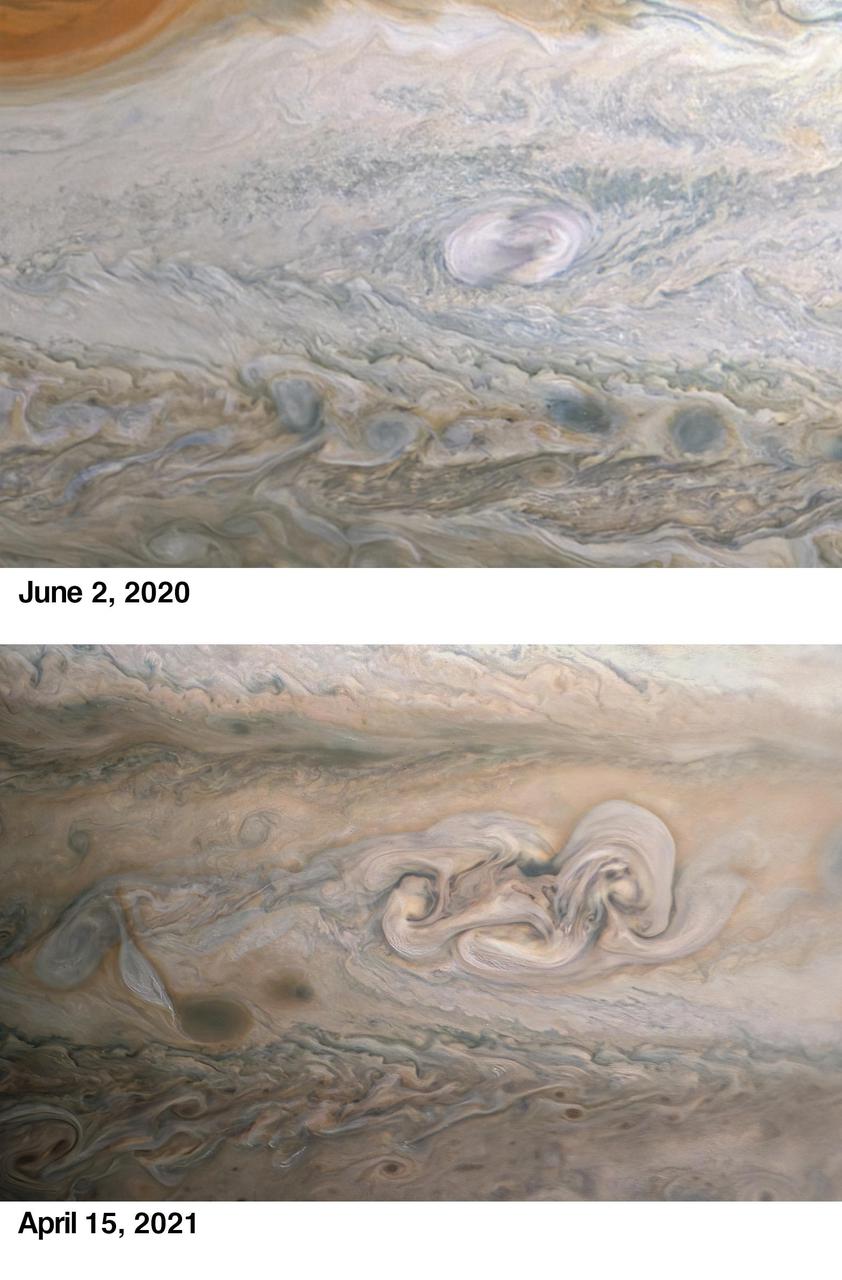
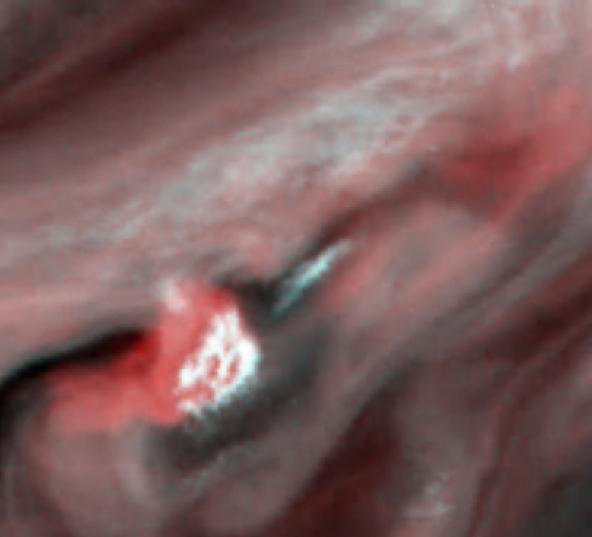
During its 33rd low pass over the cloud tops of Jupiter on April 15, 2021, NASA's Juno spacecraft captured the intriguing evolution of a feature in the giant planet's atmosphere known as "Clyde's Spot." The feature is informally named for amateur astronomer Clyde Foster of Centurion, South Africa, who discovered it in 2020 using his own 14-inch telescope. On June 2, 2020, just two days after Foster's initial discovery, Juno provided detailed observations of Clyde's Spot (upper image), which scientists determined was a plume of cloud material erupting above the top layers of the Jovian atmosphere just southeast of Jupiter's Great Red Spot, which is currently about 1.3 times as wide as Earth. These powerful convective outbreaks occasionally occur in this latitude band, known as the South Temperate Belt. The initial plume subsided quickly, and within a few weeks it was seen as a dark spot. Many features in Jupiter's highly dynamic atmosphere are short lived, but the April 2021 observation from the JunoCam instrument (lower image) revealed that nearly one year after its discovery, the remnant of Clyde's Spot had not only drifted away from the Great Red Spot but had also developed into a complex structure that scientists call a folded filamentary region. This region is twice as big in latitude and three times as big in longitude as the original spot, and has the potential to persist for an extended period of time. The upper image was taken on June 2, 2020, around 3:56 a.m. when the spacecraft was about 28,000 miles (45,000 kilometers) from Jupiter's cloud tops. The lower image was taken on April 15, 2021, at 4:58 p.m. PDT (7:58 p.m. EDT). At the time, the spacecraft was about 16,800 miles (27,000 kilometers) from Jupiter's cloud tops, at a latitude of about 30 degrees South. Another citizen scientist, Kevin M. Gill, processed both images from raw JunoCam data. https://photojournal.jpl.nasa.gov/catalog/PIA23609
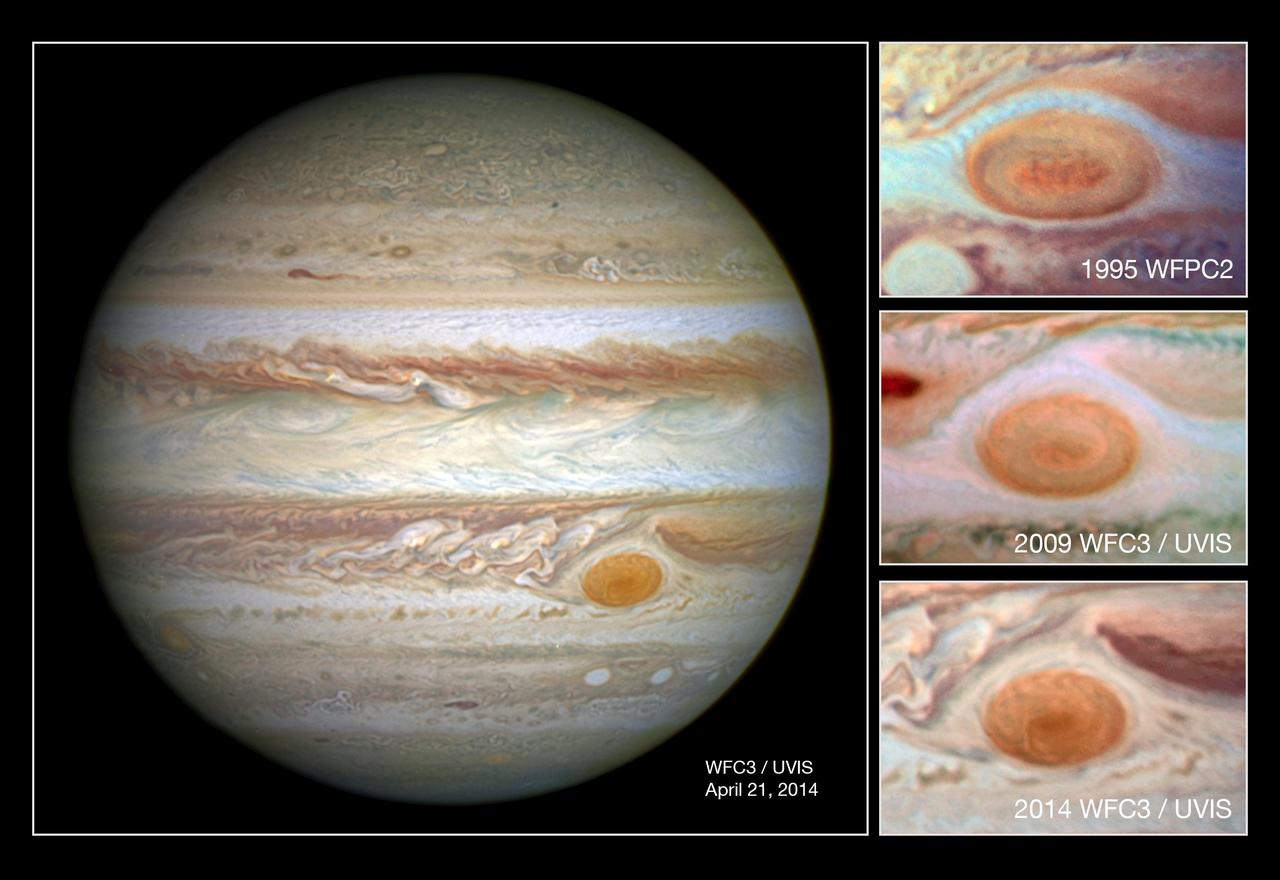
In this comparison image the photo at the top was taken by Hubble's Wide Field Planetary Camera 2 in 1995 and shows the spot at a diameter of just under 21 000km; the second down shows a 2009 WFC3 photo of the spot at a diameter of just under 18 000km; and the lowest shows the newest image from WFC3 taken in 2014 with the spot at its smallest yet, with diameter of just 16 000km. -- Jupiter's trademark Great Red Spot -- a swirling anti-cyclonic storm larger than Earth -- has shrunk to its smallest size ever measured. According to Amy Simon of NASA's Goddard Space Flight Center in Greenbelt, Maryland, recent NASA Hubble Space Telescope observations confirm the Great Red Spot now is approximately 10,250 miles across. Astronomers have followed this downsizing since the 1930s. Historic observations as far back as the late 1800s gauged the storm to be as large as 25,500 miles on its long axis. NASA Voyager 1 and Voyager 2 flybys of Jupiter in 1979 measured it to be 14,500 miles across. In 1995, a Hubble photo showed the long axis of the spot at an estimated 13,020 miles across. And in a 2009 photo, it was measured at 11,130 miles across. Beginning in 2012, amateur observations revealed a noticeable increase in the rate at which the spot is shrinking -- by 580 miles per year -- changing its shape from an oval to a circle. Read more: <a href="http://1.usa.gov/1mvuo0R" rel="nofollow">1.usa.gov/1mvuo0R</a> Credit: NASA/ESA <b><a href="http://www.nasa.gov/audience/formedia/features/MP_Photo_Guidelines.html" rel="nofollow">NASA image use policy.</a></b> <b><a href="http://www.nasa.gov/centers/goddard/home/index.html" rel="nofollow">NASA Goddard Space Flight Center</a></b> enables NASA’s mission through four scientific endeavors: Earth Science, Heliophysics, Solar System Exploration, and Astrophysics. Goddard plays a leading role in NASA’s accomplishments by contributing compelling scientific knowledge to advance the Agency’s mission. <b>Follow us on <a href="http://twitter.com/NASAGoddardPix" rel="nofollow">Twitter</a></b> <b>Like us on <a href="http://www.facebook.com/pages/Greenbelt-MD/NASA-Goddard/395013845897?ref=tsd" rel="nofollow">Facebook</a></b> <b>Find us on <a href="http://instagram.com/nasagoddard?vm=grid" rel="nofollow">Instagram</a></b>
Context Camera Spots Dust Devils at Phoenix Landing Site
LORRI Takes an Even Closer Look at the Little Red Spot
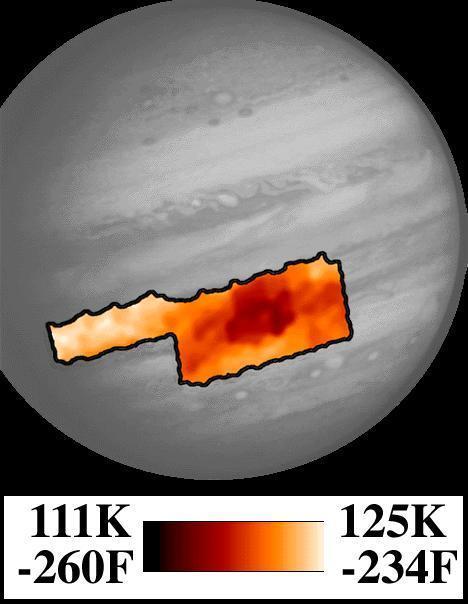
Photopolarimeter/Radiometer PPR Temperature Map of Great Red Spot
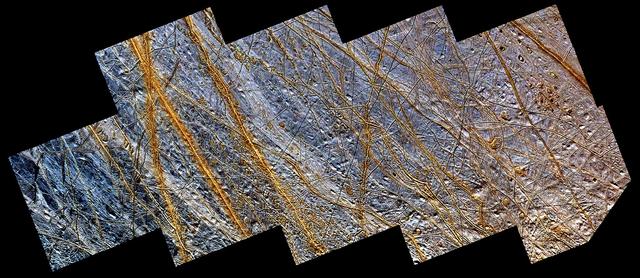
Double Ridges, Dark Spots, and Smooth Icy Plains on Europa
Changes in Jupiter Great Red Spot After Four Months
NASA's Juno spacecraft obtained this color view on June 28, 2016, at a distance of 3.9 million miles (6.2 million kilometers) from Jupiter. As Juno nears its destination, features on the giant planet are increasingly visible, including the Great Red Spot. The spacecraft is approaching over Jupiter's north pole, providing a unique perspective on the Jupiter system, including its four large moons. The scene was captured by the mission's imaging camera, called JunoCam, which is designed to acquire high resolution views of features in Jupiter's atmosphere from very close to the planet. http://photojournal.jpl.nasa.gov/catalog/PIA20705
X Marks the Spot
This image shows numerous dark shapes and bright spots on a sand dune in the Northern polar regions of Mars. This observation is from NASA Mars Reconnaissance Orbiter.

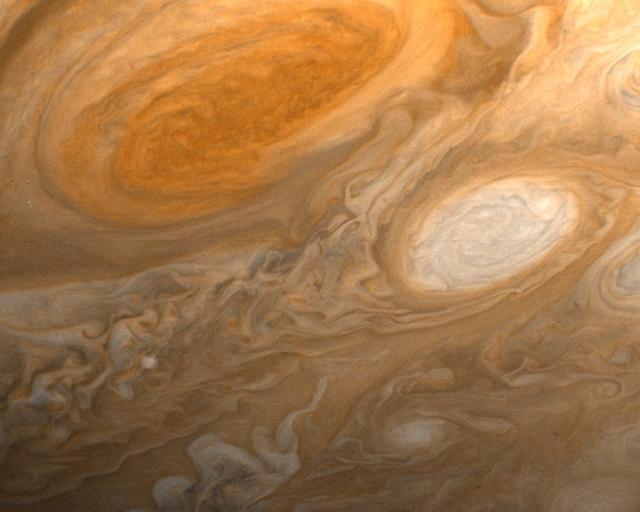
Roughly true color image of the Great Red Spot of Jupiter as taken by NASA Galileo spacecraft on June 26, 1996.
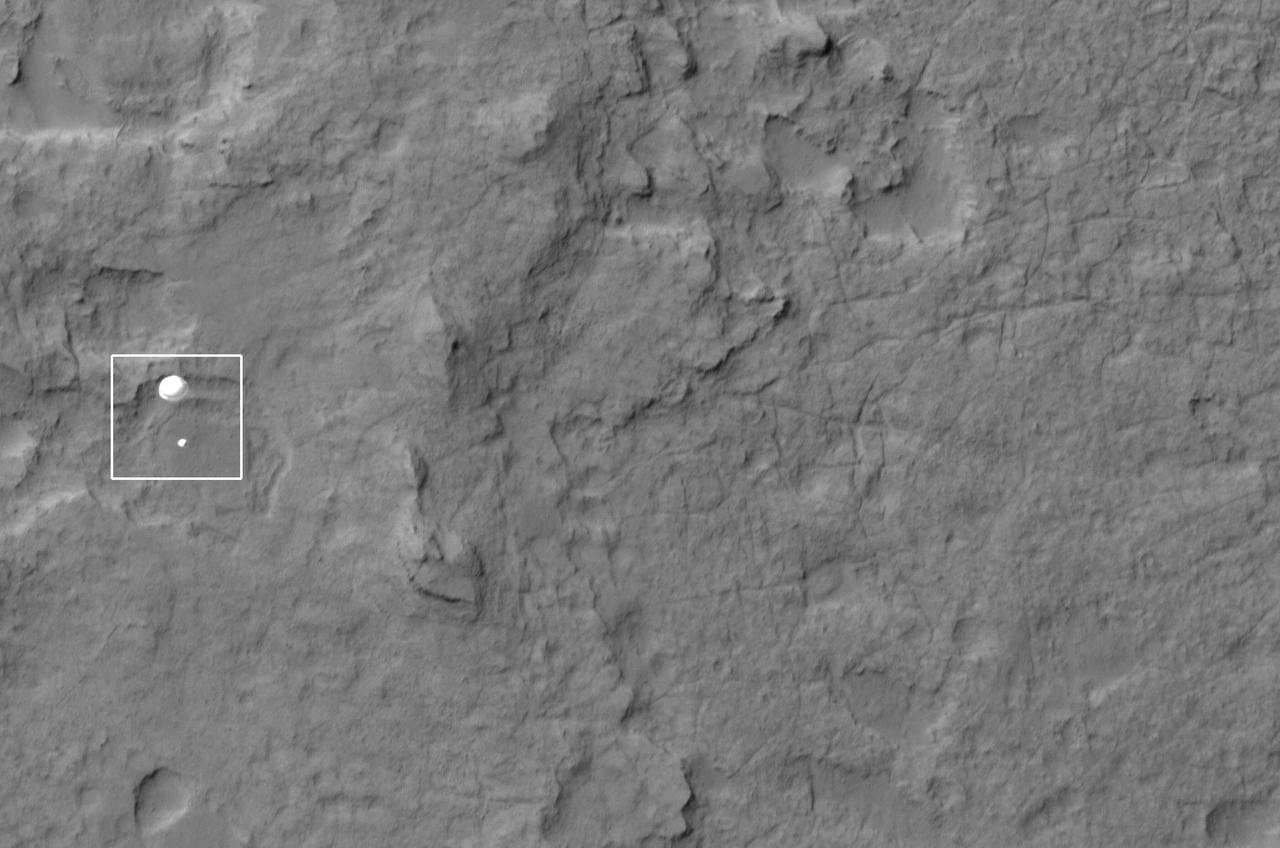
NASA Curiosity rover and its parachute were spotted by NASA Mars Reconnaissance Orbiter as Curiosity descended to the surface on Aug. 5 PDT Aug. 6 EDT. Curiosity and its parachute are in the center of the white box.
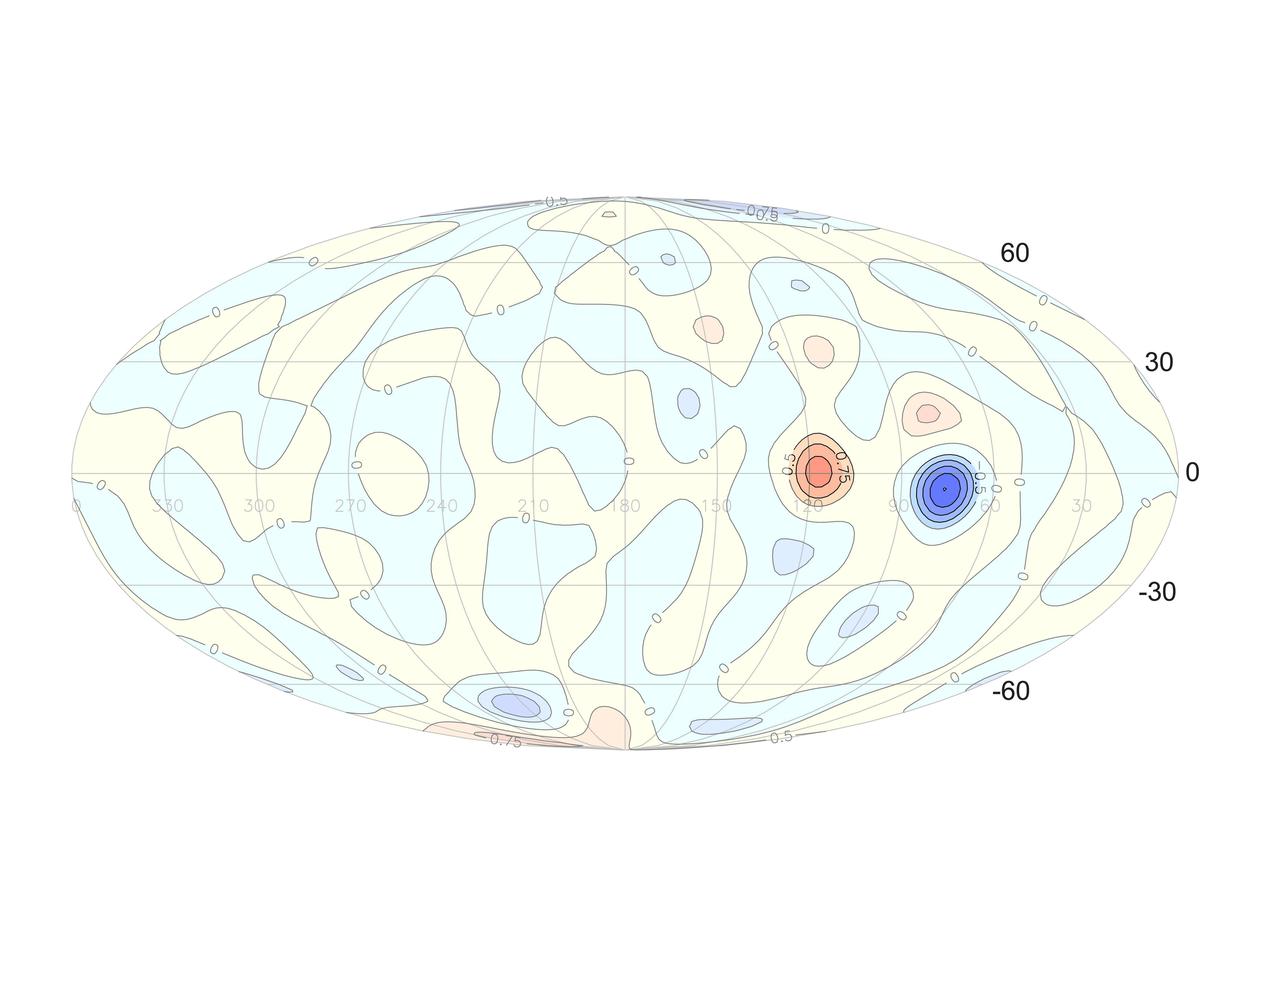
This graphic shows a comparison of the observed change in Jupiter's radial magnetic field, over time, as well as the change calculated from the model, assuming eastward drift of the "Great Blue Spot" (GBS). https://photojournal.jpl.nasa.gov/catalog/PIA25036
This frame from an animation based on NASA Spitzer Space Telescope data illustrates an unexpected warm spot on the surface of a gaseous exoplanet.The bright orange patches are the hottest part of the planet.
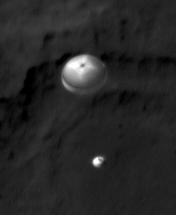
NASA Curiosity rover and its parachute were spotted by NASA Mars Reconnaissance Orbiter as Curiosity descended to the surface. The HiRISE camera captured this image of Curiosity while the orbiter was listening to transmissions from the rover.
This image of a dark-rayed impact crater and several dark spots was obtained by NASA Dawn spacecraft. The dark materials are located near an older, larger crater in the Sextilia quadrangle of asteroid Vesta southern hemisphere.

This photo was taken by NASA Voyager 2 wide-angle camera. Light at methane wavelengths is mostly absorbed in the deeper atmosphere. The bright, white feature is a high-altitude cloud just south of the Great Dark Spot.

As winter turns to spring at the south polar ice cap of Mars, the rising sun reveals dark spots and fans emerging from the cold polar night. Using visual images left and temperature data right
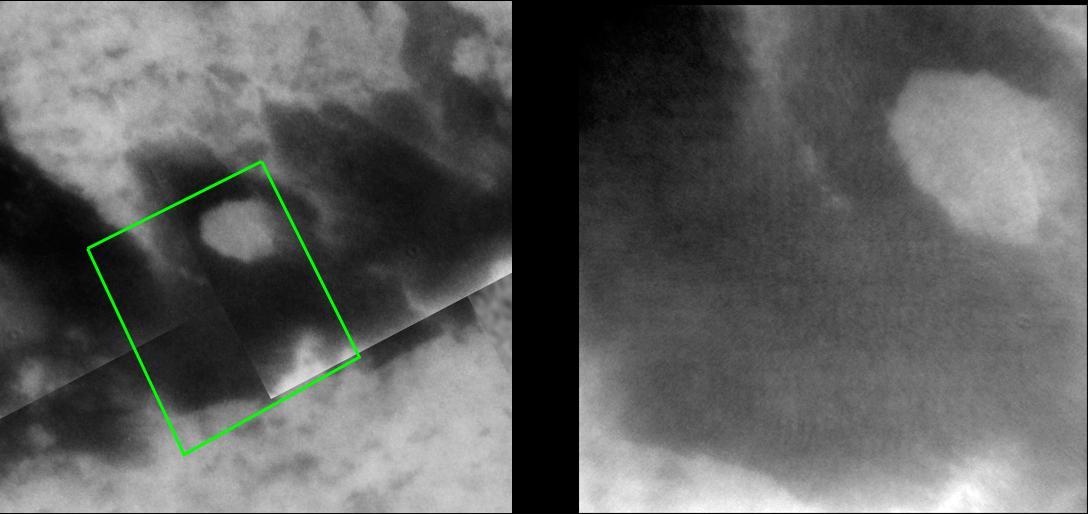
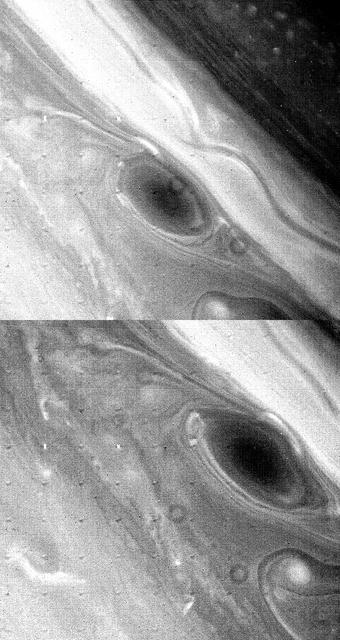
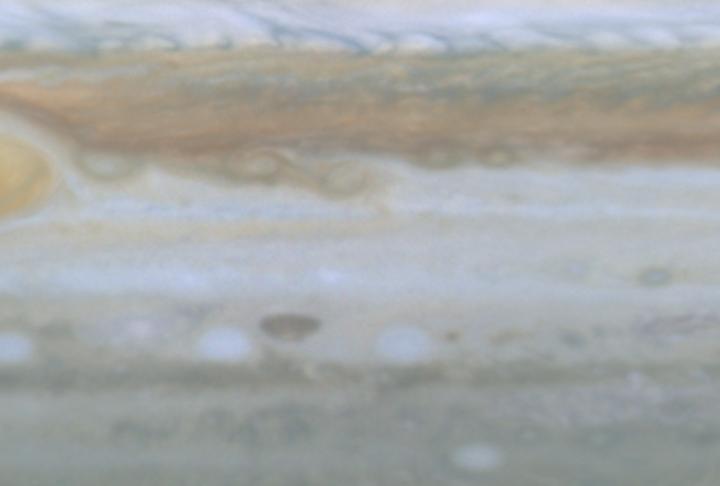
Scientists have spotted what appear to be thunderheads on Jupiter bright white cumulus clouds similar to those that bring thunderstorms on Earth - at the outer edges of Jupiter's Great Red Spot. Images from NASA's Galileo spacecraft now in orbit around Jupiter are providing new evidence that thunderstorms may be an important source of energy for Jupiter's winds that blow at more than 500 kilometers per hour (about 300 miles per hour). The photos were taken by Galileo's solid state imager camera on June 26, 1996 at a range of about 1.4 million kilometers (about 860,000 miles). The image at top is a mosaic of multiple images taken through near-infrared filters. False coloring in the image reveals cloud-top heights. High, thick clouds are white and high, thin clouds are pink. Low-altitude clouds are blue. The two black-and-white images at bottom are enlargements of the boxed area; the one on the right was taken 70 minutes after the image on the left. The arrows show where clouds have formed or dissipated in the short time between the images. The smallest clouds are tens of kilometers across. On Earth, moist convection in thunderstorms is a pathway through which solar energy, deposited at the surface, is transported and delivered to the atmosphere. Scientists at the California Institute of Technology analyzing data from Galileo believe that water, the most likely candidate for what composes these clouds on Jupiter, may be more abundant at the site seen here than at the Galileo Probe entry site, which was found to be unexpectedly dry. http://photojournal.jpl.nasa.gov/catalog/PIA00506