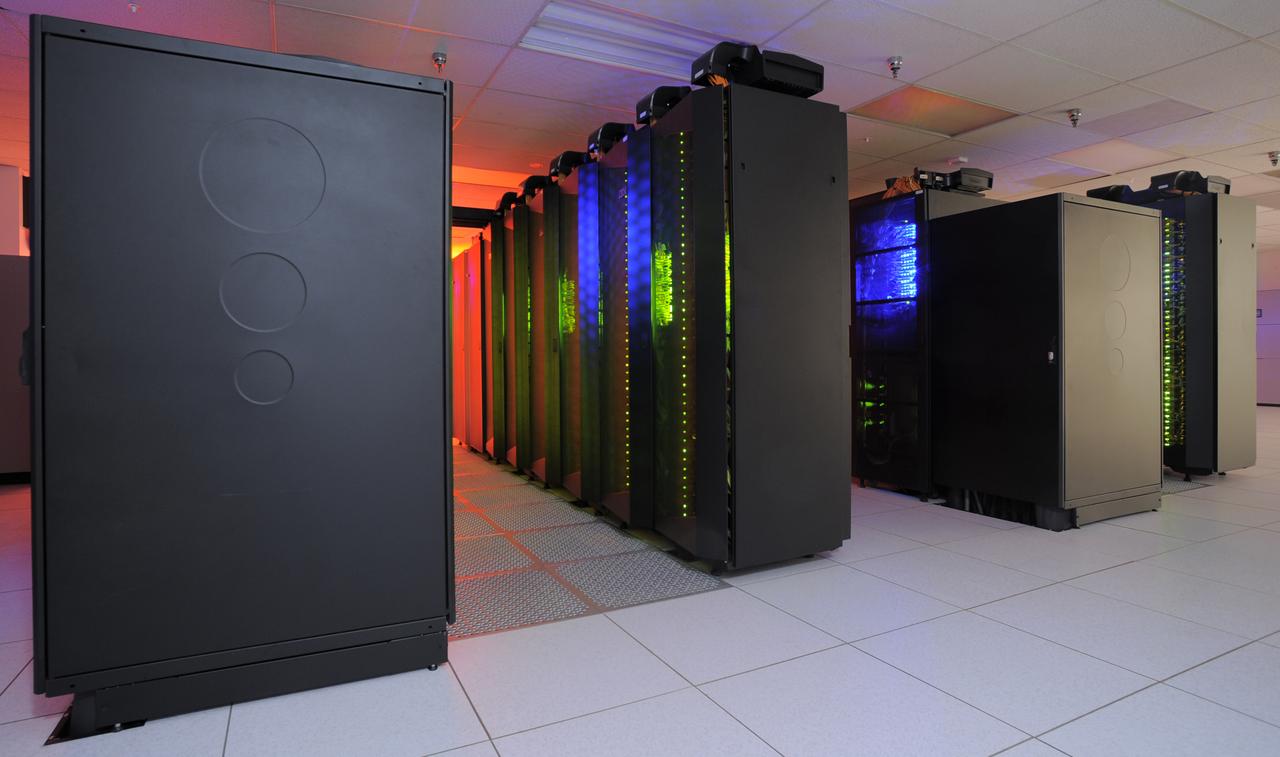
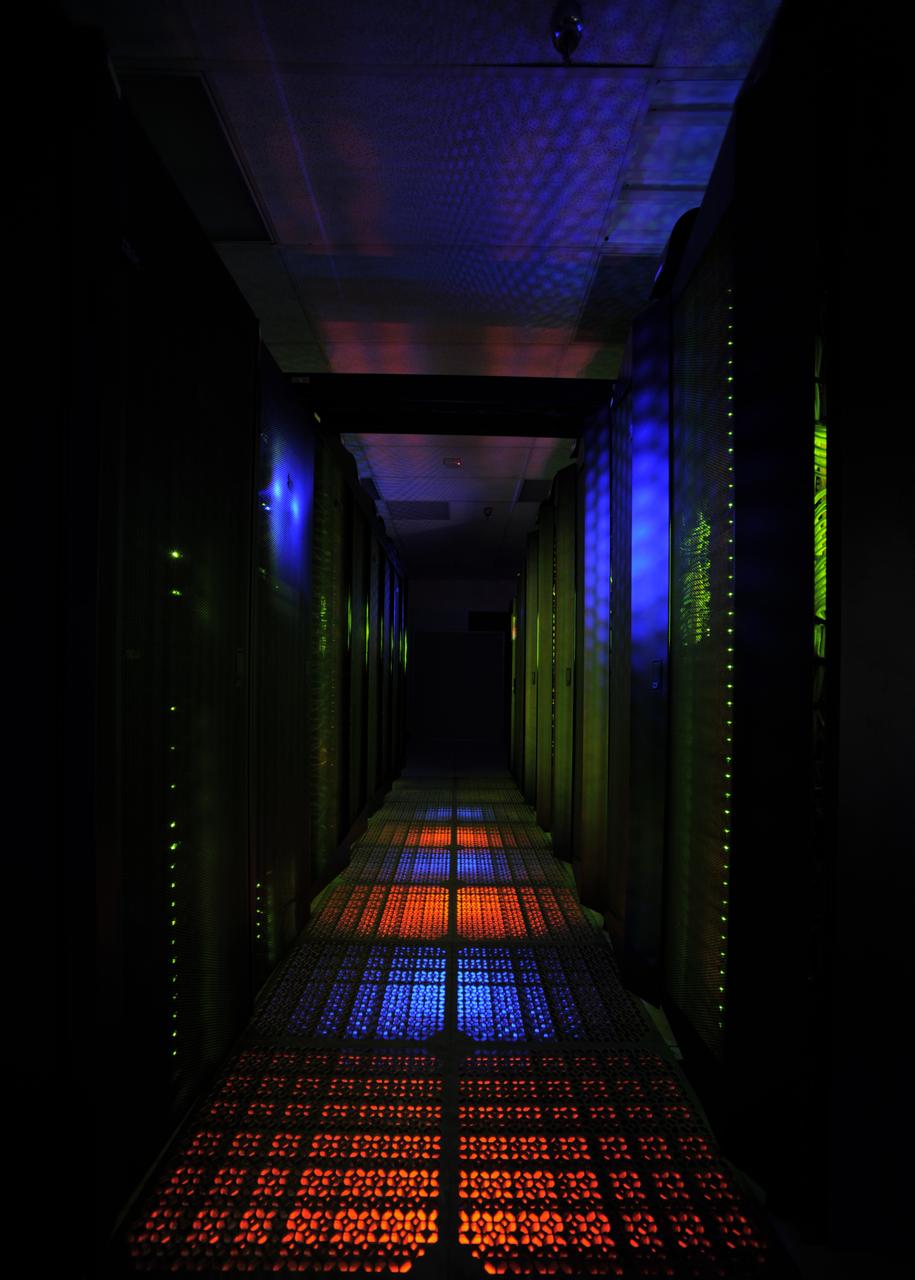
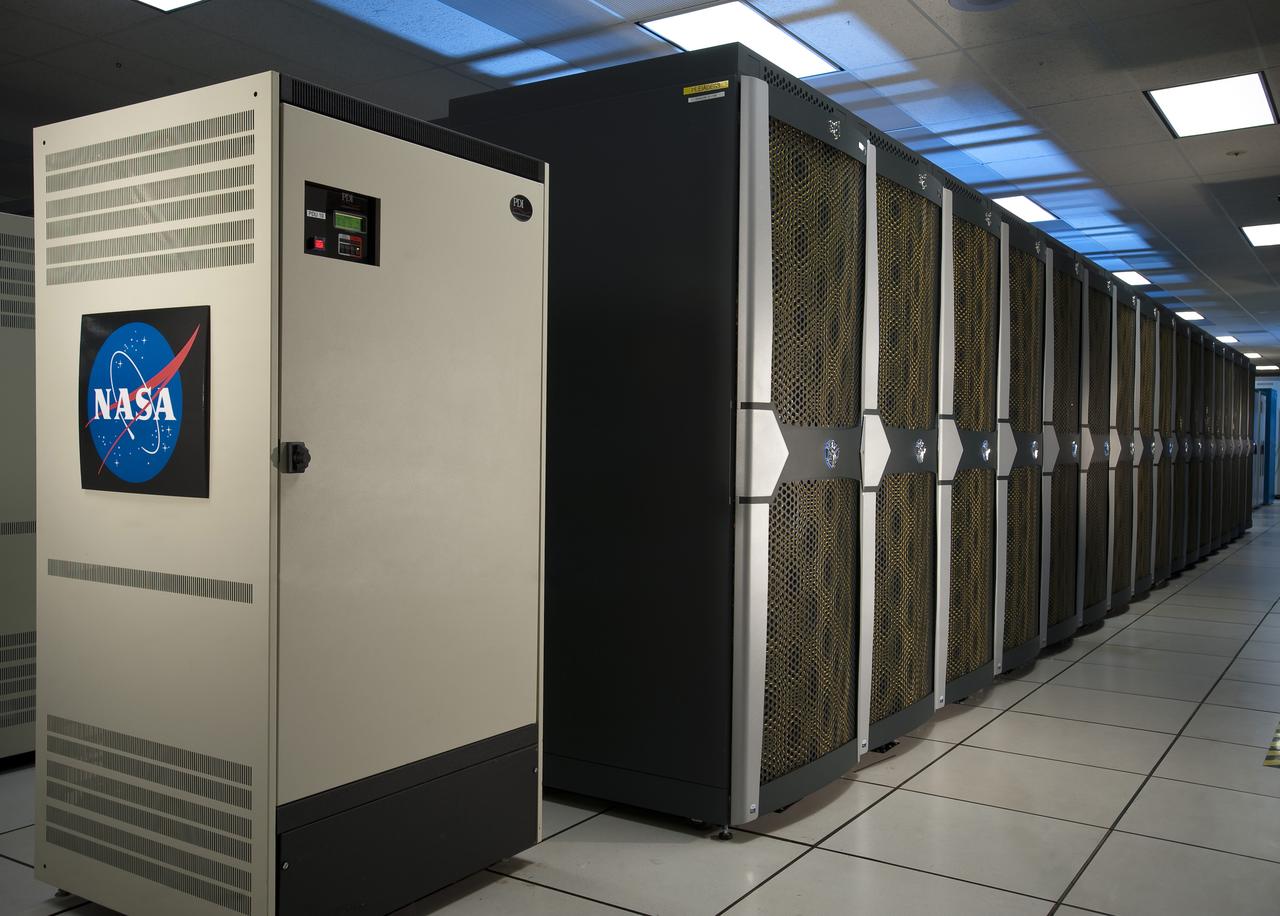
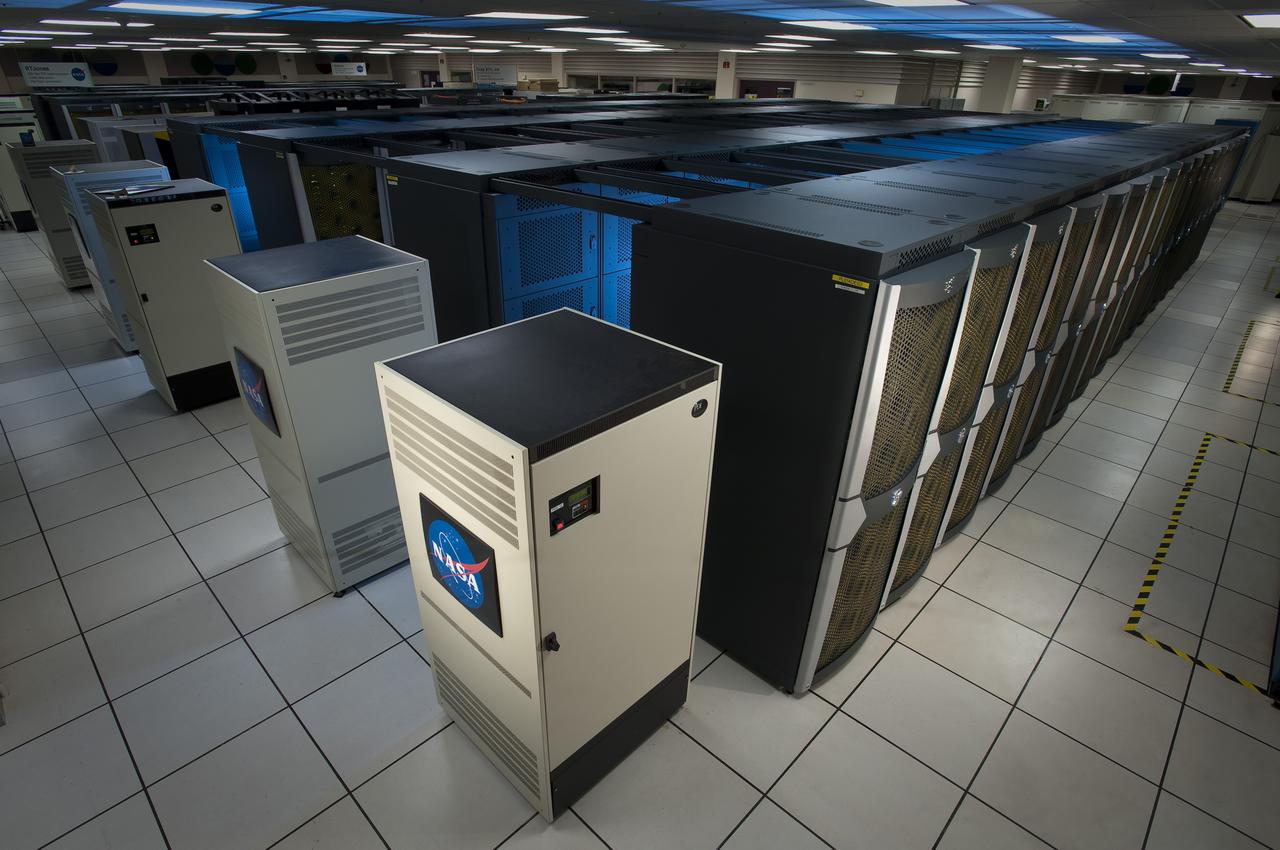
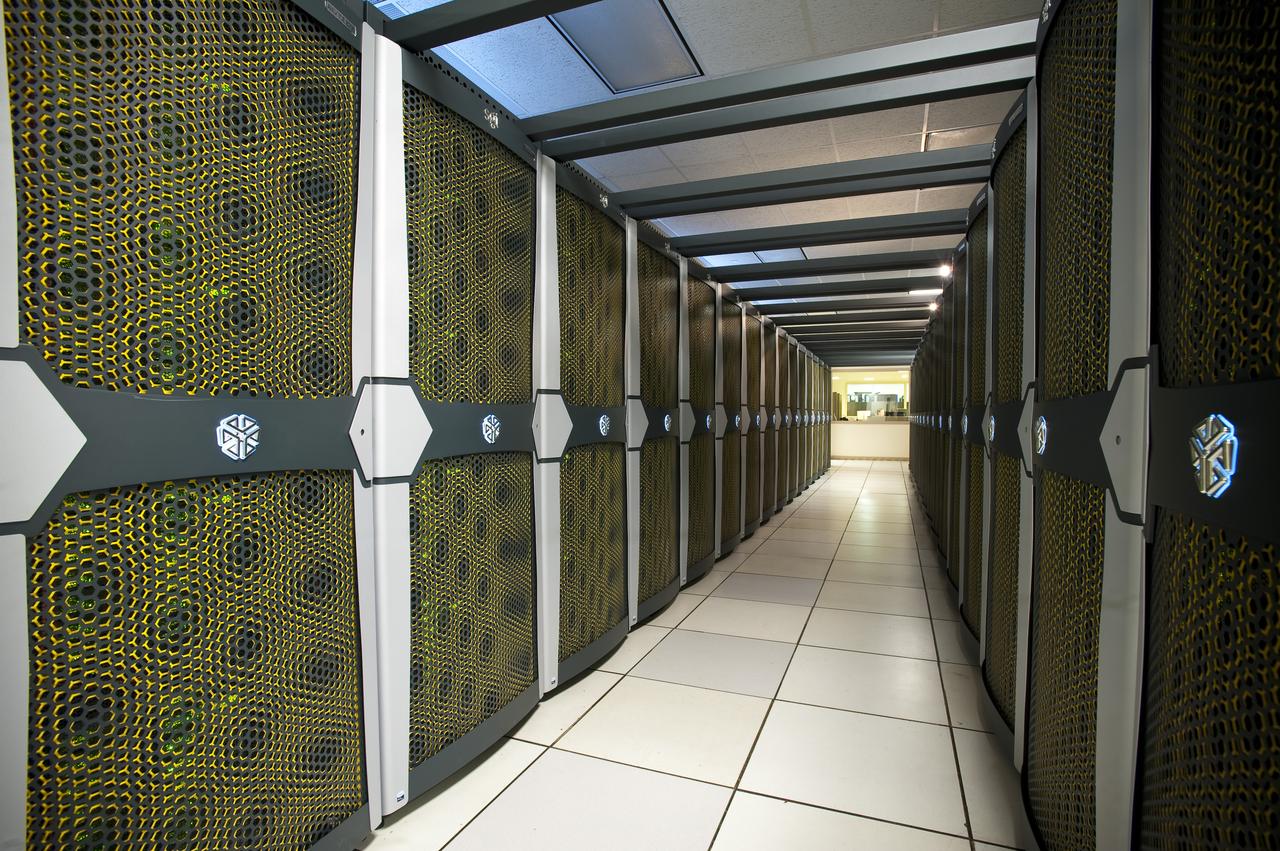
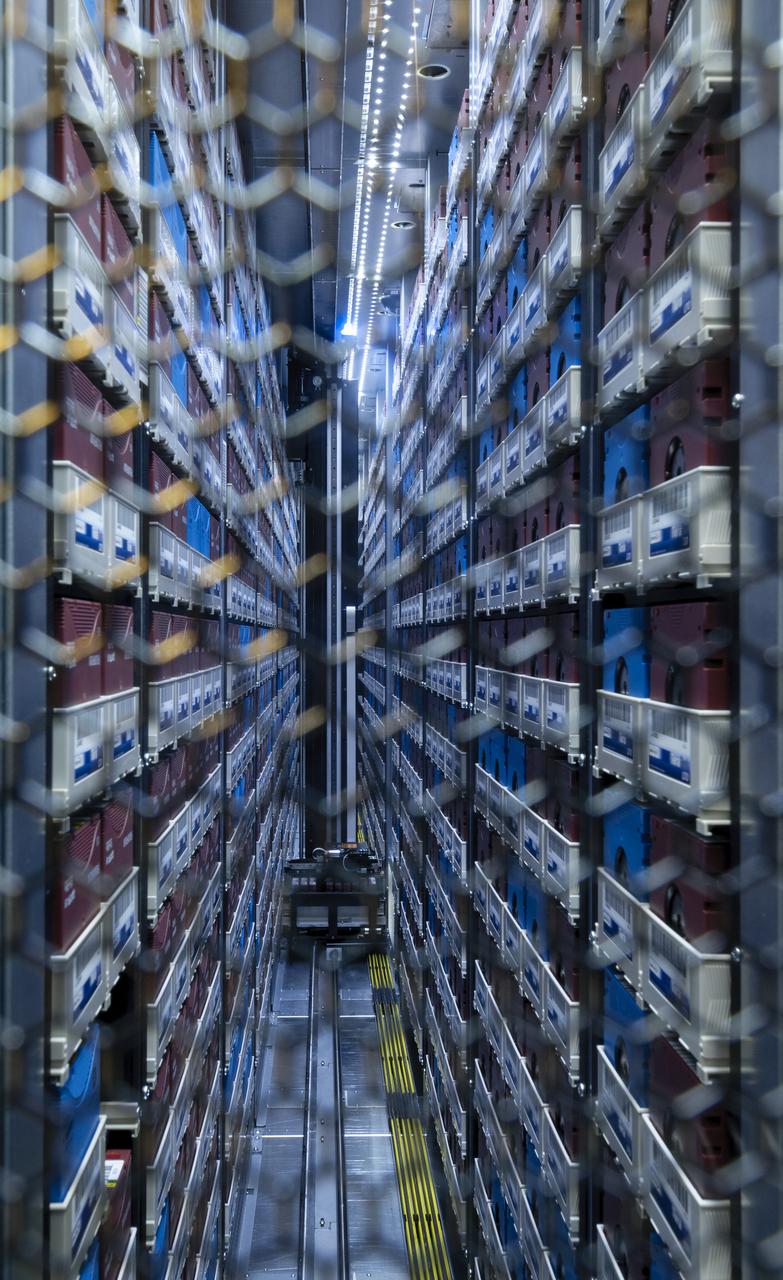
The heart of the NASA Center for Climate Simulation (NCCS) is the “Discover” supercomputer. In 2009, NCCS added more than 8,000 computer processors to Discover, for a total of nearly 15,000 processors. Credit: NASA/Pat Izzo To learn more about NCCS go to: <a href="http://www.nasa.gov/topics/earth/features/climate-sim-center.html" rel="nofollow">www.nasa.gov/topics/earth/features/climate-sim-center.html</a> NASA Goddard Space Flight Center is home to the nation's largest organization of combined scientists, engineers and technologists that build spacecraft, instruments and new technology to study the Earth, the sun, our solar system, and the universe.
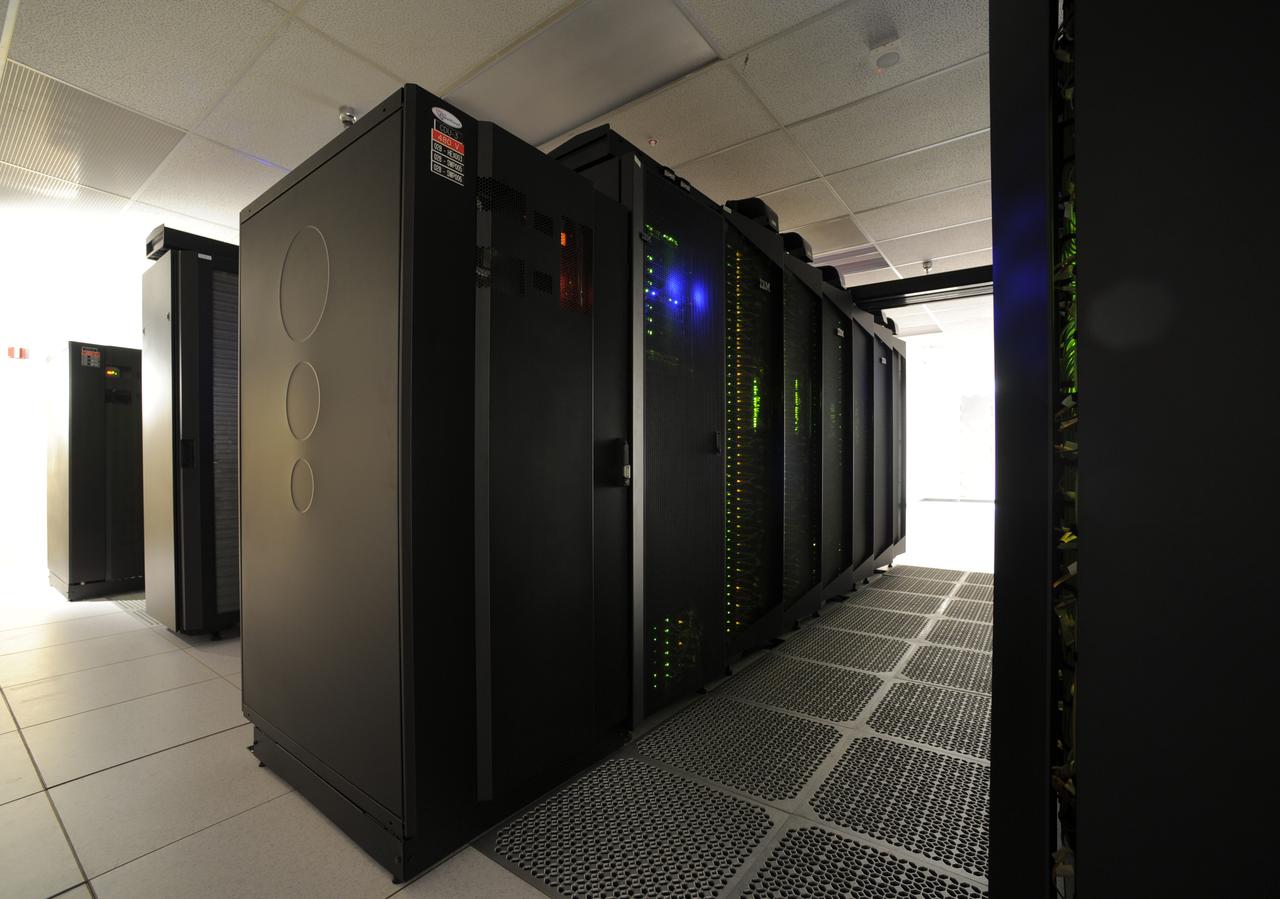
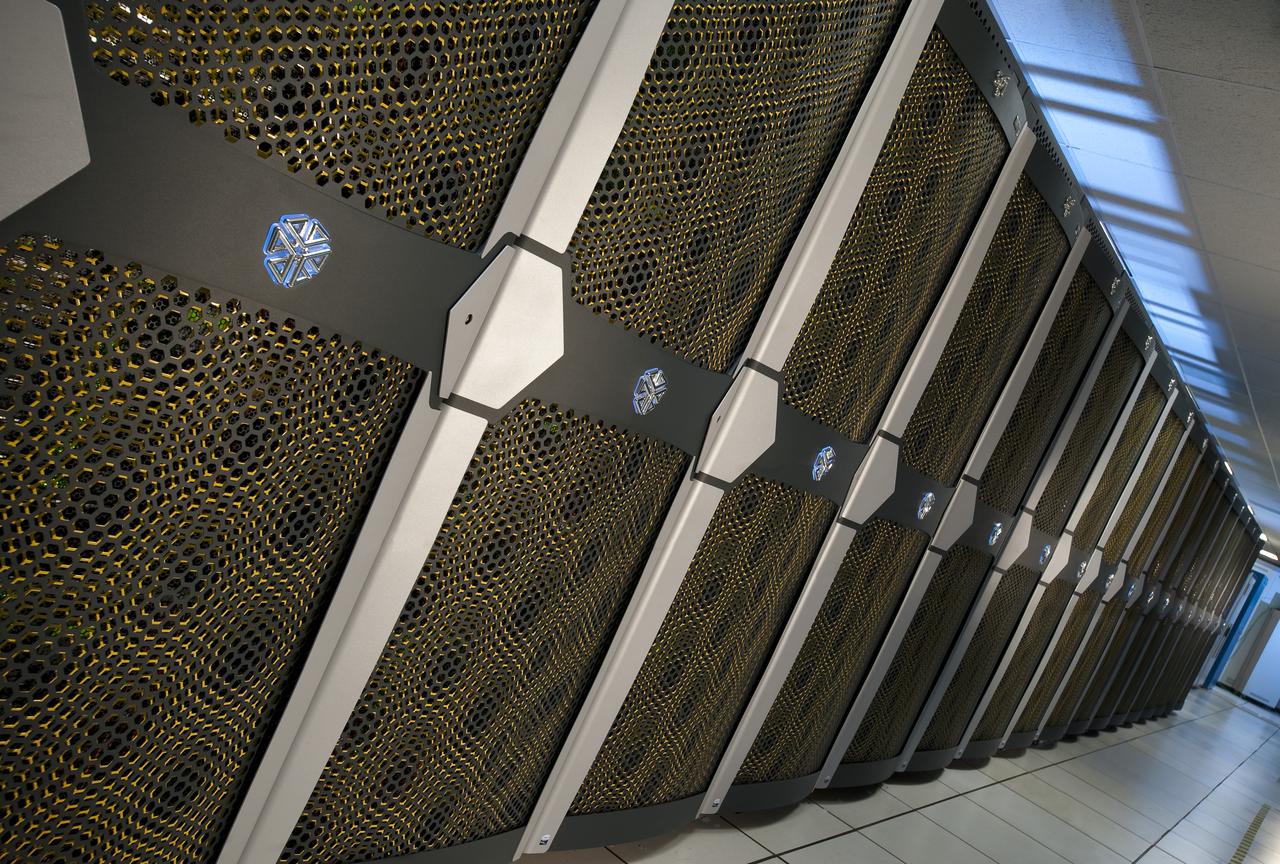
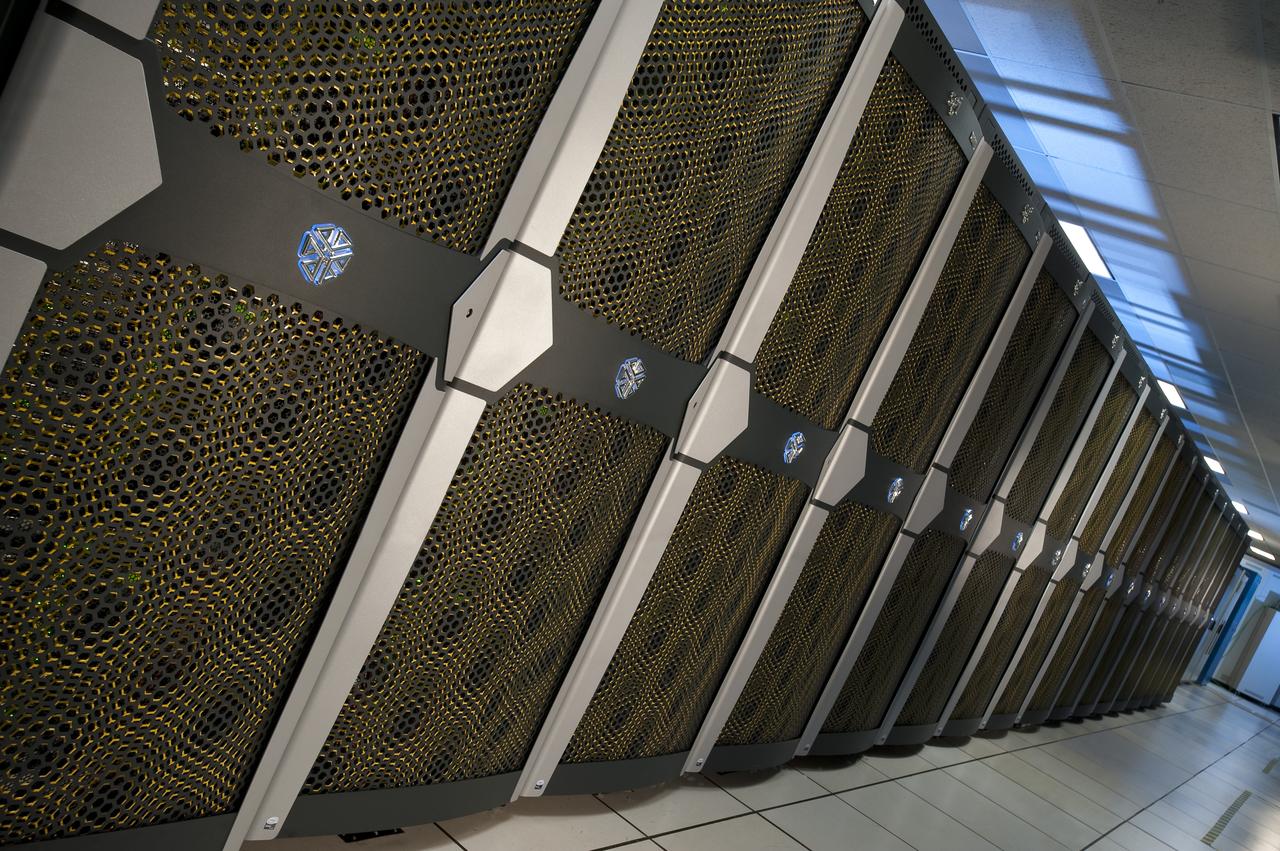
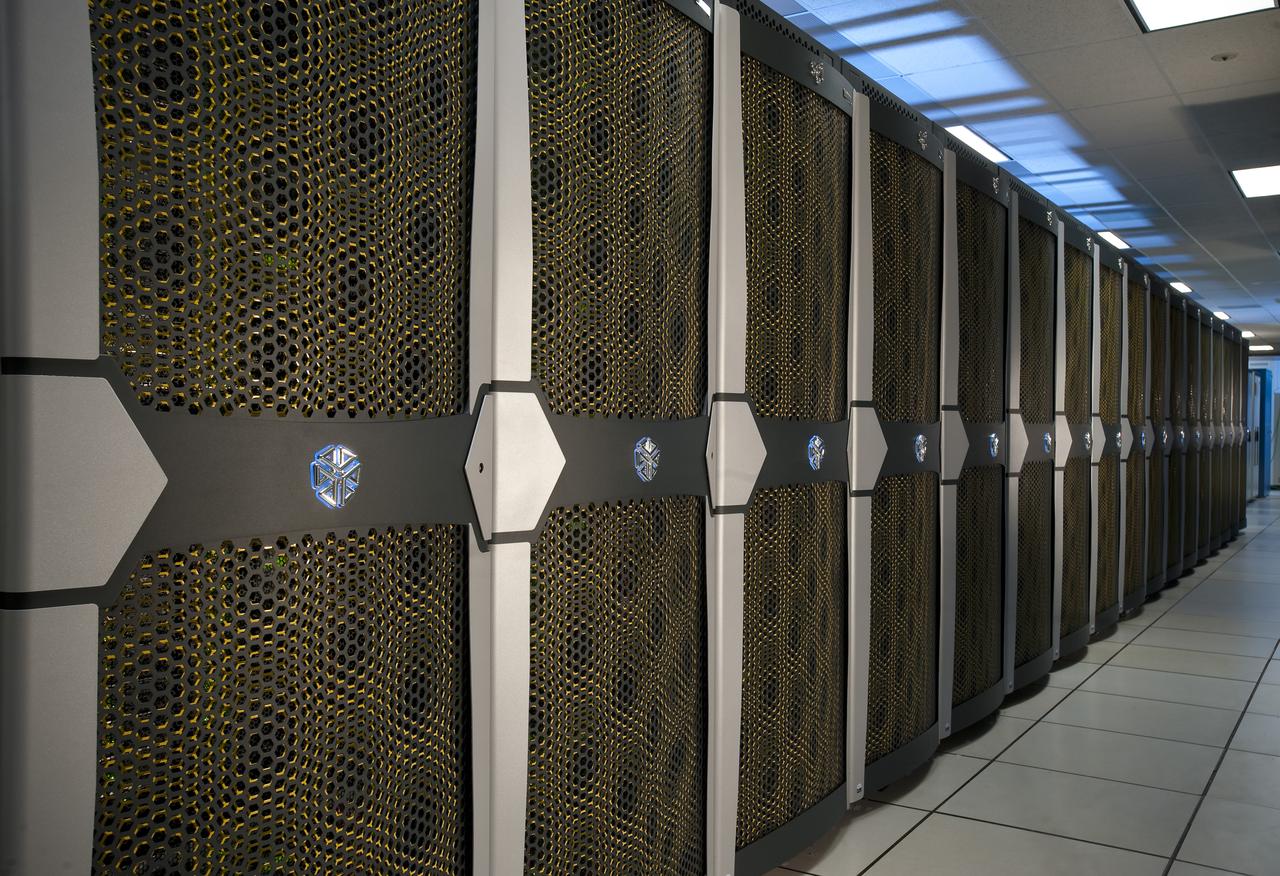
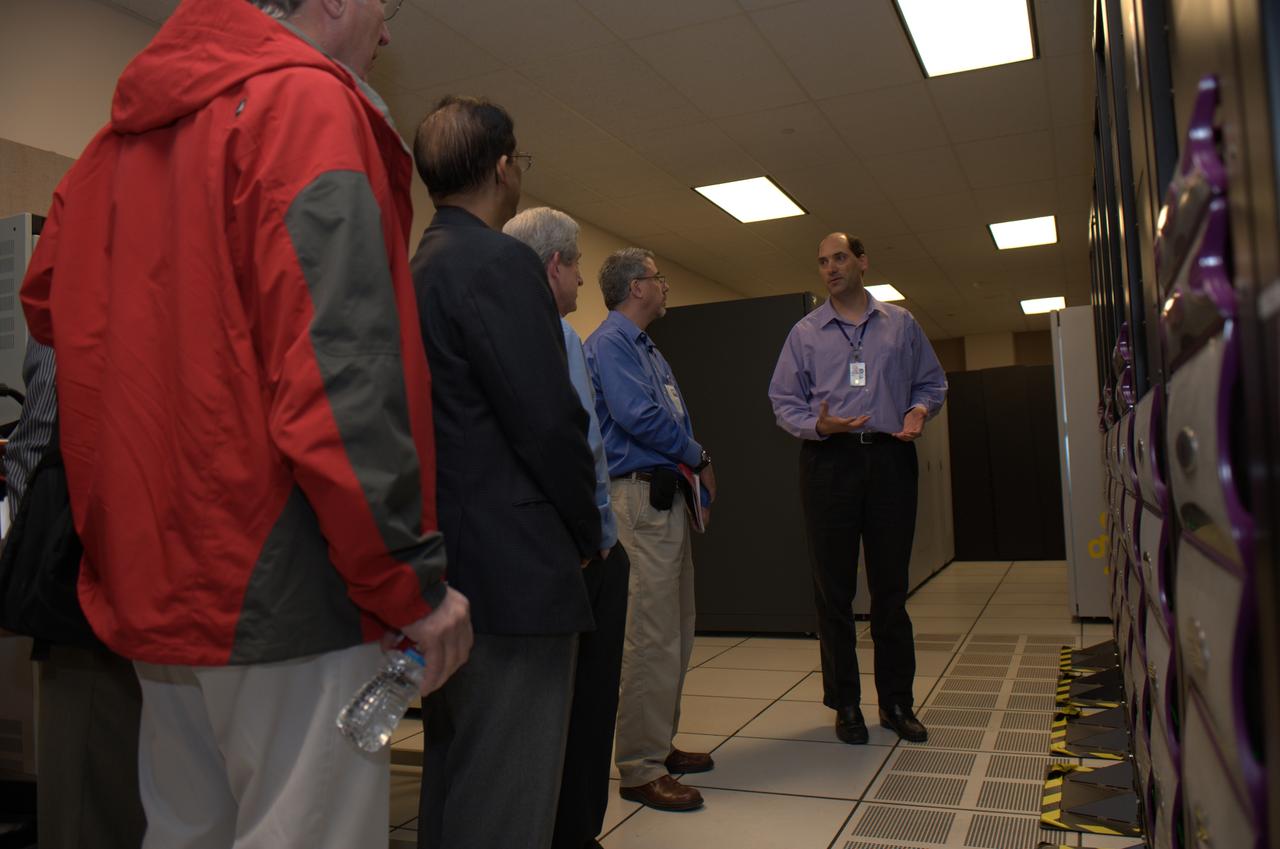
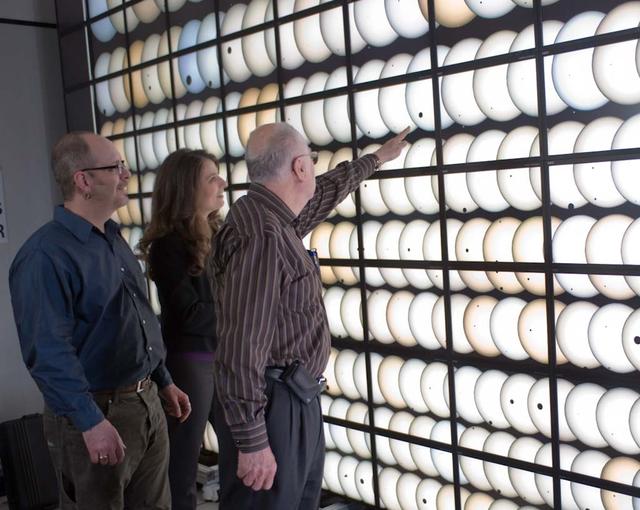
This close-up view highlights one row—approximately 2,000 computer processors—of the “Discover” supercomputer at the NASA Center for Climate Simulation (NCCS). Discover has a total of nearly 15,000 processors. Credit: NASA/Pat Izzo To learn more about NCCS go to: <a href="http://www.nasa.gov/topics/earth/features/climate-sim-center.html" rel="nofollow">www.nasa.gov/topics/earth/features/climate-sim-center.html</a> NASA Goddard Space Flight Center is home to the nation's largest organization of combined scientists, engineers and technologists that build spacecraft, instruments and new technology to study the Earth, the sun, our solar system, and the universe.
The heart of the NASA Center for Climate Simulation (NCCS) is the “Discover” supercomputer. In 2009, NCCS added more than 8,000 computer processors to Discover, for a total of nearly 15,000 processors. Credit: NASA/Pat Izzo To learn more about NCCS go to: <a href="http://www.nasa.gov/topics/earth/features/climate-sim-center.html" rel="nofollow">www.nasa.gov/topics/earth/features/climate-sim-center.html</a> NASA Goddard Space Flight Center is home to the nation's largest organization of combined scientists, engineers and technologists that build spacecraft, instruments and new technology to study the Earth, the sun, our solar system, and the universe.
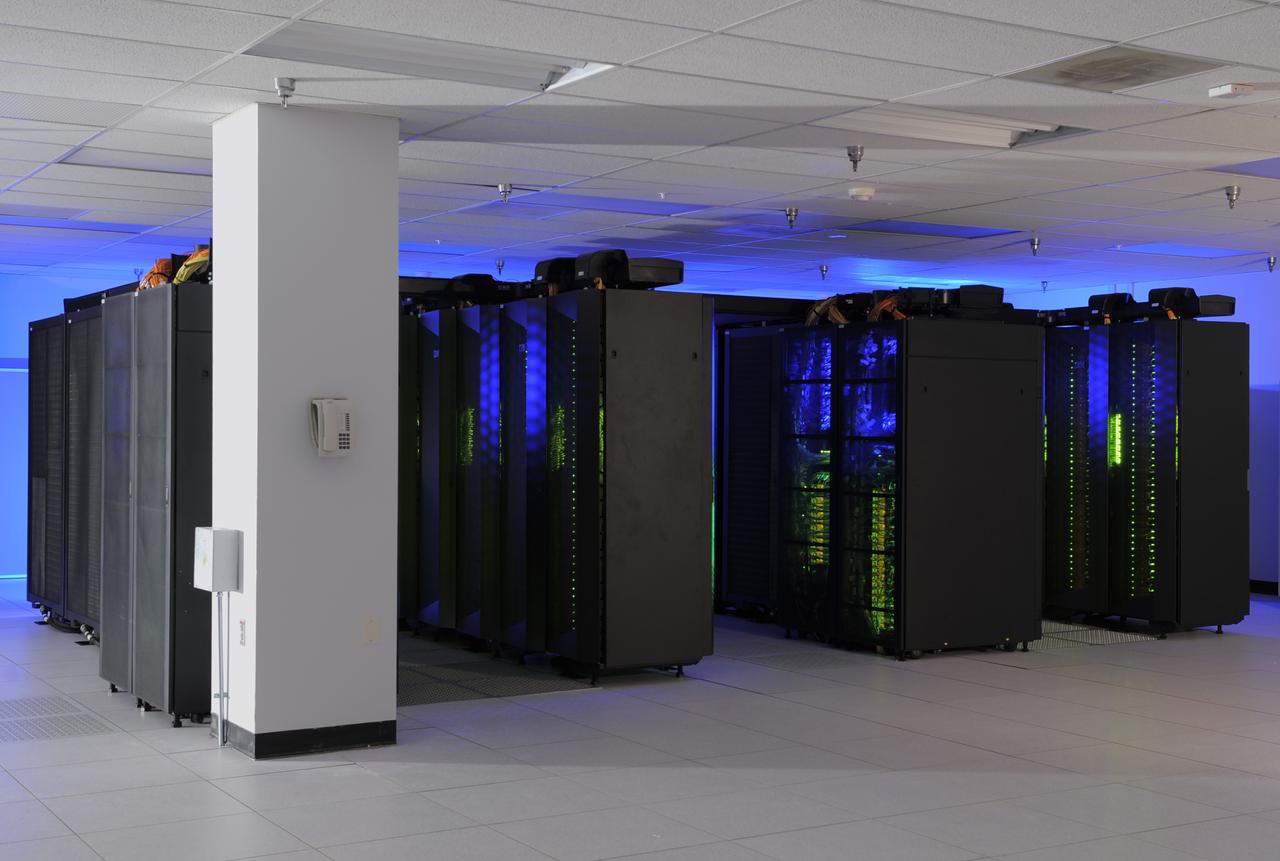
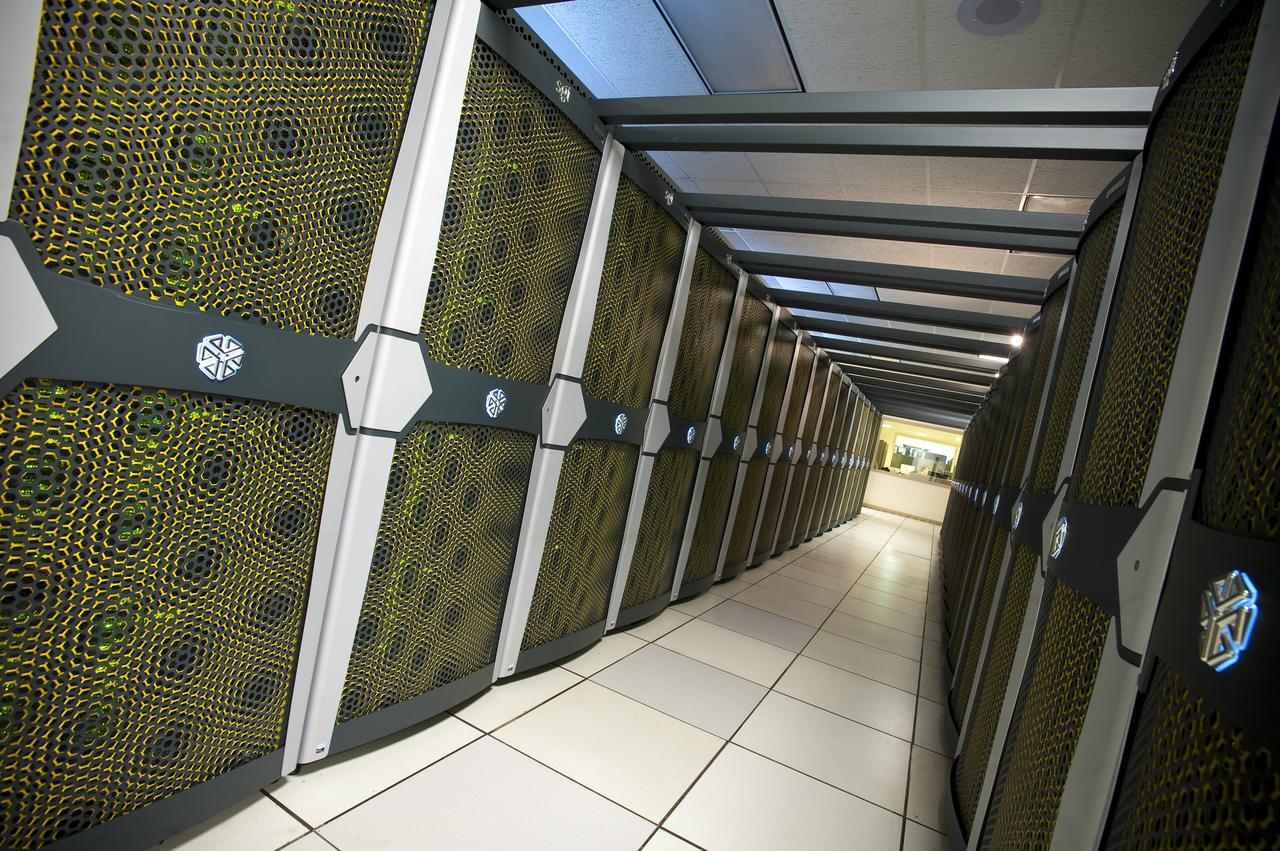
Two rows of the “Discover” supercomputer at the NASA Center for Climate Simulation (NCCS) contain more than 4,000 computer processors. Discover has a total of nearly 15,000 processors. Credit: NASA/Pat Izzo To learn more about NCCS go to: <a href="http://www.nasa.gov/topics/earth/features/climate-sim-center.html" rel="nofollow">www.nasa.gov/topics/earth/features/climate-sim-center.html</a> NASA Goddard Space Flight Center is home to the nation's largest organization of combined scientists, engineers and technologists that build spacecraft, instruments and new technology to study the Earth, the sun, our solar system, and the universe.

The heart of the NASA Center for Climate Simulation (NCCS) is the “Discover” supercomputer. In 2009, NCCS added more than 8,000 computer processors to Discover, for a total of nearly 15,000 processors. Credit: NASA/Pat Izzo To learn more about NCCS go to: <a href="http://www.nasa.gov/topics/earth/features/climate-sim-center.html" rel="nofollow">www.nasa.gov/topics/earth/features/climate-sim-center.html</a> <b><a href="http://www.nasa.gov/centers/goddard/home/index.html" rel="nofollow">NASA Goddard Space Flight Center</a></b> is home to the nation's largest organization of combined scientists, engineers and technologists that build spacecraft, instruments and new technology to study the Earth, the sun, our solar system, and the universe.
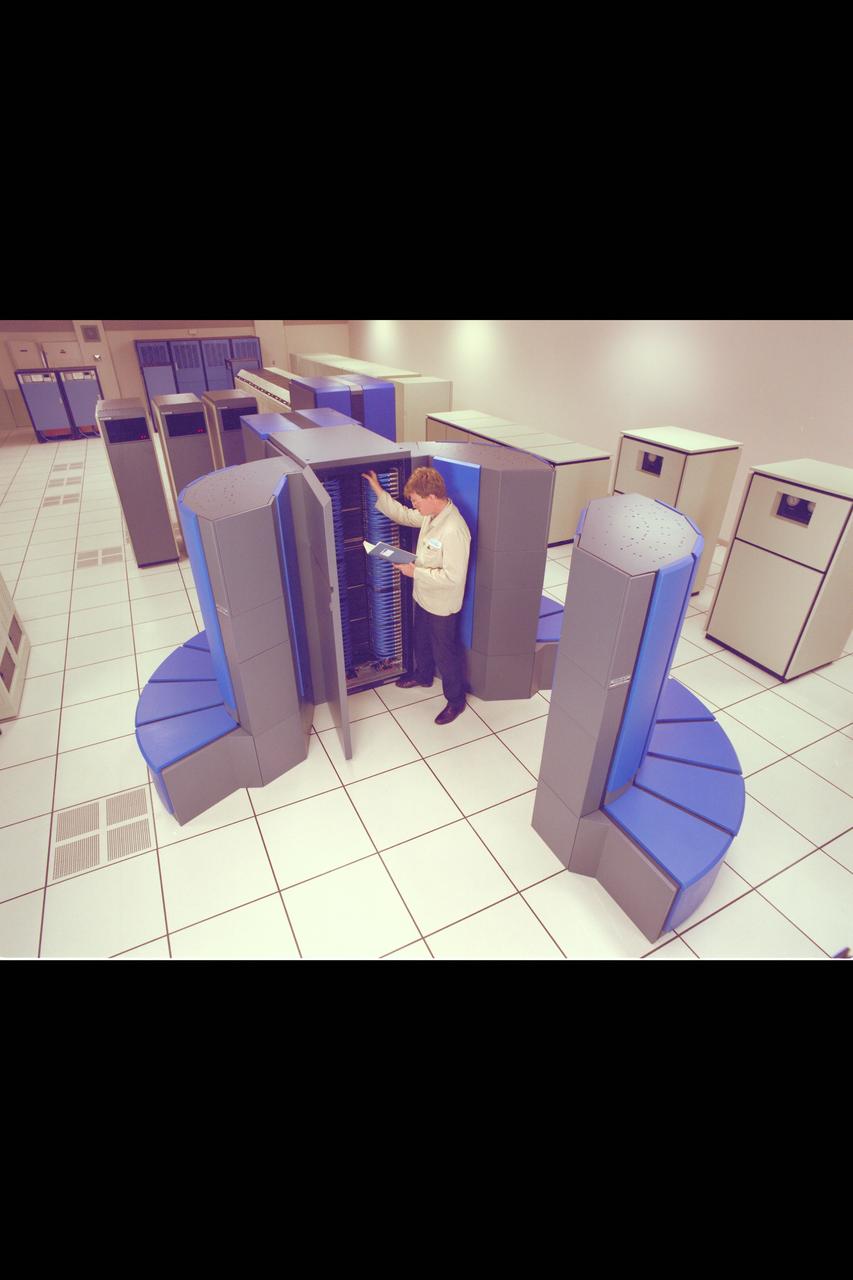
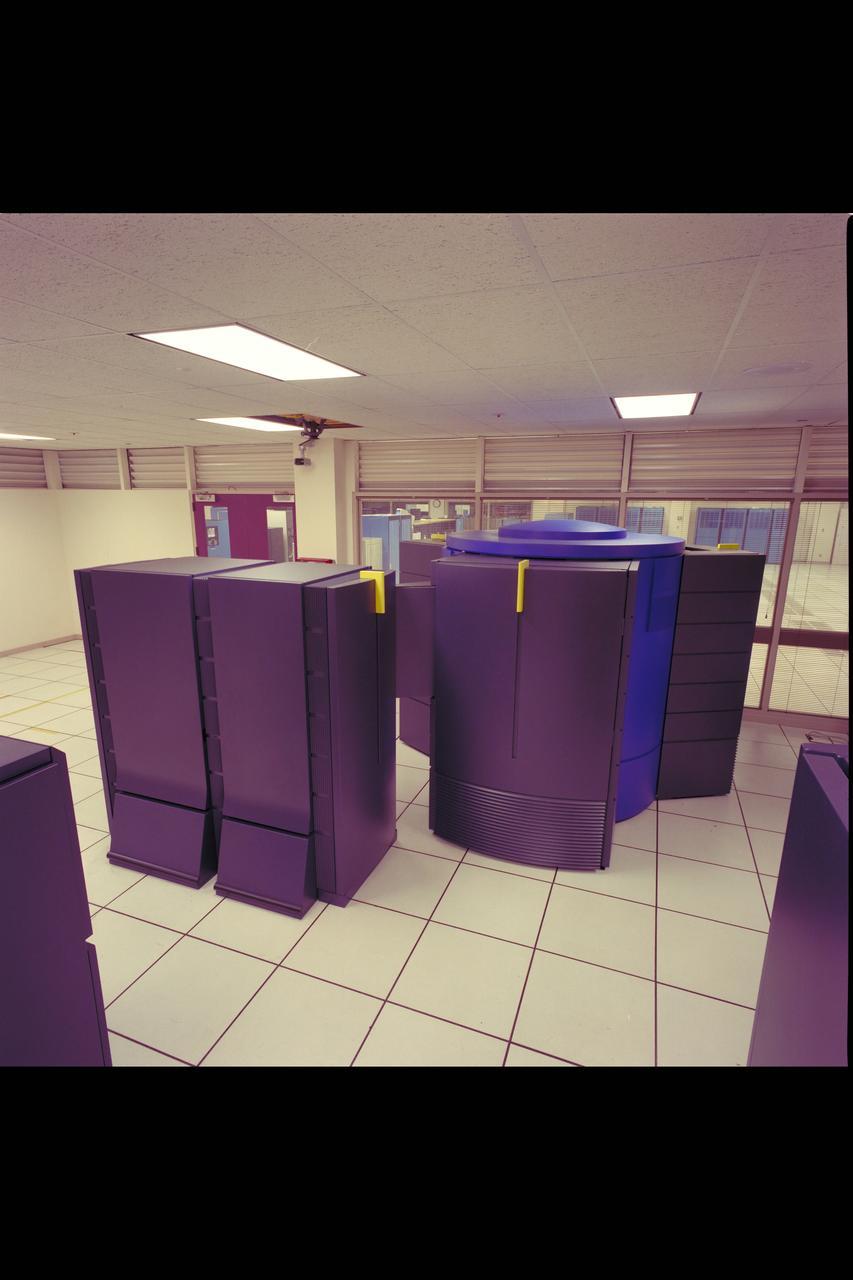
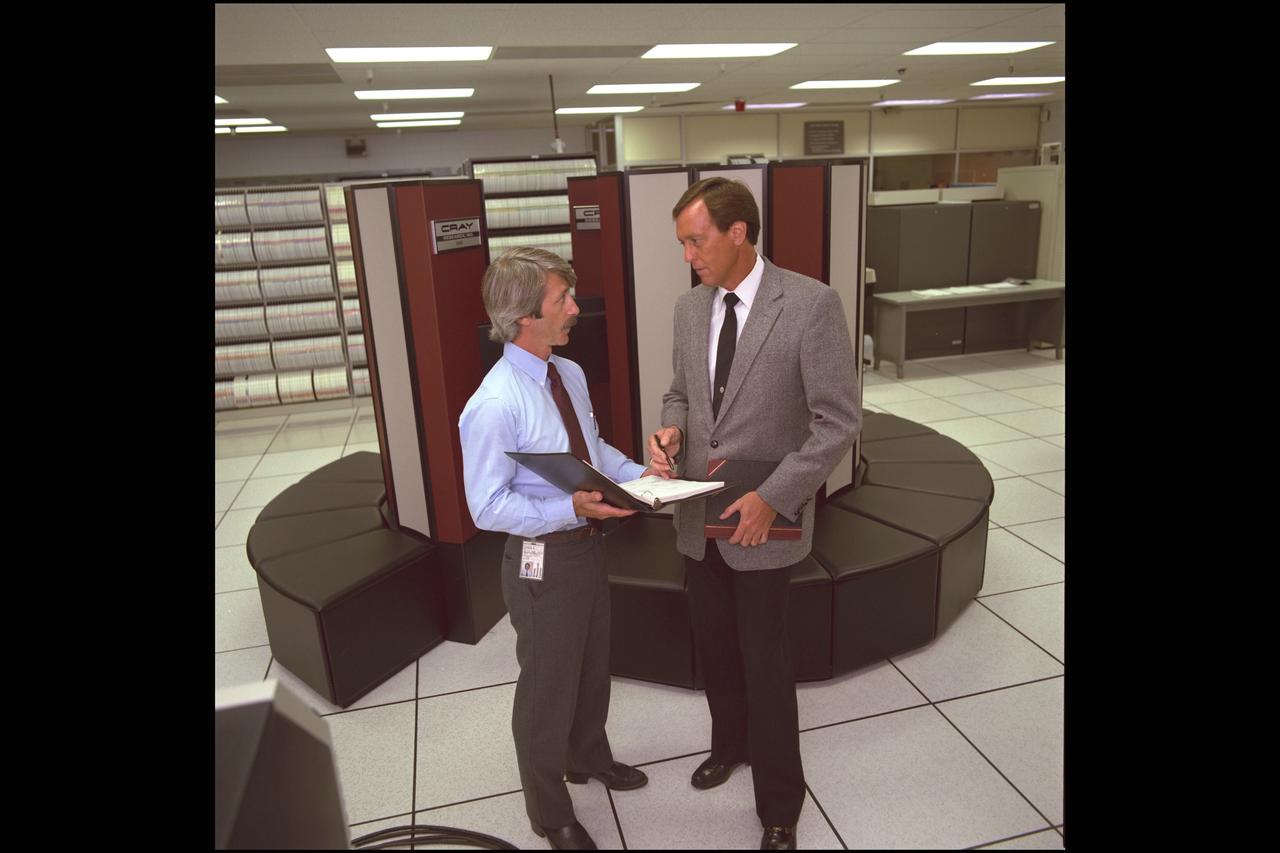
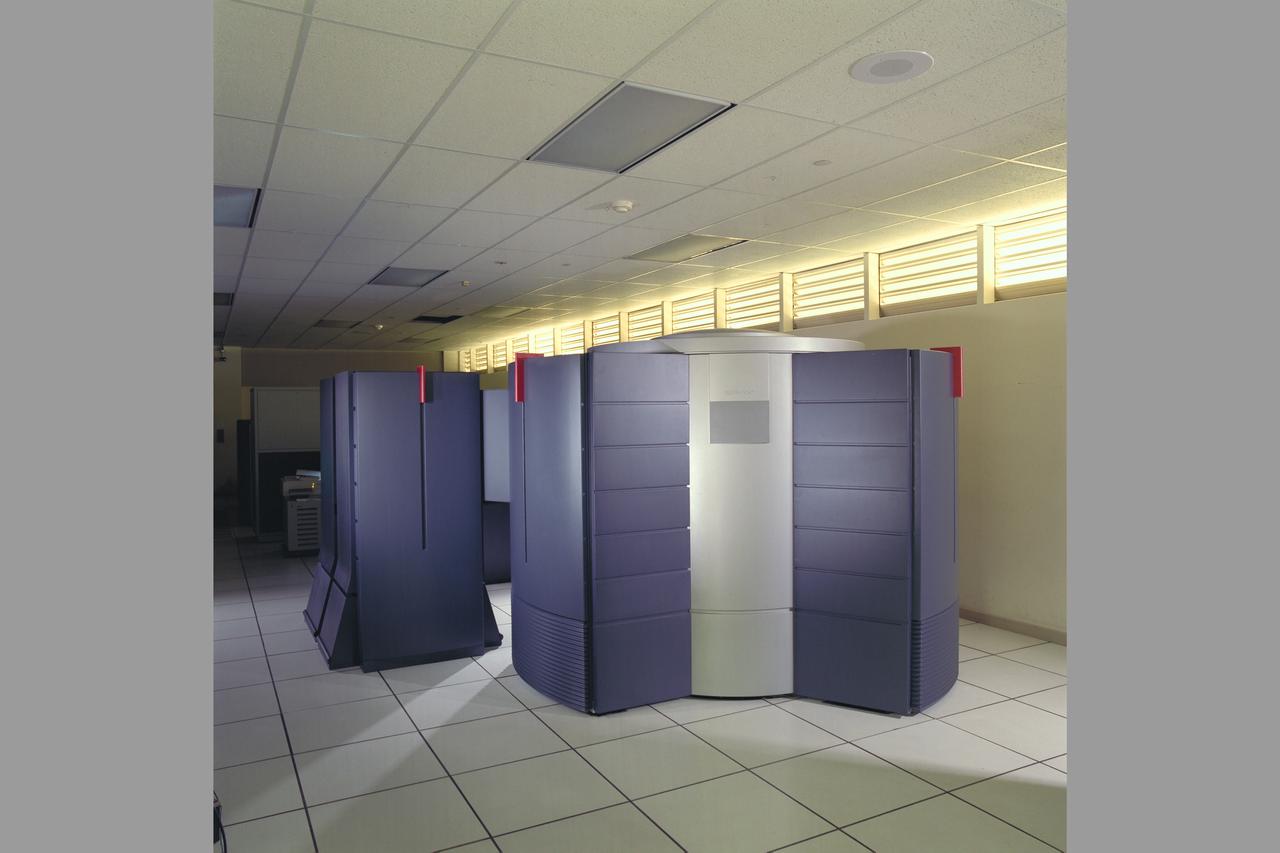
Cray YMP supercomputer Nas N-258 facility
N-258 NAS Supercomputer Pleiades
N-258 NAS Supercomputer Pleiades
N-258 NAS Supercomputer Pleiades
N-258 NAS Supercomputer Pleiades
N-258 NAS Supercomputer Pleiades
N-258 NAS Supercomputer Pleiades
N-258 NAS Supercomputer Pleiades
N-258 NAS Supercomputer Pleiades
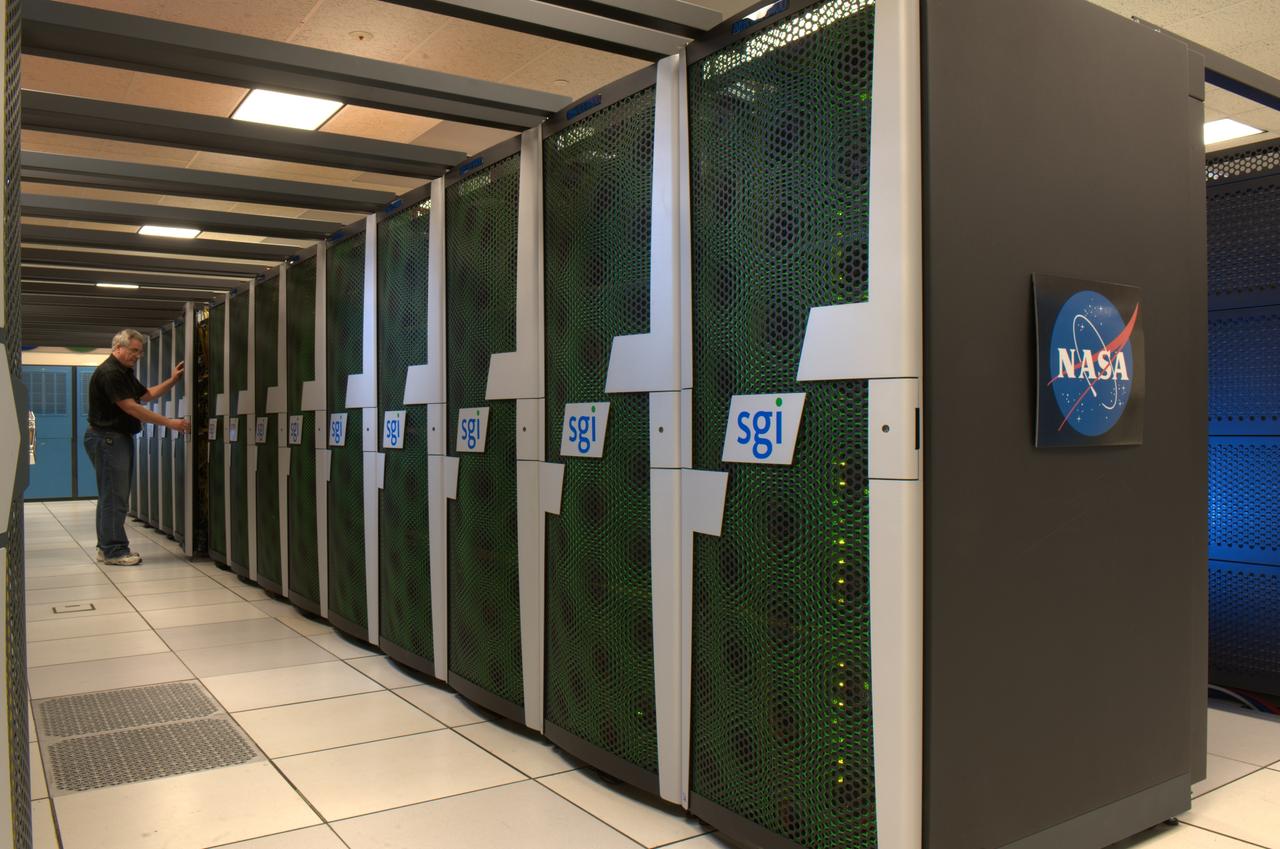
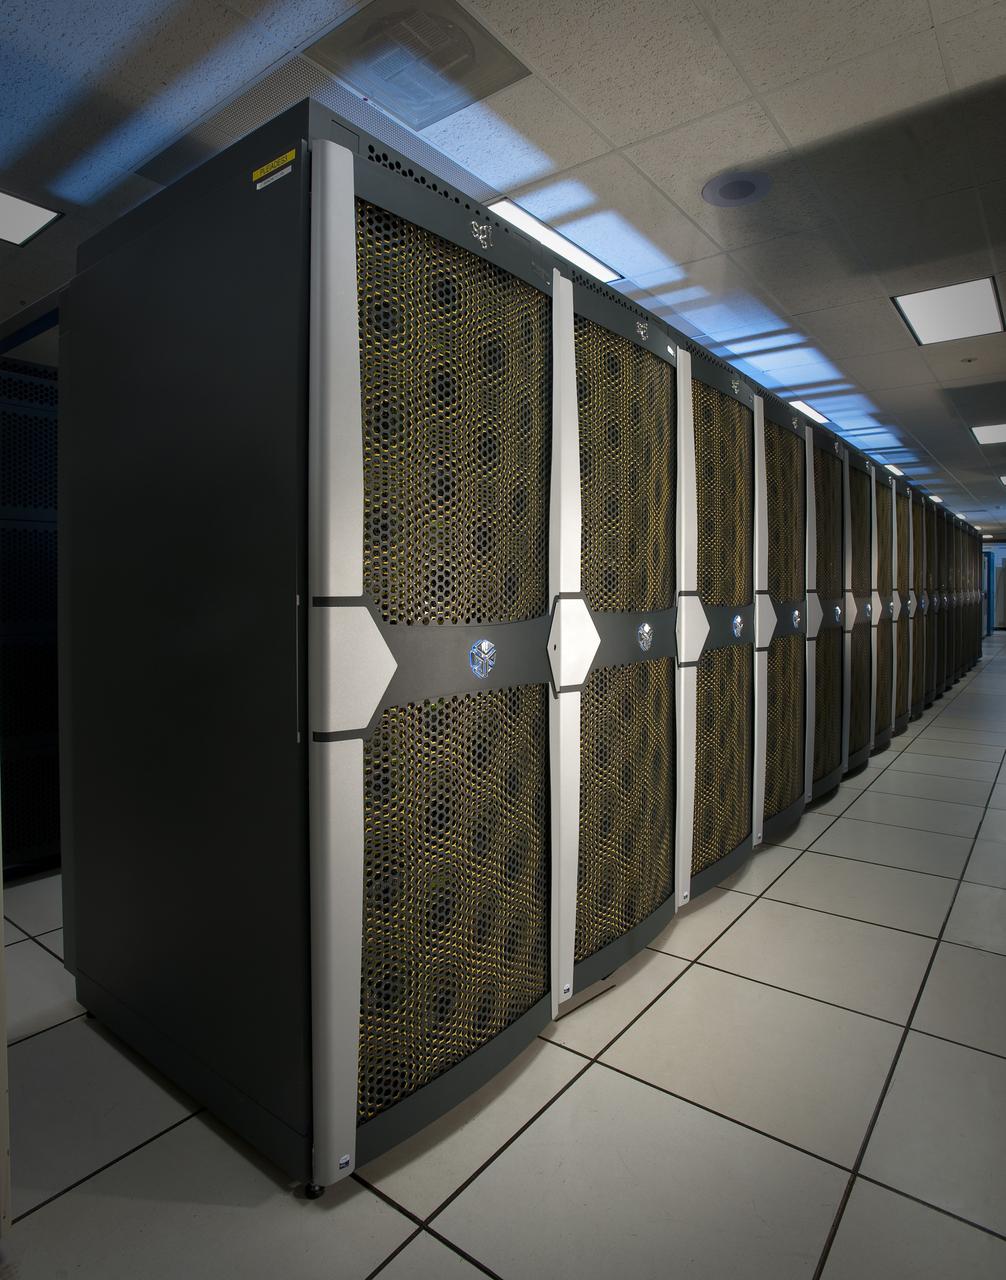
Pleiades, NASA's Supercomputing powerhouse, located at Ames Research Center, Moffett Field, California doubles power, stays among world's fastest. Shown her with Chris Grimes.
Supercomputer Pleiades as installed in the Spectra Logic room 131 of NASA Ames Numerical Aerodynamic Simulation (NAS) Facility N-258 located in Silicon Valley, CA.
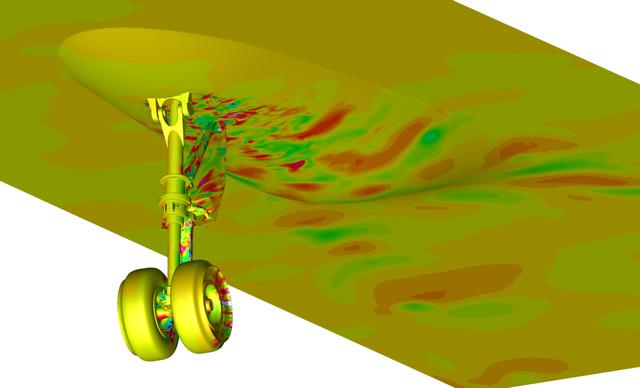
Snapshot from a simulation run on the Pleiades supercomputer. It depicts a fluctuating pressure field on aircraft nose landing gear and fuselage surfaces. The simulation helped scientists better understand the effects of landing gear and acoustic noise. The goal of the study was to improve the current understanding of aircraft nose landing gear noise, which will lead to quieter, more efficient airframe components for future aircraft designs. The visualization was produced with help from the NAS Data Analysis & Visualization group. Investigator: Mehdi Khorrami, NASA Langley Research Center.
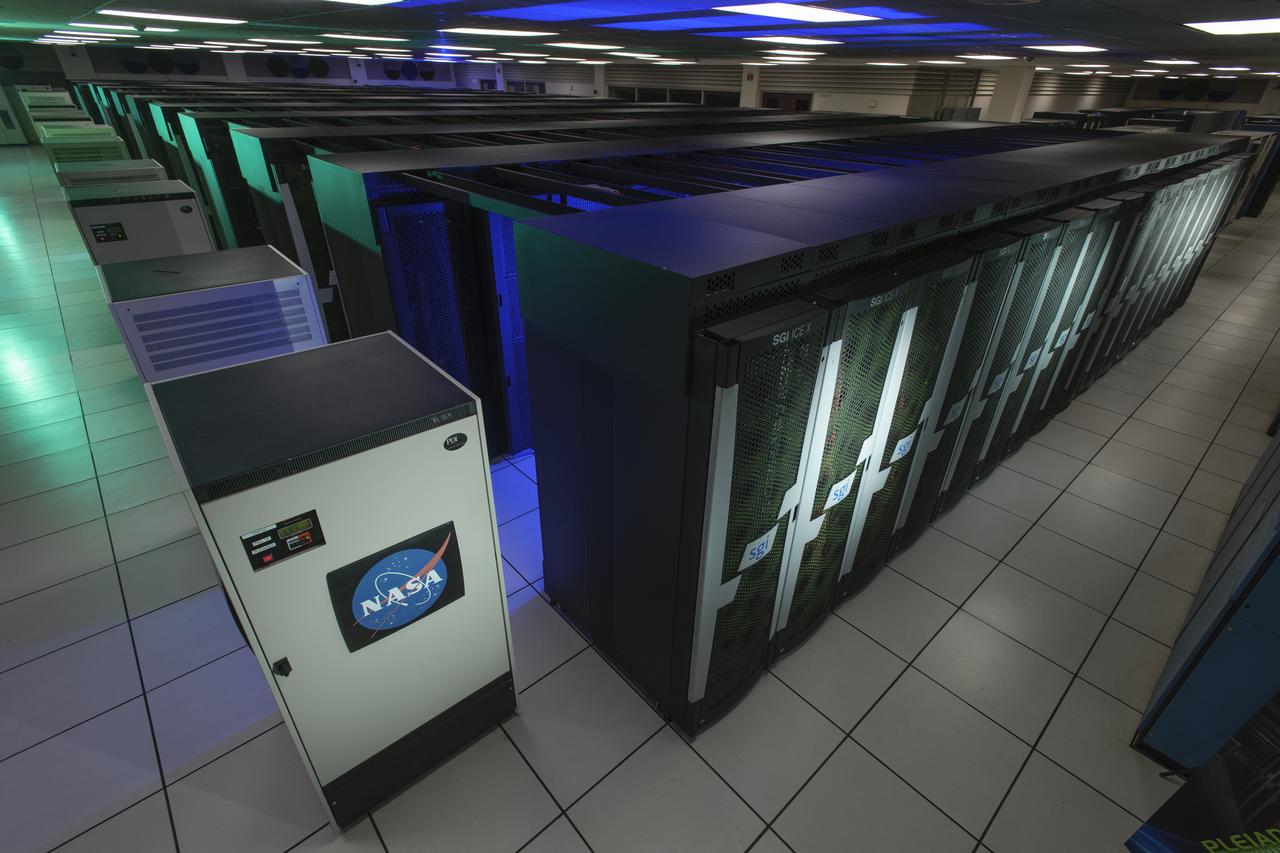
Interior view of the Supercomputer Pleiades as installed in the Spectra Logic room 131 of NASA Ames Numerical Aerodynamic Simulation (NAS) Facility N-258 located in Silicon Valley, CA.

Interior view of the Supercomputer Pleiades as installed in the Spectra Logic room 131 of NASA Ames Numerical Aerodynamic Simulation (NAS) Facility N-258 located in Silicon Valley, CA.
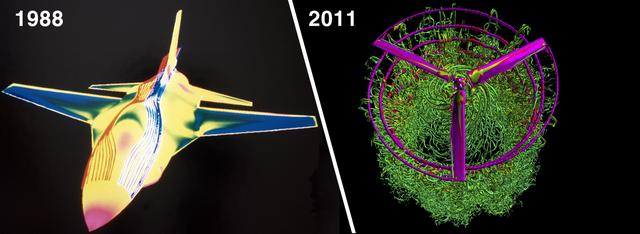
Then and Now: These images illustrate the dramatic improvement in NASA computing power over the last 23 years, and its effect on the number of grid points used for flow simulations. At left, an image from the first full-body Navier-Stokes simulation (1988) of an F-16 fighter jet showing pressure on the aircraft body, and fore-body streamlines at Mach 0.90. This steady-state solution took 25 hours using a single Cray X-MP processor to solve the 500,000 grid-point problem. Investigator: Neal Chaderjian, NASA Ames Research Center At right, a 2011 snapshot from a Navier-Stokes simulation of a V-22 Osprey rotorcraft in hover. The blade vortices interact with the smaller turbulent structures. This very detailed simulation used 660 million grid points, and ran on 1536 processors on the Pleiades supercomputer for 180 hours. Investigator: Neal Chaderjian, NASA Ames Research Center; Image: Tim Sandstrom, NASA Ames Research Center
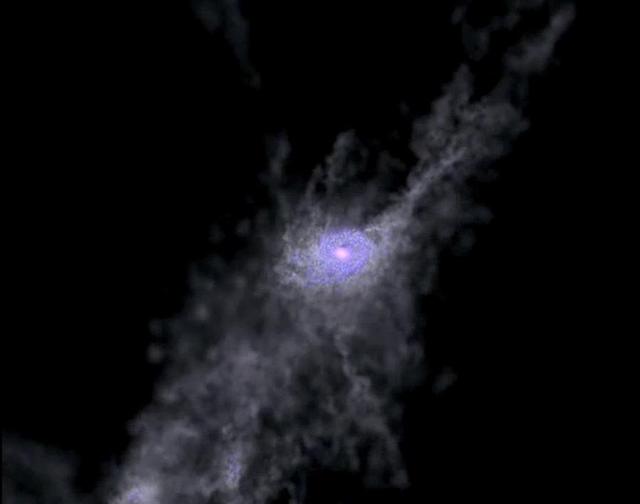
Created with the help of supercomputers, this frame from a simulation shows the formation of a massive galaxy during the first 2 billion years of the universe.

NCCS Discover Supercomputer
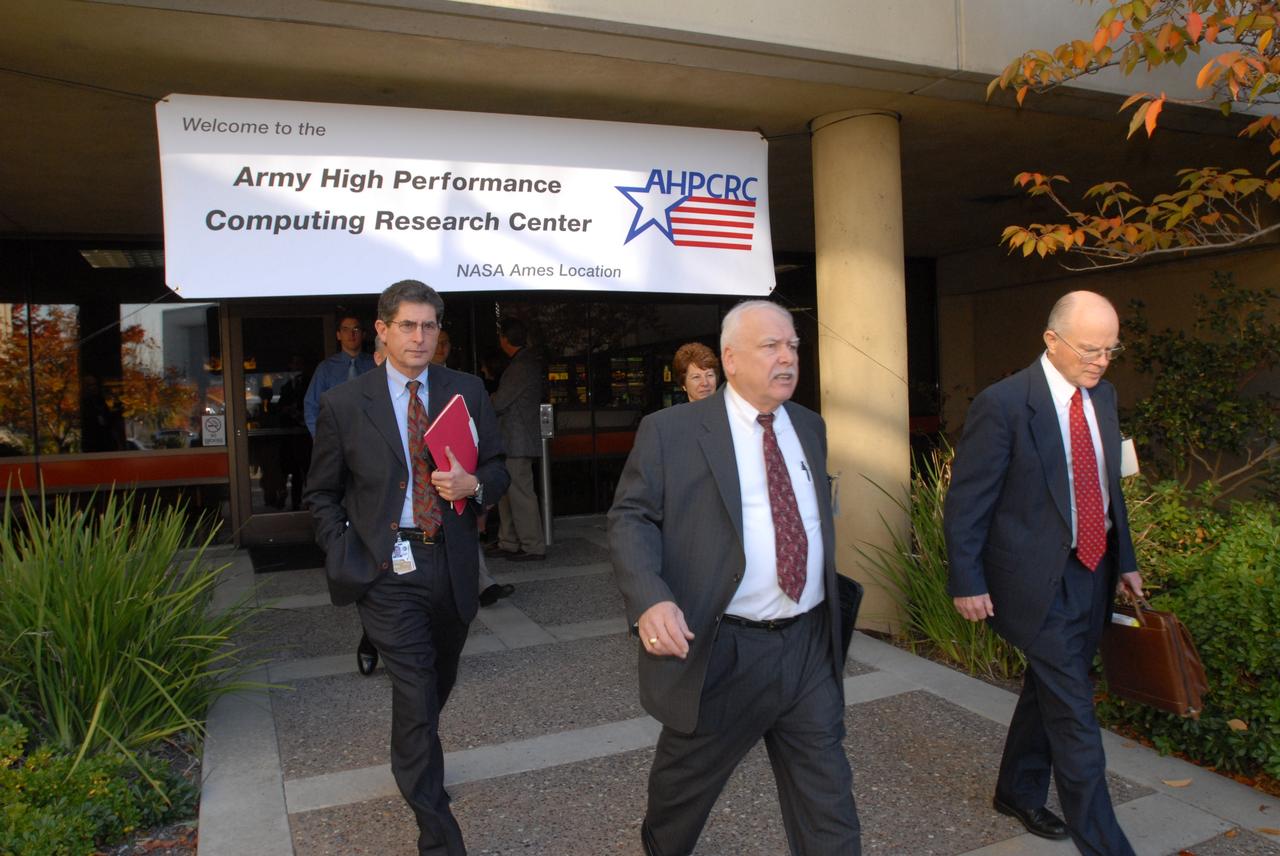
Army visits NASA (opening) Army Supercomputing Facitlity
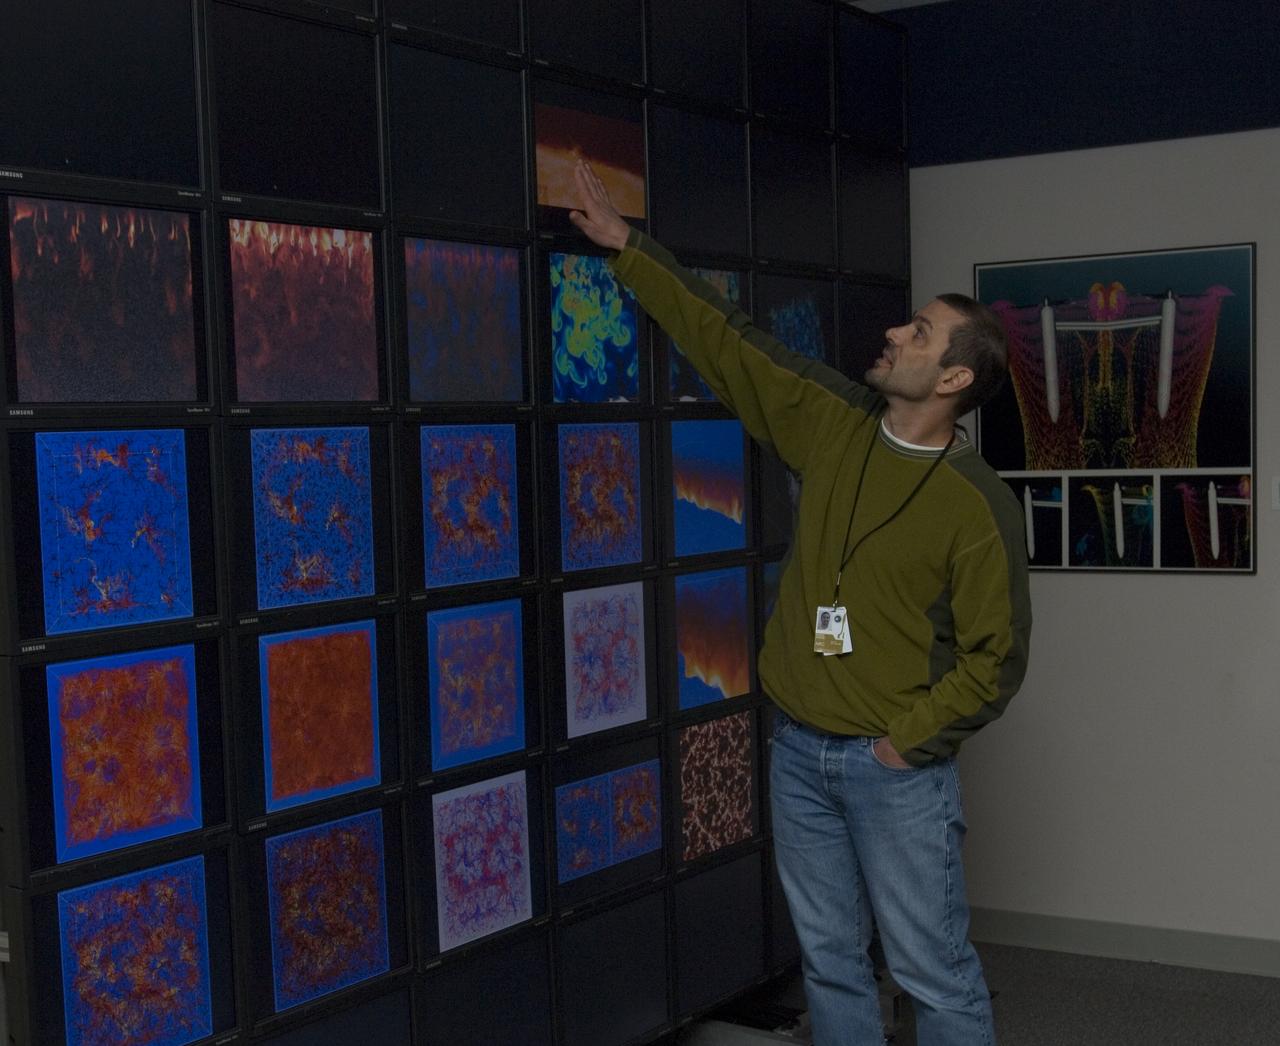
Yuri's Night at Ames a celebration of the first human in space. Overview of hyperwall by Chris Henze, NASA Advanced Supercomputing (NAS) Division
N-258 NAS PARRALLEL PROCESSORS, CRAY C-90
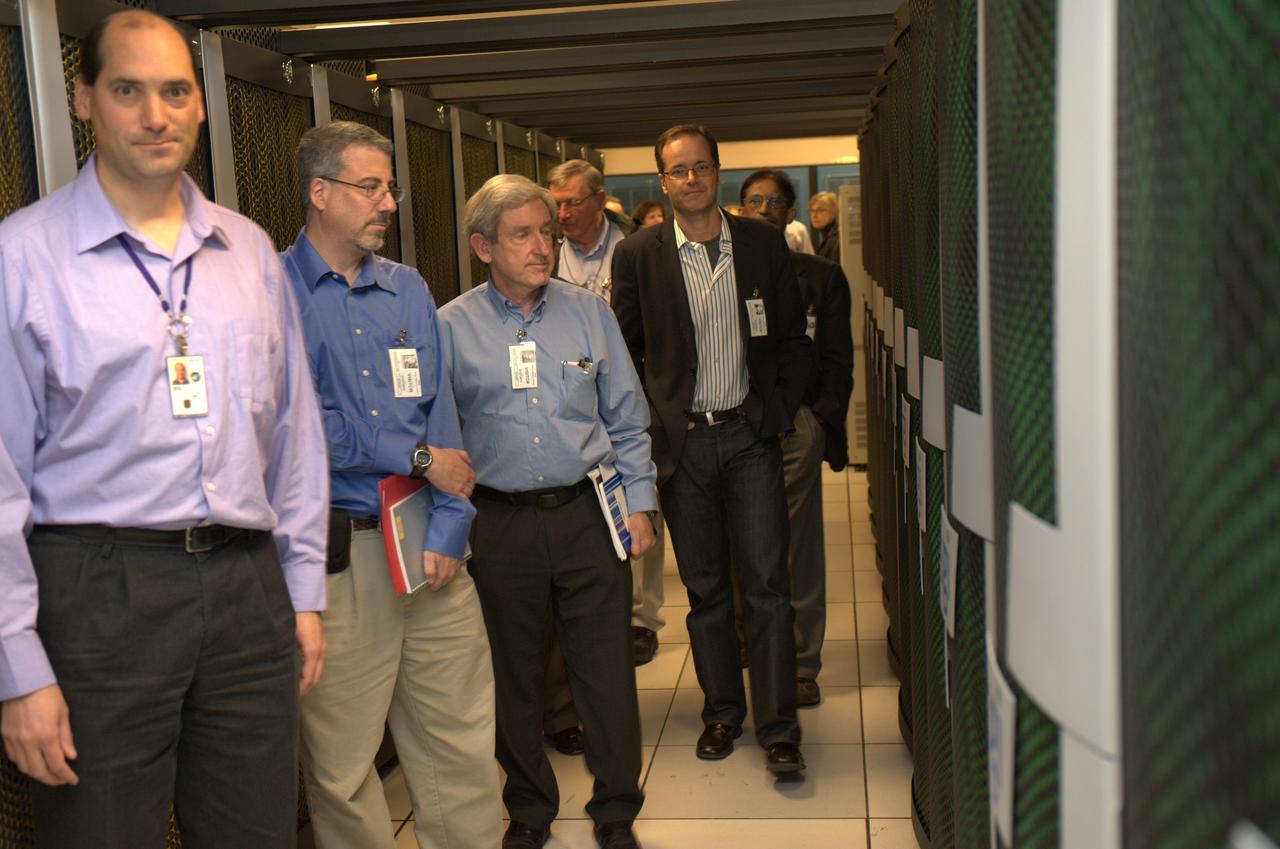
Almaden IBM tour of NAS Facility with Bryon Biegel, Deputy Division Chief (acting)
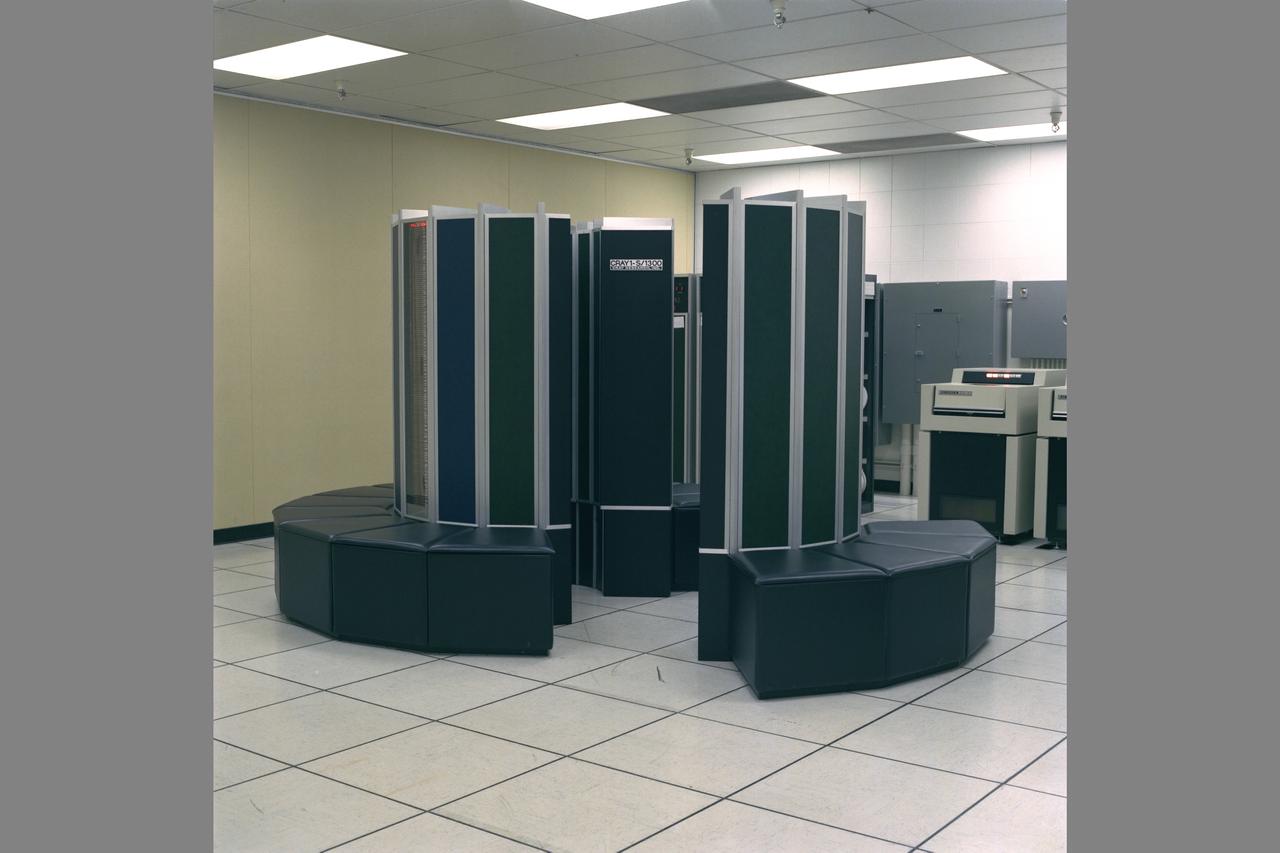
Cray 1S computer N-233A rm-190
Almaden IBM tour of NAS Facility with Bryon Biegel, Deputy Division Chief (acting)
Ames Director William 'Bill' Ballhaus (center left) joins visitor Sir Jeffrey Pope from Royla Aircraft Industry, England (center right) at the NAS Facility Cray 2 computer with Ron Deiss, NAS Deputy Manager (L) and Vic Peterson, Ames Deputy Director (R).
N-258 NAS COMPUTER ROOM SHOWING PARRALLEL PROCESSORS, INTEL PARGON, THINKING MACHINE (CM-5), & CRAY C-90
N-233 Cray Computer Ames Director Bill Ballhaus seated with Stan Miller in front of the Cray Computer in N-233
Cray 550 Computer installed in N-233 with B Rosen and Dr. Paul Kutler. Dr. Kutler (right) guided much of Ames' work in computaitonal fluid dynamics used in Ames 60 yr. History NASA SP-2000-4314
Yuri's Night at Ames a celebration of the first human in space. (Overview with Bryan Biegel, Chief of the Research Branch, NASA Advanced Supercomputing (NAS) Division)

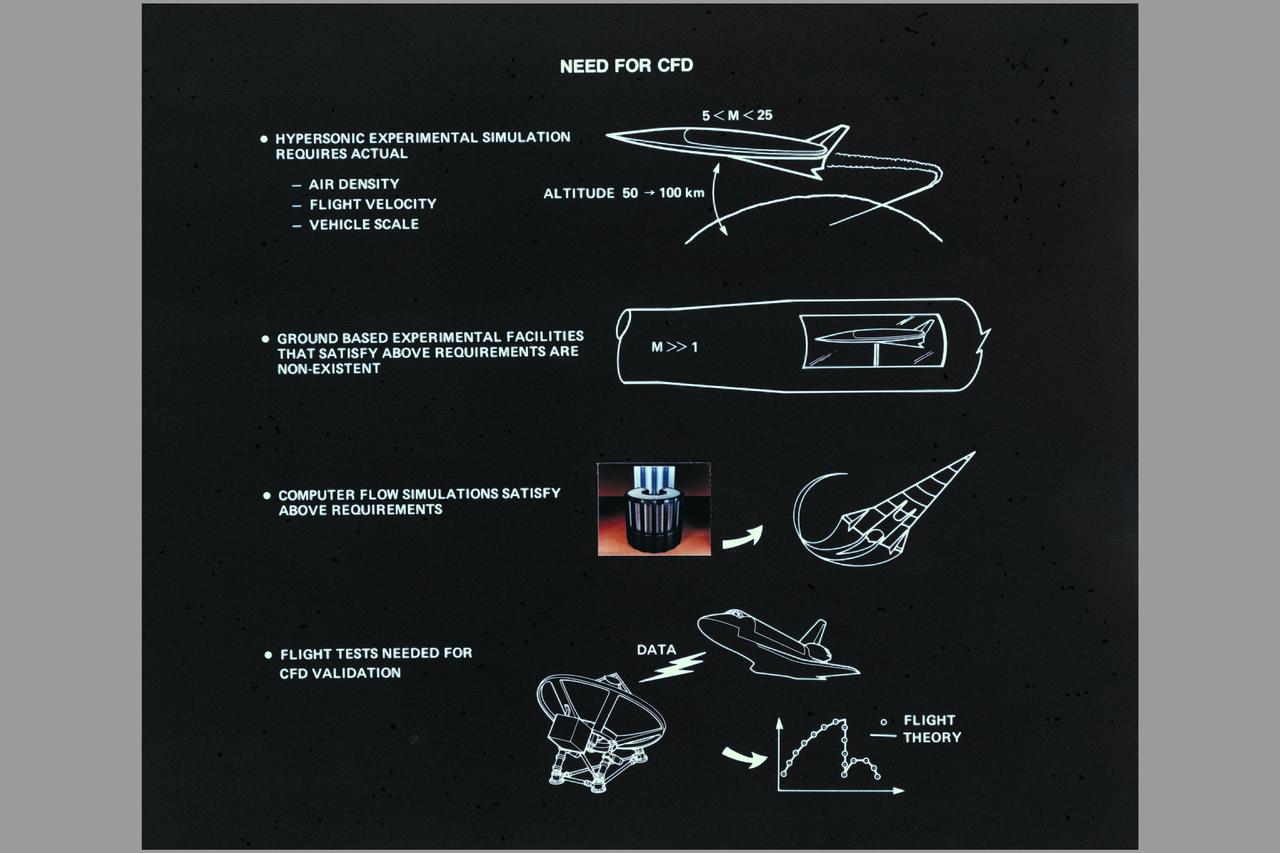
CFD Composite: Aerospace Plane, Cray-2, Space Shuttle (Ref: AC85-0002-6.1)
Obama Administration launches Cloud Computing Initiative at Ames Research Center. Vivek Kundra, White House Chief Federal Information Officer (right) and Lori Garver, NASA Deputy Administrator (left) get a tour & demo NASAS Supercomputing Center Hyperwall by Chris Kemp.
Kepler Program VIP's from left Jon Jenkins, Natalie Batalha, and Bill Borucki pointing at the NASA Ames Hyperwall in the NAS (NASA Advanced Supercomputing) facility filled with exo-planets discovered during Kepler Mission. Moffett Field, CA (for aviation week)

Kepler Program VIP's from left Natalie Batalha, Bill Borucki and Jon Jenkins in front of a NASA Ames Hyperwall display of newly discovered planet K-22B art at the NAS (NASA Advanced Supercomputing) Facility, Moffett Field, CA (for aviation week)
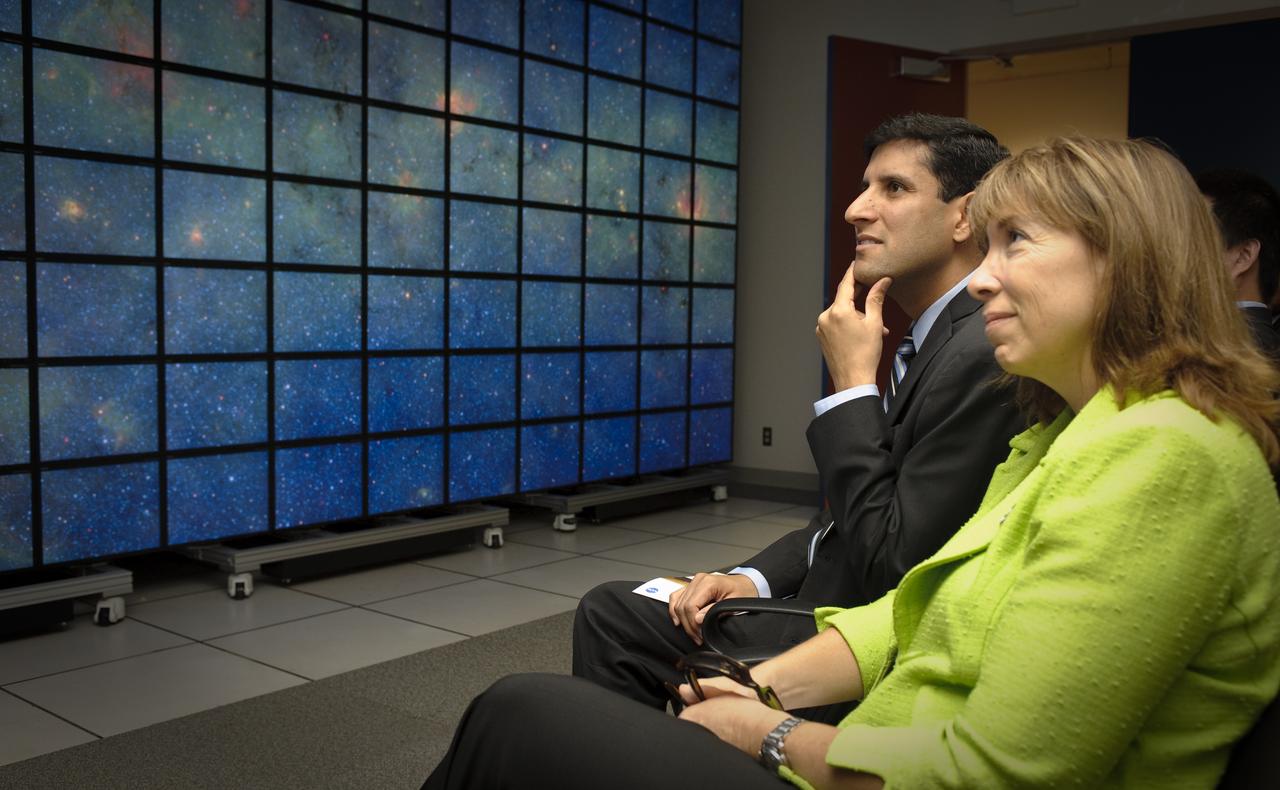
Obama Administration launches Cloud Computing Initiative at Ames Research Center. Vivek Kundra, White House Chief Federal Information Officer (right) and Lori Garver, NASA Deputy Administrator (left) get a tour & demo NASAS Supercomputing Center Hyperwall.
N-258 NAS (Numerical Aerodynamic Simulation) Computers - Cray C-90
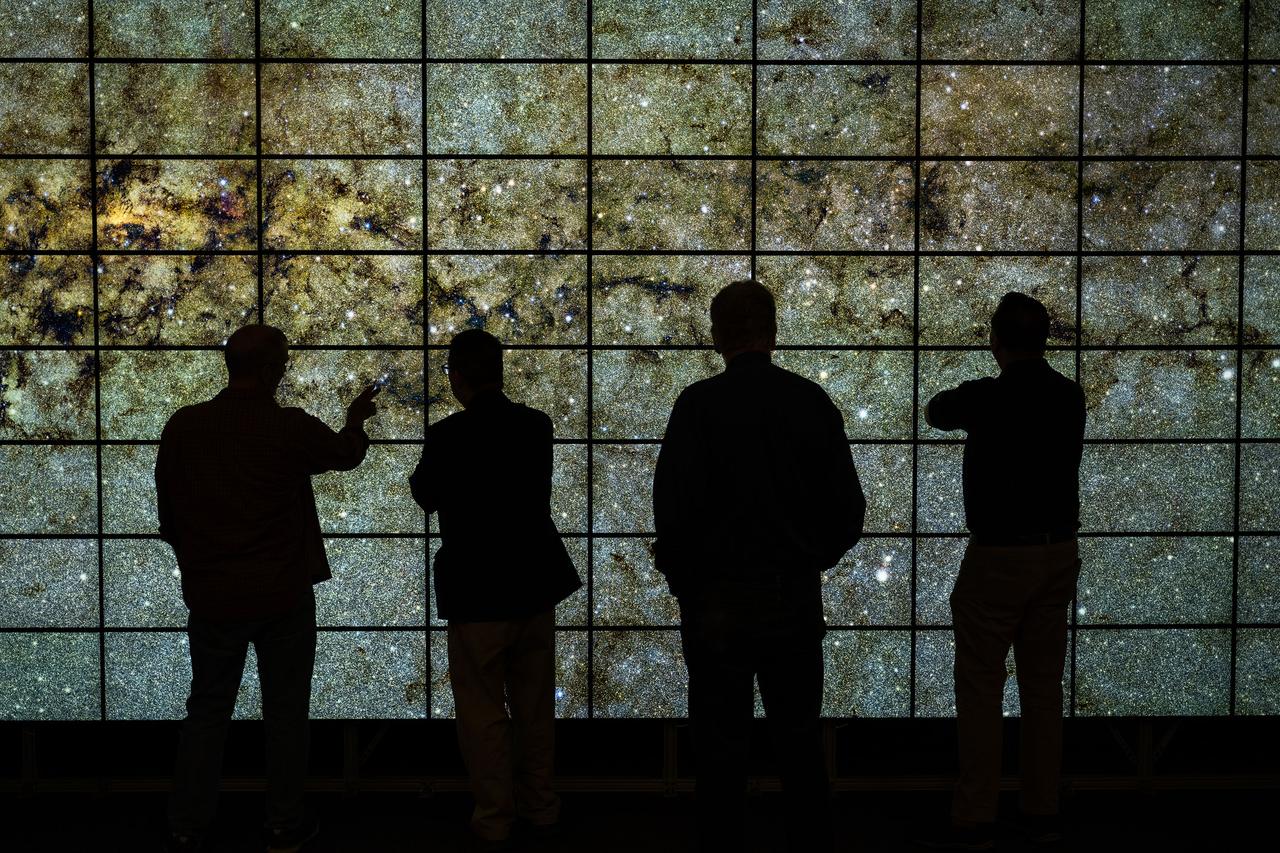
Chris Henze demonstrates the newly upgraded hyperwall visualization system to Center Director Eugene Tu, Deputy Center Director David Korsmeyer, and NAS Division management in N258.

This graphic shows the computer simulation of a black hole from start to finish. Plasma is falling slowly toward the black hole in a (at the upper left). The plasma has a magnetic field, shown by the white lines. It picks up speed as it falls toward the hole in b (at the upper right), c (lower left) and d (lower right). However, the rotating black hole twists up space itself (and the magnetic field lines) and ejects electromagnetic power along the north and south poles above the black hole. The red and white color shows the immense electromagnetic power output, which eventually will pick up particles and form squirting jets. This simulation was conducted using supercomputers at Japan's National Institute for Fusion Science. http://photojournal.jpl.nasa.gov/catalog/PIA04206
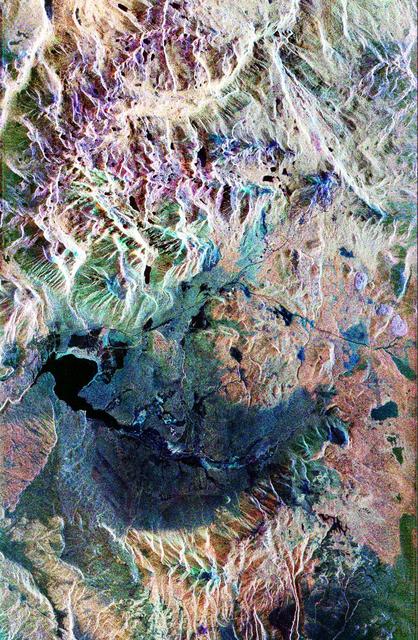
This false-color composite radar image of the Mammoth Mountain area in the Sierra Nevada Mountains, California, was acquired by the Spaceborne Imaging Radar-C and X-band Synthetic Aperture Radar aboard the space shuttle Endeavour on its 67th orbit on October 3, 1994. The image is centered at 37.6 degrees north latitude and 119.0 degrees west longitude. The area is about 39 kilometers by 51 kilometers (24 miles by 31 miles). North is toward the bottom, about 45 degrees to the right. In this image, red was created using L-band (horizontally transmitted/vertically received) polarization data; green was created using C-band (horizontally transmitted/vertically received) polarization data; and blue was created using C-band (horizontally transmitted and received) polarization data. Crawley Lake appears dark at the center left of the image, just above or south of Long Valley. The Mammoth Mountain ski area is visible at the top right of the scene. The red areas correspond to forests, the dark blue areas are bare surfaces and the green areas are short vegetation, mainly brush. The purple areas at the higher elevations in the upper part of the scene are discontinuous patches of snow cover from a September 28 storm. New, very thin snow was falling before and during the second space shuttle pass. In parallel with the operational SIR-C data processing, an experimental effort is being conducted to test SAR data processing using the Jet Propulsion Laboratory's massively parallel supercomputing facility, centered around the Cray Research T3D. These experiments will assess the abilities of large supercomputers to produce high throughput Synthetic Aperture Radar processing in preparation for upcoming data-intensive SAR missions. The image released here was produced as part of this experimental effort. http://photojournal.jpl.nasa.gov/catalog/PIA01746
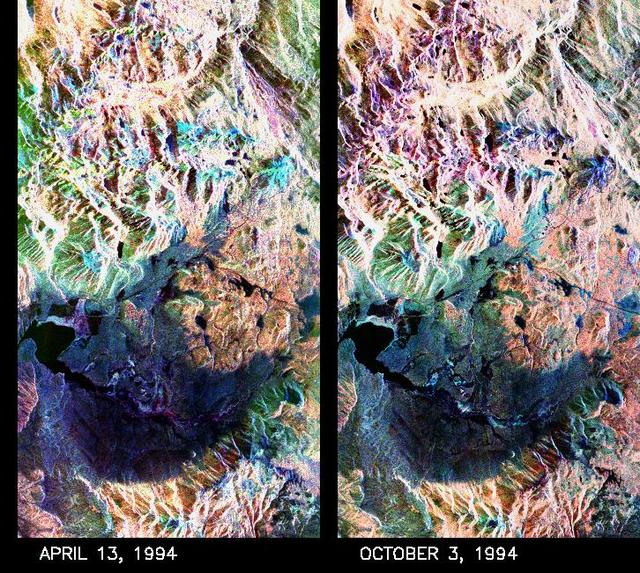
These two false-color composite images of the Mammoth Mountain area in the Sierra Nevada Mountains, Calif., show significant seasonal changes in snow cover. The image at left was acquired by the Spaceborne Imaging Radar-C and X-band Synthetic Aperture Radar aboard the space shuttle Endeavour on its 67th orbit on April 13, 1994. The image is centered at 37.6 degrees north latitude and 119 degrees west longitude. The area is about 36 kilometers by 48 kilometers (22 miles by 29 miles). In this image, red is L-band (horizontally transmitted and vertically received) polarization data; green is C-band (horizontally transmitted and vertically received) polarization data; and blue is C-band (horizontally transmitted and received) polarization data. The image at right was acquired on October 3, 1994, on the space shuttle Endeavour's 67th orbit of the second radar mission. Crowley Lake appears dark at the center left of the image, just above or south of Long Valley. The Mammoth Mountain ski area is visible at the top right of the scene. The red areas correspond to forests, the dark blue areas are bare surfaces and the green areas are short vegetation, mainly brush. The changes in color tone at the higher elevations (e.g. the Mammoth Mountain ski area) from green-blue in April to purple in September reflect changes in snow cover between the two missions. The April mission occurred immediately following a moderate snow storm. During the mission the snow evolved from a dry, fine-grained snowpack with few distinct layers to a wet, coarse-grained pack with multiple ice inclusions. Since that mission, all snow in the area has melted except for small glaciers and permanent snowfields on the Silver Divide and near the headwaters of Rock Creek. On October 3, 1994, only discontinuous patches of snow cover were present at very high elevations following the first snow storm of the season on September 28, 1994. For investigations in hydrology and land-surface climatology, seasonal snow cover and alpine glaciers are critical to the radiation and water balances. SIR-C/X-SAR is a powerful tool because it is sensitive to most snowpack conditions and is less influenced by weather conditions than other remote sensing instruments, such as Landsat. In parallel with the operational SIR-C data processing, an experimental effort is being conducted to test SAR data processing using the Jet Propulsion Laboratory's massively parallel supercomputing facility, centered around the Cray Research T3D. These experiments will assess the abilities of large supercomputers to produce high throughput SAR processing in preparation for upcoming data-intensive SAR missions. The images released here were produced as part of this experimental effort. http://photojournal.jpl.nasa.gov/catalog/PIA01753
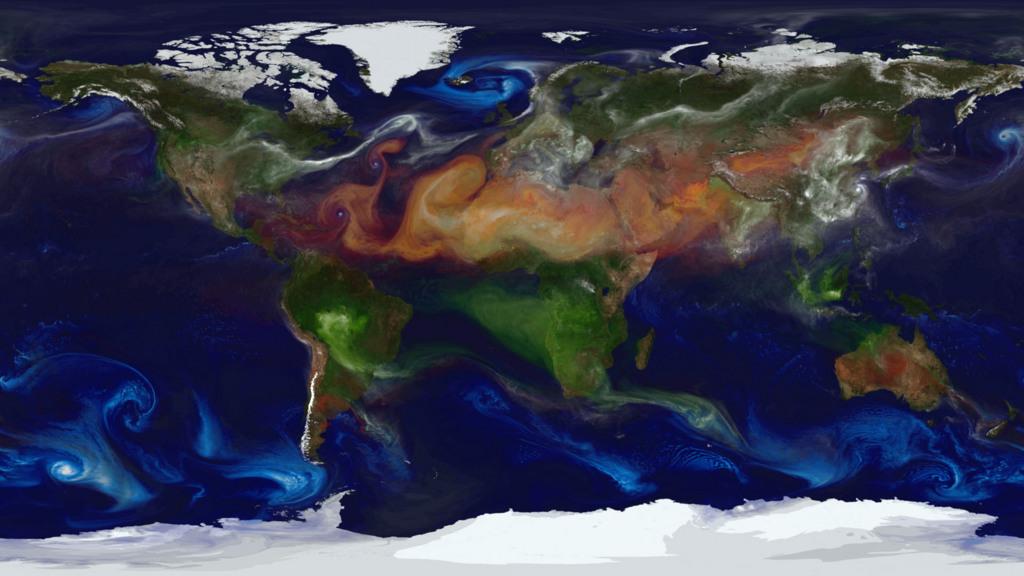
NASA models and supercomputing have created a colorful new view of aerosol movement. Satellites, balloon-borne instruments and ground-based devices make 30 million observations of the atmosphere each day. Yet these measurements still give an incomplete picture of the complex interactions within the membrane surrounding Earth. Enter climate models. Through mathematical experiments, modelers can move Earth forward or backward in time to create a dynamic portrait of the planet. Researchers from NASA Goddard’s Global Modeling and Assimilation Office recently ran a simulation of the atmosphere that captured how winds whip aerosols around the world. Such simulations allow scientists to better understand how these tiny particulates travel in the atmosphere and influence weather and climate. In the visualization below, covering August 2006 to April 2007, watch as dust and sea salt swirl inside cyclones, carbon bursts from fires, sulfate streams from volcanoes—and see how these aerosols paint the modeled world. Credit: NASA/Goddard Space Flight Center
A NASA Center for Climate Simulation supercomputer model that shows the flow of #Blizzard2016 thru Sunday. Learn more here: <a href="http://go.nasa.gov/1WBm547" rel="nofollow">go.nasa.gov/1WBm547</a> <b><a href="http://www.nasa.gov/audience/formedia/features/MP_Photo_Guidelines.html" rel="nofollow">NASA image use policy.</a></b> <b><a href="http://www.nasa.gov/centers/goddard/home/index.html" rel="nofollow">NASA Goddard Space Flight Center</a></b> enables NASA’s mission through four scientific endeavors: Earth Science, Heliophysics, Solar System Exploration, and Astrophysics. Goddard plays a leading role in NASA’s accomplishments by contributing compelling scientific knowledge to advance the Agency’s mission. <b>Follow us on <a href="http://twitter.com/NASAGoddardPix" rel="nofollow">Twitter</a></b> <b>Like us on <a href="http://www.facebook.com/pages/Greenbelt-MD/NASA-Goddard/395013845897?ref=tsd" rel="nofollow">Facebook</a></b> <b>Find us on <a href="http://instagrid.me/nasagoddard/?vm=grid" rel="nofollow">Instagram</a></b>
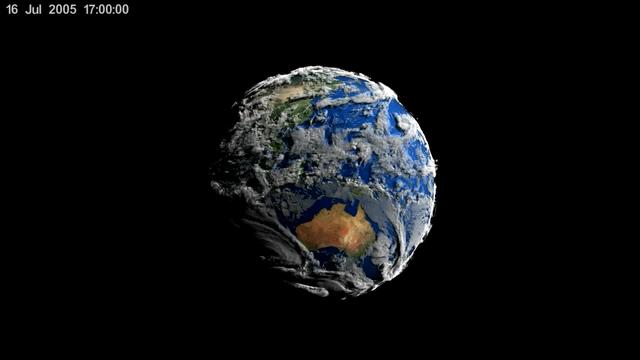
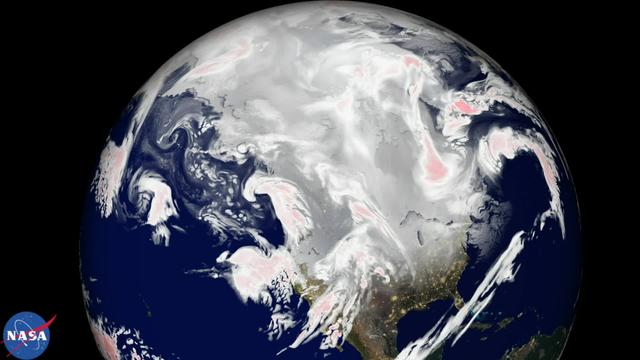
This visualization shows early test renderings of a global computational model of Earth's atmosphere based on data from NASA's Goddard Earth Observing System Model, Version 5 (GEOS-5). This particular run, called Nature Run 2, was run on a supercomputer, spanned 2 years of simulation time at 30 minute intervals, and produced Petabytes of output. The visualization spans a little more than 7 days of simulation time which is 354 time steps. The time period was chosen because a simulated category-4 typhoon developed off the coast of China. The 7 day period is repeated several times during the course of the visualization. Credit: NASA's Scientific Visualization Studio Read more or download here: <a href="http://svs.gsfc.nasa.gov/goto?4180" rel="nofollow">svs.gsfc.nasa.gov/goto?4180</a> <b><a href="http://www.nasa.gov/audience/formedia/features/MP_Photo_Guidelines.html" rel="nofollow">NASA image use policy.</a></b> <b><a href="http://www.nasa.gov/centers/goddard/home/index.html" rel="nofollow">NASA Goddard Space Flight Center</a></b> enables NASA’s mission through four scientific endeavors: Earth Science, Heliophysics, Solar System Exploration, and Astrophysics. Goddard plays a leading role in NASA’s accomplishments by contributing compelling scientific knowledge to advance the Agency’s mission. <b>Follow us on <a href="http://twitter.com/NASAGoddardPix" rel="nofollow">Twitter</a></b> <b>Like us on <a href="http://www.facebook.com/pages/Greenbelt-MD/NASA-Goddard/395013845897?ref=tsd" rel="nofollow">Facebook</a></b> <b>Find us on <a href="http://instagram.com/nasagoddard?vm=grid" rel="nofollow">Instagram</a></b>
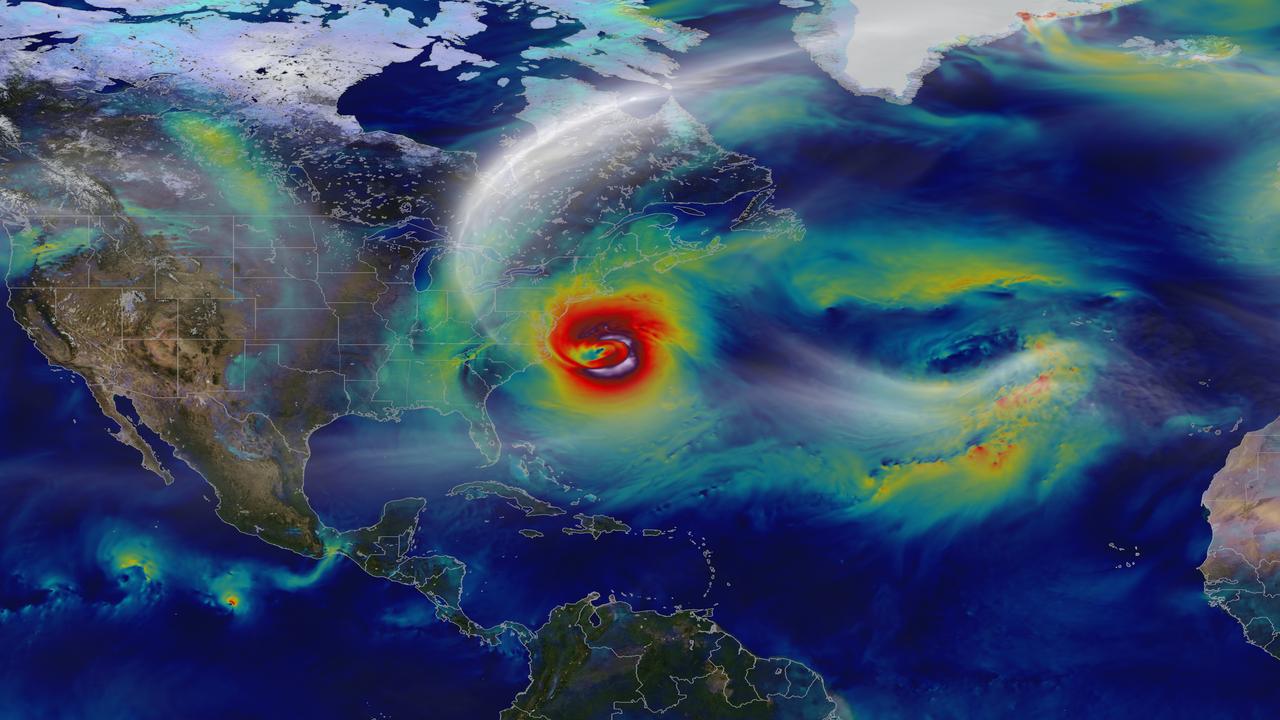
Oct. 29, 2012 – A day before landfall, Sandy intensified into a Category 2 superstorm nearly 1,000 miles wide. Credit: NASA's Goddard Space Flight Center and NASA Center for Climate Simulation Video and images courtesy of NASA/GSFC/William Putman -- A NASA computer model simulates the astonishing track and forceful winds of Hurricane Sandy. Hurricane Sandy pummeled the East Coast late in 2012’s Atlantic hurricane season, causing 159 deaths and $70 billion in damages. Days before landfall, forecasts of its trajectory were still being made. Some computer models showed that a trough in the jet stream would kick the monster storm away from land and out to sea. Among the earliest to predict its true course was NASA’s GEOS-5 global atmosphere model. The model works by dividing Earth’s atmosphere into a virtual grid of stacked boxes. A supercomputer then solves mathematical equations inside each box to create a weather forecast predicting Sandy’s structure, path and other traits. The NASA model not only produced an accurate track of Sandy, but also captured fine-scale details of the storm’s changing intensity and winds. Watch the video to see it for yourself. For more information, please visit: <a href="http://gmao.gsfc.nasa.gov/research/atmosphericassim/tracking_hurricanes/" rel="nofollow">gmao.gsfc.nasa.gov/research/atmosphericassim/tracking_hur...</a> <b><a href="http://www.nasa.gov/audience/formedia/features/MP_Photo_Guidelines.html" rel="nofollow">NASA image use policy.</a></b> <b><a href="http://www.nasa.gov/centers/goddard/home/index.html" rel="nofollow">NASA Goddard Space Flight Center</a></b> enables NASA’s mission through four scientific endeavors: Earth Science, Heliophysics, Solar System Exploration, and Astrophysics. Goddard plays a leading role in NASA’s accomplishments by contributing compelling scientific knowledge to advance the Agency’s mission. <b>Follow us on <a href="http://twitter.com/NASA_GoddardPix" rel="nofollow">Twitter</a></b> <b>Like us on <a href="http://www.facebook.com/pages/Greenbelt-MD/NASA-Goddard/395013845897?ref=tsd" rel="nofollow">Facebook</a></b> <b>Find us on <a href="http://instagram.com/nasagoddard?vm=grid" rel="nofollow">Instagram</a></b>

This supercomputer simulation shows one of the most violent events in the universe: a pair of neutron stars colliding, merging and forming a black hole. A neutron star is the compressed core left behind when a star born with between eight and 30 times the sun's mass explodes as a supernova. Neutron stars pack about 1.5 times the mass of the sun — equivalent to about half a million Earths — into a ball just 12 miles (20 km) across. As the simulation begins, we view an unequally matched pair of neutron stars weighing 1.4 and 1.7 solar masses. They are separated by only about 11 miles, slightly less distance than their own diameters. Redder colors show regions of progressively lower density. As the stars spiral toward each other, intense tides begin to deform them, possibly cracking their crusts. Neutron stars possess incredible density, but their surfaces are comparatively thin, with densities about a million times greater than gold. Their interiors crush matter to a much greater degree densities rise by 100 million times in their centers. To begin to imagine such mind-boggling densities, consider that a cubic centimeter of neutron star matter outweighs Mount Everest. By 7 milliseconds, tidal forces overwhelm and shatter the lesser star. Its superdense contents erupt into the system and curl a spiral arm of incredibly hot material. At 13 milliseconds, the more massive star has accumulated too much mass to support it against gravity and collapses, and a new black hole is born. The black hole's event horizon — its point of no return — is shown by the gray sphere. While most of the matter from both neutron stars will fall into the black hole, some of the less dense, faster moving matter manages to orbit around it, quickly forming a large and rapidly rotating torus. This torus extends for about 124 miles (200 km) and contains the equivalent of 1/5th the mass of our sun. Scientists think neutron star mergers like this produce short gamma-ray bursts (GRBs). Short GRBs last less than two seconds yet unleash as much energy as all the stars in our galaxy produce over one year. The rapidly fading afterglow of these explosions presents a challenge to astronomers. A key element in understanding GRBs is getting instruments on large ground-based telescopes to capture afterglows as soon as possible after the burst. The rapid notification and accurate positions provided by NASA's Swift mission creates a vibrant synergy with ground-based observatories that has led to dramatically improved understanding of GRBs, especially for short bursts. This video is public domain and can be downloaded at: : <a href="http://svs.gsfc.nasa.gov/goto?11530" rel="nofollow">svs.gsfc.nasa.gov/goto?11530</a>

Simulation frames from this NASA Goddard neutron star merger animation: <a href="http://bit.ly/1jolBYY" rel="nofollow">bit.ly/1jolBYY</a> Credit: NASA's Goddard Space Flight Center This supercomputer simulation shows one of the most violent events in the universe: a pair of neutron stars colliding, merging and forming a black hole. A neutron star is the compressed core left behind when a star born with between eight and 30 times the sun's mass explodes as a supernova. Neutron stars pack about 1.5 times the mass of the sun — equivalent to about half a million Earths — into a ball just 12 miles (20 km) across. As the simulation begins, we view an unequally matched pair of neutron stars weighing 1.4 and 1.7 solar masses. They are separated by only about 11 miles, slightly less distance than their own diameters. Redder colors show regions of progressively lower density. As the stars spiral toward each other, intense tides begin to deform them, possibly cracking their crusts. Neutron stars possess incredible density, but their surfaces are comparatively thin, with densities about a million times greater than gold. Their interiors crush matter to a much greater degree densities rise by 100 million times in their centers. To begin to imagine such mind-boggling densities, consider that a cubic centimeter of neutron star matter outweighs Mount Everest. By 7 milliseconds, tidal forces overwhelm and shatter the lesser star. Its superdense contents erupt into the system and curl a spiral arm of incredibly hot material. At 13 milliseconds, the more massive star has accumulated too much mass to support it against gravity and collapses, and a new black hole is born. The black hole's event horizon — its point of no return — is shown by the gray sphere. While most of the matter from both neutron stars will fall into the black hole, some of the less dense, faster moving matter manages to orbit around it, quickly forming a large and rapidly rotating torus. This torus extends for about 124 miles (200 km) and contains the equivalent of 1/5th the mass of our sun. Scientists think neutron star mergers like this produce short gamma-ray bursts (GRBs). Short GRBs last less than two seconds yet unleash as much energy as all the stars in our galaxy produce over one year. The rapidly fading afterglow of these explosions presents a challenge to astronomers. A key element in understanding GRBs is getting instruments on large ground-based telescopes to capture afterglows as soon as possible after the burst. The rapid notification and accurate positions provided by NASA's Swift mission creates a vibrant synergy with ground-based observatories that has led to dramatically improved understanding of GRBs, especially for short bursts. This video is public domain and can be downloaded at: <a href="http://svs.gsfc.nasa.gov/vis/a010000/a011500/a011530/index.html" rel="nofollow">svs.gsfc.nasa.gov/vis/a010000/a011500/a011530/index.html</a> <b><a href="http://www.nasa.gov/audience/formedia/features/MP_Photo_Guidelines.html" rel="nofollow">NASA image use policy.</a></b> <b><a href="http://www.nasa.gov/centers/goddard/home/index.html" rel="nofollow">NASA Goddard Space Flight Center</a></b> enables NASA’s mission through four scientific endeavors: Earth Science, Heliophysics, Solar System Exploration, and Astrophysics. Goddard plays a leading role in NASA’s accomplishments by contributing compelling scientific knowledge to advance the Agency’s mission. <b>Follow us on <a href="http://twitter.com/NASAGoddardPix" rel="nofollow">Twitter</a></b> <b>Like us on <a href="http://www.facebook.com/pages/Greenbelt-MD/NASA-Goddard/395013845897?ref=tsd" rel="nofollow">Facebook</a></b> <b>Find us on <a href="http://instagram.com/nasagoddard?vm=grid" rel="nofollow">Instagram</a></b>

Simulation frames from this NASA Goddard neutron star merger animation: <a href="http://bit.ly/1jolBYY" rel="nofollow">bit.ly/1jolBYY</a> Credit: NASA's Goddard Space Flight Center This supercomputer simulation shows one of the most violent events in the universe: a pair of neutron stars colliding, merging and forming a black hole. A neutron star is the compressed core left behind when a star born with between eight and 30 times the sun's mass explodes as a supernova. Neutron stars pack about 1.5 times the mass of the sun — equivalent to about half a million Earths — into a ball just 12 miles (20 km) across. As the simulation begins, we view an unequally matched pair of neutron stars weighing 1.4 and 1.7 solar masses. They are separated by only about 11 miles, slightly less distance than their own diameters. Redder colors show regions of progressively lower density. As the stars spiral toward each other, intense tides begin to deform them, possibly cracking their crusts. Neutron stars possess incredible density, but their surfaces are comparatively thin, with densities about a million times greater than gold. Their interiors crush matter to a much greater degree densities rise by 100 million times in their centers. To begin to imagine such mind-boggling densities, consider that a cubic centimeter of neutron star matter outweighs Mount Everest. By 7 milliseconds, tidal forces overwhelm and shatter the lesser star. Its superdense contents erupt into the system and curl a spiral arm of incredibly hot material. At 13 milliseconds, the more massive star has accumulated too much mass to support it against gravity and collapses, and a new black hole is born. The black hole's event horizon — its point of no return — is shown by the gray sphere. While most of the matter from both neutron stars will fall into the black hole, some of the less dense, faster moving matter manages to orbit around it, quickly forming a large and rapidly rotating torus. This torus extends for about 124 miles (200 km) and contains the equivalent of 1/5th the mass of our sun. Scientists think neutron star mergers like this produce short gamma-ray bursts (GRBs). Short GRBs last less than two seconds yet unleash as much energy as all the stars in our galaxy produce over one year. The rapidly fading afterglow of these explosions presents a challenge to astronomers. A key element in understanding GRBs is getting instruments on large ground-based telescopes to capture afterglows as soon as possible after the burst. The rapid notification and accurate positions provided by NASA's Swift mission creates a vibrant synergy with ground-based observatories that has led to dramatically improved understanding of GRBs, especially for short bursts. This video is public domain and can be downloaded at: <a href="http://svs.gsfc.nasa.gov/vis/a010000/a011500/a011530/index.html" rel="nofollow">svs.gsfc.nasa.gov/vis/a010000/a011500/a011530/index.html</a> <b><a href="http://www.nasa.gov/audience/formedia/features/MP_Photo_Guidelines.html" rel="nofollow">NASA image use policy.</a></b> <b><a href="http://www.nasa.gov/centers/goddard/home/index.html" rel="nofollow">NASA Goddard Space Flight Center</a></b> enables NASA’s mission through four scientific endeavors: Earth Science, Heliophysics, Solar System Exploration, and Astrophysics. Goddard plays a leading role in NASA’s accomplishments by contributing compelling scientific knowledge to advance the Agency’s mission. <b>Follow us on <a href="http://twitter.com/NASAGoddardPix" rel="nofollow">Twitter</a></b> <b>Like us on <a href="http://www.facebook.com/pages/Greenbelt-MD/NASA-Goddard/395013845897?ref=tsd" rel="nofollow">Facebook</a></b> <b>Find us on <a href="http://instagram.com/nasagoddard?vm=grid" rel="nofollow">Instagram</a></b>

Simulation frames from this NASA Goddard neutron star merger animation: <a href="http://bit.ly/1jolBYY" rel="nofollow">bit.ly/1jolBYY</a> Credit: NASA's Goddard Space Flight Center This supercomputer simulation shows one of the most violent events in the universe: a pair of neutron stars colliding, merging and forming a black hole. A neutron star is the compressed core left behind when a star born with between eight and 30 times the sun's mass explodes as a supernova. Neutron stars pack about 1.5 times the mass of the sun — equivalent to about half a million Earths — into a ball just 12 miles (20 km) across. As the simulation begins, we view an unequally matched pair of neutron stars weighing 1.4 and 1.7 solar masses. They are separated by only about 11 miles, slightly less distance than their own diameters. Redder colors show regions of progressively lower density. As the stars spiral toward each other, intense tides begin to deform them, possibly cracking their crusts. Neutron stars possess incredible density, but their surfaces are comparatively thin, with densities about a million times greater than gold. Their interiors crush matter to a much greater degree densities rise by 100 million times in their centers. To begin to imagine such mind-boggling densities, consider that a cubic centimeter of neutron star matter outweighs Mount Everest. By 7 milliseconds, tidal forces overwhelm and shatter the lesser star. Its superdense contents erupt into the system and curl a spiral arm of incredibly hot material. At 13 milliseconds, the more massive star has accumulated too much mass to support it against gravity and collapses, and a new black hole is born. The black hole's event horizon — its point of no return — is shown by the gray sphere. While most of the matter from both neutron stars will fall into the black hole, some of the less dense, faster moving matter manages to orbit around it, quickly forming a large and rapidly rotating torus. This torus extends for about 124 miles (200 km) and contains the equivalent of 1/5th the mass of our sun. Scientists think neutron star mergers like this produce short gamma-ray bursts (GRBs). Short GRBs last less than two seconds yet unleash as much energy as all the stars in our galaxy produce over one year. The rapidly fading afterglow of these explosions presents a challenge to astronomers. A key element in understanding GRBs is getting instruments on large ground-based telescopes to capture afterglows as soon as possible after the burst. The rapid notification and accurate positions provided by NASA's Swift mission creates a vibrant synergy with ground-based observatories that has led to dramatically improved understanding of GRBs, especially for short bursts. This video is public domain and can be downloaded at: <a href="http://svs.gsfc.nasa.gov/vis/a010000/a011500/a011530/index.html" rel="nofollow">svs.gsfc.nasa.gov/vis/a010000/a011500/a011530/index.html</a> <b><a href="http://www.nasa.gov/audience/formedia/features/MP_Photo_Guidelines.html" rel="nofollow">NASA image use policy.</a></b> <b><a href="http://www.nasa.gov/centers/goddard/home/index.html" rel="nofollow">NASA Goddard Space Flight Center</a></b> enables NASA’s mission through four scientific endeavors: Earth Science, Heliophysics, Solar System Exploration, and Astrophysics. Goddard plays a leading role in NASA’s accomplishments by contributing compelling scientific knowledge to advance the Agency’s mission. <b>Follow us on <a href="http://twitter.com/NASAGoddardPix" rel="nofollow">Twitter</a></b> <b>Like us on <a href="http://www.facebook.com/pages/Greenbelt-MD/NASA-Goddard/395013845897?ref=tsd" rel="nofollow">Facebook</a></b> <b>Find us on <a href="http://instagram.com/nasagoddard?vm=grid" rel="nofollow">Instagram</a></b>

Simulation frames from this NASA Goddard neutron star merger animation: <a href="http://bit.ly/1jolBYY" rel="nofollow">bit.ly/1jolBYY</a> Credit: NASA's Goddard Space Flight Center This supercomputer simulation shows one of the most violent events in the universe: a pair of neutron stars colliding, merging and forming a black hole. A neutron star is the compressed core left behind when a star born with between eight and 30 times the sun's mass explodes as a supernova. Neutron stars pack about 1.5 times the mass of the sun — equivalent to about half a million Earths — into a ball just 12 miles (20 km) across. As the simulation begins, we view an unequally matched pair of neutron stars weighing 1.4 and 1.7 solar masses. They are separated by only about 11 miles, slightly less distance than their own diameters. Redder colors show regions of progressively lower density. As the stars spiral toward each other, intense tides begin to deform them, possibly cracking their crusts. Neutron stars possess incredible density, but their surfaces are comparatively thin, with densities about a million times greater than gold. Their interiors crush matter to a much greater degree densities rise by 100 million times in their centers. To begin to imagine such mind-boggling densities, consider that a cubic centimeter of neutron star matter outweighs Mount Everest. By 7 milliseconds, tidal forces overwhelm and shatter the lesser star. Its superdense contents erupt into the system and curl a spiral arm of incredibly hot material. At 13 milliseconds, the more massive star has accumulated too much mass to support it against gravity and collapses, and a new black hole is born. The black hole's event horizon — its point of no return — is shown by the gray sphere. While most of the matter from both neutron stars will fall into the black hole, some of the less dense, faster moving matter manages to orbit around it, quickly forming a large and rapidly rotating torus. This torus extends for about 124 miles (200 km) and contains the equivalent of 1/5th the mass of our sun. Scientists think neutron star mergers like this produce short gamma-ray bursts (GRBs). Short GRBs last less than two seconds yet unleash as much energy as all the stars in our galaxy produce over one year. The rapidly fading afterglow of these explosions presents a challenge to astronomers. A key element in understanding GRBs is getting instruments on large ground-based telescopes to capture afterglows as soon as possible after the burst. The rapid notification and accurate positions provided by NASA's Swift mission creates a vibrant synergy with ground-based observatories that has led to dramatically improved understanding of GRBs, especially for short bursts. This video is public domain and can be downloaded at: <a href="http://svs.gsfc.nasa.gov/vis/a010000/a011500/a011530/index.html" rel="nofollow">svs.gsfc.nasa.gov/vis/a010000/a011500/a011530/index.html</a> <b><a href="http://www.nasa.gov/audience/formedia/features/MP_Photo_Guidelines.html" rel="nofollow">NASA image use policy.</a></b> <b><a href="http://www.nasa.gov/centers/goddard/home/index.html" rel="nofollow">NASA Goddard Space Flight Center</a></b> enables NASA’s mission through four scientific endeavors: Earth Science, Heliophysics, Solar System Exploration, and Astrophysics. Goddard plays a leading role in NASA’s accomplishments by contributing compelling scientific knowledge to advance the Agency’s mission. <b>Follow us on <a href="http://twitter.com/NASAGoddardPix" rel="nofollow">Twitter</a></b> <b>Like us on <a href="http://www.facebook.com/pages/Greenbelt-MD/NASA-Goddard/395013845897?ref=tsd" rel="nofollow">Facebook</a></b> <b>Find us on <a href="http://instagram.com/nasagoddard?vm=grid" rel="nofollow">Instagram</a></b>

Simulation frames from this NASA Goddard neutron star merger animation: <a href="http://bit.ly/1jolBYY" rel="nofollow">bit.ly/1jolBYY</a> Credit: NASA's Goddard Space Flight Center This supercomputer simulation shows one of the most violent events in the universe: a pair of neutron stars colliding, merging and forming a black hole. A neutron star is the compressed core left behind when a star born with between eight and 30 times the sun's mass explodes as a supernova. Neutron stars pack about 1.5 times the mass of the sun — equivalent to about half a million Earths — into a ball just 12 miles (20 km) across. As the simulation begins, we view an unequally matched pair of neutron stars weighing 1.4 and 1.7 solar masses. They are separated by only about 11 miles, slightly less distance than their own diameters. Redder colors show regions of progressively lower density. As the stars spiral toward each other, intense tides begin to deform them, possibly cracking their crusts. Neutron stars possess incredible density, but their surfaces are comparatively thin, with densities about a million times greater than gold. Their interiors crush matter to a much greater degree densities rise by 100 million times in their centers. To begin to imagine such mind-boggling densities, consider that a cubic centimeter of neutron star matter outweighs Mount Everest. By 7 milliseconds, tidal forces overwhelm and shatter the lesser star. Its superdense contents erupt into the system and curl a spiral arm of incredibly hot material. At 13 milliseconds, the more massive star has accumulated too much mass to support it against gravity and collapses, and a new black hole is born. The black hole's event horizon — its point of no return — is shown by the gray sphere. While most of the matter from both neutron stars will fall into the black hole, some of the less dense, faster moving matter manages to orbit around it, quickly forming a large and rapidly rotating torus. This torus extends for about 124 miles (200 km) and contains the equivalent of 1/5th the mass of our sun. Scientists think neutron star mergers like this produce short gamma-ray bursts (GRBs). Short GRBs last less than two seconds yet unleash as much energy as all the stars in our galaxy produce over one year. The rapidly fading afterglow of these explosions presents a challenge to astronomers. A key element in understanding GRBs is getting instruments on large ground-based telescopes to capture afterglows as soon as possible after the burst. The rapid notification and accurate positions provided by NASA's Swift mission creates a vibrant synergy with ground-based observatories that has led to dramatically improved understanding of GRBs, especially for short bursts. This video is public domain and can be downloaded at: <a href="http://svs.gsfc.nasa.gov/vis/a010000/a011500/a011530/index.html" rel="nofollow">svs.gsfc.nasa.gov/vis/a010000/a011500/a011530/index.html</a> <b><a href="http://www.nasa.gov/audience/formedia/features/MP_Photo_Guidelines.html" rel="nofollow">NASA image use policy.</a></b> <b><a href="http://www.nasa.gov/centers/goddard/home/index.html" rel="nofollow">NASA Goddard Space Flight Center</a></b> enables NASA’s mission through four scientific endeavors: Earth Science, Heliophysics, Solar System Exploration, and Astrophysics. Goddard plays a leading role in NASA’s accomplishments by contributing compelling scientific knowledge to advance the Agency’s mission. <b>Follow us on <a href="http://twitter.com/NASAGoddardPix" rel="nofollow">Twitter</a></b> <b>Like us on <a href="http://www.facebook.com/pages/Greenbelt-MD/NASA-Goddard/395013845897?ref=tsd" rel="nofollow">Facebook</a></b> <b>Find us on <a href="http://instagram.com/nasagoddard?vm=grid" rel="nofollow">Instagram</a></b>

This image depicts a vast canyon of dust and gas in the Orion Nebula from a 3-D computer model based on observations by NASA's Hubble Space Telescope and created by science visualization specialists at the Space Telescope Science Institute (STScI) in Baltimore, Md. A 3-D visualization of this model takes viewers on an amazing four-minute voyage through the 15-light-year-wide canyon. Credit: NASA, G. Bacon, L. Frattare, Z. Levay, and F. Summers (STScI/AURA) Go here to learn more about Hubble 3D: <a href="http://www.nasa.gov/topics/universe/features/hubble_imax_premiere.html" rel="nofollow">www.nasa.gov/topics/universe/features/hubble_imax_premier...</a> or <a href="http://www.imax.com/hubble/" rel="nofollow">www.imax.com/hubble/</a> Take an exhilarating ride through the Orion Nebula, a vast star-making factory 1,500 light-years away. Swoop through Orion's giant canyon of gas and dust. Fly past behemoth stars whose brilliant light illuminates and energizes the entire cloudy region. Zoom by dusty tadpole-shaped objects that are fledgling solar systems. This virtual space journey isn't the latest video game but one of several groundbreaking astronomy visualizations created by specialists at the Space Telescope Science Institute (STScI) in Baltimore, the science operations center for NASA's Hubble Space Telescope. The cinematic space odysseys are part of the new Imax film "Hubble 3D," which opens today at select Imax theaters worldwide. The 43-minute movie chronicles the 20-year life of Hubble and includes highlights from the May 2009 servicing mission to the Earth-orbiting observatory, with footage taken by the astronauts. The giant-screen film showcases some of Hubble's breathtaking iconic pictures, such as the Eagle Nebula's "Pillars of Creation," as well as stunning views taken by the newly installed Wide Field Camera 3. While Hubble pictures of celestial objects are awe-inspiring, they are flat 2-D photographs. For this film, those 2-D images have been converted into 3-D environments, giving the audience the impression they are space travelers taking a tour of Hubble's most popular targets. "A large-format movie is a truly immersive experience," says Frank Summers, an STScI astronomer and science visualization specialist who led the team that developed the movie visualizations. The team labored for nine months, working on four visualization sequences that comprise about 12 minutes of the movie. "Seeing these Hubble images in 3-D, you feel like you are flying through space and not just looking at picture postcards," Summers continued. "The spacescapes are all based on Hubble images and data, though some artistic license is necessary to produce the full depth of field needed for 3-D." The most ambitious sequence is a four-minute voyage through the Orion Nebula's gas-and-dust canyon, about 15 light-years across. During the ride, viewers will see bright and dark, gaseous clouds; thousands of stars, including a grouping of bright, hefty stars called the Trapezium; and embryonic planetary systems. The tour ends with a detailed look at a young circumstellar disk, which is much like the structure from which our solar system formed 4.5 billion years ago. Based on a Hubble image of Orion released in 2006, the visualization was a collaborative effort between science visualization specialists at STScI, including Greg Bacon, who sculpted the Orion Nebula digital model, with input from STScI astronomer Massimo Roberto; the National Center for Supercomputing Applications at the University of Illinois at Urbana-Champaign; and the Spitzer Science Center at the California Institute of Technology in Pasadena. For some of the sequences, STScI imaging specialists developed new techniques for transforming the 2-D Hubble images into 3-D. STScI image processing specialists Lisa Frattare and Zolt Levay, for example, created methods of splitting a giant gaseous pillar in the Carina Nebula into multiple layers to produce a 3-D effect, giving the structure depth. The Carina Nebula is a nursery for baby stars. Frattare painstakingly removed the thousands of stars in the image so that Levay could separate the gaseous layers on the isolated Carina pillar. Frattare then replaced the stars into both foreground and background layers to complete the 3-D model. For added effect, the same separation was done for both visible and infrared Hubble images, allowing the film to cross-fade between wavelength views in 3-D. In another sequence viewers fly into a field of 170,000 stars in the giant star cluster Omega Centauri. STScI astronomer Jay Anderson used his stellar database to create a synthetic star field in 3-D that matches recent razor-sharp Hubble photos. The film's final four-minute sequence takes viewers on a voyage from our Milky Way Galaxy past many of Hubble's best galaxy shots and deep into space. Some 15,000 galaxies from Hubble's deepest surveys stretch billions of light-years across the universe in a 3-D sequence created by STScI astronomers and visualizers. The view dissolves into a cobweb that traces the universe's large-scale structure, the backbone from which galaxies were born. In addition to creating visualizations, STScI's education group also provided guidance on the "Hubble 3D" Educator Guide, which includes standards-based lesson plans and activities about Hubble and its mission. Students will use the guide before or after seeing the movie. "The guide will enhance the movie experience for students and extend the movie into classrooms," says Bonnie Eisenhamer, STScI's Hubble Formal Education manager. The Hubble Space Telescope is a project of international cooperation between NASA and the European Space Agency (ESA) and is managed by NASA’s Goddard Space Flight Center (GSFC) in Greenbelt, Md. The Space Telescope Science Institute (STScI) conducts Hubble science operations. The institute is operated for NASA by the Association of Universities for Research in Astronomy, Inc., Washington, D.C.