Supertyphoon Pongsona isotherms as it hit the island of Guam, December of 2002, from the Atmospheric Infrared Sounder AIRS on NASA Aqua satellite.
This image was made from data acquired by the Atmospheric Infrared Sounding System AIRS instrument suite aboard NASA Aqua spacecraft in December, 2002, just as the eye of Supertyphoon Pongsona was about to pass over Guam. http://photojournal.jpl.nasa.gov/catalog/PIA00367
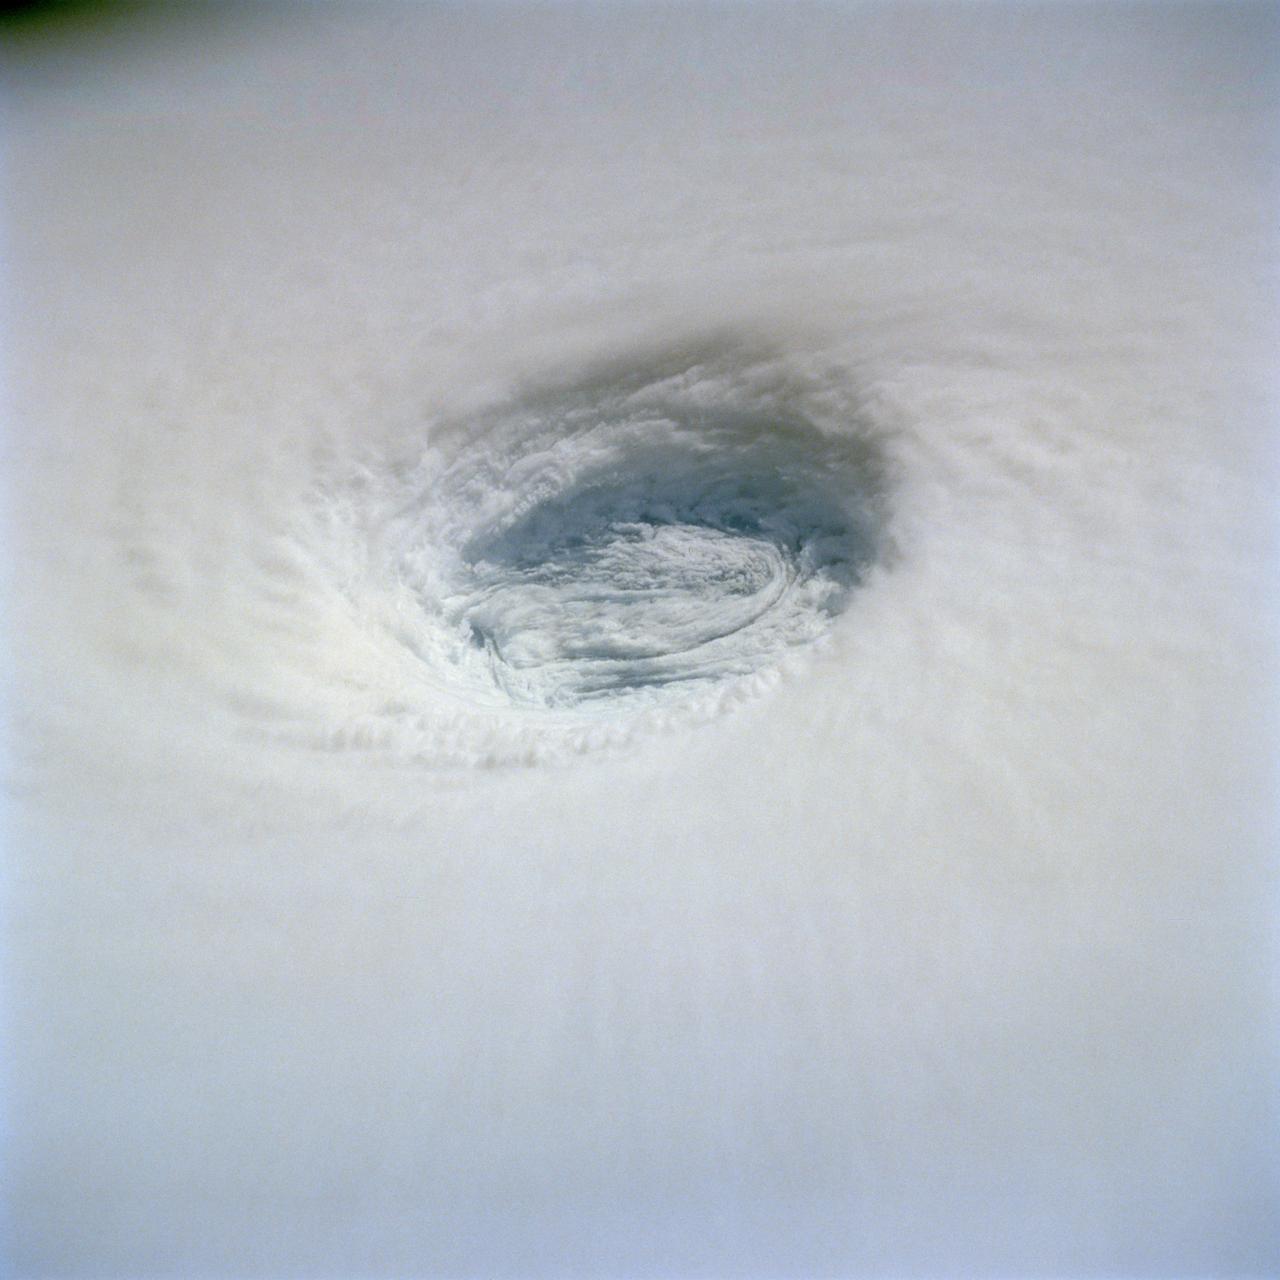
This detailed view of the eye of Supertyphoon Yuri (19.0N, 140.0E) shows the bowl shaped structure of the eye wall. The eye cylinder descends almost to the ocean surface, some 45,000 to 50,000 ft. In this case, the eye is filled with clouds but in most cases, the cylinder is at least partially clear so that the sea surface is visible. The storm at this time was at it's most intense with maximum sustained winds of 165 mph and gusting to 200 mph.
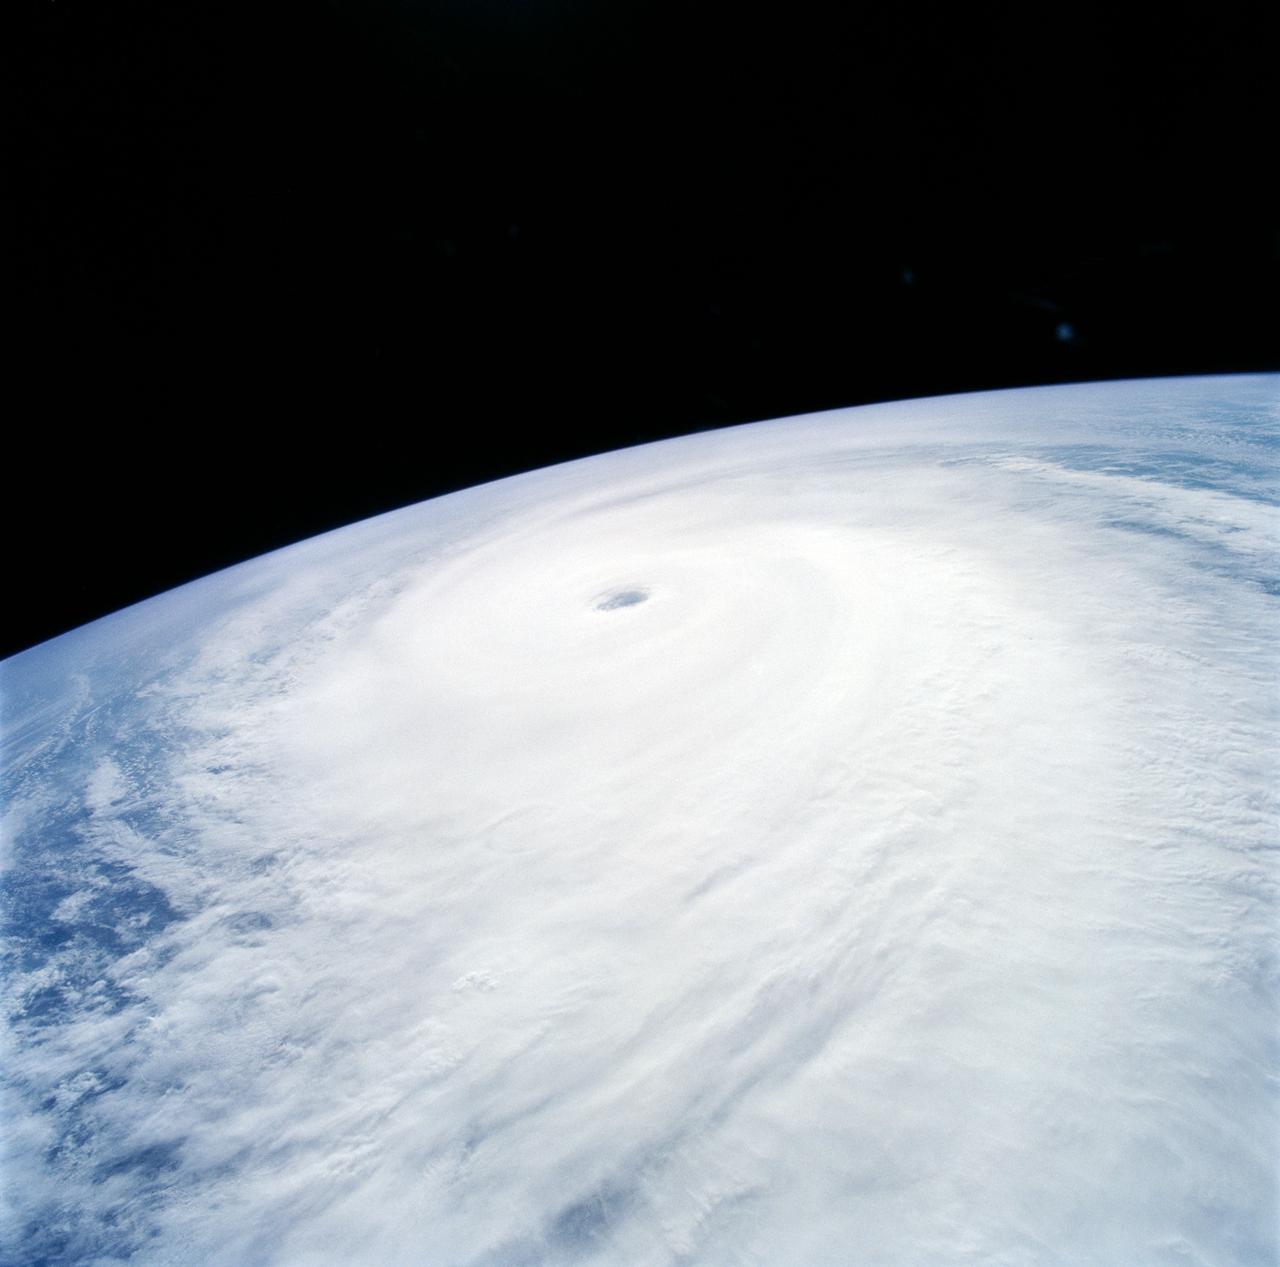
Supertyphoon Yuri began development approximately 1000 miles east of the Philippine Islands. At the time this photo was taken, Yuri was about 1000 nautical miles in diameter and had estimated maximum sustained wind speeds of 145 mph, gusting to 170 mph. This oblique view shows the well formed eye of Yuri and the raised segment of clouds at the cusp of the eye indicating very high wind speeds within the vortex.
NASA image captured Oct. 18, 2010 at 02:35 UTC Typhoon Megi (15W) over the Philippines. The Moderate Resolution Imaging Spectroradiometer (MODIS) on NASA’s Terra satellite at 10:35 a.m. Philippine Time (02:35 UTC) on October 18, 2010. Megi was bearing down on Palanan Bay as a “super typhoon” with category 5 strength on the Saffir Simpson scale. Image Credit: NASA Goddard MODIS Rapid Response Team To learn more go to: <a href="http://www.nasa.gov/mission_pages/hurricanes/archives/2010/h2010_Megi.html" rel="nofollow">www.nasa.gov/mission_pages/hurricanes/archives/2010/h2010...</a> <b><a href="http://www.nasa.gov/centers/goddard/home/index.html" rel="nofollow">NASA Goddard Space Flight Center</a></b> enables NASA’s mission through four scientific endeavors: Earth Science, Heliophysics, Solar System Exploration, and Astrophysics. Goddard plays a leading role in NASA’s accomplishments by contributing compelling scientific knowledge to advance the Agency’s mission. <b>Follow us on <a href="http://twitter.com/NASA_GoddardPix" rel="nofollow">Twitter</a></b> <b>Join us on <a href="http://www.facebook.com/pages/Greenbelt-MD/NASA-Goddard/395013845897?ref=tsd" rel="nofollow">Facebook</a></b>

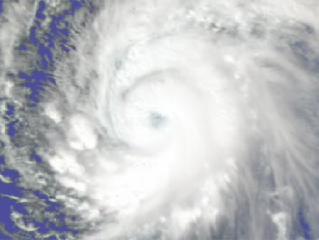
STS085-722-019 (15 August 1997) --- This view of supertyphoon Winnie was taken on August 15, 1997, as the storm swirled about 400 miles south of the southern tip of Japan. Sustained winds were 105 knots, gusting to 130 knots. This photo was shot on the Space Shuttle Discovery's twenty-third flight, as it glided by 170 miles above the sea surface on Orbit 123. On one pass the Discovery flew right over the eye; the commander commented that the eye was so large that it completely filled the window. The robotic arm crosses the top of the view. The cloud mass associated with Winnie covered thousands of square miles as this storm grew to supertyphoon status in the previous days, and raked across the Marianas Islands. A few days after this shot was taken, Winnie ploughed ashore on the coast of China, a bit south of the major metropolis of Shanghai, reportedly killing at least 100 people.

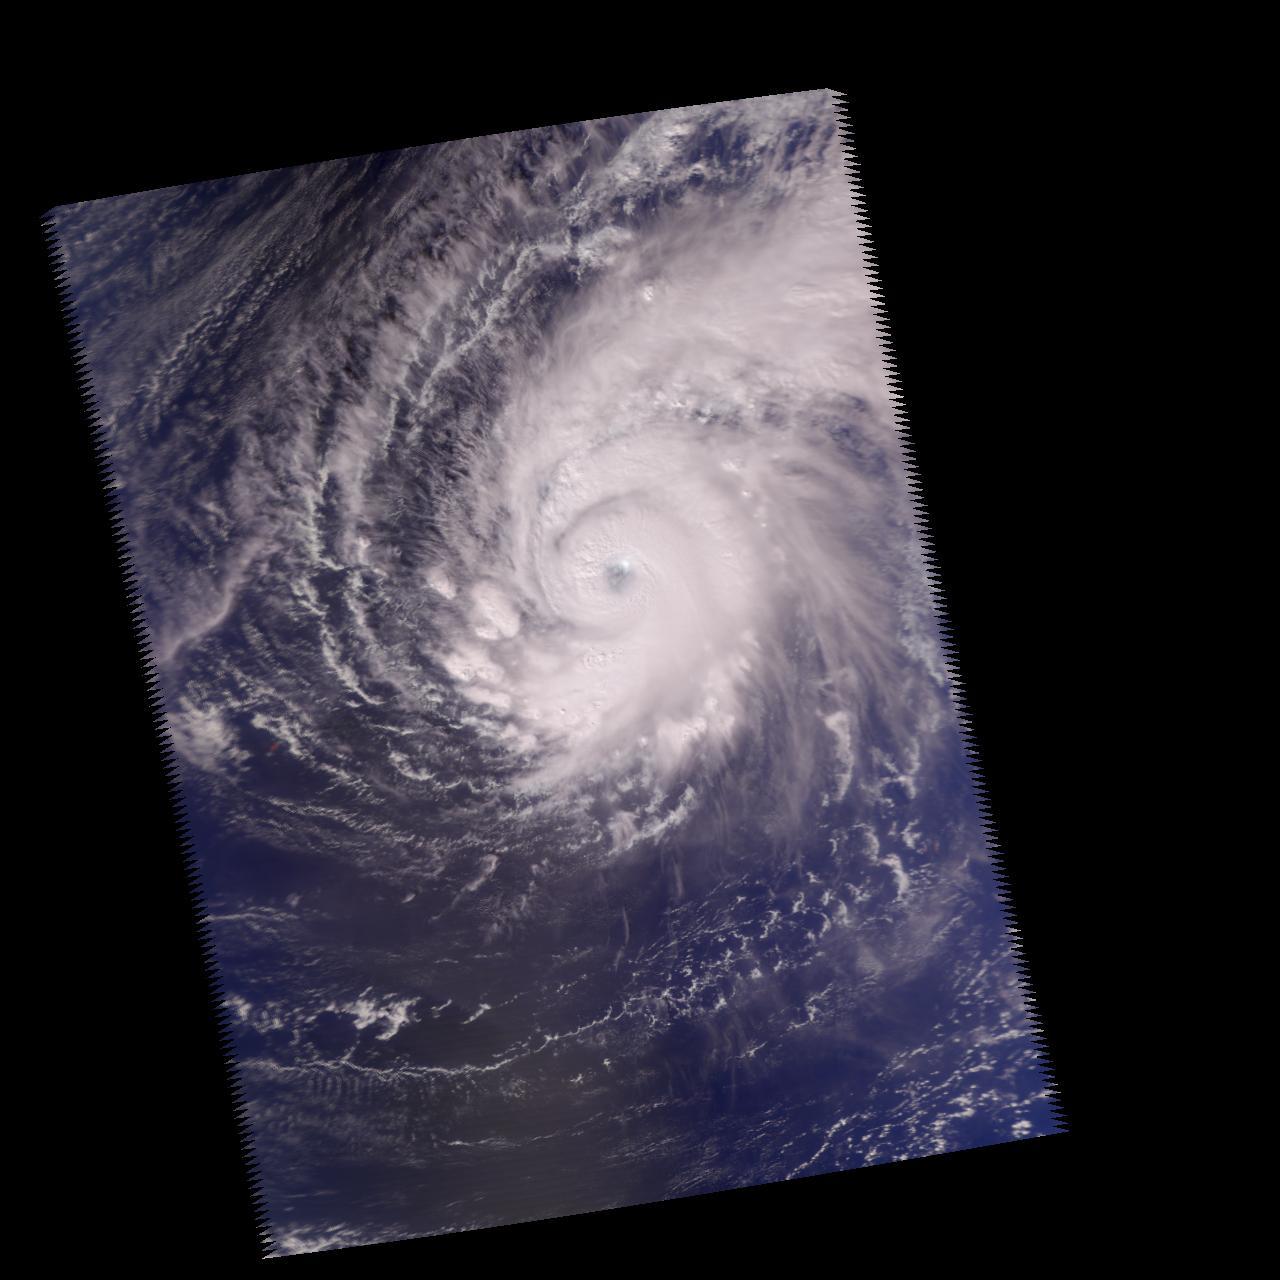
NASA's Aqua satellite and RapidScat instrument analyzed Super typhoon Soudelor's extent and winds as it reached Category Five typhoon status on the Saffir-Simpson Wind Scale. On Aug. 4, 2015, at 4:10 UTC (12:10 a.m. EDT) the MODIS instrument aboard NASA's Aqua satellite captured this visible-light image of Super typhoon Soudelor. Read more: <a href="http://www.nasa.gov/feature/goddard/2015/soudelor-northwestern-pacific-ocean" rel="nofollow">www.nasa.gov/feature/goddard/2015/soudelor-northwestern-p...</a> Credits: NASA Goddard's MODIS Rapid Response Team
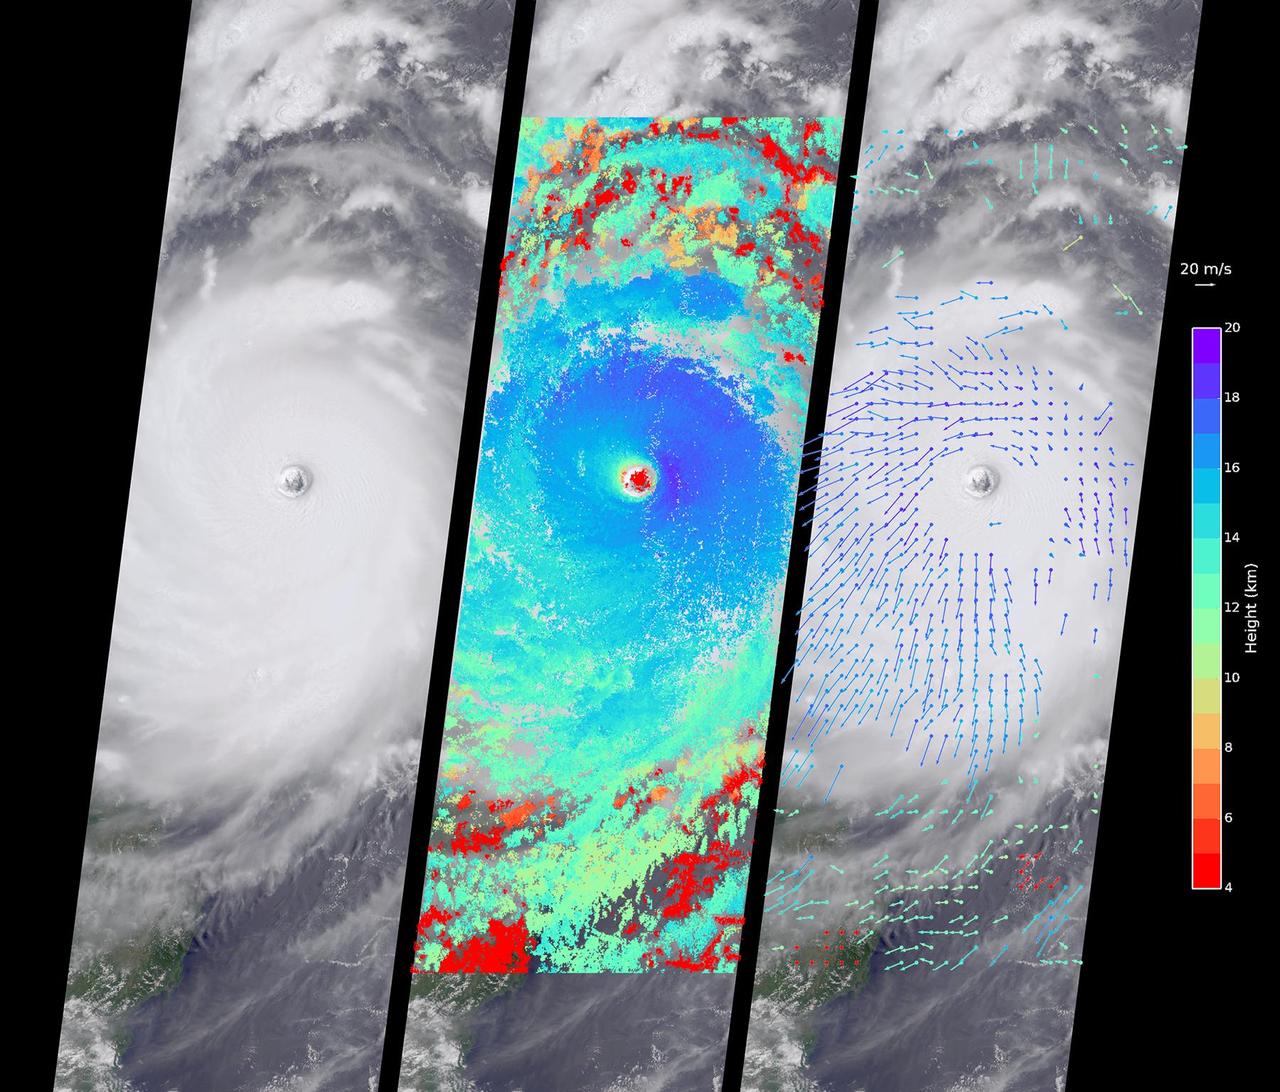
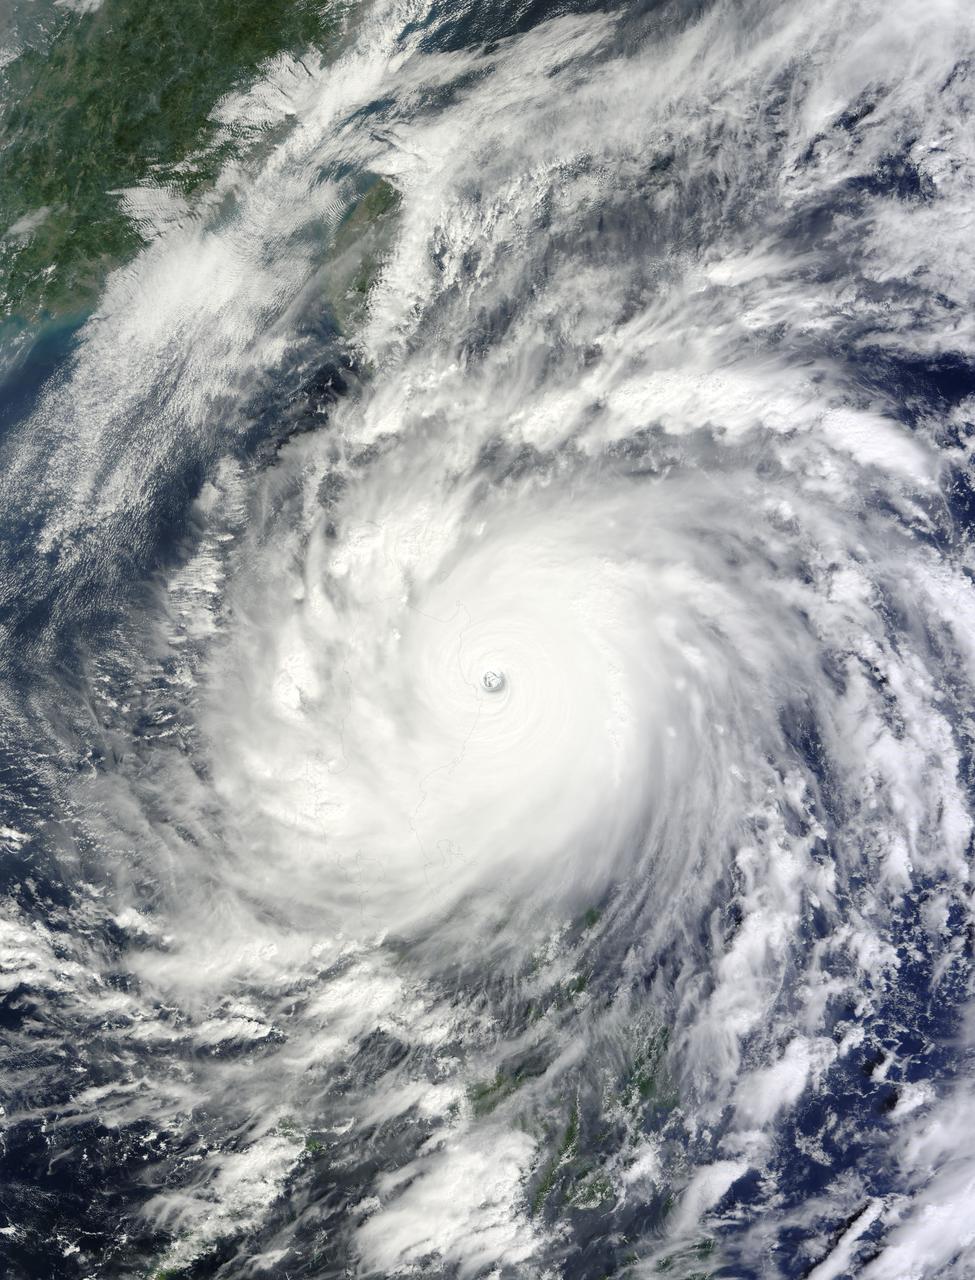
Typhoon Nepartak, the first large typhoon in the northwest Pacific this season, is currently taking aim at the east coast of Taiwan. Over the past few days, Nepartak has rapidly gained strength, growing from a tropical storm to the equivalent of a Category 5 hurricane with sustained wind speeds of more than 160 miles (258 kilometers) per hour. Taiwan's Central Weather Bureau has issued a torrential rain warning, bracing for likely flooding as 5 to 15 inches (13 to 38 centimeters) of rain are expected to fall over Taiwan during the storm's passage. Waves of up to 40 feet (12 meters) are predicted on the coast as the typhoon approaches, and air and train travel have been severely impacted. The typhoon is currently moving at about 10 miles per hour (16 kilometers) to the west-northwest, and is predicted to pass over Taiwan within the next day and then hit the coast of mainland China. Central and eastern China are poorly situated to absorb the rainfall from Nepartak after suffering the effects of severe monsoon flooding, which has killed at least 140 people in the past week. The Multi-angle Imaging SpectroRadiometer (MISR) instrument aboard NASA's Terra satellite captured this view of Typhoon Nepartak on July 7, 2016, at 10:30 a.m. local time (2:30 a.m. UTC). On the left is an image from the nadir (vertical pointing) camera, which shows the central portion of Nepartak and the storm's eye. The image is about 235 miles (378 kilometers) across. The island of Manila in the Philippines, about 250 miles (400 kilometers) south of Taiwan, is visible to the southwest of the eye. The image shows that Nepartak's center is extremely compact, rather than broken up into spiral bands as is more typical of typhoons. This means that the storm may retain more of its strength as it passes over land. MISR uses nine cameras to capture images of the typhoon from different angles. This provides a stereographic view, which can be used to determine the height of the storm's cloud tops. These heights are plotted in the middle panel, superimposed on the image. This shows that the cloud tops are relatively low, about 2.5 miles (4 kilometers), in the eye, but much higher, up to 12.5 miles (20 kilometers), just outside it. By tracking the motion of clouds as they are viewed by each of the nine cameras over about seven minutes, it is possible to also derive how fast the clouds are moving due to wind. These wind vectors are superimposed on the image in the right panel. The length of each arrow shows the wind speed at that location (compare to the 45 miles per hour or 20 meters per second arrow in the legend), and the color shows the height at which the wind is being computed. The motion of the low-level winds (red and yellow arrows) is counterclockwise, while the motion of the high winds (blue and purple arrows) is mostly clockwise. This is because hurricanes draw in warm, moist air at low altitudes, which then flows upward around the eye, releases its moisture as rain, and moves outward at high altitudes. As is typical of these types of storm systems, the inflowing low winds and the outflowing high winds spin in different directions. http://photojournal.jpl.nasa.gov/catalog/PIA20719