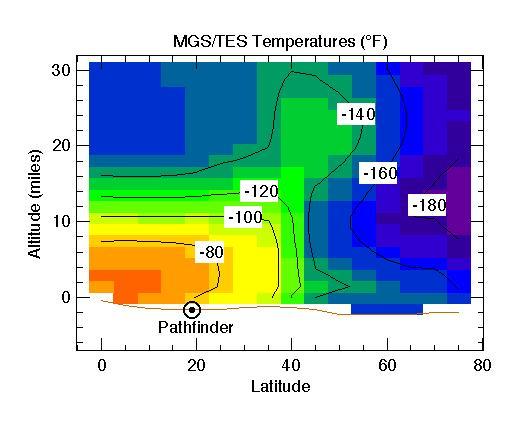
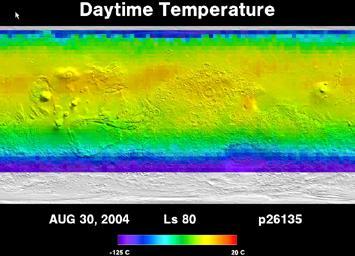
MGS/TES Temperatures
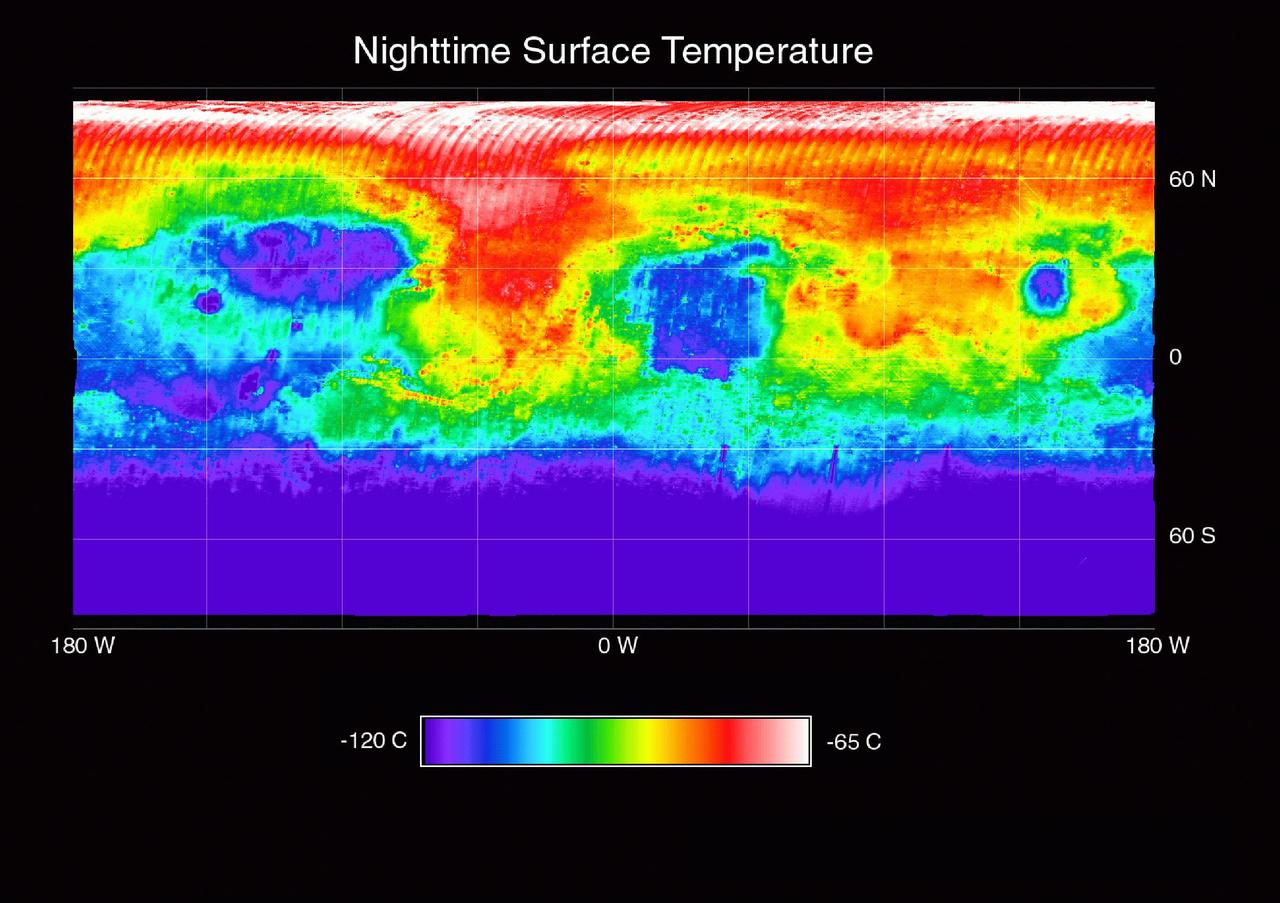
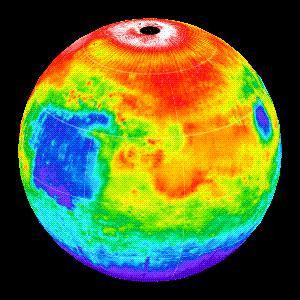
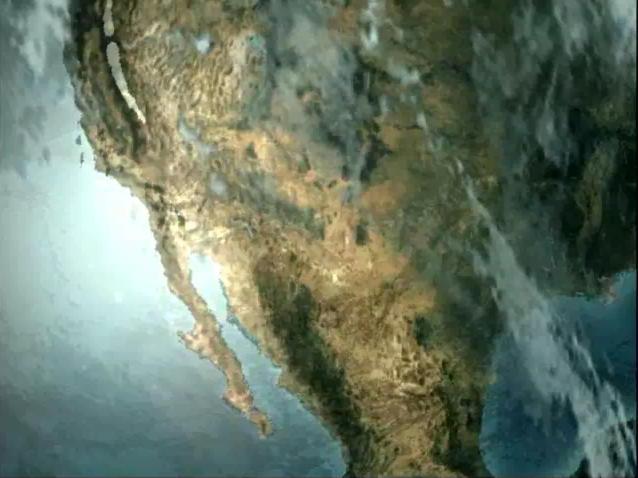
Temperature of the Martian Surface
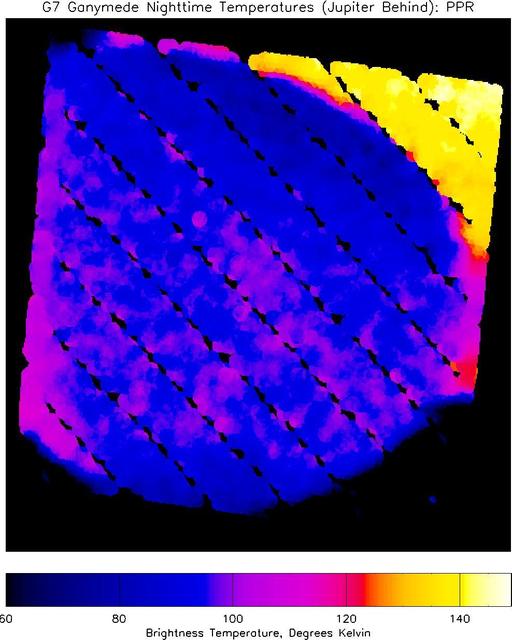
Nighttime Temperatures on Ganymede
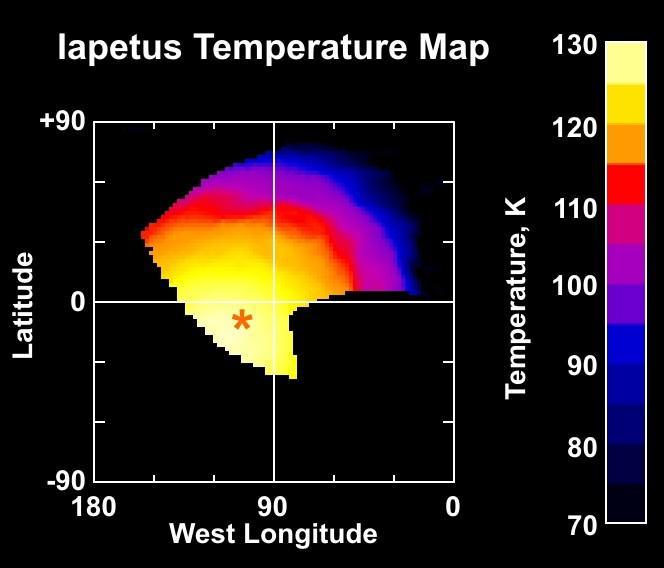
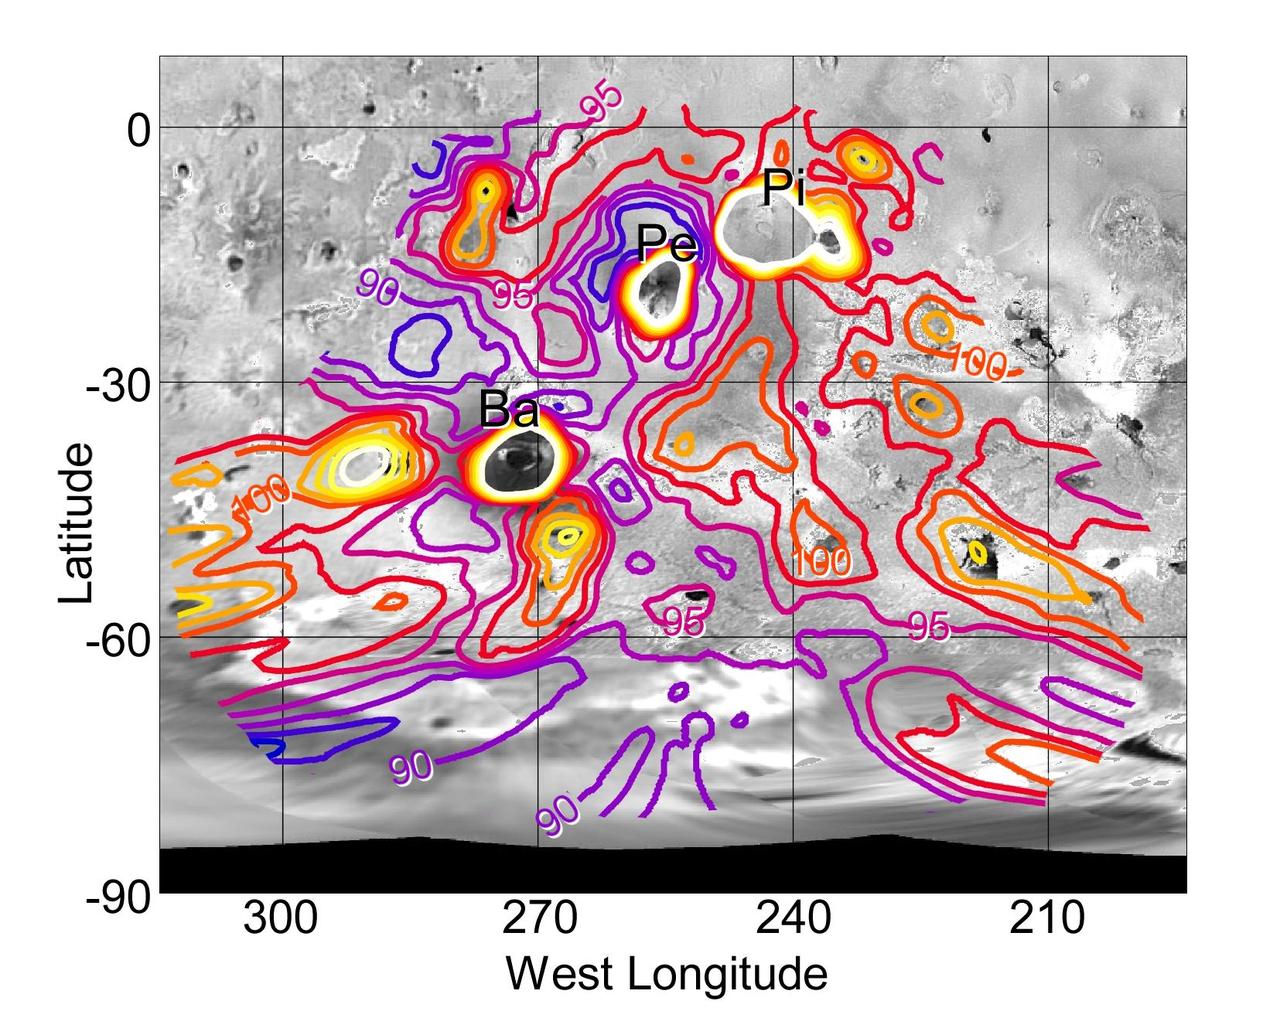
Iapetus Temperature Map
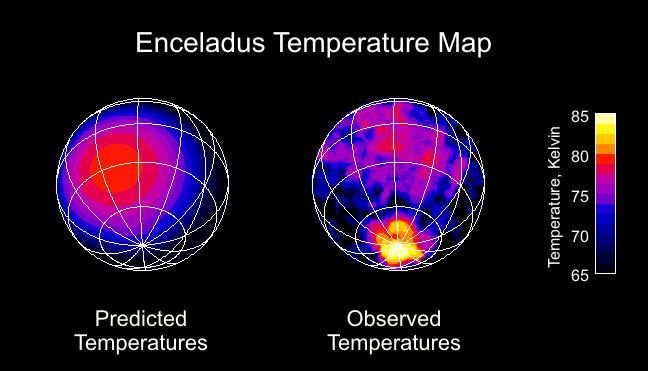
Enceladus Temperature Map
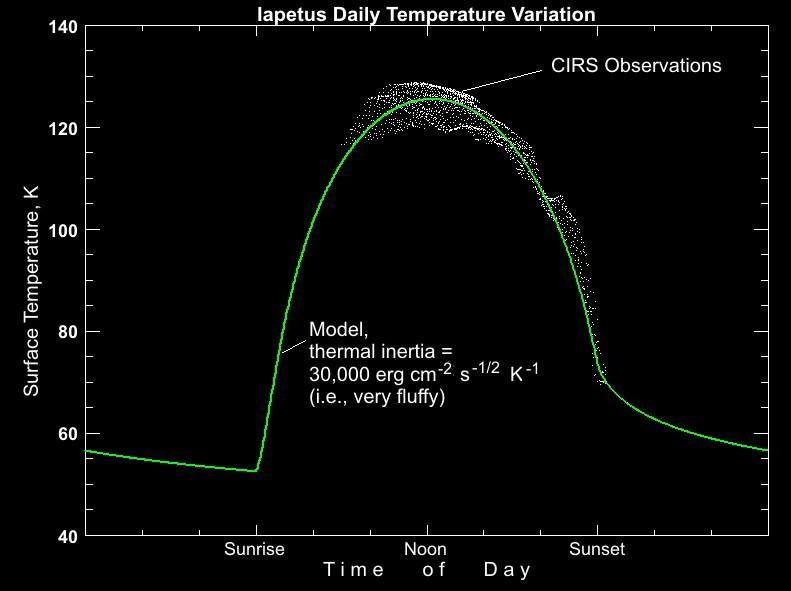
Iapetus Temperature Variation Map
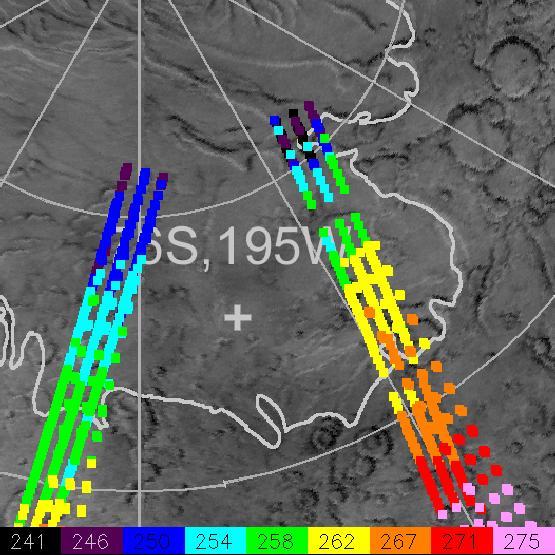
Nighttime Temperatures on Southern Io
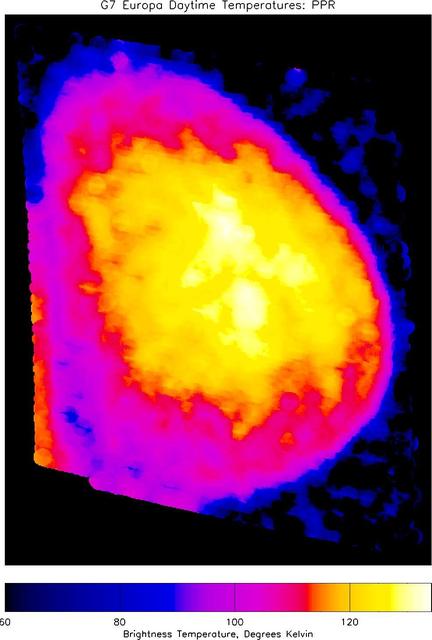
Daytime Temperatures on Europa
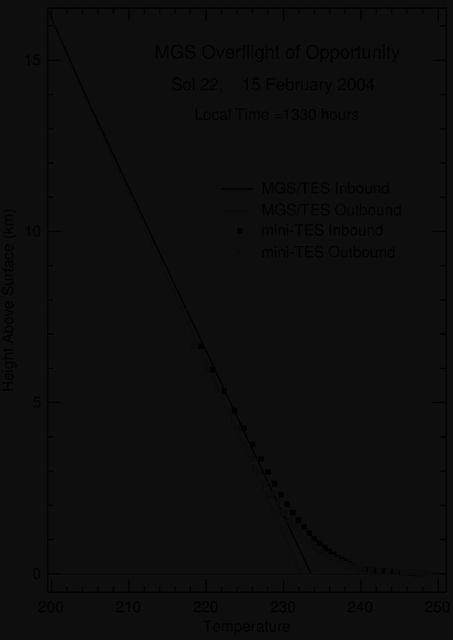
A Full Profile on Mars Temperature
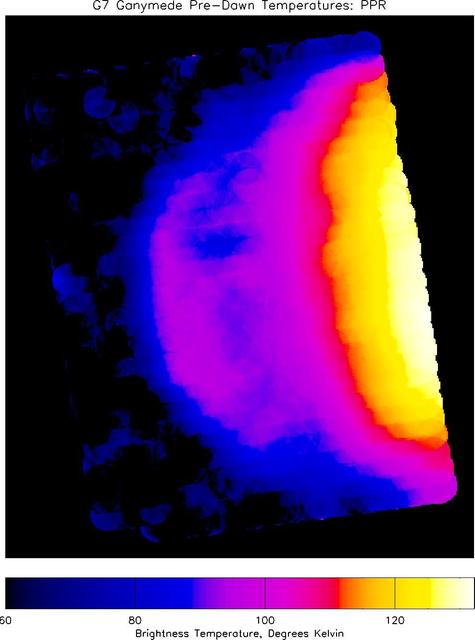
Pre-Dawn Temperatures on Ganymede
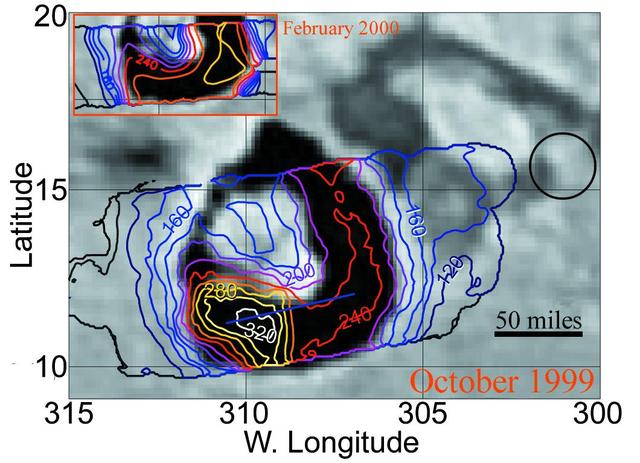
Temperature Comparison at Loki
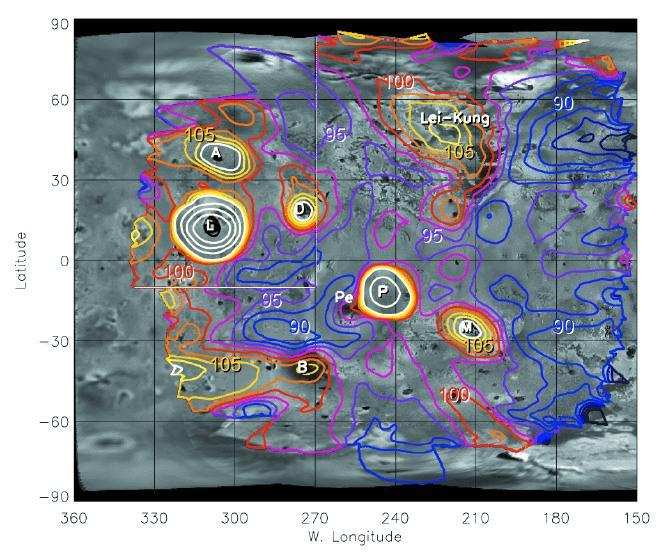
Temperature Map of Io Night Side
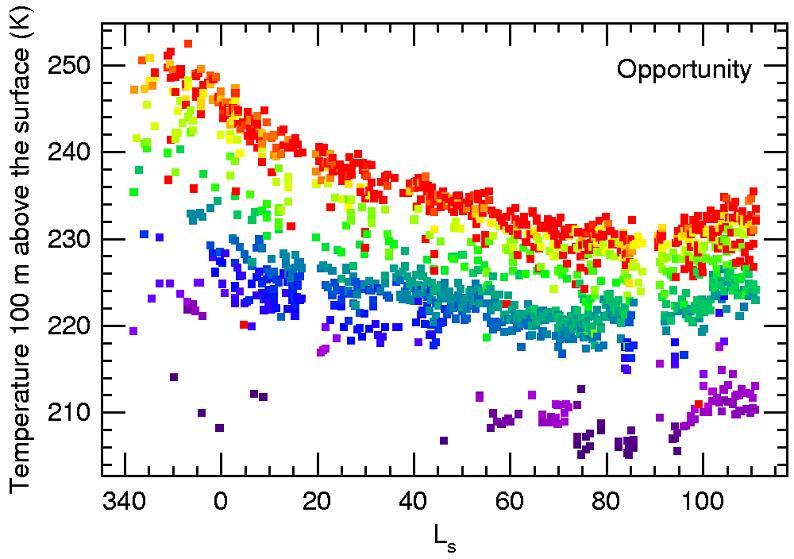
Seasonal Air Temperatures Above Opportunity

This is a Tempel 1 temperature map of the nucleus with different spatial resolutions from NASA Deep Impact mission. The color bar in the middle gives temperature in Kelvins. The sun is to the right in all images.
NASA Cassini spacecraft obtained shifting stratospheric temperatures. The difference between the temperatures from 2005-2008 is shown in the middle, with red indicating warming in the stratosphere and blue indicating cooling.

Galileo PPR Temperature Maps of Loki in October 1999
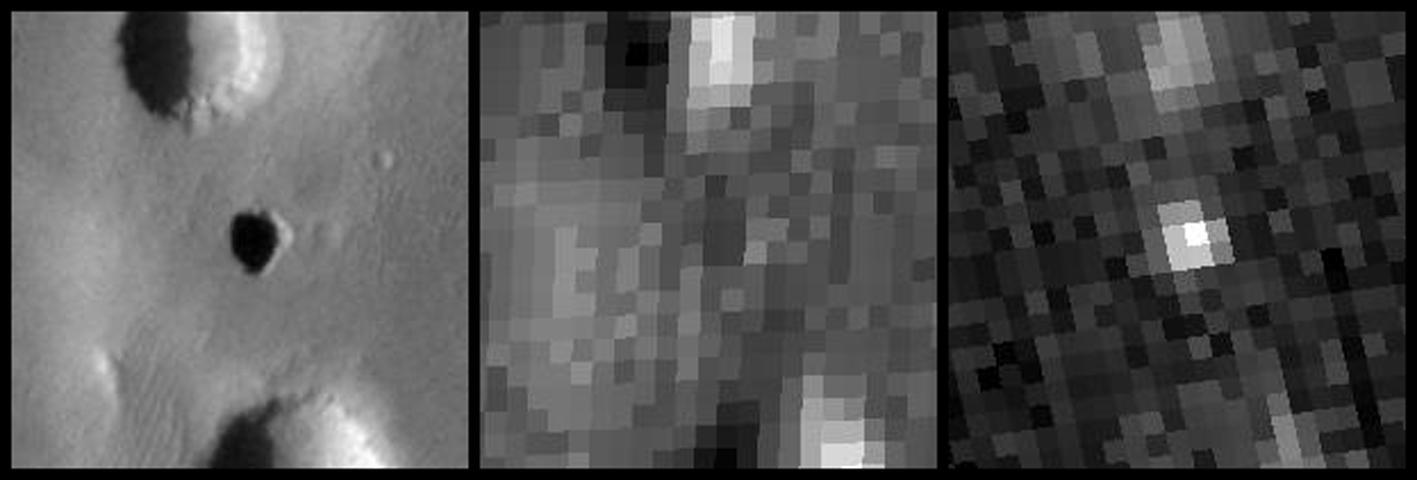
Temperature Behavior of Possible Cave Skylight on Mars
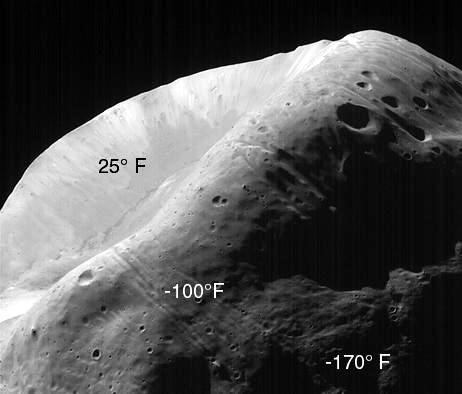
MOC Image of Phobos with TES Temperature Overlay
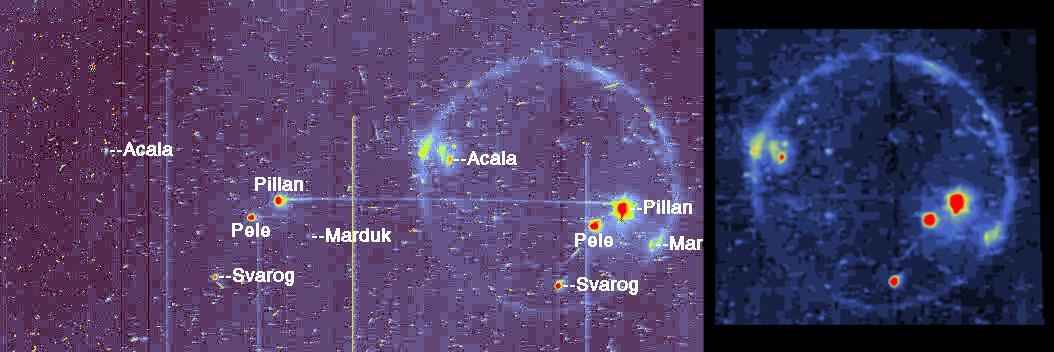
Io in Eclipse reveals High Temperature Hot Spots
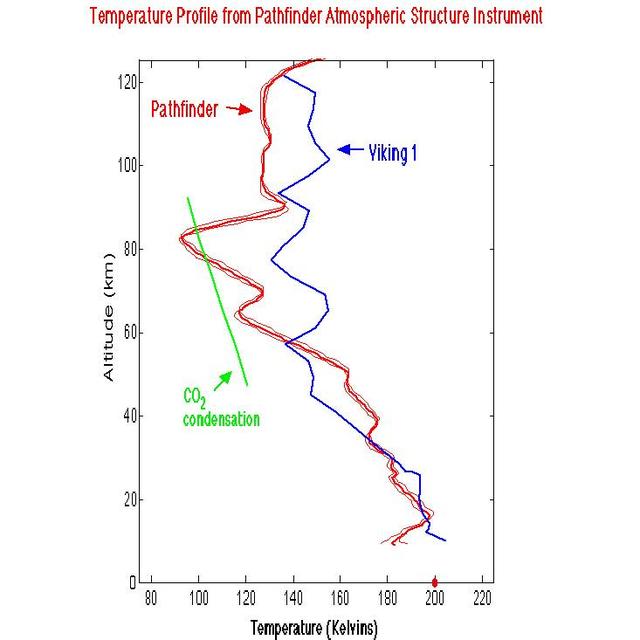
Temperature Profile from Pathfinder Atmospheric Structure Instrument
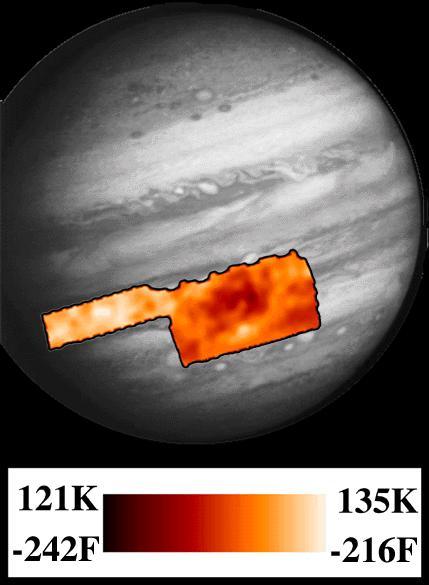
PPR Great Red Spot Temperature Map
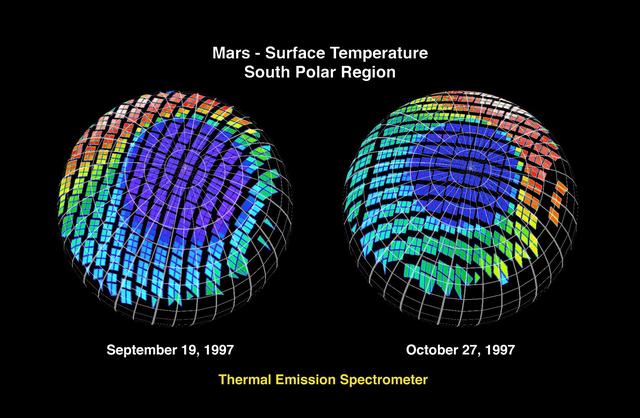
Mars - Surface Temperature South Polar Region
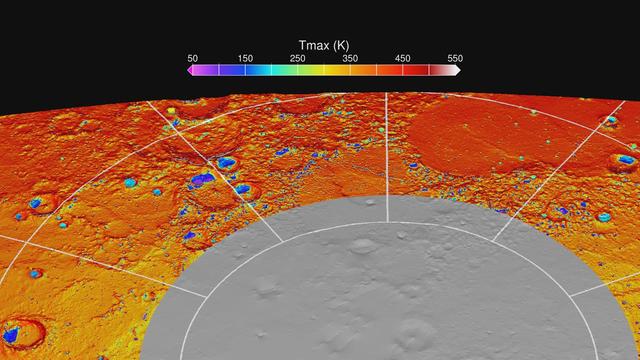
Maximum Surface Temperature near the North Pole
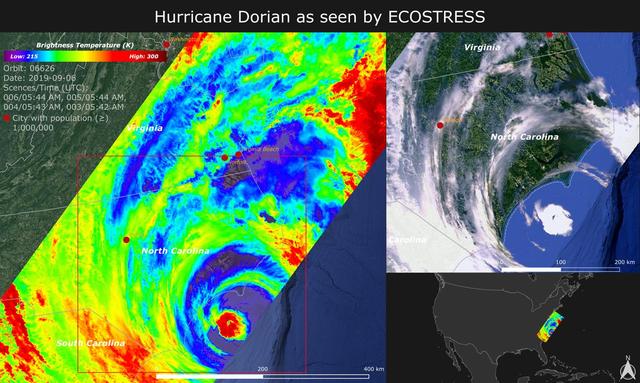
NASA's ECOsystem Spaceborne Thermal Radiometer Experiment on Space Station (ECOSTRESS) imaged the temperature of Hurricane Dorian from the International Space Station on Sept. 6, 2019 as the storm made landfall in North Carolina. ECOSTRESS senses the amount of emitted infrared radiation from Earth, which is converted into an equivalent temperature scale in units of degrees Kelvin. In the image, red colors such as the well-defined eye represent warmer temperatures while purple/blue represent the cooler cloud top temperatures of strong storm clouds with the potential of producing heavy rain. The temperature patterns reveal fine cloud structures that contribute to the formation of the larger hurricane. The width of the image (~400 km) is based on what ECOSTRESS sees as the Space Station flies over any given spot on Earth. ECOSTRESS launched to the space station in June 2018. It can measure variations in temperature to within a few tenths of a degree and is able to detect temperature changes at various times of day over areas as small as a football field. ECOSTRESS' primary mission is to detect plant health from space; however, its measurements can be used to detect other heat-related phenomena — including urban heat, fires, and volcanic activity — as well. Although disaster response is not one of its primary objectives, these highly detailed hurricane temperature estimates can be used to improve weather models. https://photojournal.jpl.nasa.gov/catalog/PIA23422

This chart plots the minimum daily atmospheric temperature measured by NASA Phoenix Mars Lander spacecraft since landing on Mars. As the temperature increased through the summer season, the atmospheric humidity also increased.
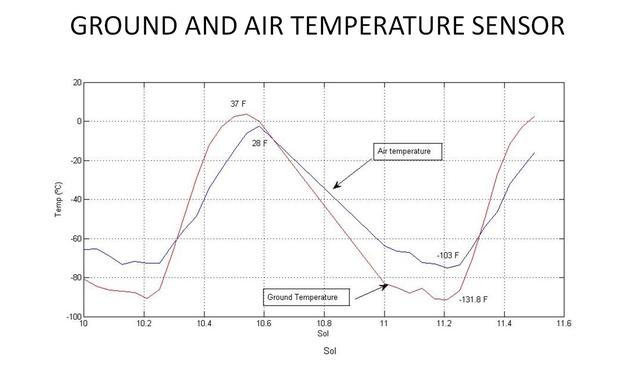
This graph shows the rise and fall of air and ground temperatures on Mars obtained by NASA Curiosity rover.

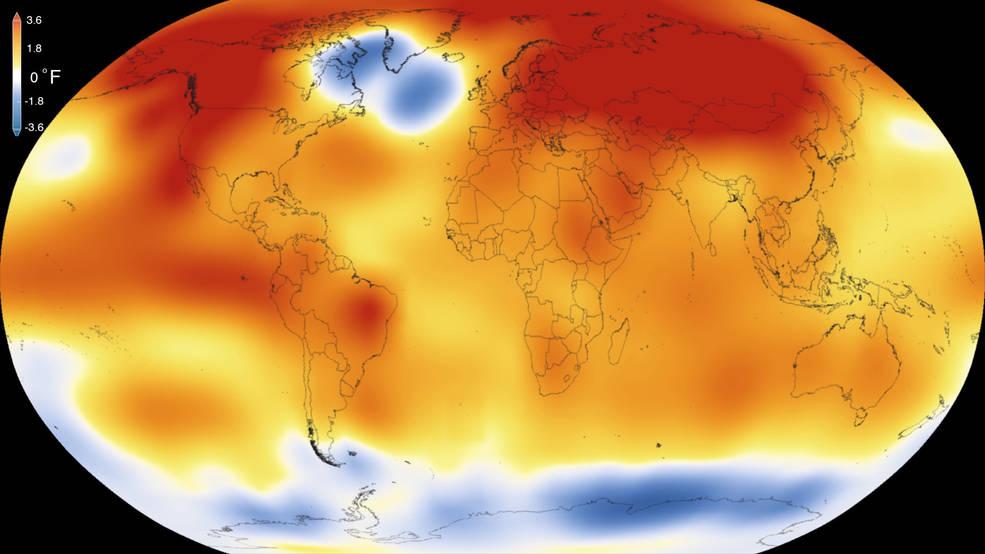
2015 was the warmest year since modern record-keeping began in 1880, according to a new analysis by NASA’s Goddard Institute for Space Studies. The record-breaking year continues a long-term warming trend — 15 of the 16 warmest years on record have now occurred since 2001. Credits: Scientific Visualization Studio/Goddard Space Flight Center Details: Earth’s 2015 surface temperatures were the warmest since modern record keeping began in 1880, according to independent analyses by NASA and the National Oceanic and Atmospheric Administration (NOAA). Globally-averaged temperatures in 2015 shattered the previous mark set in 2014 by 0.23 degrees Fahrenheit (0.13 Celsius). Only once before, in 1998, has the new record been greater than the old record by this much. The 2015 temperatures continue a long-term warming trend, according to analyses by scientists at NASA’s Goddard Institute for Space Studies (GISS) in New York (GISTEMP). NOAA scientists agreed with the finding that 2015 was the warmest year on record based on separate, independent analyses of the data. Because weather station locations and measurements change over time, there is some uncertainty in the individual values in the GISTEMP index. Taking this into account, NASA analysis estimates 2015 was the warmest year with 94 percent certainty. Read more: <a href="http://www.nasa.gov/press-release/nasa-noaa-analyses-reveal-record-shattering-global-warm-temperatures-in-2015" rel="nofollow">www.nasa.gov/press-release/nasa-noaa-analyses-reveal-reco...</a> <b><a href="http://www.nasa.gov/audience/formedia/features/MP_Photo_Guidelines.html" rel="nofollow">NASA image use policy.</a></b> <b><a href="http://www.nasa.gov/centers/goddard/home/index.html" rel="nofollow">NASA Goddard Space Flight Center</a></b> enables NASA’s mission through four scientific endeavors: Earth Science, Heliophysics, Solar System Exploration, and Astrophysics. Goddard plays a leading role in NASA’s accomplishments by contributing compelling scientific knowledge to advance the Agency’s mission. <b>Follow us on <a href="http://twitter.com/NASAGoddardPix" rel="nofollow">Twitter</a></b> <b>Like us on <a href="http://www.facebook.com/pages/Greenbelt-MD/NASA-Goddard/395013845897?ref=tsd" rel="nofollow">Facebook</a></b> <b>Find us on <a href="http://instagrid.me/nasagoddard/?vm=grid" rel="nofollow">Instagram</a></b>
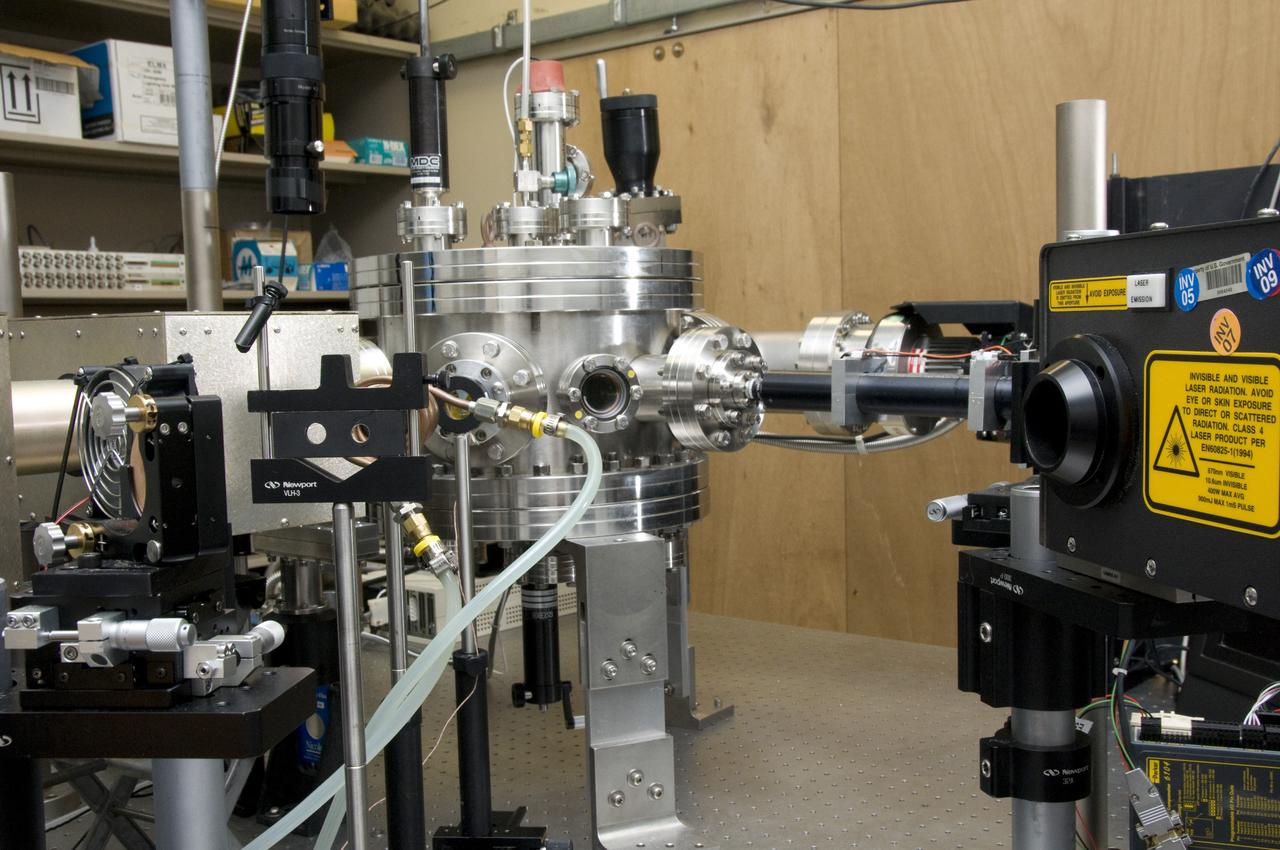
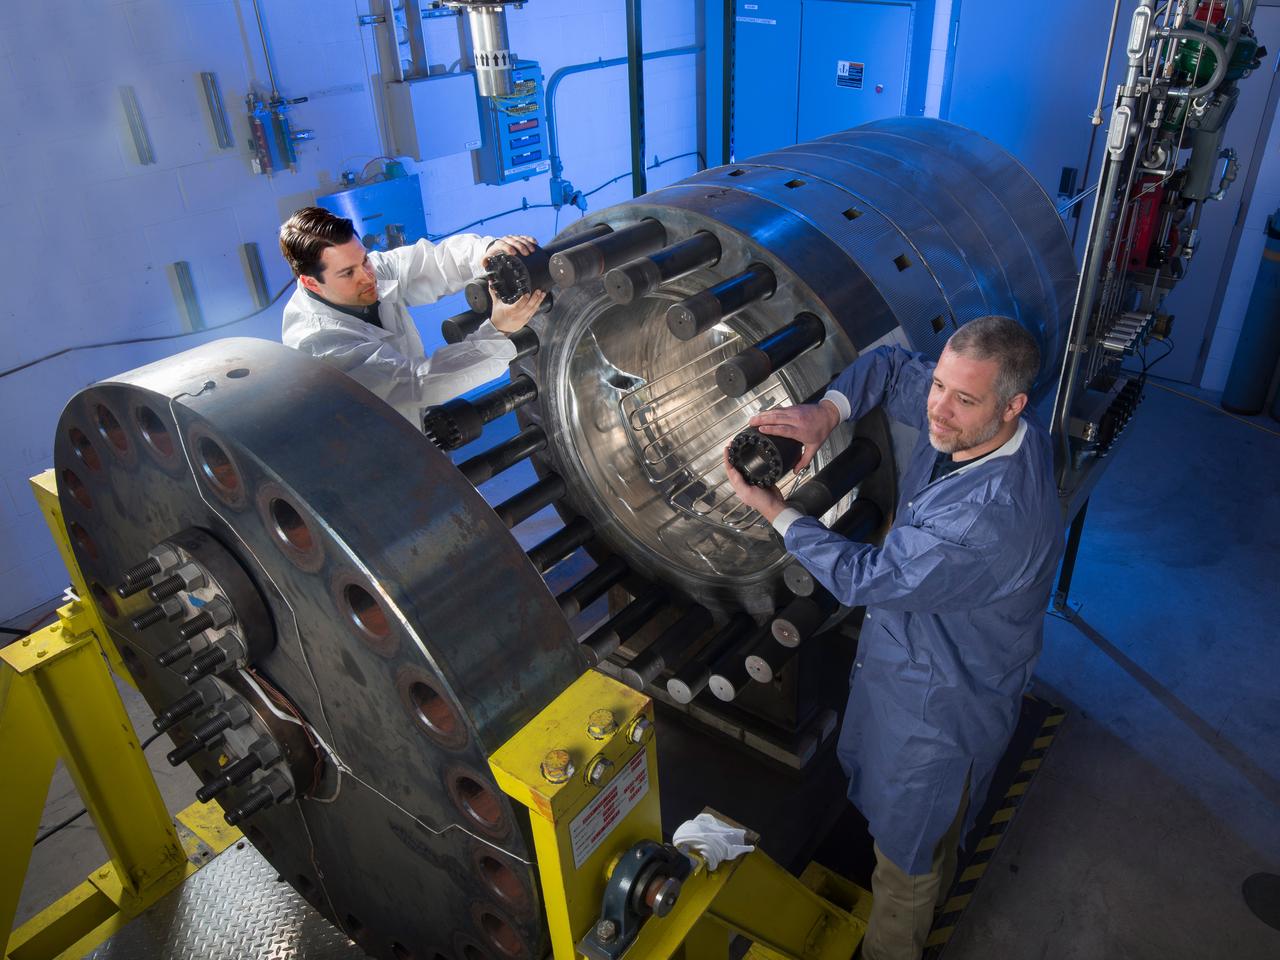
HIGH TEMPERATURE EMISSOMETER SYSTEM (HITEMS) CHAMBER
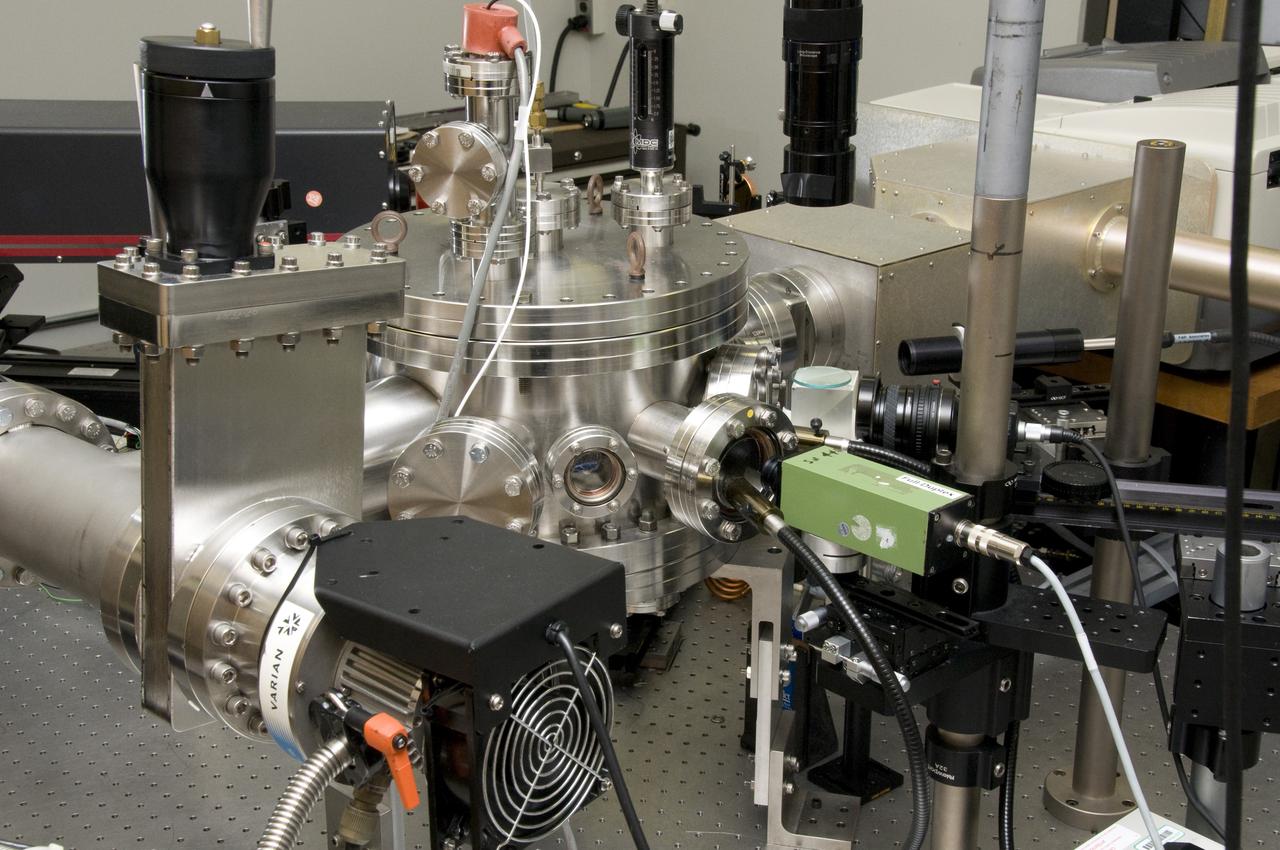
HIGH TEMPERATURE EMISSOMETER SYSTEM (HITEMS) CHAMBER
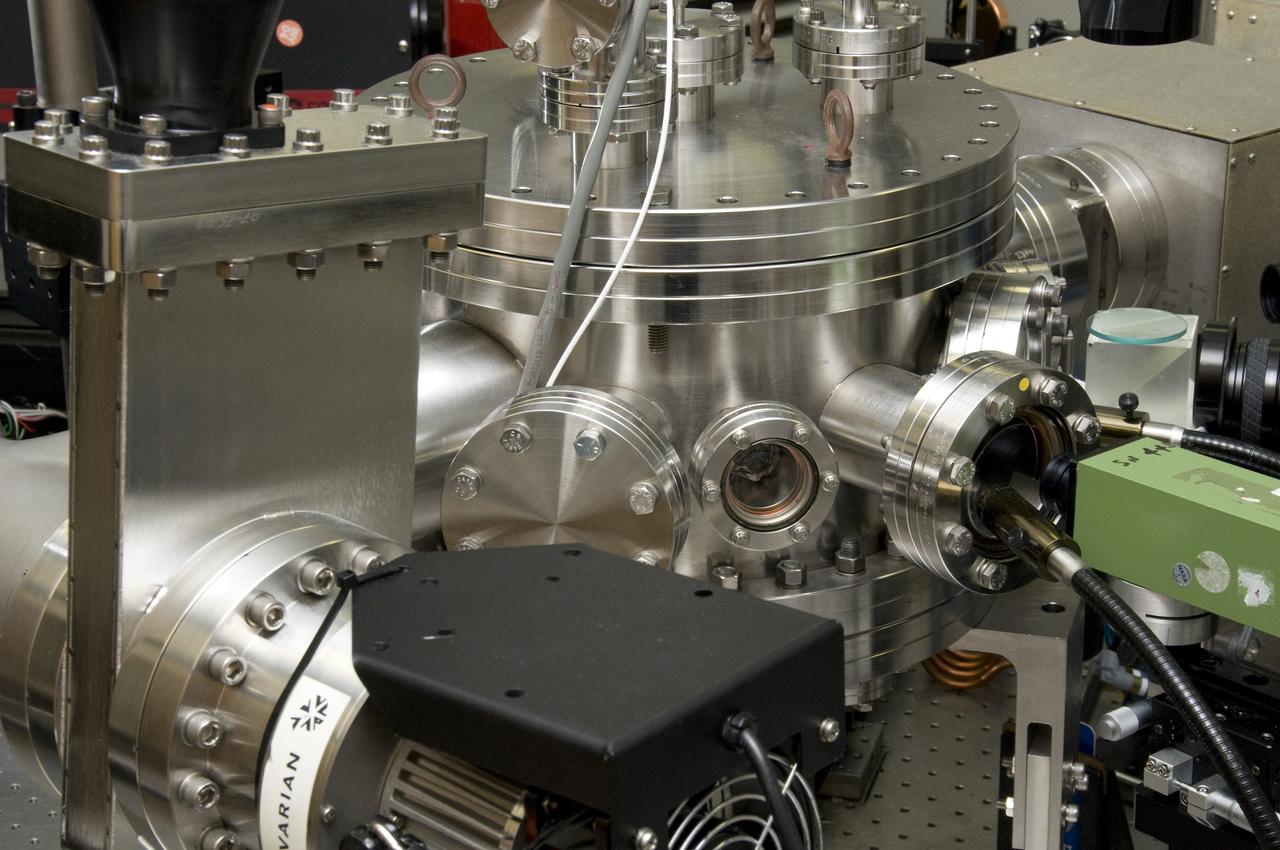
HIGH TEMPERATURE EMISSOMETER SYSTEM (HITEMS) CHAMBER
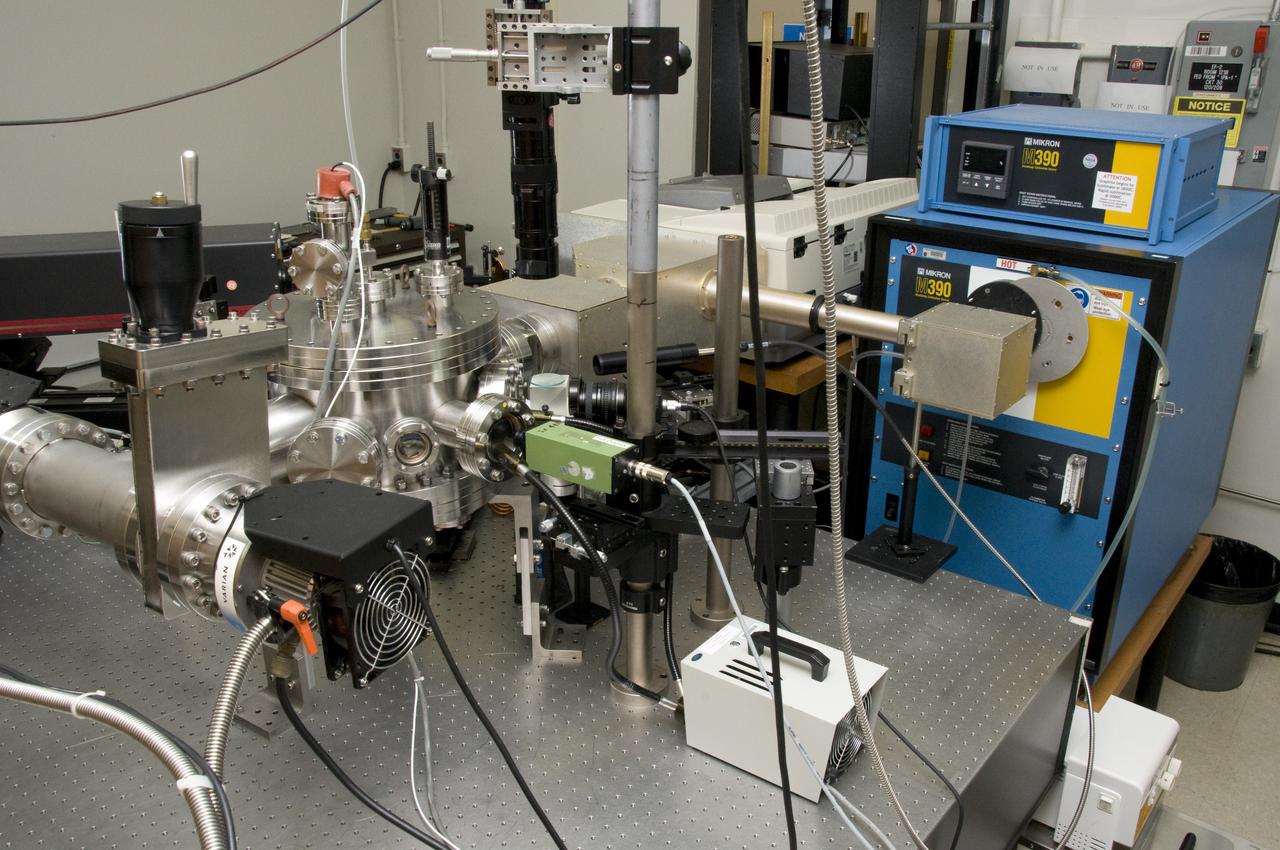
HIGH TEMPERATURE EMISSOMETER SYSTEM (HITEMS) OVERALL SHOT
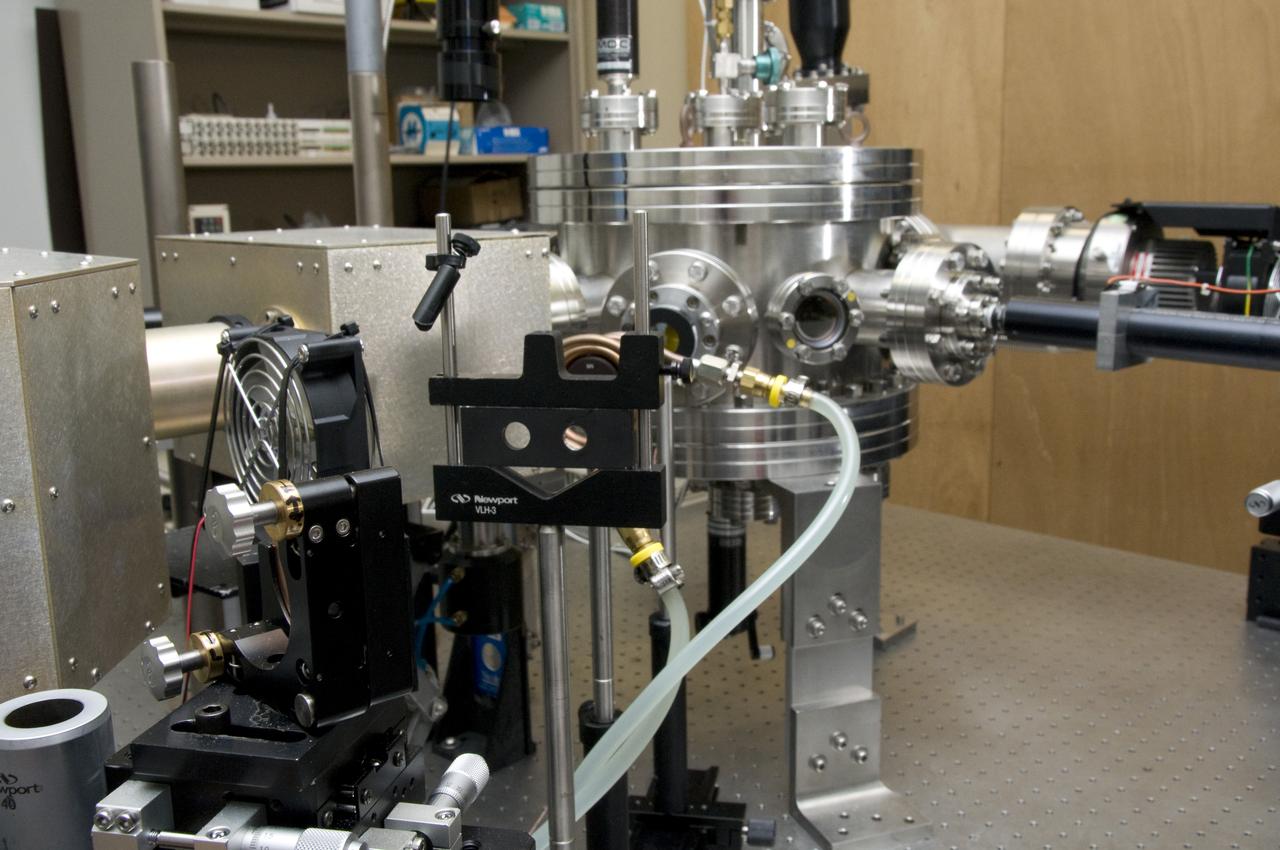
HIGH TEMPERATURE EMISSOMETER SYSTEM (HITEMS) CHAMBER SHOWING COIL FOR COOLING OPTICS
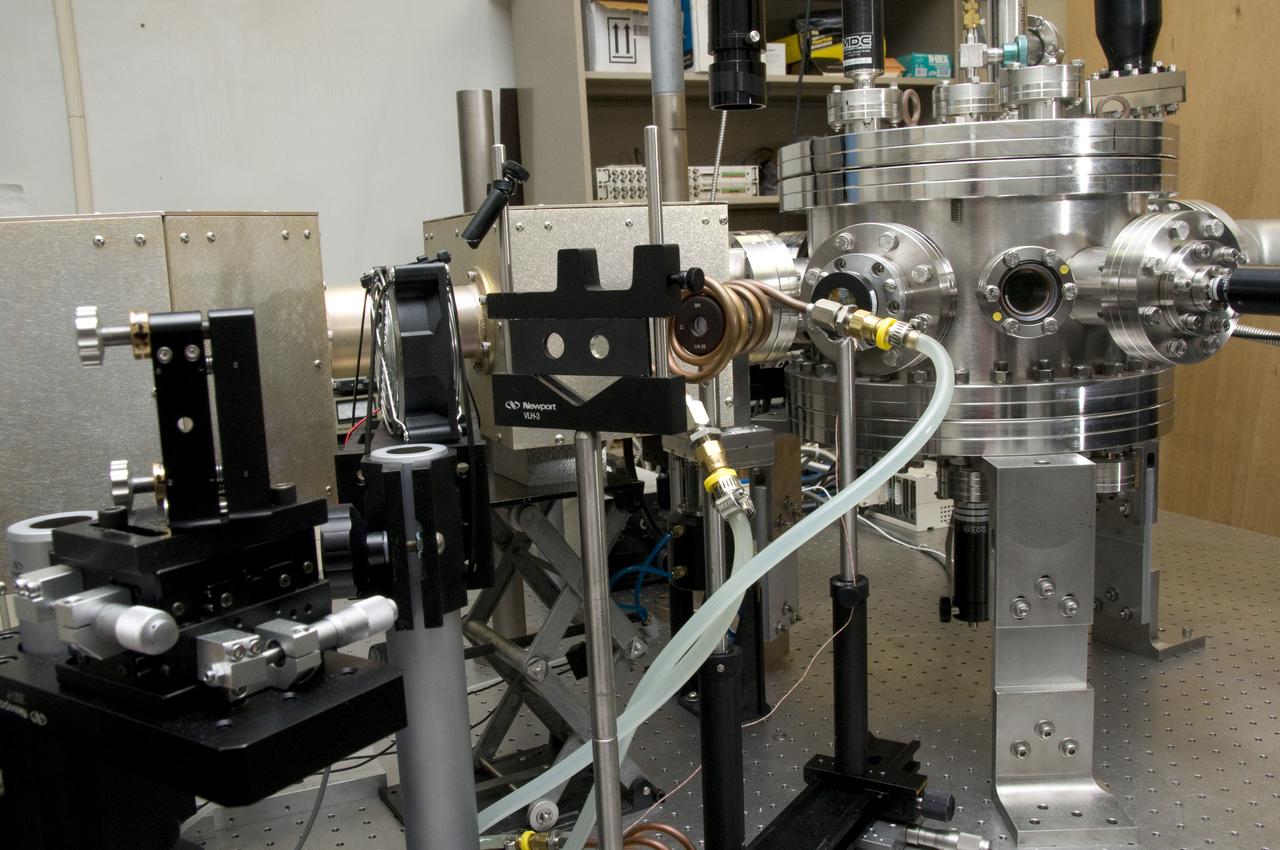
HIGH TEMPERATURE EMISSOMETER SYSTEM (HITEMS) CHAMBER SHOWING COIL FOR COOLING OPTICS
This colorized image from the visible and infrared mapping spectrometer onboard NASA Dawn spacecraft shows temperature variations at Tarpeia crater, near the south pole of the giant asteroid Vesta.
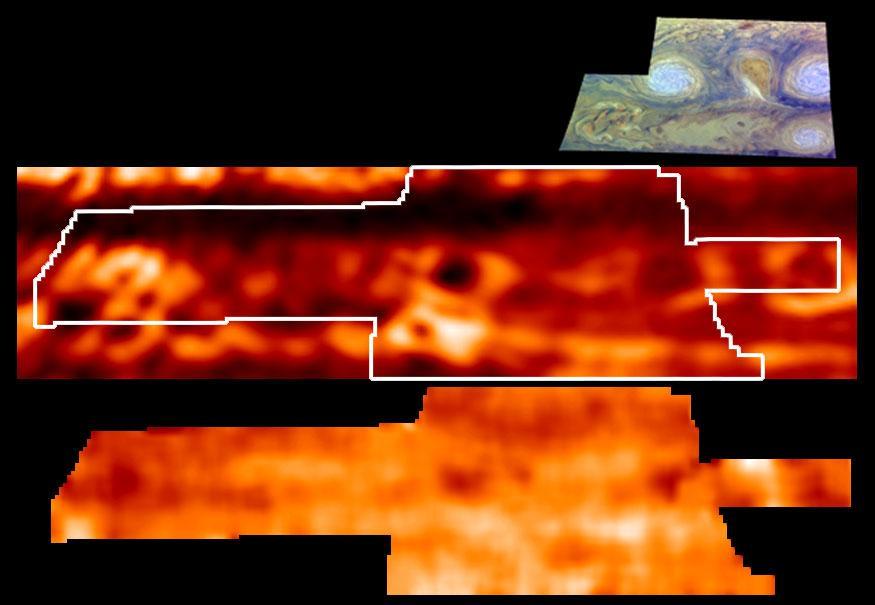
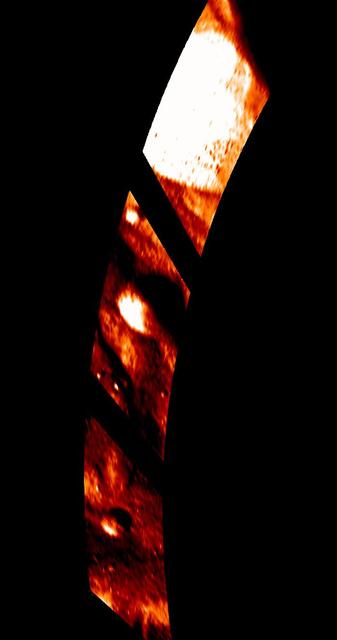
This is one of the highest resolution images ever recorded of Jupiter temperature field. It was obtained by NASA Galileo mission. This map, shown in the lower panel, indicates the forces powering Jovian winds.
The Temperature of Endurance
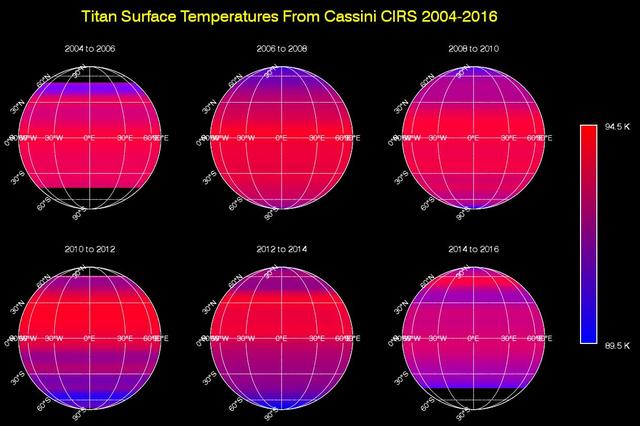
This sequence of maps shows varying surface temperatures on Saturn moon Titan at two-year intervals, from 2004 to 2016. The measurements were made by the Composite Infrared Spectrometer CIRS instrument on NASA Cassini spacecraft. The maps show thermal infrared radiation (heat) coming from Titan's surface at a wavelength of 19 microns, a spectral window at which the moon's otherwise opaque atmosphere is mostly transparent. Temperatures have been averaged around the globe from east to west (longitudinally) to emphasize the seasonal variation across latitudes (from north to south). Black regions in the maps are areas for which there was no data. Titan's surface temperature changes slowly over the course of the Saturn system's long seasons, which each last seven and a half years. As on Earth, the amount of sunlight received at each latitude varies as the sun's illumination moves northward or southward over the course of the 30-year-long Saturnian year. When Cassini arrived at Saturn in 2004, Titan's southern hemisphere was in late summer and was therefore the warmest region. Shortly after the 2009 equinox, in 2010, temperatures were symmetrical across the northern and southern hemispheres, mimicking the distribution observed by Voyager 1 in 1980 (one Titan year earlier). Temperatures subsequently cooled in the south and rose in the north, as southern winter approached. While the overall trend in the temperature shift is clearly evident in these maps, there is narrow banding in several places that is an artifact of making the observations through Titan's atmosphere. The moon's dense, hazy envelope adds noise to the difficult measurement. Although it moves in latitude, the maximum measured temperature on Titan remains around -292 degrees Fahrenheit (-179.6 degrees Celsius, 93.6 Kelvin), with a minimum temperature at the winter pole only 6 degrees Fahrenheit (3.5 degrees Celsius or Kelvin) colder. This is a much smaller contrast than exists between Earth's warmest and coldest temperatures, which can vary by more than 200 degrees Fahrenheit, or more than 100 degrees Celsius. http://photojournal.jpl.nasa.gov/catalog/PIA20020
Measurements by NASA Cassini spacecraft reveal temperatures in a high layer of Saturn atmosphere known as the stratosphere and show the dramatic effects of the massive storm deep below.

This map shows the temperatures for most of the surface of Ganymede made from data taken by on Jun. 26, 1996 as NASA Galileo approached the sunlit side of the moon.
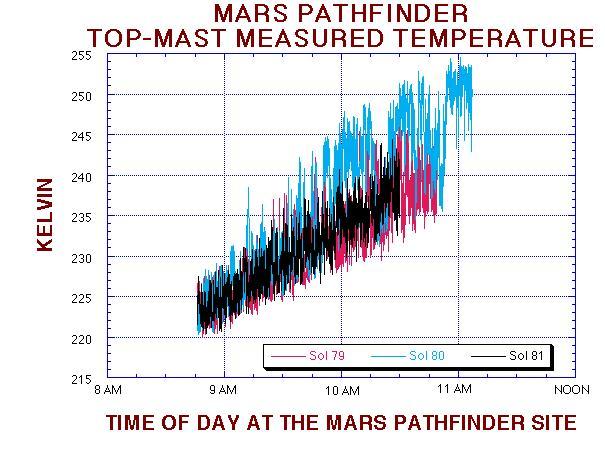
This temperature figure shows the change in the mean and variance of the temperature fluctuations at the Pathfinder landing site. Sol 79 and 80 are very similar, with a significant reduction of the mean and variance on Sol 81. The science team suspects that a cold front has past of the landing sight between Sols 80 and 81. http://photojournal.jpl.nasa.gov/catalog/PIA00978
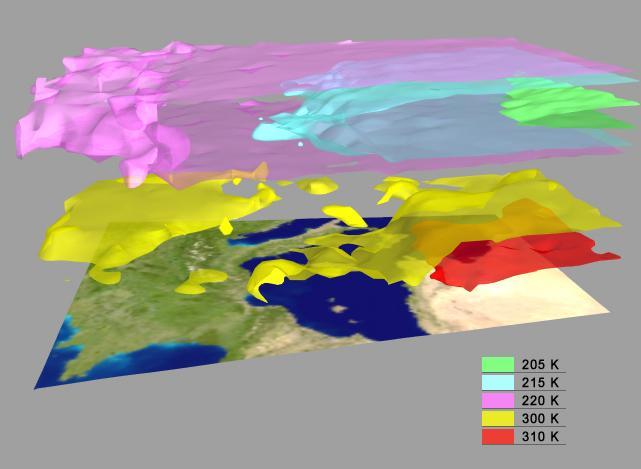
AIRS Retrieved Temperature Isotherms over Southern Europe viewed from the west, September 8, 2002. The isotherms in this map made from AIRS onboard NASA Aqua satellite data show regions of the same temperature in the atmosphere. http://photojournal.jpl.nasa.gov/catalog/PIA00513
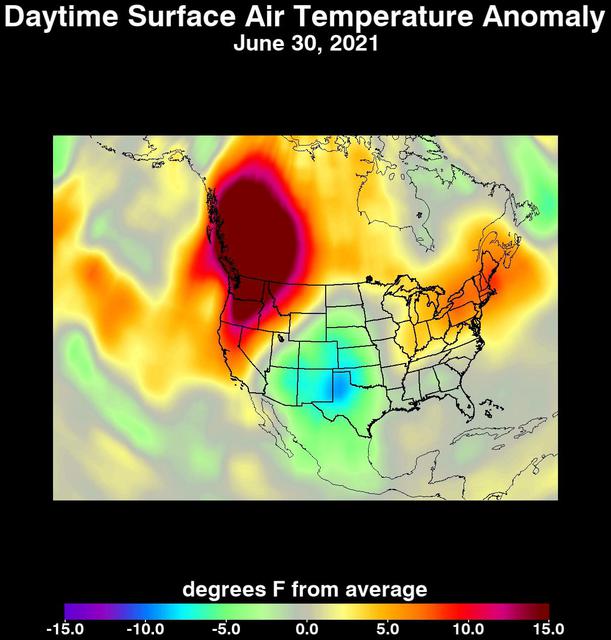
An unprecedented heat wave that started around June 26, 2021, smashed numerous all-time temperature records in the Pacific Northwest and western Canada. NASA's Atmospheric Infrared Sounder (AIRS), aboard the Aqua satellite, captured the progression of this slow-moving heat dome across the region from June 21 to 30. This animation of AIRS data shows surface air temperature anomalies, or values above or below long-term averages. Surface air temperature is something that people directly feel when they are outside. Some of the temperature anomalies were greater than 20 degrees Fahrenheit above the long-term average. On June 28, Quillayute, Washington, set an all-time high temperature record of 110 degrees Fahrenheit (43 degrees Celsius), shattering the old record of 99 degrees Fahrenheit (37 degrees Celsius). In British Columbia, the village of Lytton set a new all-time record for Canada at 119 degrees Fahrenheit (48 degrees Celsius) on June 29, only to break it the next day with a reading of 121 degrees Fahrenheit (49 degrees Celsius). The AIRS instrument recorded similar temperature anomalies at an altitude of about 10,000 feet (3,000 meters), showing that the extreme heat also affected mountainous regions. And temperature anomalies at roughly 18,000 feet (5,500 meters) demonstrated that the heat dome extended high into Earth's troposphere, creating the conditions for intense heat at the planet's surface that are normally found further south. Animation available at https://photojournal.jpl.nasa.gov/catalog/PIA24537
HIGH TEMPERATURE EMISSOMETER SYSTEM (HITEMS) SHOWING FTIR
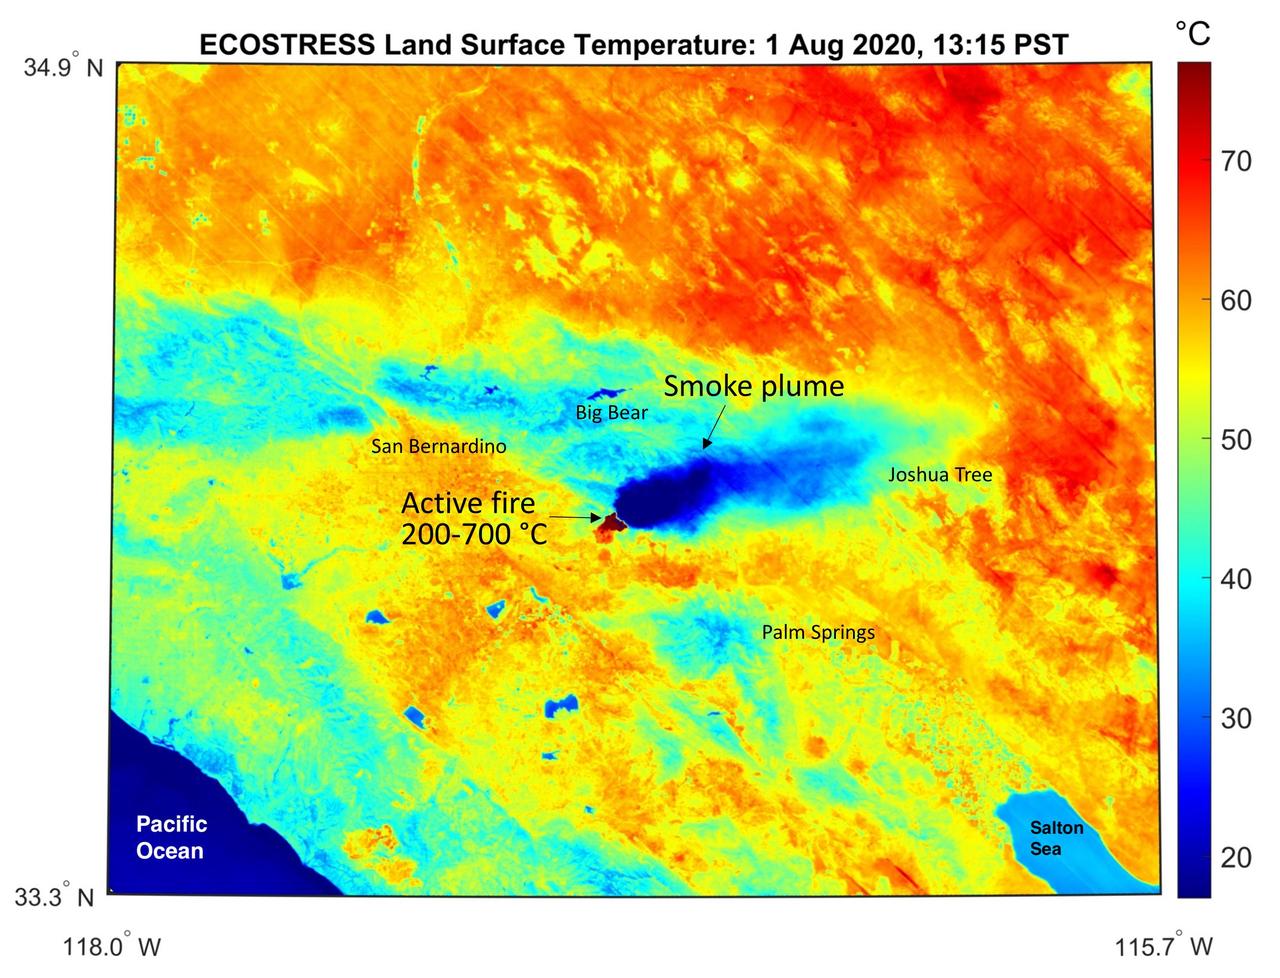
This temperature map shows the stressed and dry vegetation surrounding the Apple fire in Southern California on Aug. 1, 2020. The observation was made possible by NASA's Ecosystem Spaceborne Thermal Radiometer Experiment on Space Station (ECOSTRESS) that measured the temperature of the burn area and tracked the dark smoke plume drifting east from California to Arizona. ECOSTRESS collected this data when the space station passed over the region at about 1:15 p.m. PST on Saturday, Aug. 1, 2020, when the burn area was approximately 4,000 acres in size. Black smoke can be seen drifting east and over Joshua Tree National Park in the Mojave Desert. With a resolution of about 77 by 77 yards (70 by 70 meters), the image enables surface-temperature conditions down to the size of a football field to be studied. In the active burn area, temperatures of between 390-1290 F (200-700 C) were recorded, and in one pixel in the ECOSTRESS image of the burn zone, a peak temperature of 1387 F (753 C) was detected. Tasked with detecting plant water use and stress, ECOSTRESS measures the temperature of plants as they heat up when they run out of water. But it can also measure and track heat-related phenomena like fires, heat waves, and volcanoes. https://photojournal.jpl.nasa.gov/catalog/PIA23798
A rugged, highly accurate, low-temperature sensor is developed by NASA researchers. A new sensor allows accurate, quick low-temperature measurements in rugged environments. This is especially useful in piping with very cold liquids under high pressure, and high flow rate conditions.
Mars Polar Lander Landing Site Noon-time Temperatures
Martian Temperatures Measured by the Thermal Emission Spectrometer TES. Isidis Planitia View
Five Years of Monitoring Mars Daytime Surface Temperatures Animation
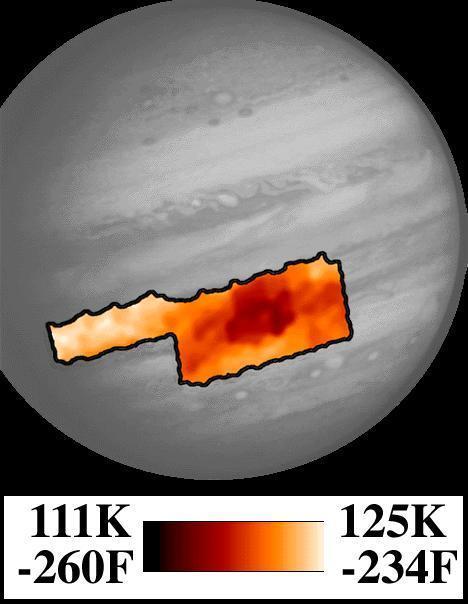
Photopolarimeter/Radiometer PPR Temperature Map of Great Red Spot

This is one of the highest resolution images ever recorded of Jupiter temperature field. It was obtained by NASA Galileo mission, with its Photopolarimeter-Radiometer PPR experiment, during the seventh of its 10 orbits around Jupiter to date.
The Atmospheric Infrared Sounder AIRS onboard NASA Aqua satellite collects data and creates a temperature profile, September, 2008.
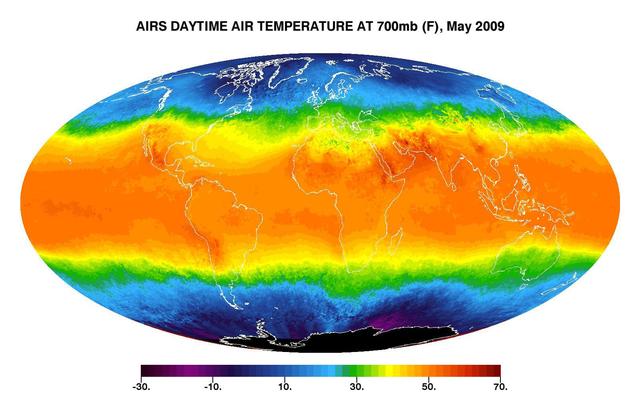
This image shows average daytime temperatures in May, 2009, as observed by JPL Atmospheric Infrared Sounder on NASA Aqua satellite.
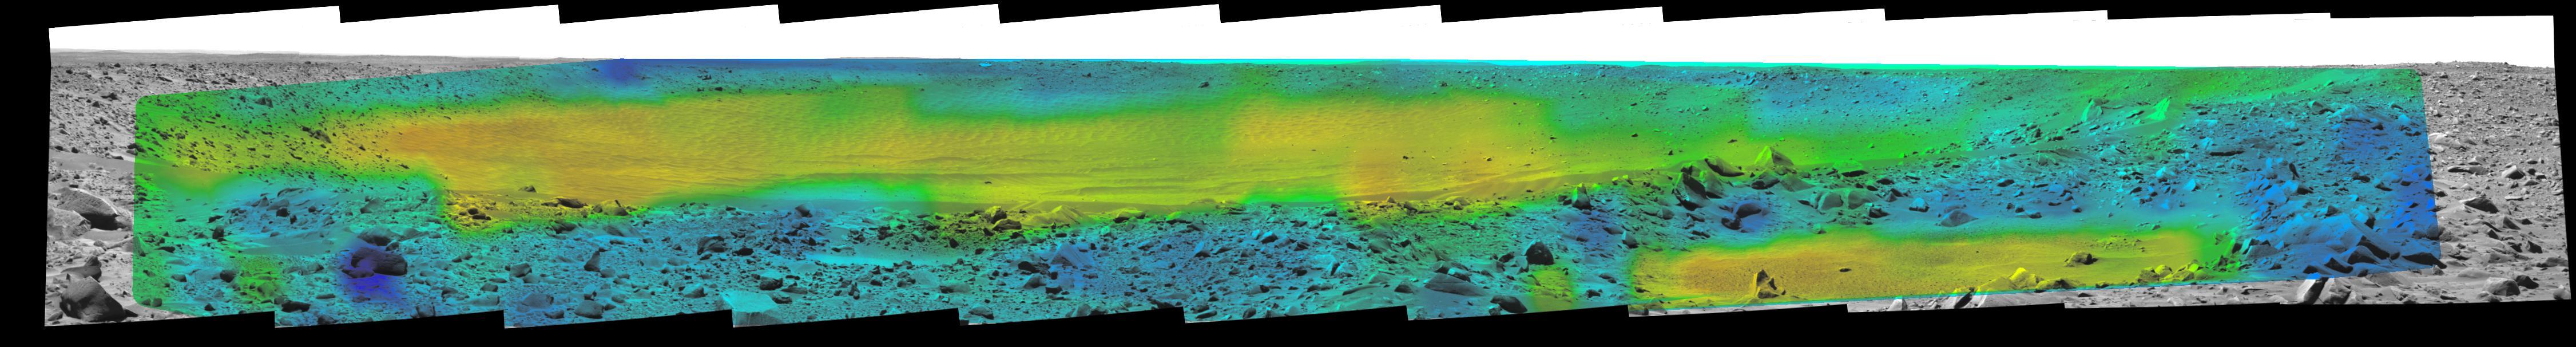
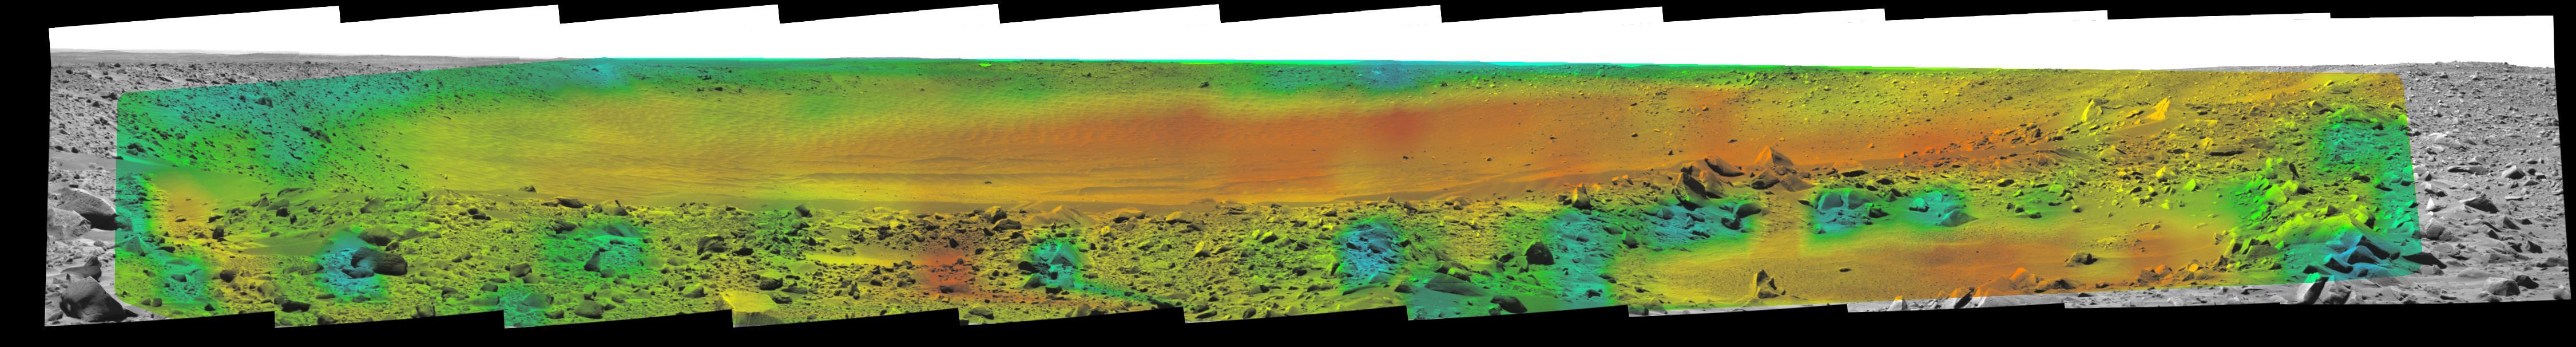
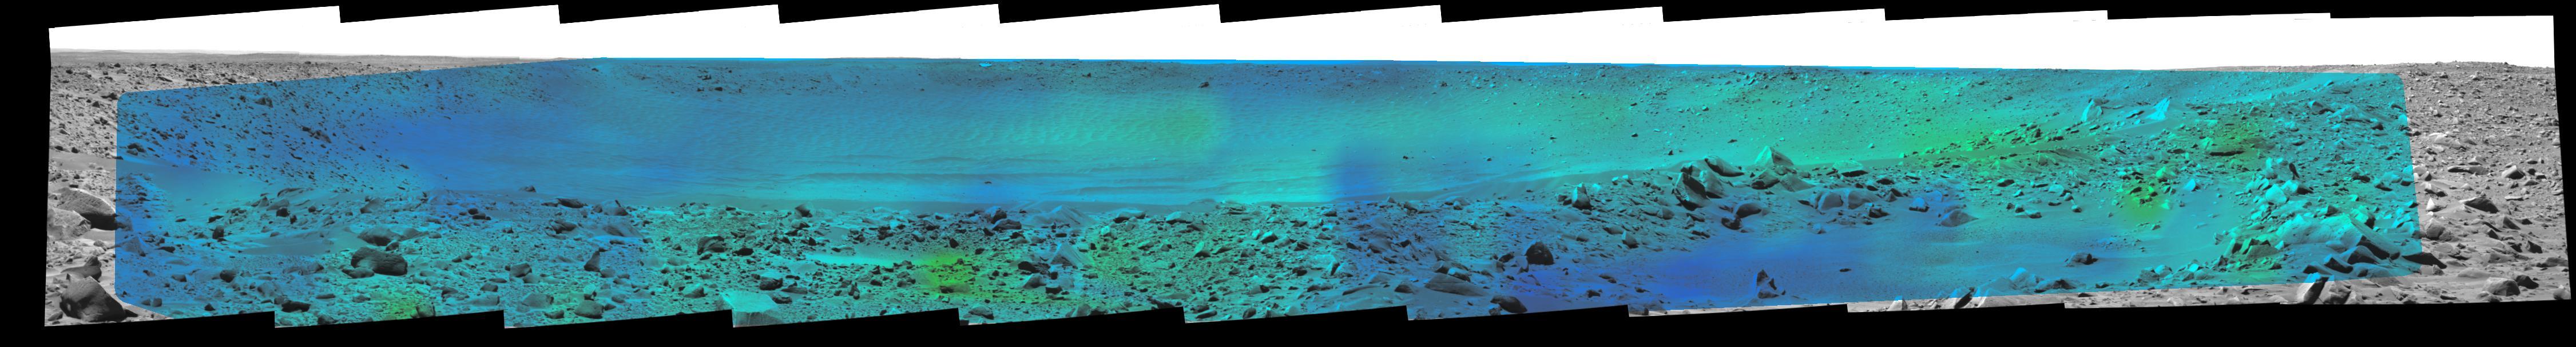
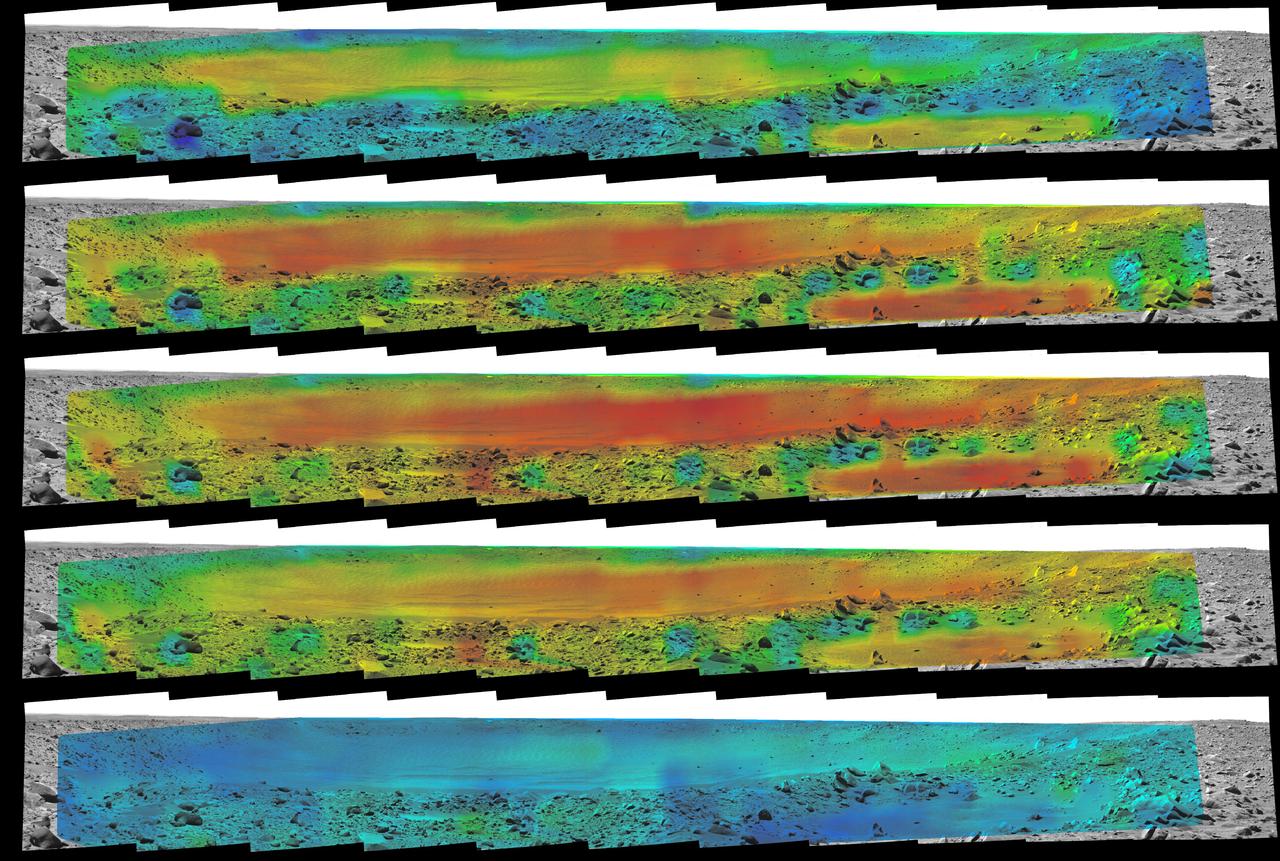
Temperature Map, Bonneville
Temperature Map, Bonneville
Temperature Map, Bonneville
Temperature Map, Bonneville
Temperature Map, Bonneville
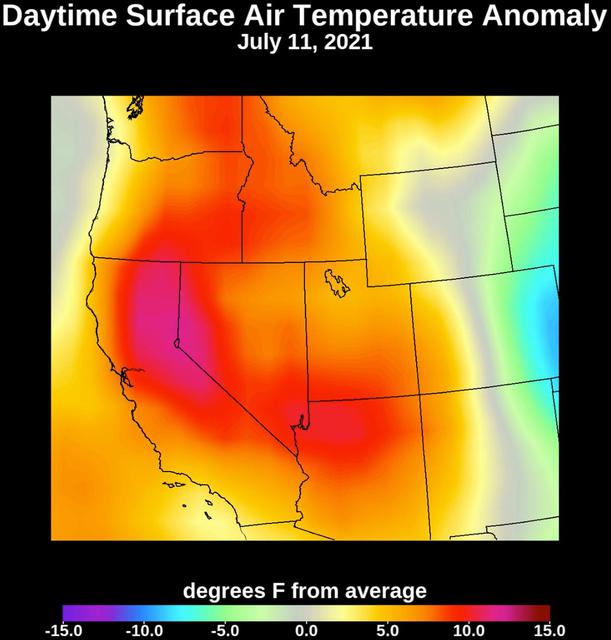
Collecting temperature readings in the atmosphere and at the surface, NASA's Atmospheric Infrared Sounder (AIRS) instrument aboard the agency's Aqua satellite captured the progression of a slow-moving heat dome across the southwestern U.S. from July 1 to July 12, 2021. The animation of the AIRS data shows surface air temperature anomalies – values above or below long-term averages. The hottest areas, shown in pink, experienced surface air temperatures more than 10 degrees Fahrenheit (5.6 degrees Celsius) above average. Surface air temperature is something that people directly feel when they are outside. Animation available at https://photojournal.jpl.nasa.gov/catalog/PIA23693
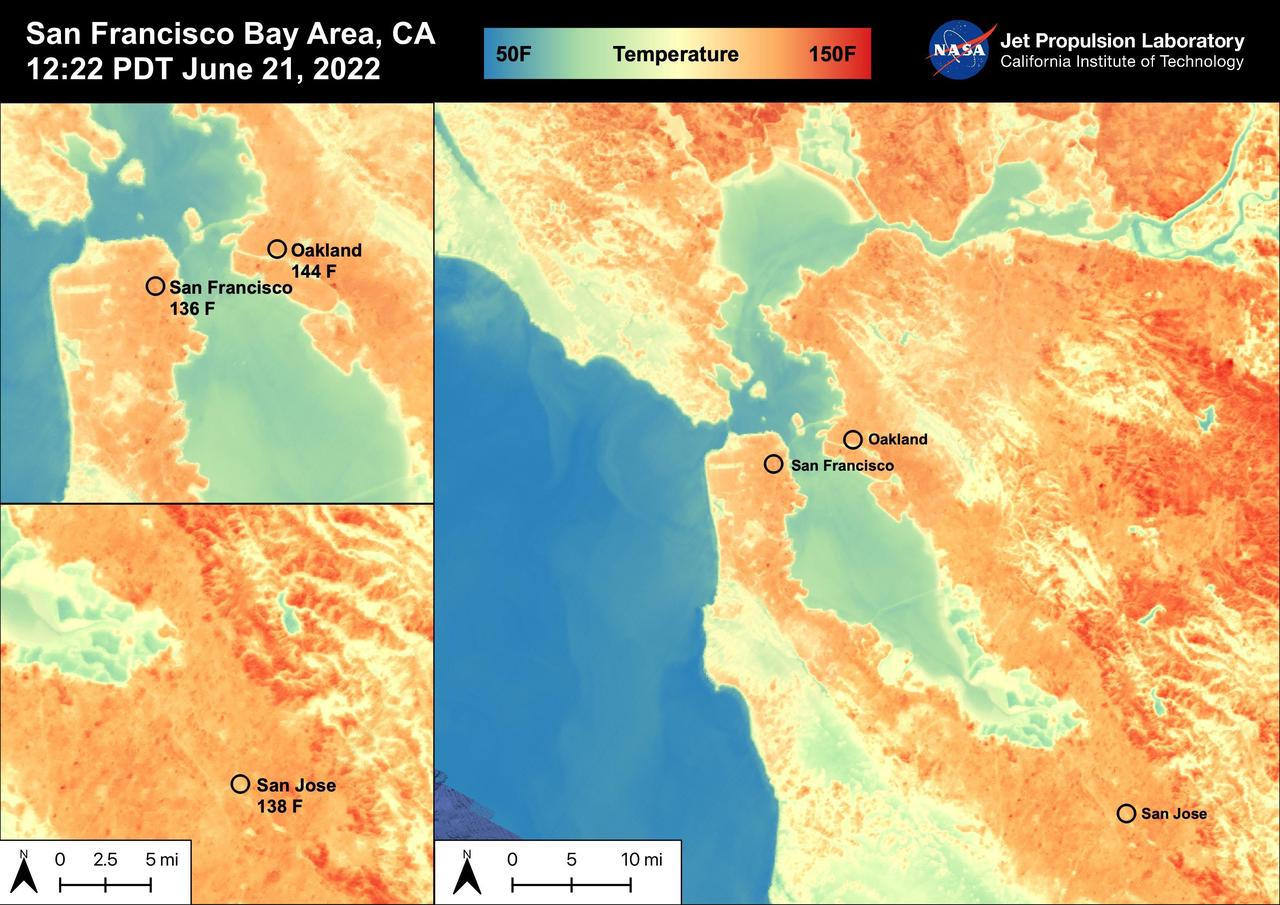
On June 21st, 2022, the San Francisco Bay Area experienced high temperatures as a hot mass of air remained over the region. San Francisco reached 92 degrees Fahrenheit, Oakland reached 98 degrees Fahrenheit, and San Jose reached 102 degrees Fahrenheit. The Land Surface Temperatures at 12:22 PM PDT ranged from 60 degrees Fahrenheit to 150 degrees Fahrenheit for this region with water temperatures ranging from 50 degrees Fahrenheit to 90 degrees Fahrenheit. ECOSTRESS is a thermal instrument on the International Space Station that measures the temperature of the ground, which is hotter than the air temperature during the day. It was launched to the space station in 2018. Its primary mission is to identify critical thresholds of water use and water stress in plants and to detect the timing, location, and predictive factors leading to plant water uptake decline and/or cessation. The nature of the high-resolution data provided by ECOSTRESS allows it to record heat related phenomena such as heat waves, droughts and wildfires. https://photojournal.jpl.nasa.gov/catalog/PIA25441
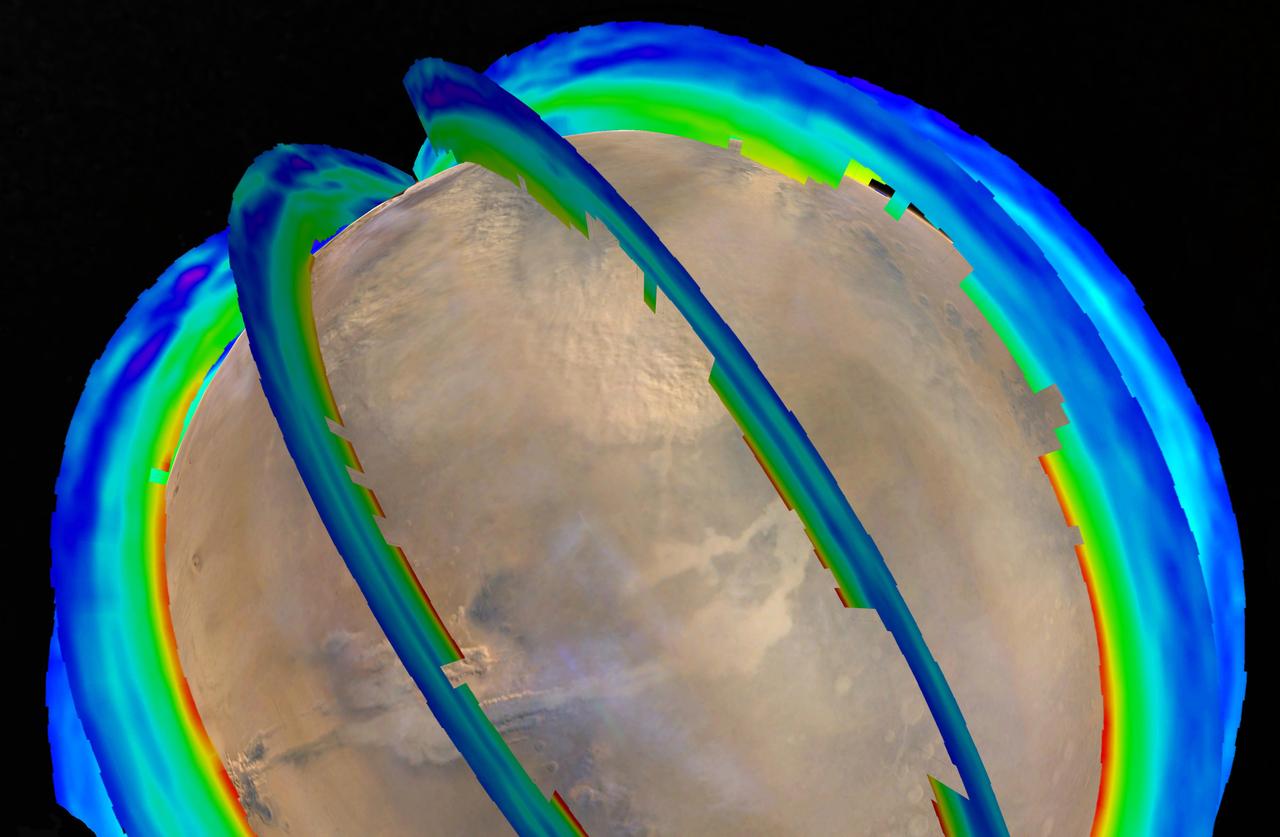
This graphic overlays Martian atmospheric temperature data as curtains over an image of Mars taken during a regional dust storm. The temperature profiles extend from the surface to about 50 miles (80 kilometers) up. Temperatures are color coded, ranging from minus 243 degrees Fahrenheit (minus 153 degrees Celsius) where coded purple to minus 9 F (minus 23 C) where coded red. The temperature data and global image were both recorded on Oct. 18, 2014, by instruments on NASA's Mars Reconnaissance Orbiter: Mars Climate Sounder and Mars Color Imager. On that day a regional dust storm was active in the Acidalia Planitia region of northern Mars, at the upper center of this image. A storm from this area in typically travels south and grows into a large regional storm in the southern hemisphere during southern spring. That type of southern-spring storm and two other large regional dust storms repeat as a three-storm series most Martian years. The pattern has been identified from their effects on atmospheric temperature in a layer about 16 miles (25 kilometers) above the surface. http://photojournal.jpl.nasa.gov/catalog/PIA20747
2015 was the warmest year since modern record-keeping began in 1880, according to a new analysis by NASA’s Goddard Institute for Space Studies. The record-breaking year continues a long-term warming trend — 15 of the 16 warmest years on record have now occurred since 2001. Credits: Scientific Visualization Studio/Goddard Space Flight Center Details: Earth’s 2015 surface temperatures were the warmest since modern record keeping began in 1880, according to independent analyses by NASA and the National Oceanic and Atmospheric Administration (NOAA). Globally-averaged temperatures in 2015 shattered the previous mark set in 2014 by 0.23 degrees Fahrenheit (0.13 Celsius). Only once before, in 1998, has the new record been greater than the old record by this much. The 2015 temperatures continue a long-term warming trend, according to analyses by scientists at NASA’s Goddard Institute for Space Studies (GISS) in New York (GISTEMP). NOAA scientists agreed with the finding that 2015 was the warmest year on record based on separate, independent analyses of the data. Because weather station locations and measurements change over time, there is some uncertainty in the individual values in the GISTEMP index. Taking this into account, NASA analysis estimates 2015 was the warmest year with 94 percent certainty.
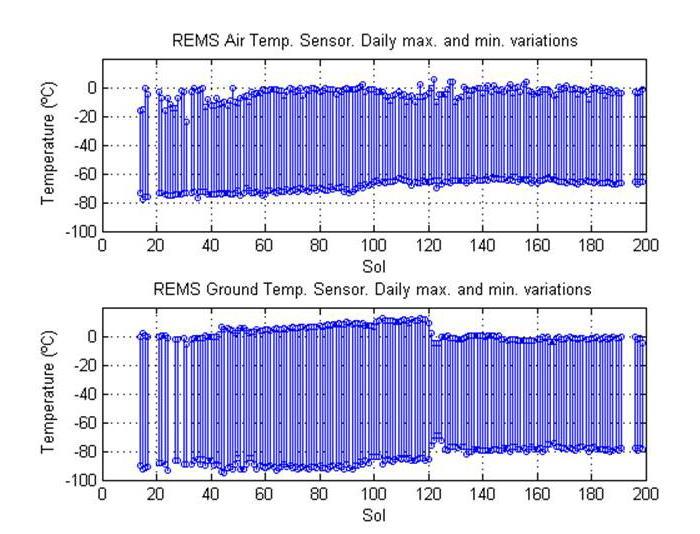
This pair of graphs shows about one-fourth of a Martian year record of temperatures in degrees Celsius measured by the Rover Environmental Monitoring Station REMS on NASA Curiosity rover.
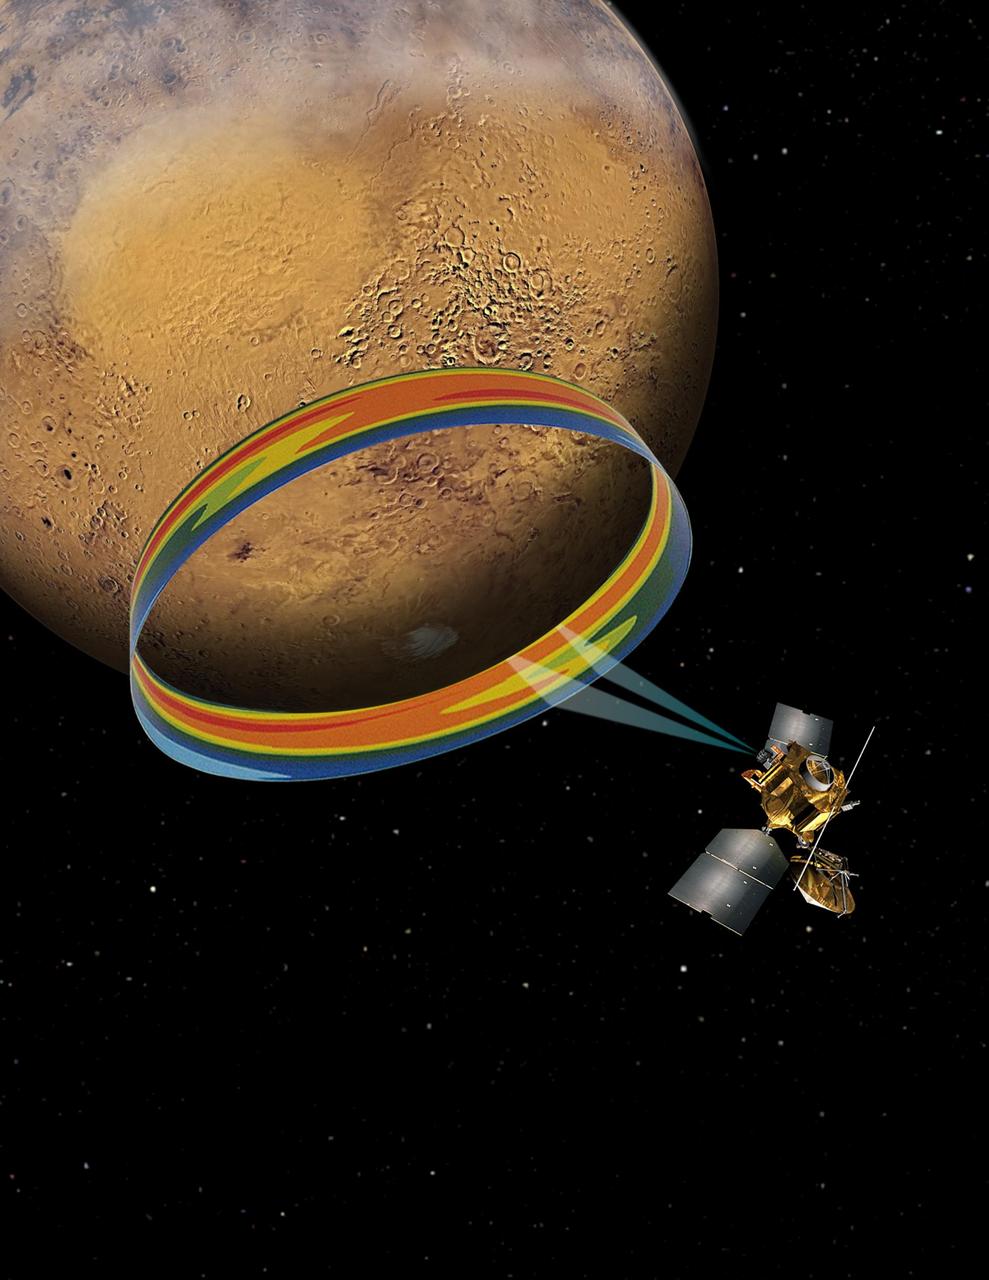
This graphic depicts the Mars Climate Sounder instrument on NASA Mars Reconnaissance Orbiter measuring the temperature of a cross section of the Martian atmosphere as the orbiter passes above the south polar region.
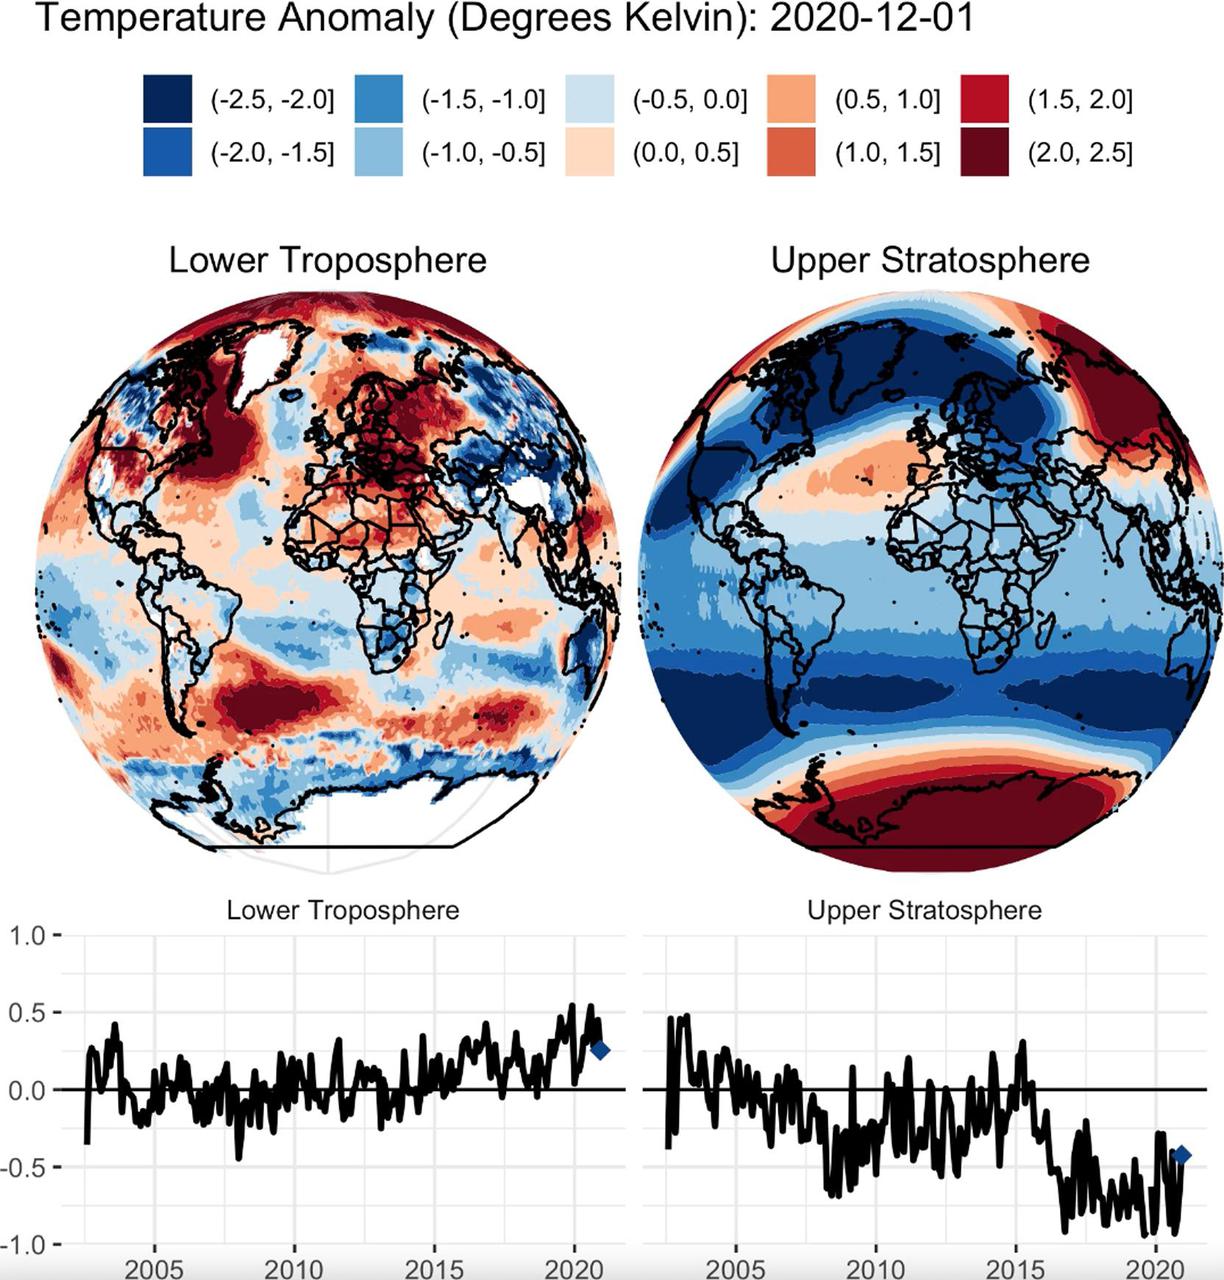
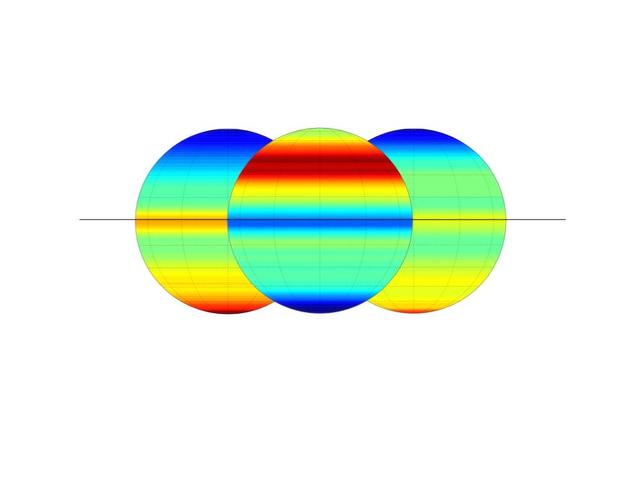
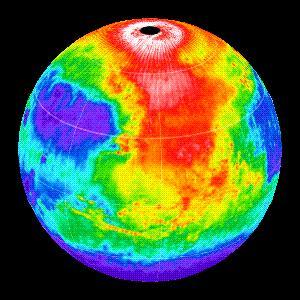
This animation shows a nearly 20-year record of temperature anomalies for two layers in Earth's atmosphere: the lower troposphere, where most of the planet's weather occurs; and the upper stratosphere, which contains the ozone layer. NASA's Atmospheric Infrared Sounder (AIRS), aboard the Aqua satellite, captured these measurements from 2002 to 2020. Preliminary data analysis shows a warming trend for the lower troposphere, and a strong cooling trend in the upper stratosphere. The globes show a map of where warmer than average or cooler than average temperatures for each atmospheric layer occurred during this time period. The line graphs show the deviation of temperatures averaged over the entire planet for the lower troposphere and upper stratosphere. AIRS, in conjunction with the Advanced Microwave Sounding Unit (AMSU), senses emitted infrared and microwave radiation from Earth to provide a three-dimensional look at the planet's weather and climate. Working in tandem, the two instruments make simultaneous observations down to Earth's surface. With more than 2,000 channels sensing different regions of the atmosphere, the system creates a global, three-dimensional map of atmospheric temperature and humidity, cloud amounts and heights, greenhouse gas concentrations and many other atmospheric phenomena. Launched into Earth orbit in 2002 aboard NASA's Aqua spacecraft, the AIRS and AMSU instruments are managed by NASA's Jet Propulsion Laboratory in Southern California, under contract to NASA. JPL is a division of Caltech. Movie available at https://photojournal.jpl.nasa.gov/catalog/PIA24139
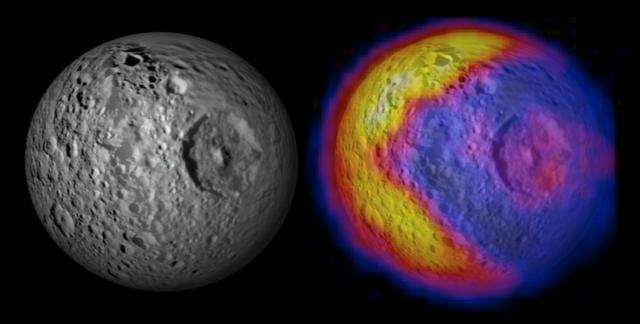
This image shows NASA Cassini spacecraft imaging science subsystem visible-light mosaic of Mimas from previous flybys on the left. The right-hand image shows new infrared temperature data mapped on top of the visible-light image.
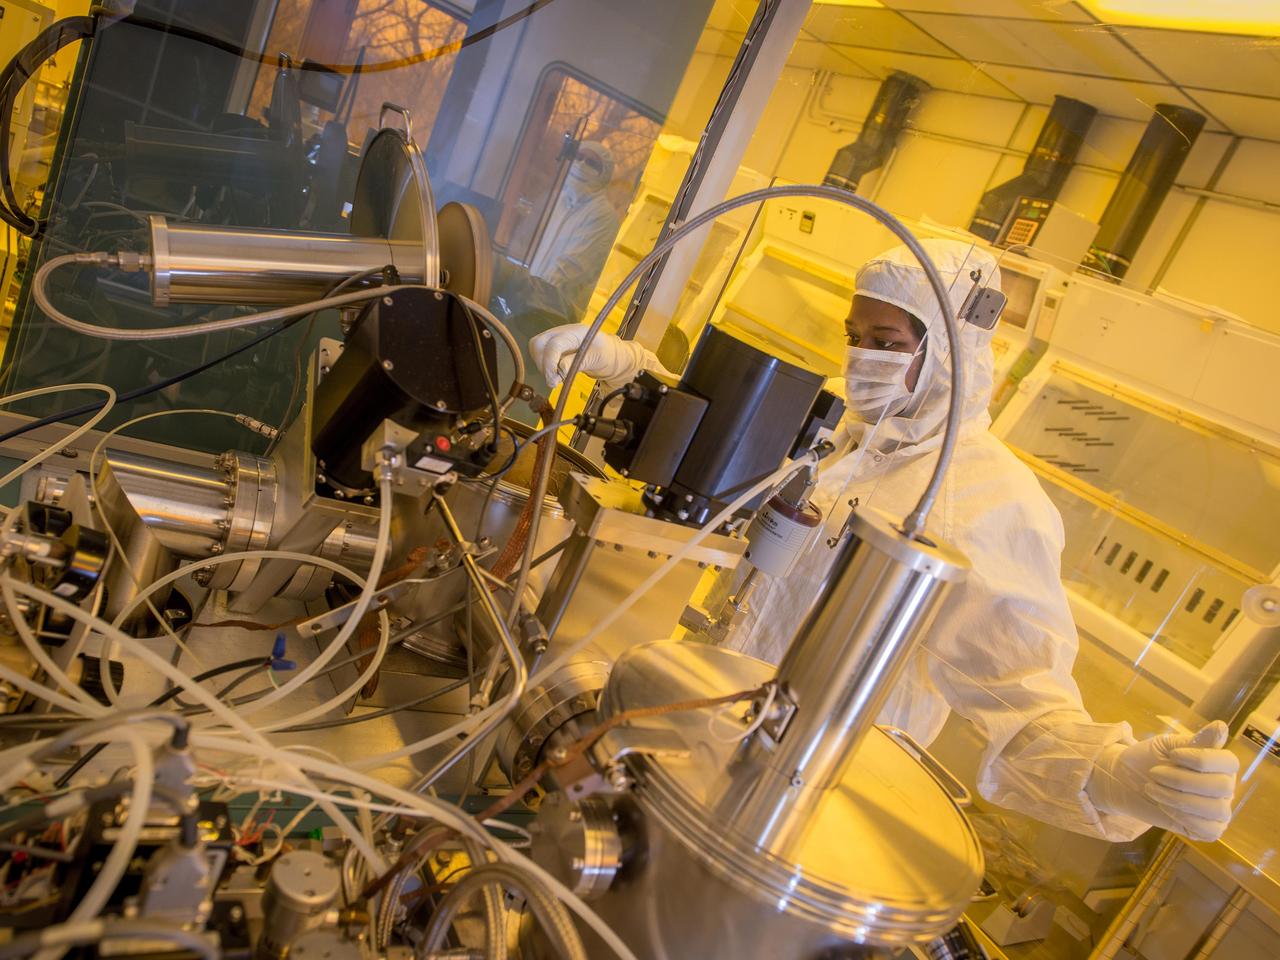
NASA Glenn technician Ariana Miller prepares an ultrahigh vacuum chamber used to test the materials used in silicon carbide based sensors and electronics that can operate at extremely high temperatures (500 degrees Celsius and higher) for applications such as sensor systems for aircraft engines and Venus exploration.
NASA Glenn research engineers prepare our extreme environments chamber (GEER) for a test. GEER, which simulates the extreme conditions found in space, tests many devices that will explore Venus to see if they can withstand the punishing environment and temperatures over 800˚F.
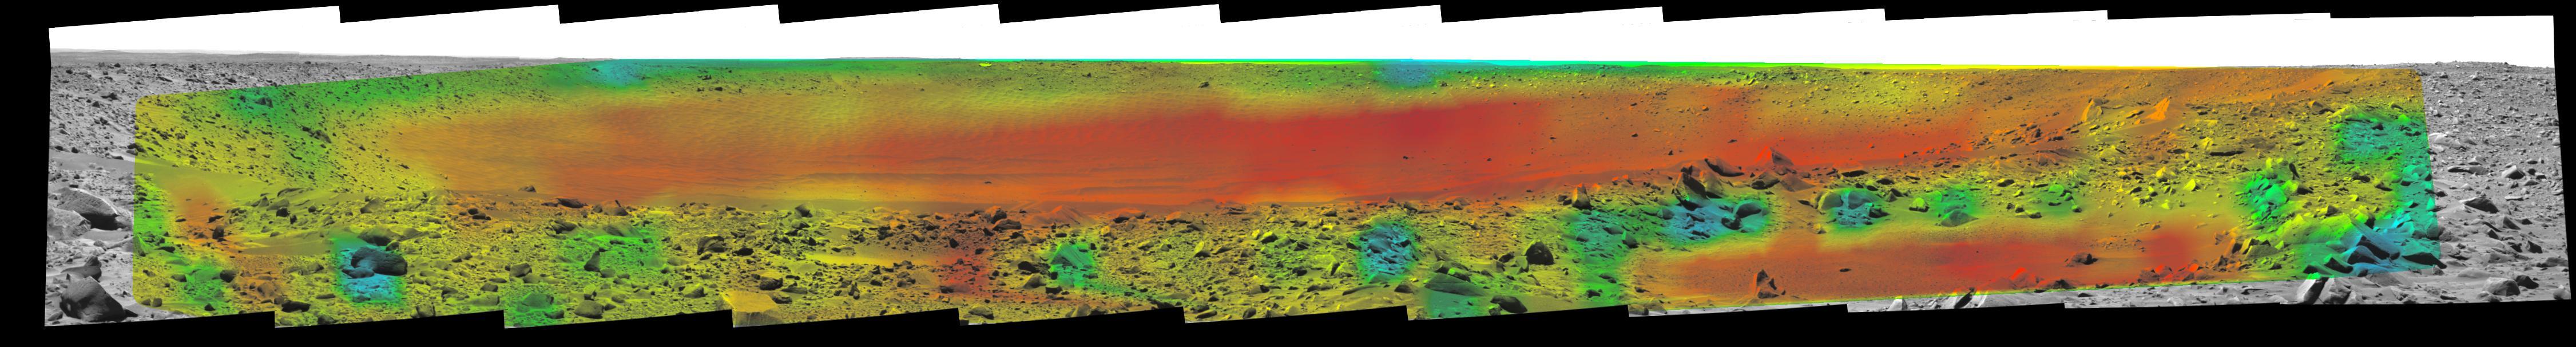
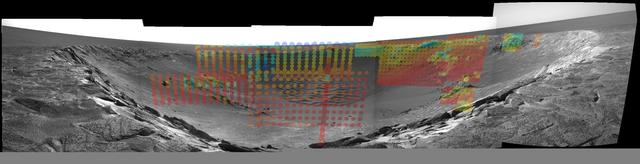
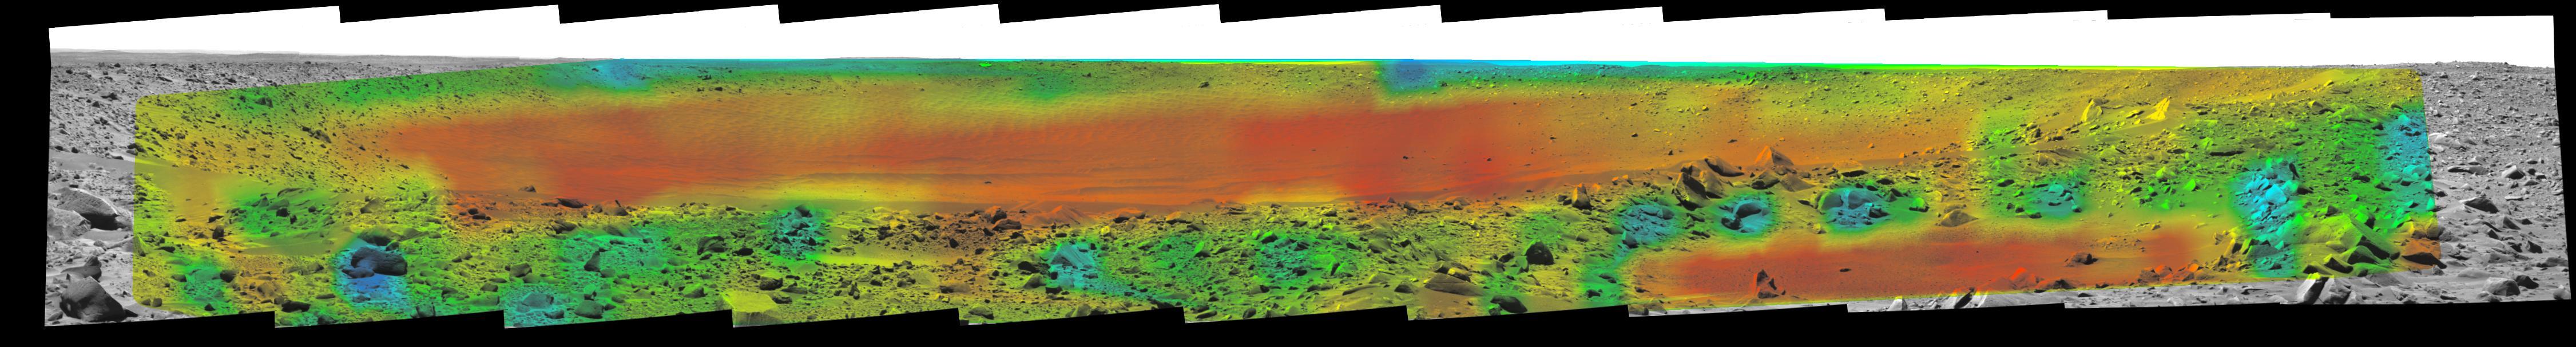
Rates of change in surface temperatures during a martian day indicate differences in particle size in and near "Bonneville Crater." This image is the third in a series of five with color-coded temperature information from different times of day. This one is from 1:35 p.m. local solar time at the site where NASA's Mars Exploration Rover Spirit is exploring Mars. Temperature information from Spirit's miniature thermal emission spectrometer is overlaid onto a view of the site from Spirit's panoramic camera. In this color-coded map, quicker reddening during the day suggests sand or dust. (Red is about 270 Kelvin or 27 degrees Fahrenheit.) An example of this is in the shallow depression in the right foreground. Areas that stay blue longer into the day have larger rocks. (Blue indicates about 230 Kelvin or minus 45 Degrees F.) An example is the rock in the left foreground. http://photojournal.jpl.nasa.gov/catalog/PIA05930
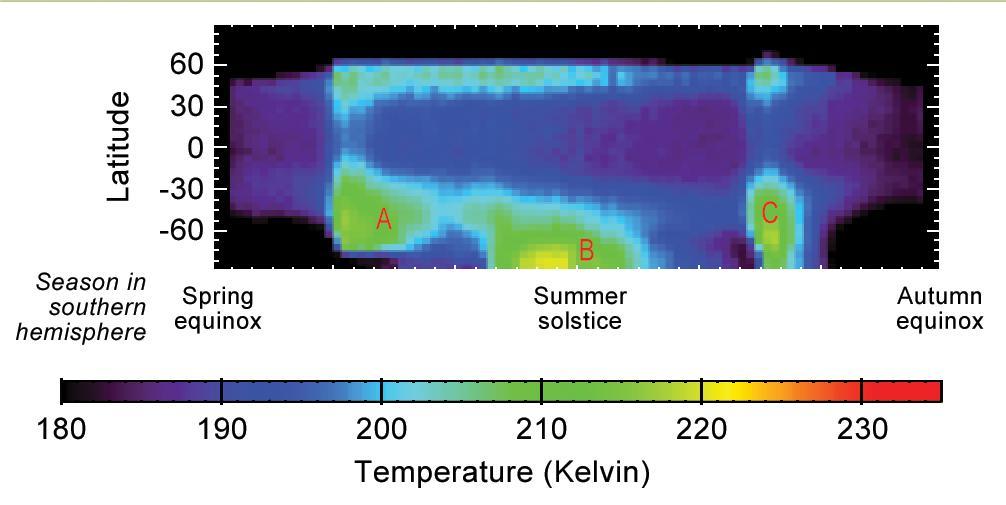
This graphic shows Martian atmospheric temperature data related to seasonal patterns in occurrence of large regional dust storms. The data shown here were collected by the Mars Climate Sounder instrument on NASA's Mars Reconnaissance Orbiter over the course of one-half of a Martian year, during 2012 and 2013. The color coding indicates daytime temperatures of a layer of the atmosphere centered about 16 miles (25 kilometers) above ground level, corresponding to the color-key bar at the bottom of the graphic. Three regional dust storms indicated by increased temperatures are labeled A, B and C. A similar sequence of three large regional dust storms has been seen in atmosphere-temperature data from five other Martian years. The vertical axis is latitude on Mars, from the north pole at the top to south pole at the bottom. Each graphed data point is an average for all Martian longitudes around the planet. The horizontal axis is the time of year, spanning from the beginning of Mars' southern-hemisphere spring (on the left) to the end of southern-hemisphere summer. This is the half of the year when large Martian dust storms are most active. http://photojournal.jpl.nasa.gov/catalog/PIA20746
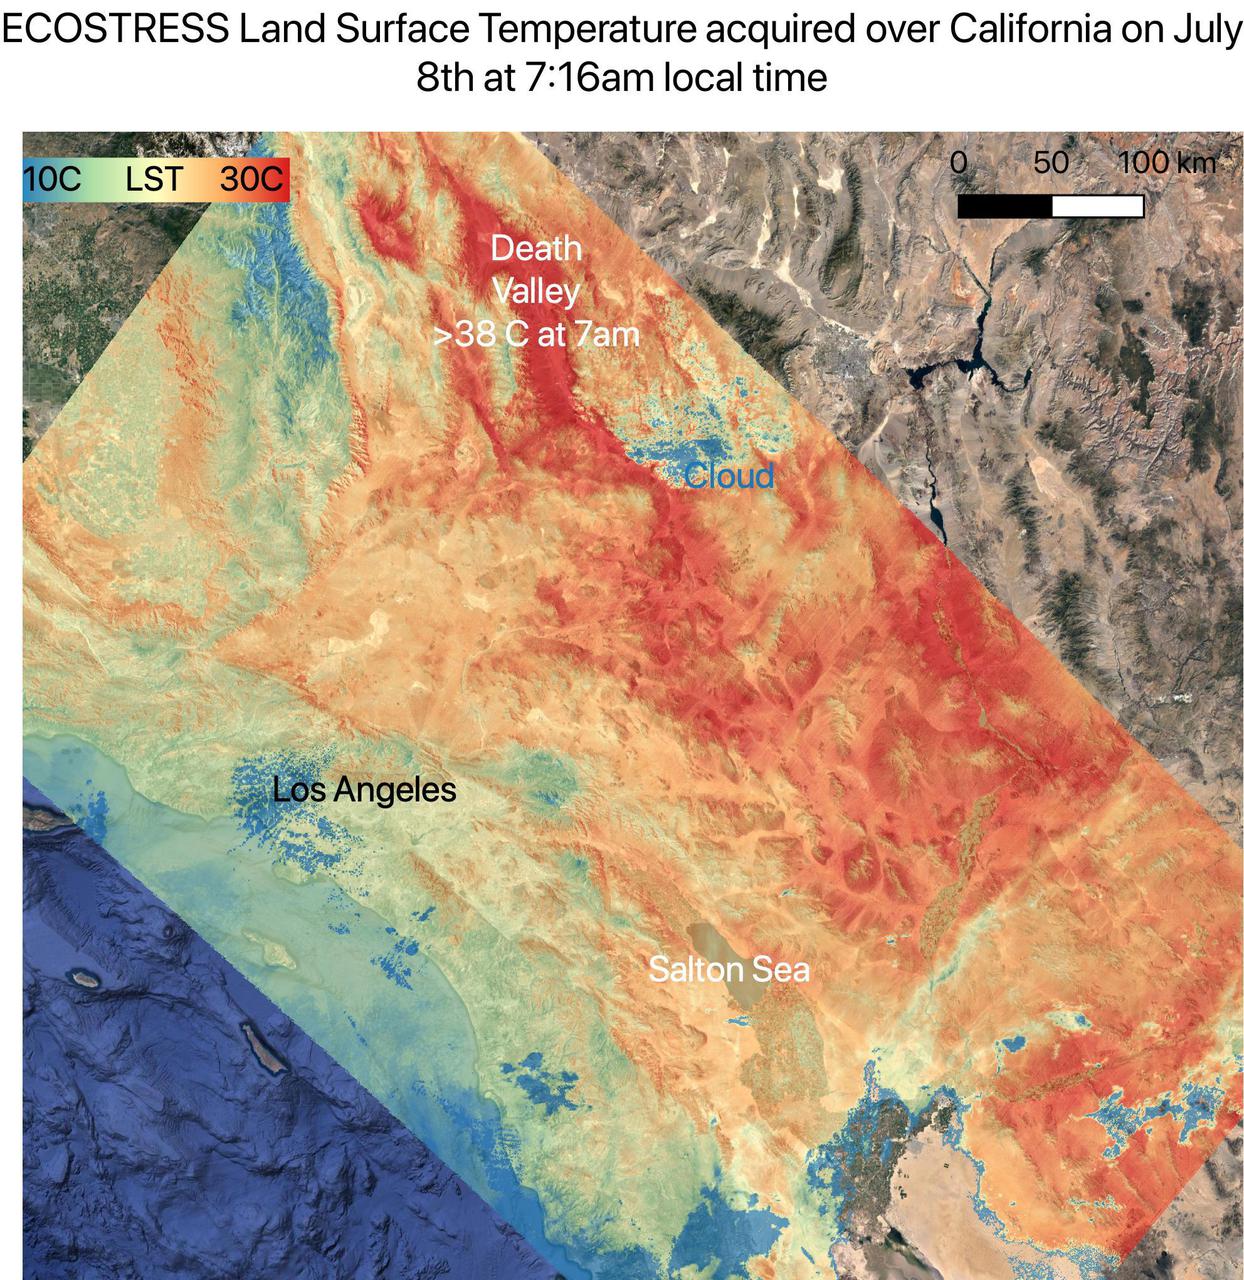
On July 8, NASA's ECOsystem Spaceborne Thermal Radiometer Experiment on Space Station (ECOSTRESS) instrument captured ground surface temperature data over California. In the image, areas in red – including Death Valley – had surpassed 86 degrees Fahrenheit (30 degrees Celsius) by 7:16 a.m. local time, well above average ground surface temperatures for the area. Tasked with detecting plant water use and stress, ECOSTRESS's primary mission is to measure the temperature of plants heating up as they run out of water. But it can also measure and track heat-related phenomena like heat waves, wildfires, and volcanoes. ECOSTRESS observations have a spatial resolution of about 77 by 77 yards (70 by 70 meters), which enables researchers to study surface-temperature conditions down to the size of a football field. Due to the space station's unique orbit, the mission can acquire images of the same regions at different times of the day, as opposed to crossing over each area at the same time of day like satellites in other orbits do. This is advantageous when monitoring plant stress in the same area throughout the day, for example. https://photojournal.jpl.nasa.gov/catalog/PIA23694

A multilevel interconnect silicon carbide integrated circuit chip with co-fired ceramic package and circuit board recently developed at the NASA GRC Smart Sensors and Electronics Systems Branch for high temperature applications. High temperature silicon carbide electronics and compatible packaging technologies are elements of instrumentation for aerospace engine control and long term inner-solar planet explorations.
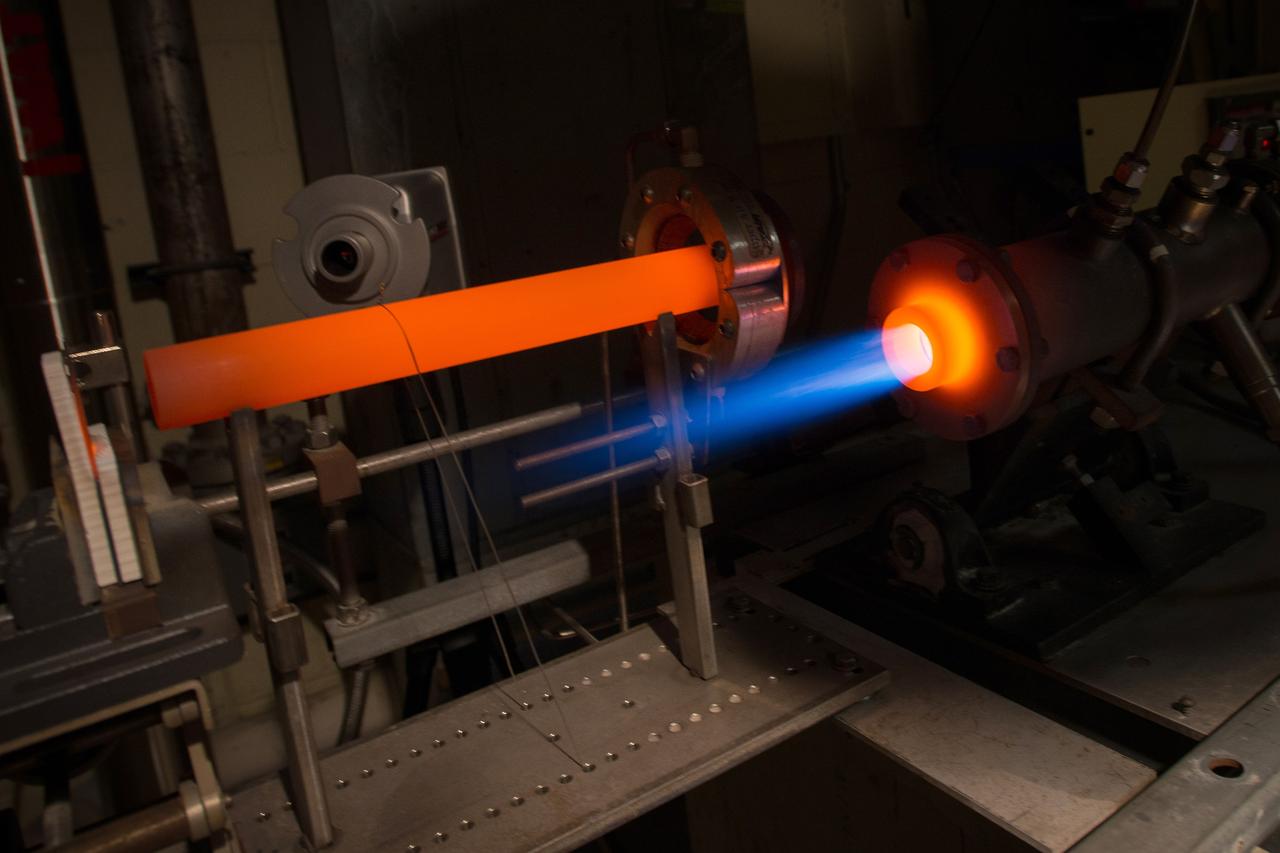
The Fuel Burner Rig is a test laboratory at NASA Glenn, which subjects new jet engine materials, treated with protective coatings, to the hostile, high temperature, high velocity environment found inside aircraft turbine engines. These samples face 200-mile per hour flames to simulate the temperatures of aircraft engines in flight. The rig can also simulate aircraft carrier and dusty desert operations where salt and sand can greatly reduce engine life and performance.
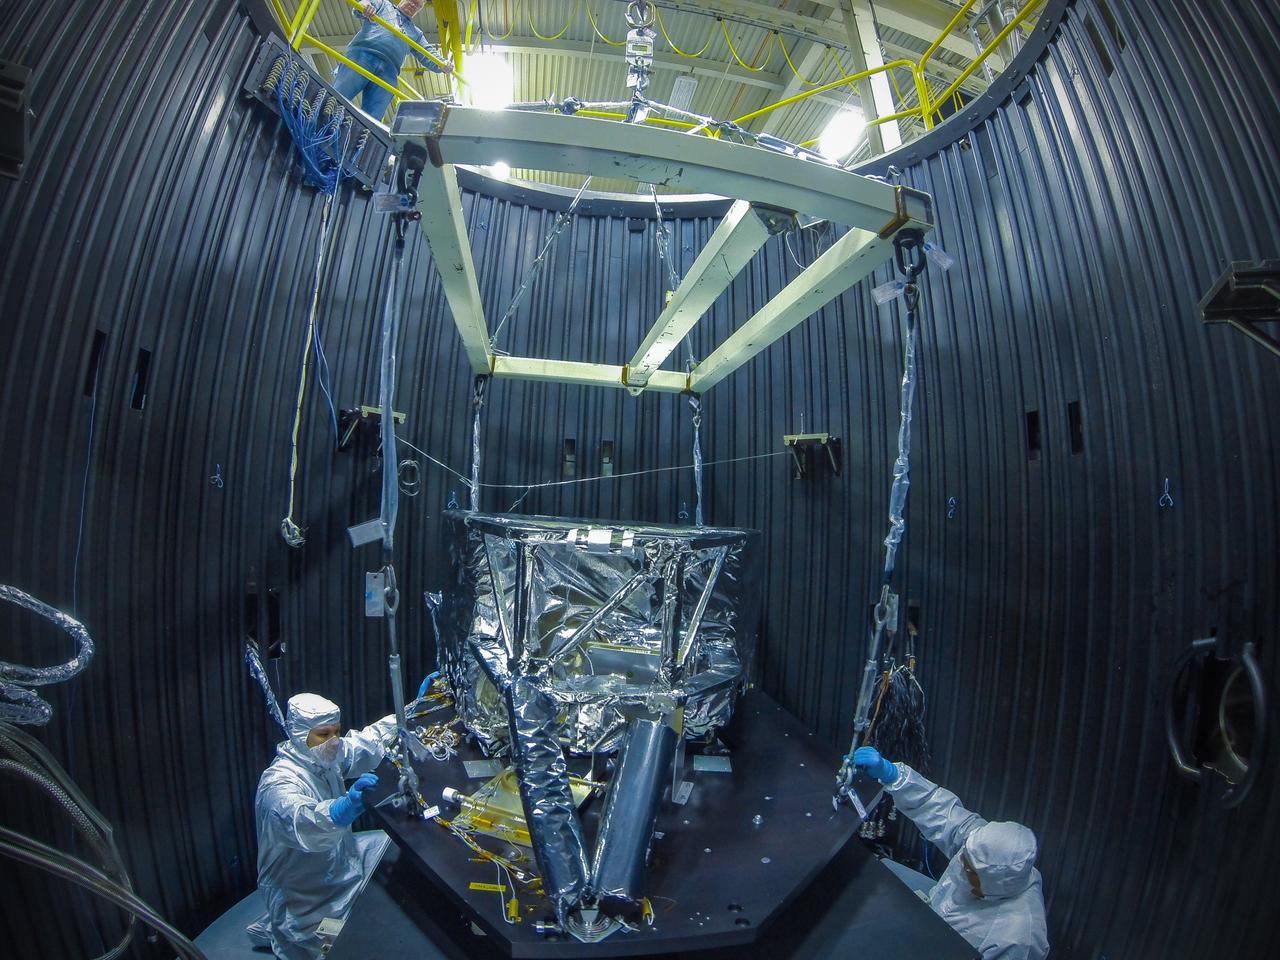
Goddard Technicians Tony Kiem (left) and George Mooney (right) guide the craned structure holding the Webb telescope's Mid-Infrared Instrument or MIRI Shield Environmental Test Unit into place in a cryogenic (cooling) test chamber. This shield will be used to simulate the MIRI instrument during prelaunch testing to verify that the MIRI cooling system will function properly in space. Goddard Safety Engineer Richard Bowlan watches from above. Image Credit: NASA/Chris Gunn <b><a href="http://www.nasa.gov/audience/formedia/features/MP_Photo_Guidelines.html" rel="nofollow">NASA image use policy.</a></b> <b><a href="http://www.nasa.gov/centers/goddard/home/index.html" rel="nofollow">NASA Goddard Space Flight Center</a></b> enables NASA’s mission through four scientific endeavors: Earth Science, Heliophysics, Solar System Exploration, and Astrophysics. Goddard plays a leading role in NASA’s accomplishments by contributing compelling scientific knowledge to advance the Agency’s mission. <b>Follow us on <a href="http://twitter.com/NASA_GoddardPix" rel="nofollow">Twitter</a></b> <b>Like us on <a href="http://www.facebook.com/pages/Greenbelt-MD/NASA-Goddard/395013845897?ref=tsd" rel="nofollow">Facebook</a></b> <b>Find us on <a href="http://instagram.com/nasagoddard?vm=grid" rel="nofollow">Instagram</a></b>
Martian Temperatures Measured by the Thermal Emission Spectrometer TES. Pathfinder Landing Aite View

Macro Photographs of 3D Print of NASA Meatball - Made out of GRX-810, an Oxide Dispersion Strengthened (ODS) High Temperature Alloy
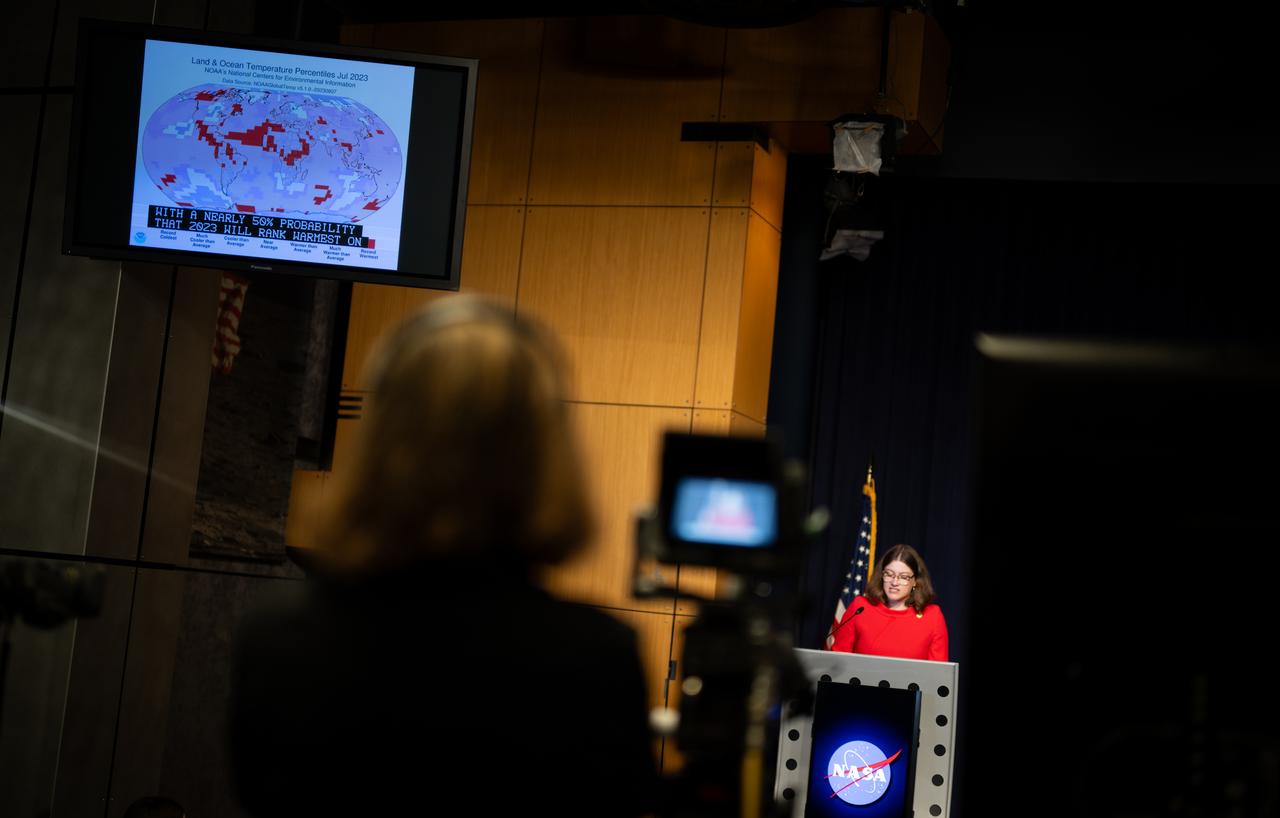
A graphic showing land and ocean temperature percentiles from July 2023 is seen on a monitor as Sarah Kapnick, Chief Scientist at the National Oceanic and Atmospheric Administrator (NOAA), speaks during a news conference to discuss the latest global temperature data, Monday, Aug. 14, 2023, at the Mary W. Jackson NASA Headquarters building in Washington. Photo Credit: (NASA/Joel Kowsky)
The year 2014 now ranks as the warmest on record since 1880, according to an analysis by NASA scientists. Nine of the 10 warmest years since modern records began have now occurred since 2000, according to a global temperature analysis by scientists at NASA’s Goddard Institute for Space Studies in New York. 2014’s record-breaking warmth continues a long-term trend of a warming climate. The global average temperature has increased about 1.4 degrees Fahrenheit (0.8 degrees Celsius) since 1880, with most of that warming occurring during the last three to four decades. The warming trend is largely driven by the increasing concentrations of carbon dioxide and other heat-trapping greenhouse gases in the atmosphere, caused by human emissions. Read more: <a href="http://1.usa.gov/1znaGfS" rel="nofollow">1.usa.gov/1znaGfS</a> <b><a href="http://www.nasa.gov/audience/formedia/features/MP_Photo_Guidelines.html" rel="nofollow">NASA image use policy.</a></b> <b><a href="http://www.nasa.gov/centers/goddard/home/index.html" rel="nofollow">NASA Goddard Space Flight Center</a></b> enables NASA’s mission through four scientific endeavors: Earth Science, Heliophysics, Solar System Exploration, and Astrophysics. Goddard plays a leading role in NASA’s accomplishments by contributing compelling scientific knowledge to advance the Agency’s mission. <b>Follow us on <a href="http://twitter.com/NASAGoddardPix" rel="nofollow">Twitter</a></b> <b>Like us on <a href="http://www.facebook.com/pages/Greenbelt-MD/NASA-Goddard/395013845897?ref=tsd" rel="nofollow">Facebook</a></b> <b>Find us on <a href="http://instagram.com/nasagoddard?vm=grid" rel="nofollow">Instagram</a></b>

Carlos Del Castillo, chief of the Ocean Ecology Laboratory at NASA’s Goddard Space Flight Center, speaks during a news conference to discuss the latest global temperature data, Monday, Aug. 14, 2023, at the Mary W. Jackson NASA Headquarters building in Washington. Photo Credit: (NASA/Joel Kowsky)

Kate Calvin, NASA Chief Scientist and senior climate advisor, speaks during a news conference to discuss the latest global temperature data, Monday, Aug. 14, 2023, at the Mary W. Jackson NASA Headquarters building in Washington. Photo Credit: (NASA/Joel Kowsky)

Kate Calvin, NASA Chief Scientist and senior climate advisor, answers a question during a news conference to discuss the latest global temperature data, Monday, Aug. 14, 2023, at the Mary W. Jackson NASA Headquarters building in Washington. Photo Credit: (NASA/Joel Kowsky)

Gavin Schmidt, director of NASA’s Goddard Institute for Space Studies in New York, is seen on a monitor as he speaks during a news conference to discuss the latest global temperature data, Monday, Aug. 14, 2023, at the Mary W. Jackson NASA Headquarters building in Washington. Photo Credit: (NASA/Joel Kowsky)

Carlos Del Castillo, chief of the Ocean Ecology Laboratory at NASA’s Goddard Space Flight Center, speaks during a news conference to discuss the latest global temperature data, Monday, Aug. 14, 2023, at the Mary W. Jackson NASA Headquarters building in Washington. Photo Credit: (NASA/Joel Kowsky)

Jonathan Lopez works on a hypersonic Fiber Optic Sensing System at NASA’s Armstrong Flight Research Center in Edwards, California, on Feb. 13, 2025. The system measures strain and temperature, critical safety data for hypersonic vehicles that travel five time the speed of sound.

NASA Administrator Bill Nelson, upper right, is seen on a monitor as he speaks during a news conference to discuss the latest global temperature data, Monday, Aug. 14, 2023, at the Mary W. Jackson NASA Headquarters building in Washington. Photo Credit: (NASA/Joel Kowsky)

NASA Press Secretary Jackie McGuinness moderates a news conference to discuss the latest global temperature data, Monday, Aug. 14, 2023, at the Mary W. Jackson NASA Headquarters building in Washington. Photo Credit: (NASA/Joel Kowsky)
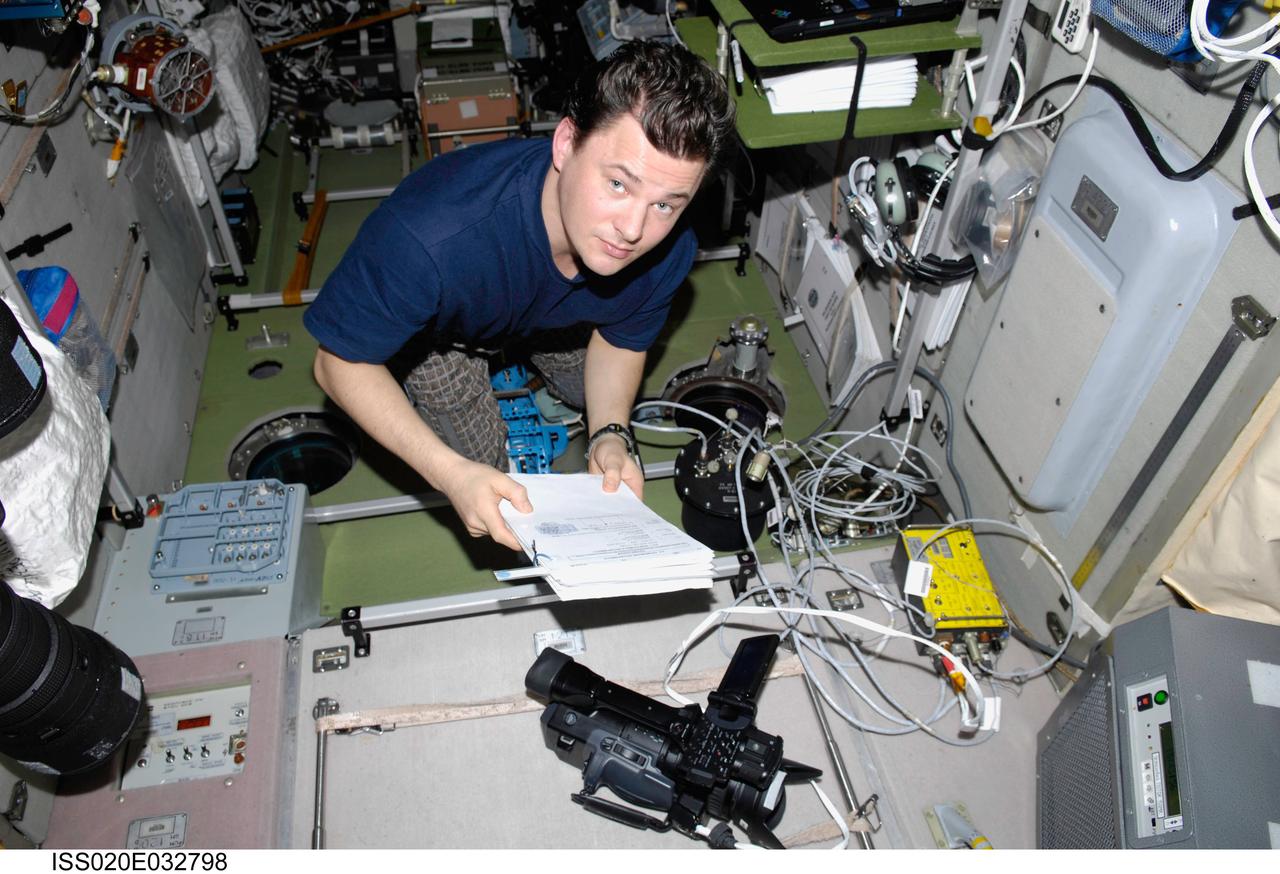
ISS020-E-032798 (21 Aug. 2009) --- Cosmonaut Roman Romanenko, Expedition 20 flight engineer, works with video equipment and a Russian payload TkhN-7 Self-Propagating High-Temperature Synthesis in the Zvezda Service Module of the International Space Station.
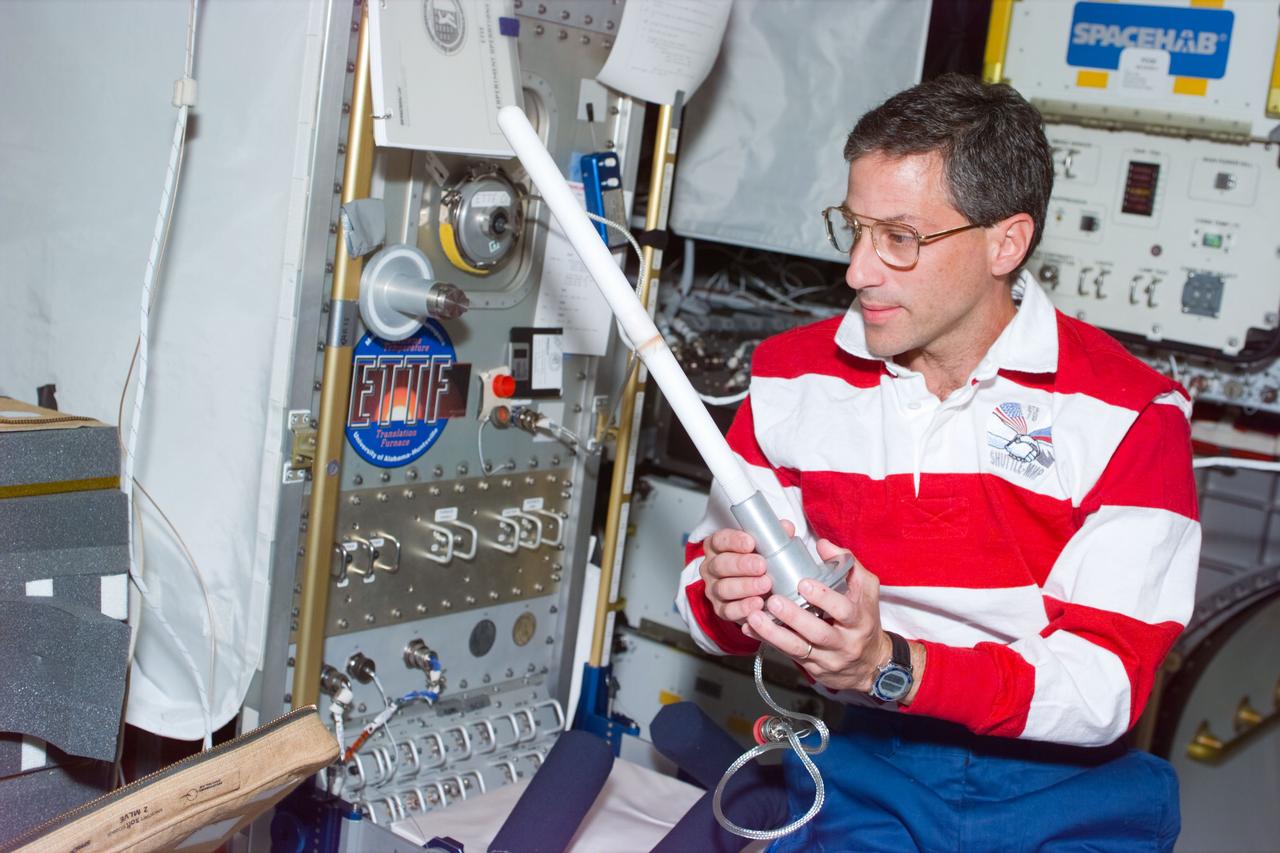
STS79-E-5275 (16 - 26 September 1996) --- Aboard the Spacehab double module in the Space Shuttle Atlantis' cargo bay, astronaut Jerome (Jay) Apt, mission specialist, checks a sample from the Extreme Temperature Translation Furnace (ETTF) experiment. The photograph was taken with the Electronic Still Camera (ESC).

Sarah Kapnick, Chief Scientist at the National Oceanic and Atmospheric Administration, answers a question during a news conference to discuss the latest global temperature data, Monday, Aug. 14, 2023, at the Mary W. Jackson NASA Headquarters building in Washington. Photo Credit: (NASA/Joel Kowsky)
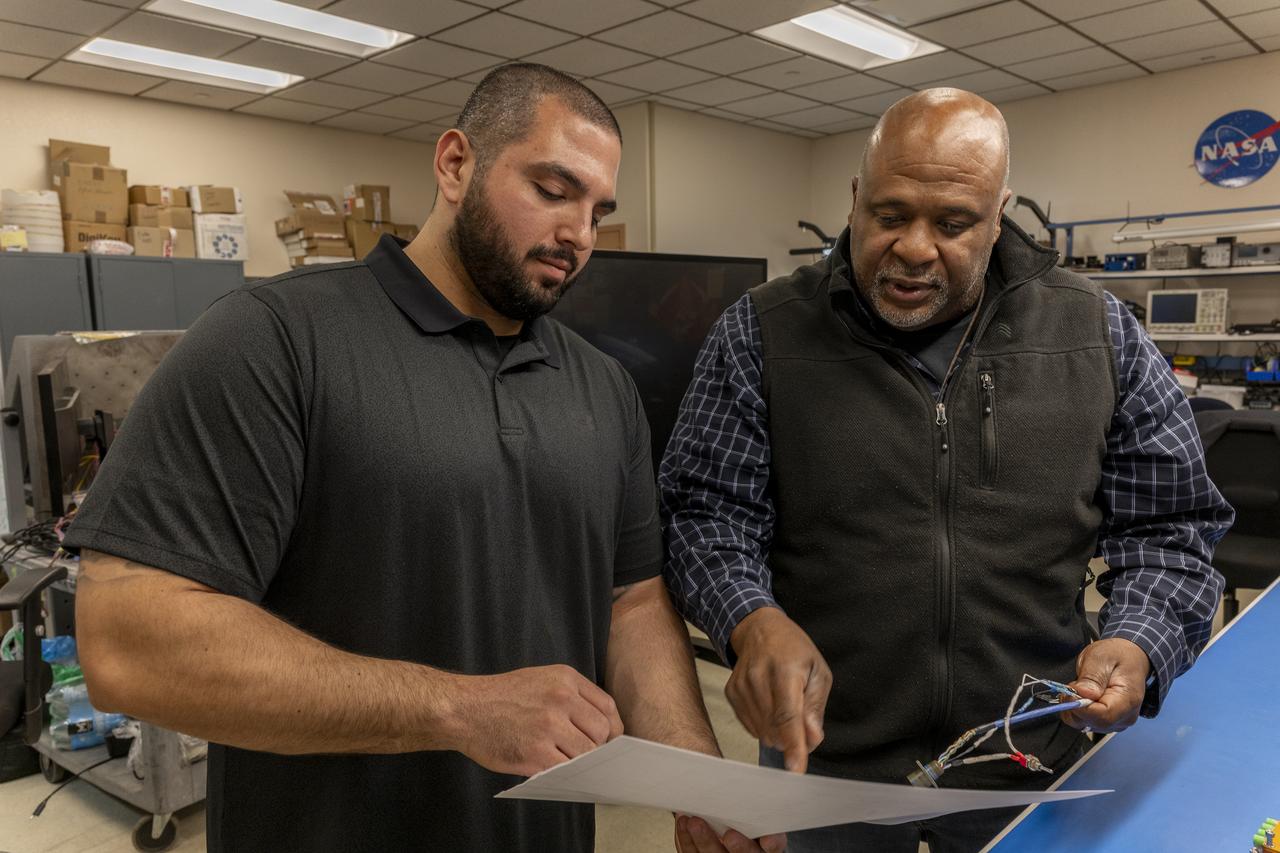
Jonathan Lopez and Allen Parker confer on the hypersonic Fiber Optic Sensor System at NASA’s Armstrong Flight Research Center in Edwards, California, on February 13, 2025. The system measures strain and temperature, critical safety data for hypersonic vehicles that travel five time the speed of sound.

Sarah Kapnick, Chief Scientist at the National Oceanic and Atmospheric Administration, speaks during a news conference to discuss the latest global temperature data, Monday, Aug. 14, 2023, at the Mary W. Jackson NASA Headquarters building in Washington. Photo Credit: (NASA/Joel Kowsky)
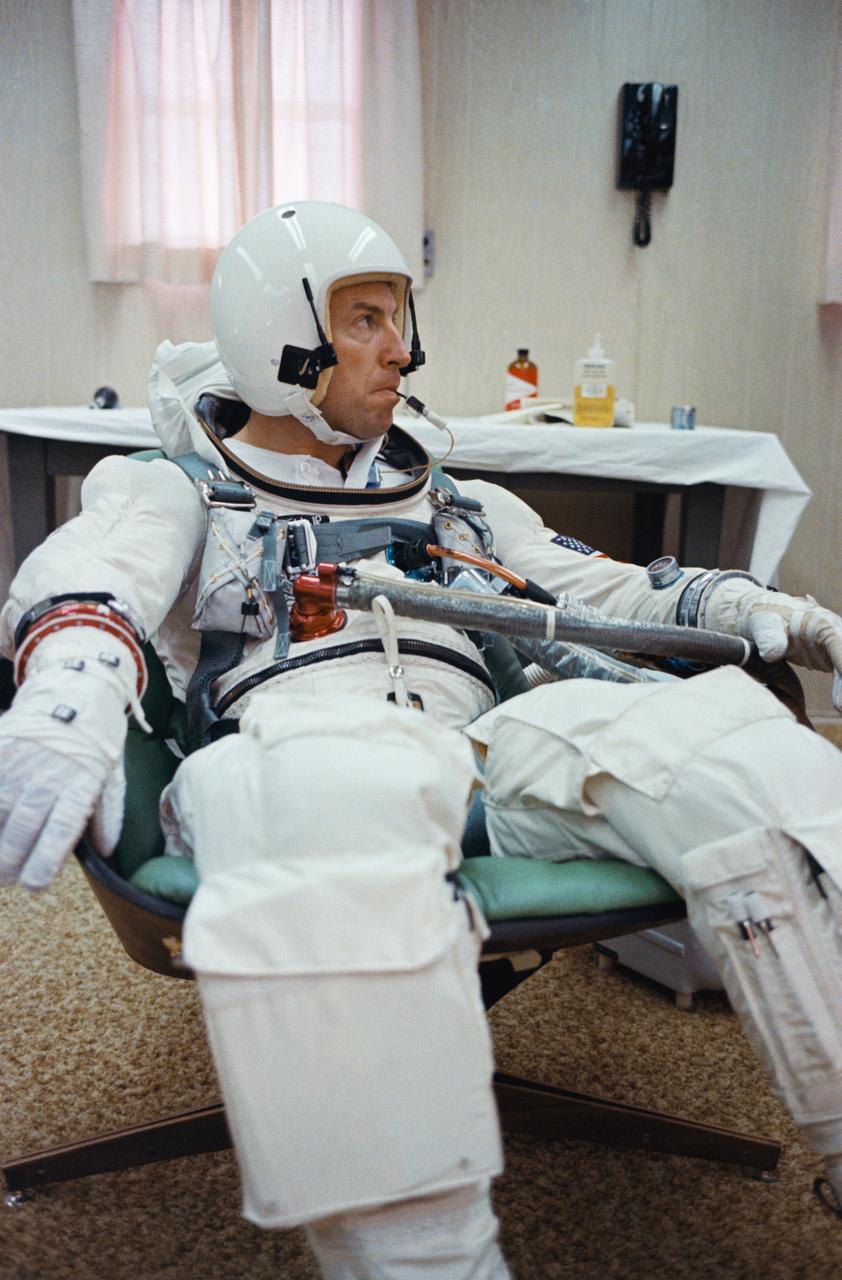
S65-59934 (4 Dec. 1965) --- Gemini-7 pilot James A. Lovell Jr. has a temperature check with an oral temperature probe attached to his spacesuit during a final preflight preparations for the Gemini-7 space mission. The National Aeronautics and Space Administration has planned a 14-day mission for the Gemini-7. The temperature probe allows doctors to monitor astronauts' body temperature at any time during the mission. Photo credit: NASA
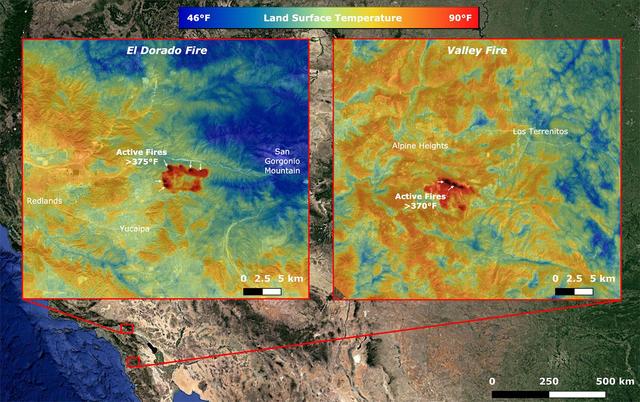
On Sept. 6, NASA's ECOsystem Spaceborne Thermal Radiometer Experiment on Space Station (ECOSTRESS) imaged active fires across California, including the El Dorado fire near Yucaipa and the Valley fire in Japatul Valley in the southern part of the state. As of Sept. 8, there were 25 major wildfires burning in California. Both images, taken at 12:13 a.m. PDT (3:13 a.m. EDT), show multiple concentrated areas of surface temperatures (in red) higher than 375 degrees Fahrenheit (191 degrees Celsius). These high temperature regions were likely where the active fires were occurring. The surrounding areas show abnormally warm middle-of-the-night background surface temperatures (orange) due to the ongoing heat wave. https://photojournal.jpl.nasa.gov/catalog/PIA23788
This image shows average temperatures in April, 2003, observed by AIRS at an infrared wavelength that senses either the Earth's surface or any intervening cloud. Similar to a photograph of the planet taken with the camera shutter held open for a month, stationary features are captured while those obscured by moving clouds are blurred. Many continental features stand out boldly, such as our planet's vast deserts, and India, now at the end of its long, clear dry season. Also obvious are the high, cold Tibetan plateau to the north of India, and the mountains of North America. The band of yellow encircling the planet's equator is the Intertropical Convergence Zone (ITCZ), a region of persistent thunderstorms and associated high, cold clouds. The ITCZ merges with the monsoon systems of Africa and South America. Higher latitudes are increasingly obscured by clouds, though some features like the Great Lakes, the British Isles and Korea are apparent. The highest latitudes of Europe and Eurasia are completely obscured by clouds, while Antarctica stands out cold and clear at the bottom of the image. http://photojournal.jpl.nasa.gov/catalog/PIA00427
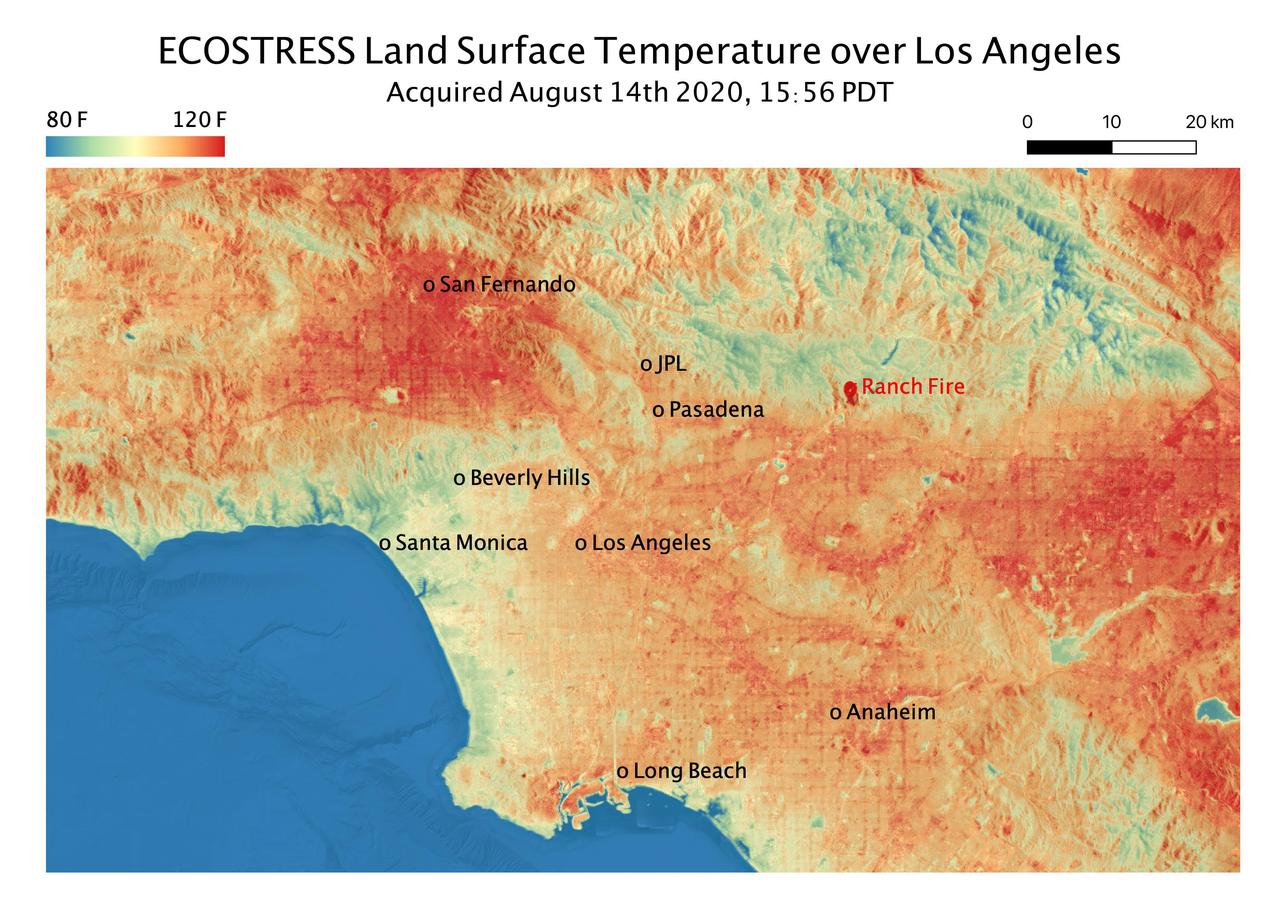
This temperature map shows the land surface temperatures throughout Los Angeles County on Aug. 14, 2020. The observation was made possible by NASA's Ecosystem Spaceborne Thermal Radiometer Experiment on Space Station (ECOSTRESS), which measured a peak land surface temperature in the San Fernando Valley, northwest of downtown Los Angeles, of 128.3 degrees Fahrenheit (53.5 degrees Celsius). ECOSTRESS collected this data as the space station passed over California at about 3:56 p.m. PDT (6:56 p.m. EDT) during a record-breaking heat wave that gripped the region. The Ranch fire, that burned near the city of Azuza was also detected by ECOSTRESS. With a resolution of about 77 by 77 yards (70 by 70 meters), the image enables the study of surface-temperature conditions down to the size of a football field. The hottest temperatures are shown in dark red, with the coolest temperatures in blue. ECOSTRESS measures the temperature of plants as they heat up when they run out of water. But it can also measure and track heat-related phenomena like heat waves, fires, and volcanoes. https://photojournal.jpl.nasa.gov/catalog/PIA23786
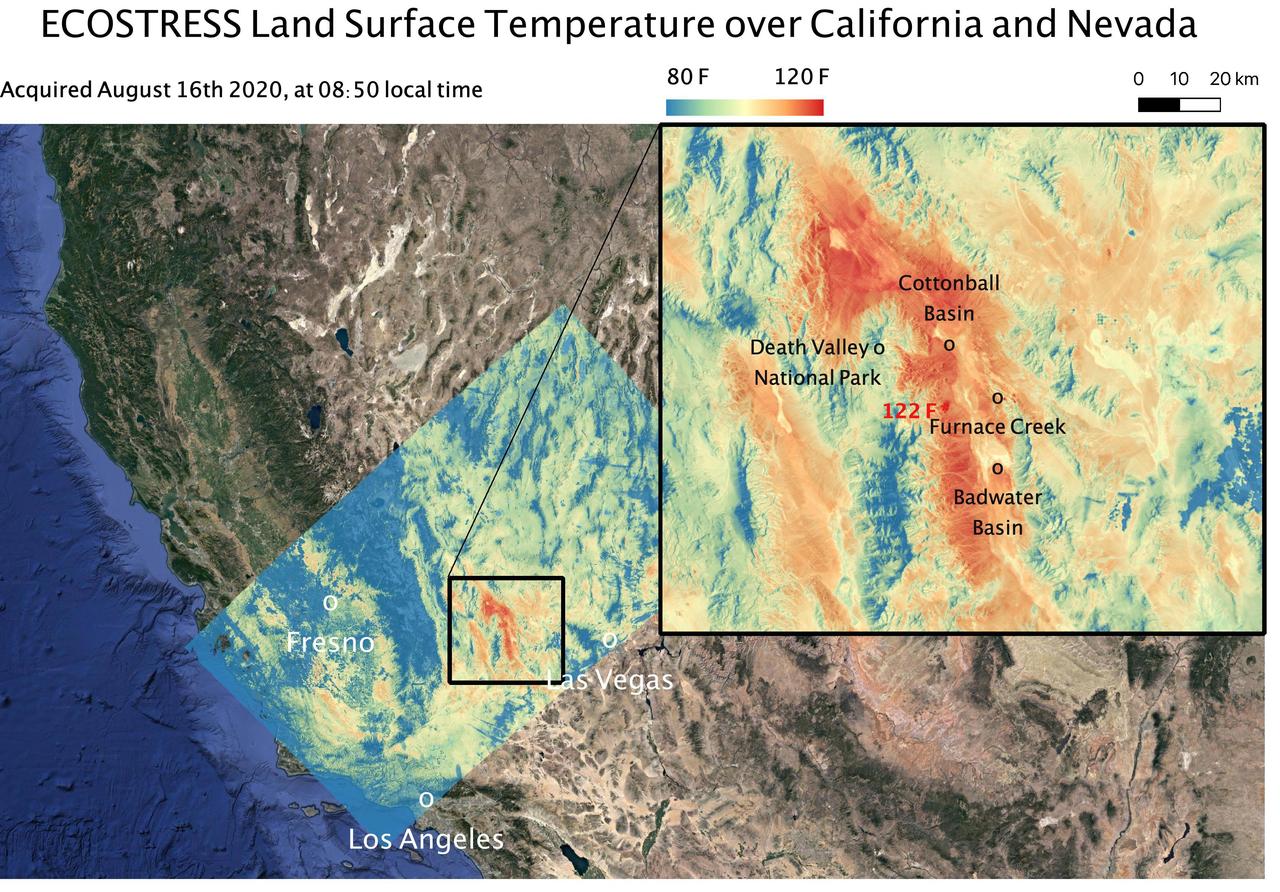
This temperature map shows the land surface temperatures around Death Valley in California's Mojave Desert on Aug. 16, 2020. The observation was made possible by NASA's Ecosystem Spaceborne Thermal Radiometer Experiment on Space Station (ECOSTRESS), which measured a peak land surface temperature of 122.52 degrees Fahrenheit (50.29 degrees Celsius) near Furnace Creek. ECOSTRESS collected this data when the space station passed over California at about 8:50 a.m. PDT (11:50 a.m. EDT) during a record-breaking heat wave that gripped the region. With a resolution of about 77 by 77 yards (70 by 70 meters), the image enables the study of surface-temperature conditions down to the size of a football field. The hottest temperatures are shown in dark red, with the coolest temperatures in blue. ECOSTRESS measures the temperature of plants as they heat up when they run out of water. But it can also measure and track heat-related phenomena like heat waves, fires, and volcanoes. https://photojournal.jpl.nasa.gov/catalog/PIA23787
Allen Parker, Mark Hagiwara, Paul Bean, Patrick Chan, Jonathan Lopez (seated), and Frank Pena comprise the Fiber Optic Sensing System team at NASA’s Armstrong Flight Research Center, in Edwards, California. The systems on the table measure strain and temperature, critical safety data for hypersonic vehicles that travel five time the speed of sound.
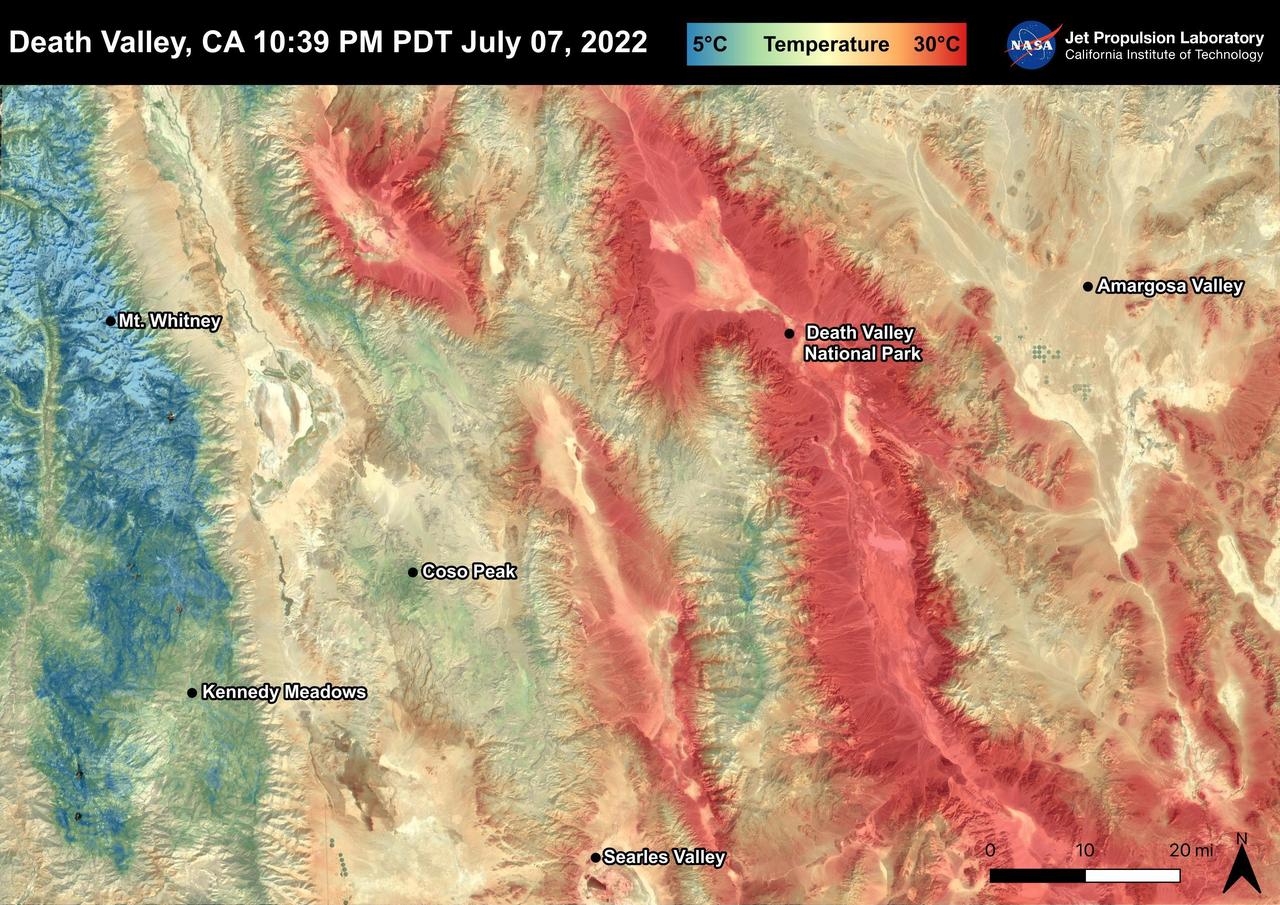
Death Valley, California is a desert valley in the Northern Mojave Desert. During the summer months, Death Valley can become one of the hottest places on Earth. Death Valley is about 85 miles from Mt. Whitney, the highest point in the contiguous United States with an elevation of 14,505 ft. This Land Surface Temperature image captured by ECOSTRESS on July 07, 2022 shows temperatures exceeding 90 degrees Fahrenheit in Death Valley and temperatures below 40 degrees Fahrenheit in the Sierra Nevada Mountain Range. ECOSTRESS is a thermal instrument on the International Space Station that measures the temperature of the ground, which is hotter than the air temperature during the day. It was launched to the space station in 2018. Its primary mission is to identify critical thresholds of water use and water stress in plants and to detect the timing, location, and predictive factors leading to plant water uptake decline and/or cessation. The nature of the high-resolution data provided by ECOSTRESS allows it to record heat related phenomena such as heat waves and wildfires. https://photojournal.jpl.nasa.gov/catalog/PIA25482

This image combines two products from the first pointing at the Martian moon Phobos by the Thermal Emission Imaging System (THEMIS) camera on NASA's Mars Odyssey orbiter, on Sept. 29, 2017. Surface-temperature information from observation in thermal-infrared wavelengths is overlaid on a more detailed image from a visible-light observation. The left edge of the small moon was in darkness, and the right edge in morning sunlight. Phobos has an oblong shape with average diameter of about 14 miles (22 kilometers). The distance to Phobos from Odyssey during the observation was about 3,424 miles (5,511 kilometers). Researchers will analyze the surface-temperature information from this observation and possible future THEMIS observations to learn how quickly the surface warms after sunup or cools after sundown. That could provide information about surface materials, because larger rocks heat or cool more slowly than smaller particles do. The thermal information in this image is from merging observations made in four thermal-infrared wavelength bands, centered from 11.04 microns to 14.88 microns. Researchers have been using THEMIS to examine Mars since early 2002, but the maneuver turning the orbiter around to point the camera at Phobos was developed only recently. Odyssey orbits Mars at an altitude of about 250 miles (400 kilometers), much closer to the planet than to Phobos, which orbits about 3,700 miles (6,000 kilometers) above the surface of Mars. https://photojournal.jpl.nasa.gov/catalog/PIA22057
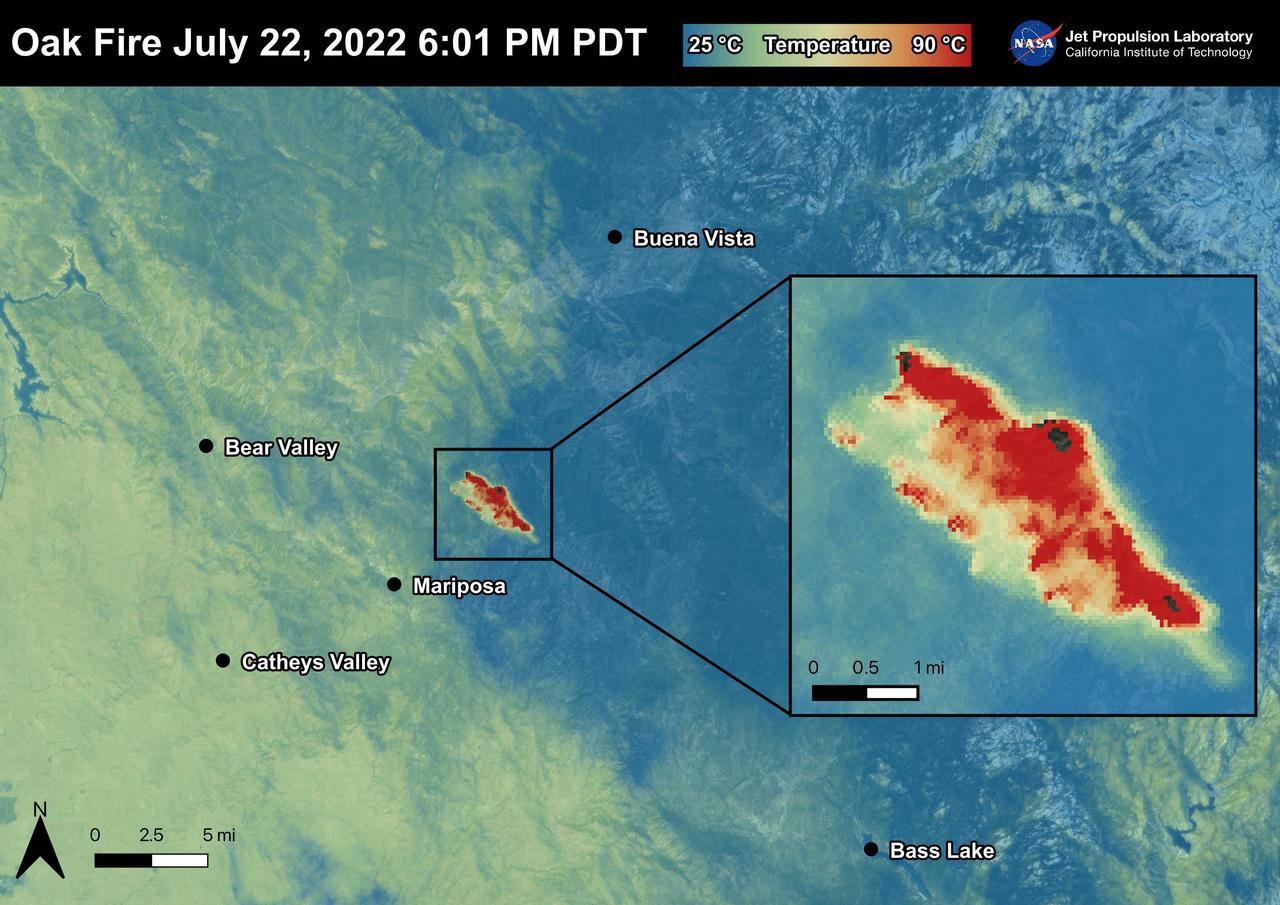
The Oak Fire started on July 22nd, 2022 at 2:10 PM PDT near Carstens Road and Highway 140 in Mariposa County, west of Yosemite. The fire has burned over 19,000 acres. In the first few days of the Oak Fire, over 1,400 structures were threatened, 3 were damaged, and 41 destroyed. Evacuation orders and road closures were issued throughout the region. The Oak Fire was captured in an ECOSTRESS Land Surface Temperature image on July 22nd with temperatures exceeding 90 degrees Celsius. ECOSTRESS is a thermal instrument on the International Space Station that measures the temperature of the ground, which is hotter than the air temperature during the day. It was launched to the space station in 2018. Its primary mission is to identify critical thresholds of water use and water stress in plants and to detect the timing, location, and predictive factors leading to plant water uptake decline and/or cessation. The nature of the high-resolution data provided by ECOSTRESS allows it to record heat related phenomena such as heat waves and wildfires. https://photojournal.jpl.nasa.gov/catalog/PIA25481
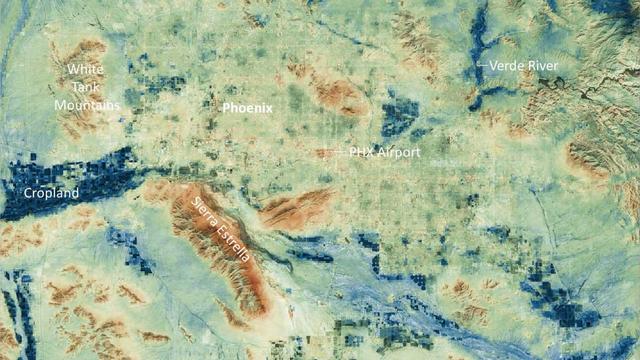
Researchers at NASA's Jet Propulsion Laboratory have created a series of maps showing land-surface temperatures in the Phoenix area in July 2023, when the city experienced a record-breaking run of hot weather. The images reveal the cumulative effect – overnight and across the month – of relentless daytime heating. The data was captured during overnight hours (around 2 a.m.) on several days in July by an instrument called the Visible Infrared Imaging Radiometer Suite (VIIRS) aboard the NOAA-NASA Suomi National Polar-orbiting Partnership (Suomi NPP) satellite managed by the National Oceanic and Atmospheric Administration and NASA. The images show how built surfaces – roads, buildings, airport runways, and the like – retain heat, sometimes hovering around 100 degrees Fahrenheit (38 degrees Celsius) for hours after sunset. From July 1 to July 19, the built surfaces in the maps grew progressively hotter, likely the combined effect of the heat wave intensifying and the cumulative heating of those human-made structures. Due to their high heat capacity, these surfaces didn't fully cool overnight before the onset of the next day's heat. At the center of the images is Phoenix's Sky Harbor International Airport, where VIIRS measured the hottest land-surface temperature within the city. The airport is also where Phoenix takes its official air temperature. By those measurements, the city experienced the hottest month on record in July, including a record 31 consecutive days in which the temperature exceeded 110 degrees Fahrenheit (43.3 degrees Celsius). The previous record was 18 days. Land-surface temperatures in cities are usually warmer than in rural and undeveloped areas because of human activities and the materials used for building. Streets – seen in these maps as a grid pattern – are often the hottest part of the built environment due to dark asphalt paving that absorbs more sunlight than lighter-colored surfaces; asphalt absorbs up to 95% of solar radiation. In the images, the mountains near Phoenix are also notably hot due to their angle to the Sun and greater soil exposure from lack of vegetation. The hot surfaces in and around the city stand in contrast to nearby irrigated surfaces such as agricultural fields, golf courses, and parks, which fell as low as 68 degrees Fahrenheit (18.9 degrees Celsius) during the night. The Verde River and other nearby waterways also were significantly cooler. VIIRS is one of five instruments aboard the NOAA-NASA Suomi NPP satellite. Short for Suomi National Polar-orbiting Partnership, the spacecraft is one of several in the Joint Polar Satellite System. The images were produced from the VNP21IMG Land Surface Temperature product, which is available at NASA's Land, Atmosphere Near-real-time Capability for EOS (LANCE). Animation available at https://photojournal.jpl.nasa.gov/catalog/PIA25868