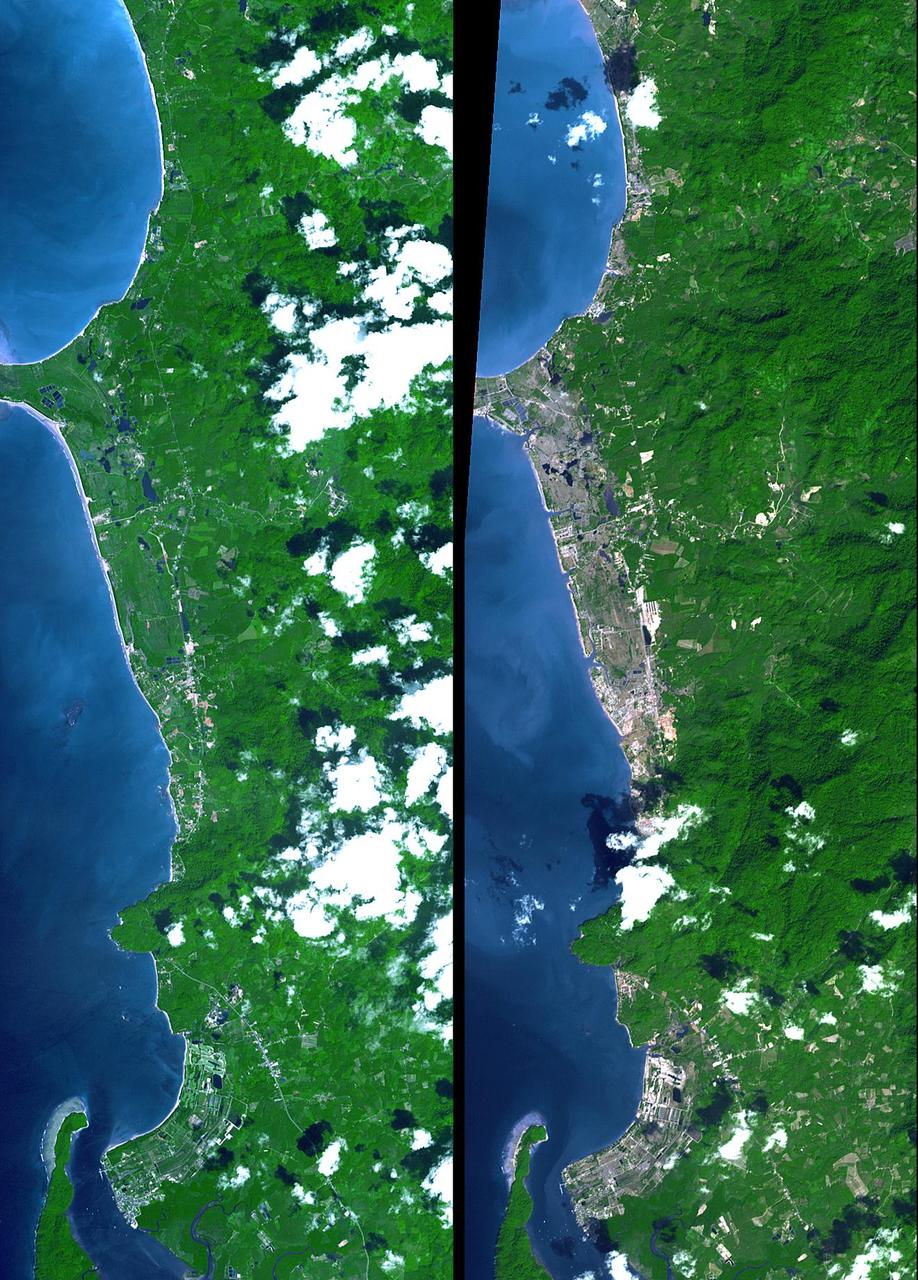
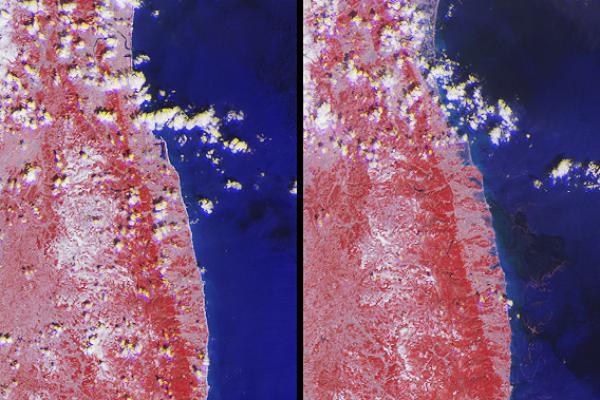
The island of Phuket on the Indian Ocean coast of Thailand is a major tourist destination and was also in the path of the tsunami that washed ashore on December 26, 2004. These simulated natural color ASTER images show a 27 kilometer (17-mile) long stretch of coast north of the Phuket airport on December 31 (right), along with an image acquired two years earlier (left). The changes along the coast are obvious where the vegetation has been stripped away. http://photojournal.jpl.nasa.gov/catalog/PIA07227
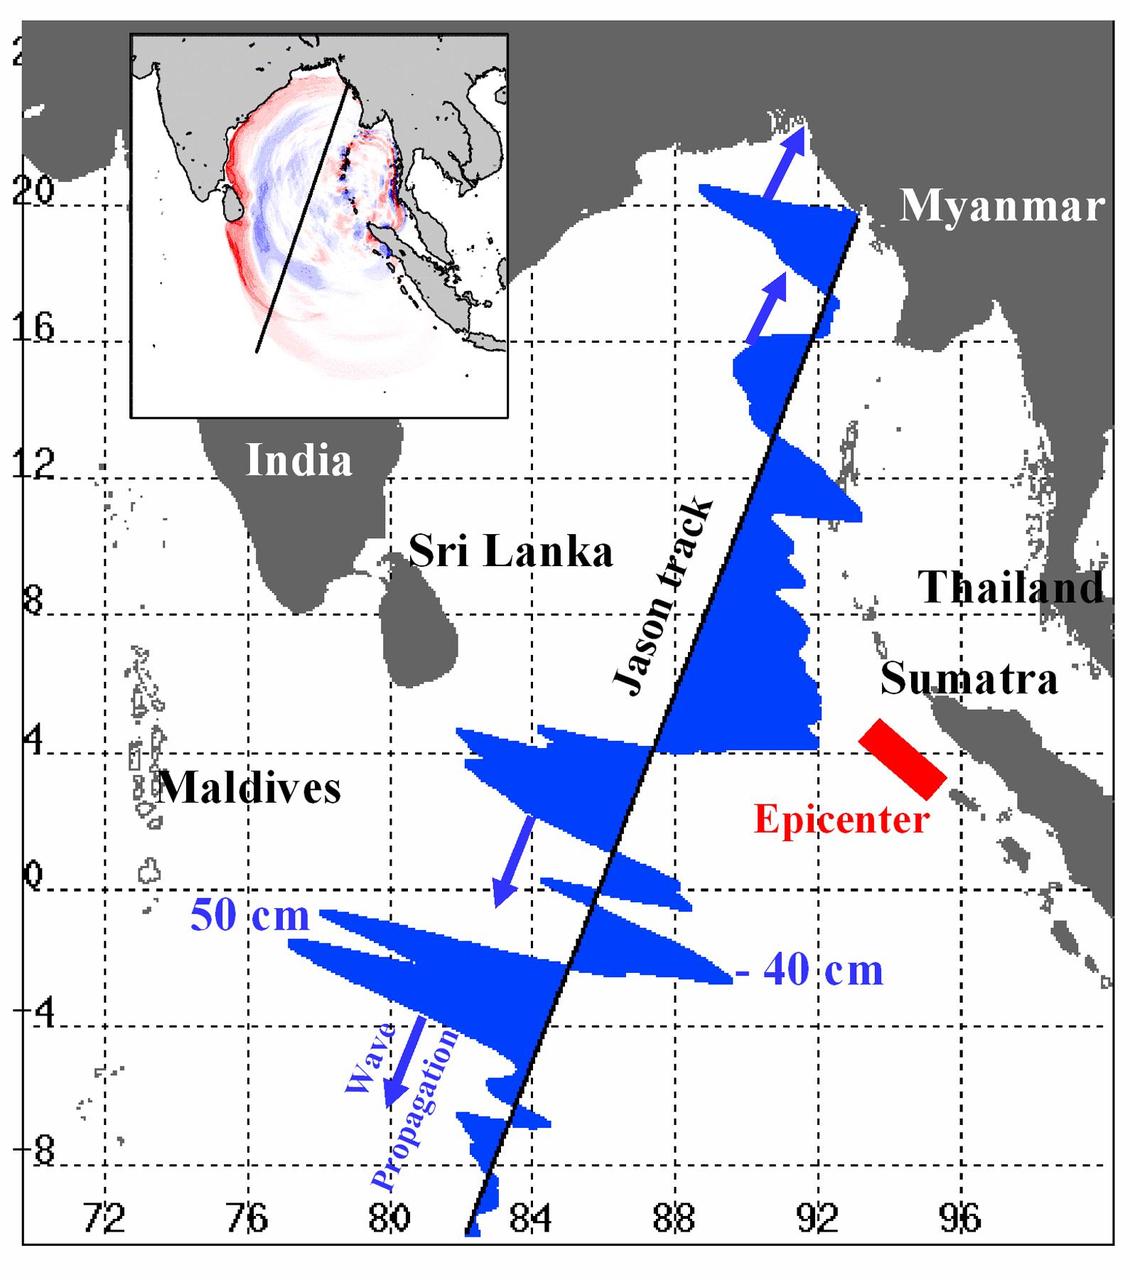
Displayed in blue color is the height of sea surface (shown in blue) measured by the Jason satellite two hours after the initial magnitude 9 earthquake hit the region (shown in red) southwest of Sumatra on December 26, 2004. The data were taken by a radar altimeter onboard the satellite along a track traversing the Indian Ocean when the tsunami waves had just filled the entire Bay of Bengal (see the model simulation inset image). The data shown are the changes of sea surface height from previous observations made along the same track 20-30 days before the earthquake, reflecting the signals of the tsunami waves. The maximum height of the leading wave crest was about 50 cm (or 1.6 ft), followed by a trough of sea surface depression of 40 cm. The directions of wave propagation along the satellite track are shown by the blue arrows. http://photojournal.jpl.nasa.gov/catalog/PIA07219
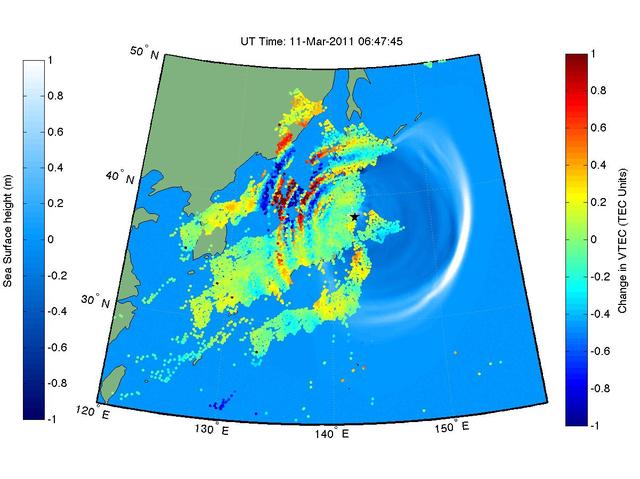
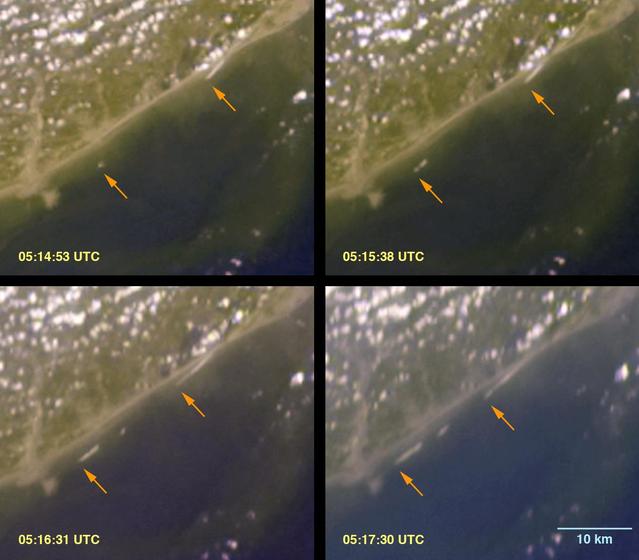
NASA Sees Tohoku-Oki Earthquake and Tsunami in Earth Upper Atmosphere
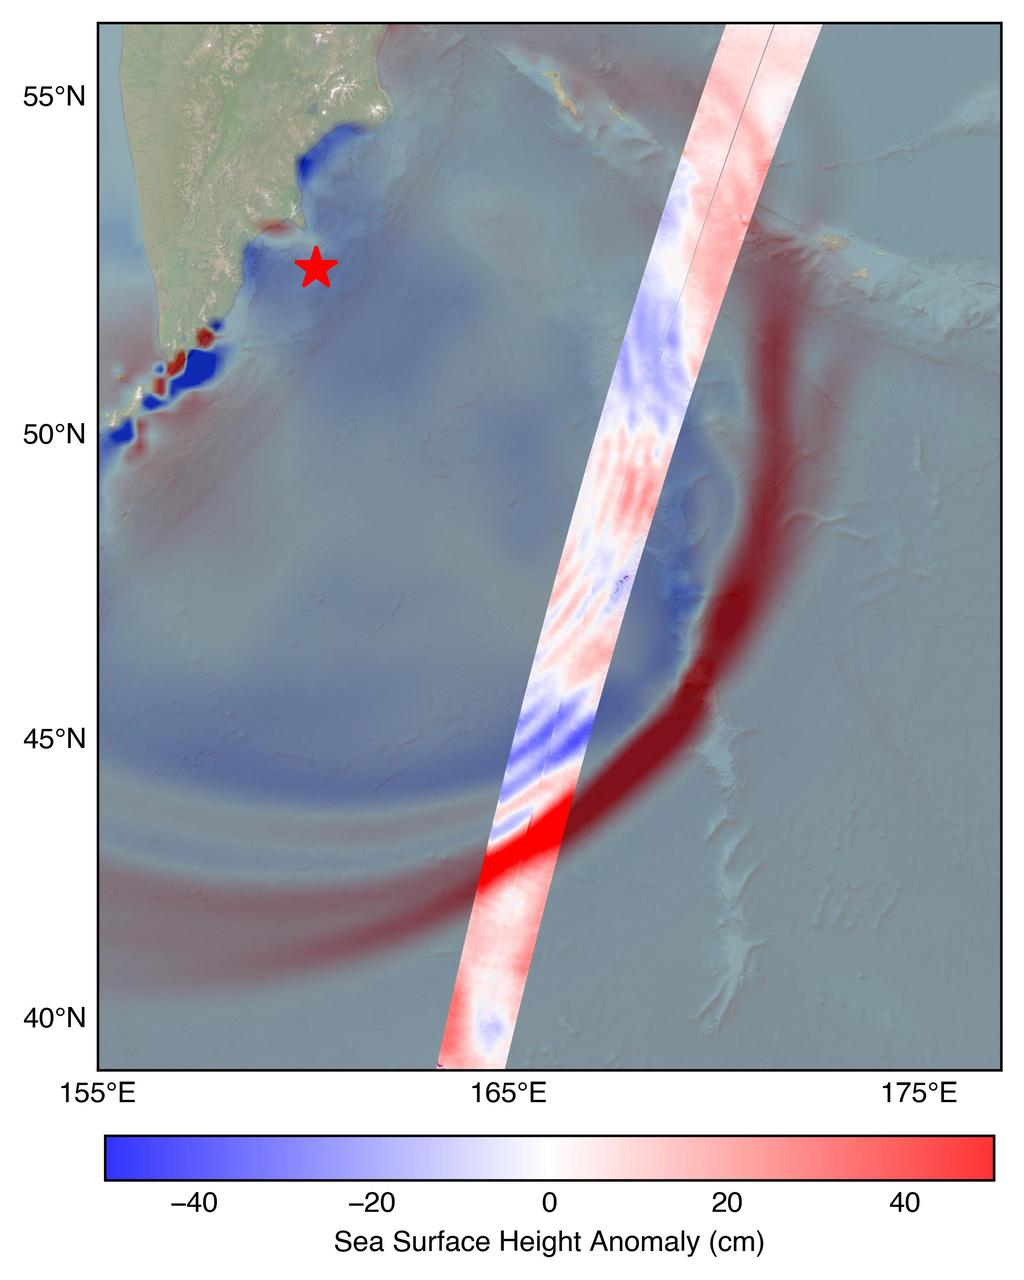
The U.S.-French SWOT (Surface Water and Ocean Topography) satellite captured the leading edge of a tsunami wave that rolled through the Pacific Ocean on July 30, 2025 (11:25 a.m. local time), in the wake of a magnitude 8.8 earthquake that struck Russia's Kamchatka Peninsula. The satellite captured the data about 70 minutes after the earthquake struck. The SWOT sea level measurements, shown in the highlighted swath from the satellite's ground track, is plotted against a tsunami forecast model from the National Oceanic and Atmospheric Administration (NOAA) Center for Tsunami Research in the background. A red star marks the location of the earthquake. The measurements show a wave height exceeding 1.5 feet (45 centimeters) as well as a look at the shape and direction of travel of the leading edge of the wave (indicated in red). Researchers noted that while the wave height might seem small, tsunamis extend from the seafloor to the ocean surface. A seemingly small wave in the open ocean can become much larger in shallower coastal waters. https://photojournal.jpl.nasa.gov/catalog/PIA26652

The Mar. 11, 2011, Tohoku, Japan earthquake and tsunami devastated a large extent of the northeastern Japan coast, and virtually erased many villages and cities from the map. NASA Terra spacecraft acquired this image of Sendai on Mar. 14, 2011.
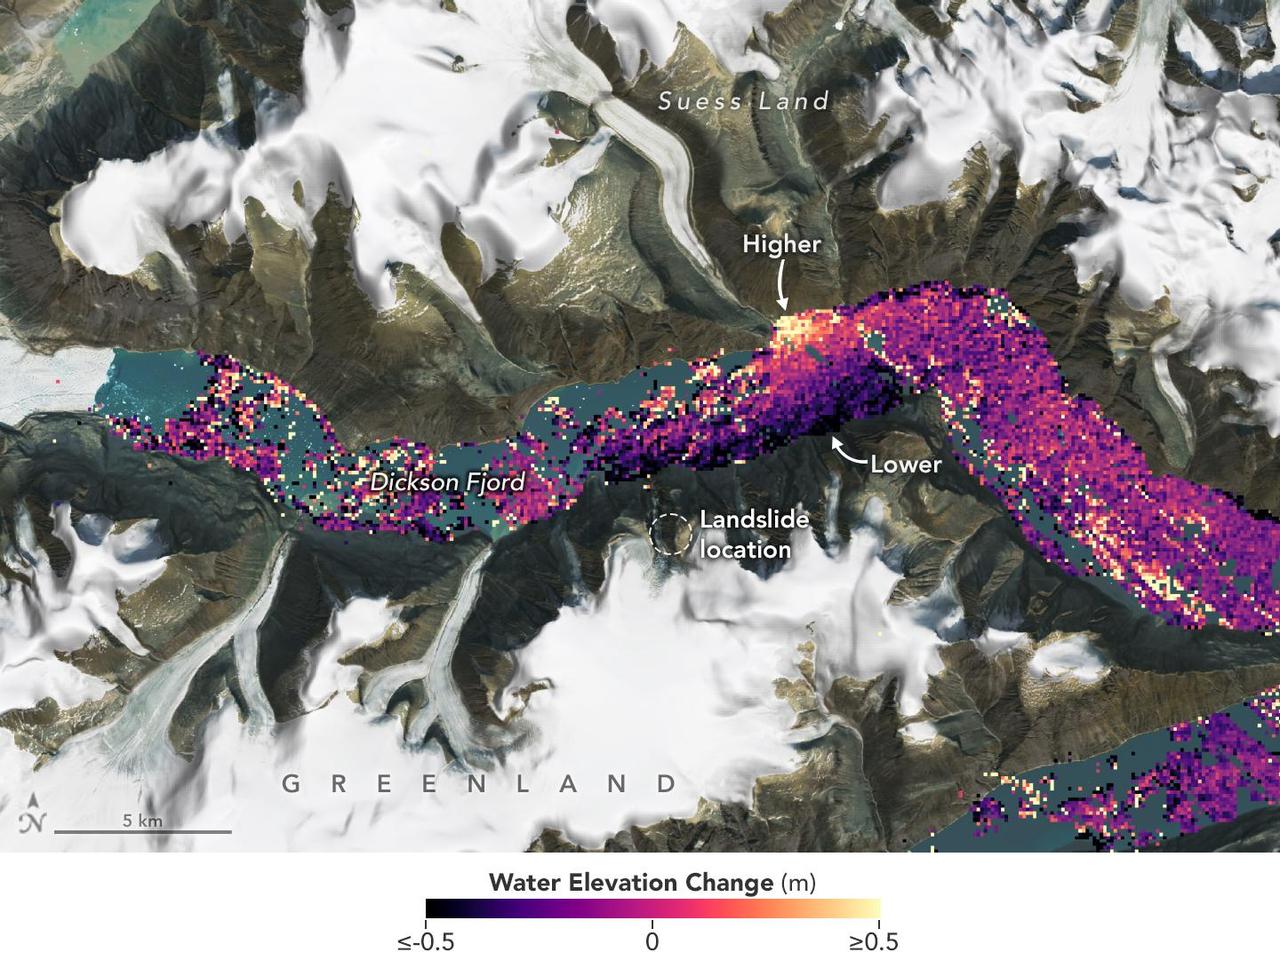
A visualization based on data from the international SWOT satellite mission shows the unique contours of a tsunami that sloshed within the steep walls of a fjord in Greenland in September 2023. Triggered by a massive landslide, the tsunami generated a seismic rumble that reverberated around the world for nine days. Short for Surface Water and Ocean Topography, SWOT collected water elevation measurements in the Dickson Fjord on Sept. 17, 2023, the day after the initial landslide and tsunami. The data was compared with measurements made under normal conditions a few weeks prior, on Aug. 6, 2023. Colors toward the lighter end of the scale indicate higher water levels, and darker colors indicate lower-than-normal levels. The data suggest that water levels at some points along the north side of the fjord were as much as 4 feet (1.2 meters) higher than on the south. In a September 2024 paper in Science, researchers traced a seismic signal back to the tsunami, which began when more than 880 million cubic feet of rock and ice (25 million cubic meters) fell into the Dickson Fjord. Part of a network of channels on Greenland's eastern coast, the fjord is about 1,772 feet (540 meters) deep and 1.7 miles (2.7 kilometers) wide, with walls taller than 6,000 feet (1,830 meters). Far from the open ocean, in a confined space, the energy of the tsunami's motion had limited opportunity to dissipate, so the wave moved back and forth about every 90 seconds for nine days. It caused tremors recorded on seismic instruments thousands of miles away. Launched in December 2022 from Vandenberg Space Force Base in central California, SWOT is now in its operations phase, collecting data that will be used for research and other purposes. https://photojournal.jpl.nasa.gov/catalog/PIA26420

This before-and-after image pair acquired by NASA Terra spacecraft of the Japan coastal cities of Ofunato and Kesennuma reveals changes to the landscape that are likely due to the effects of the tsunami on March 11, 2011. The new image is on the left.
The extent of inundation from the destructive and deadly tsunami triggered by the March 11, 2011, magnitude 8.9 earthquake centered off Japan northeastern coast east of the city of Sendai is revealed in this image pair from NASA Terra spacecraft.
The initial tsunami waves resulting from the undersea earthquake that occurred at 00:58:53 UTC Coordinated Universal Time on 26 December 2004 off the island of Sumatra, Indonesia, as seen by NASA Terra spacecraft.

ISS010-E-12730 (11 January 2005) --- One of a series of post-tsunami digital still images photographed from the International Space Station on January 11, 2005. This image is centered at 4.53 degrees north latitude and 95.75 degrees east longitude and is the northwest coast of Sumatra. Some tsunami damage, at least in the form of the lack of vegetation, can be seen along the coast.
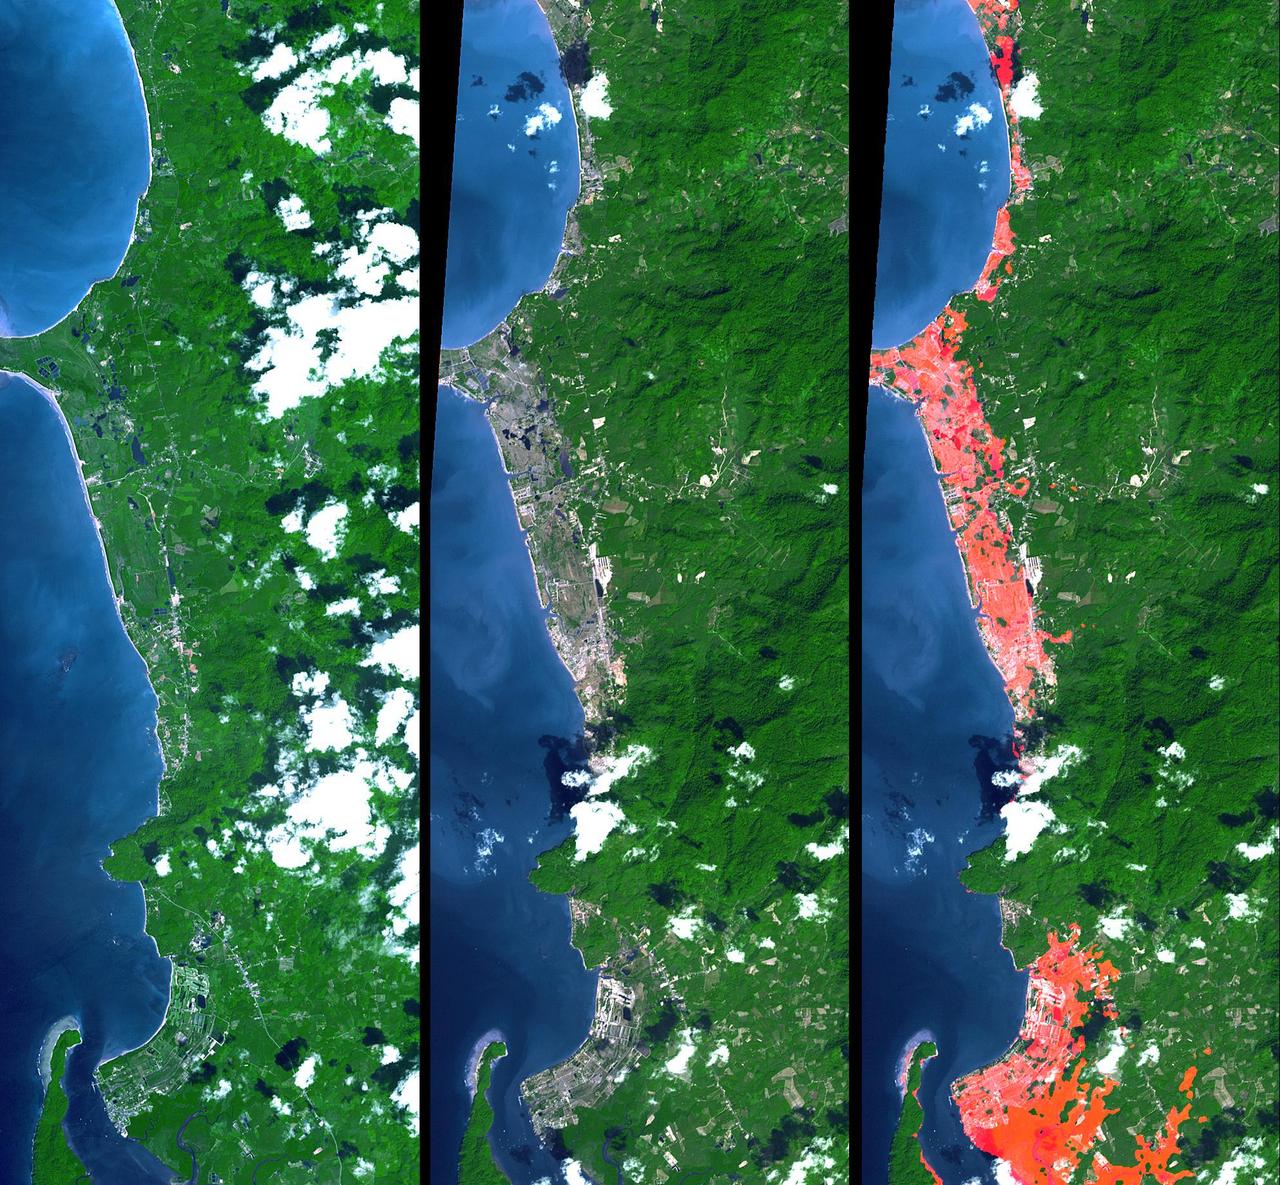
This image from NASA Terra spacecraft shows the Indian Ocean coastline north of Phuket, Thailand is a major tourist destination that was in the path of the tsunami produced by a giant offshore earthquake on December 26, 2004.

This poster highlights NASA JPL missions that provide important inputs to research on volcanoes, fires, earthquakes, droughts, tsunamis, floods and hurricanes.

ISS010-E-12927 (13 January 2005) --- One of a series of post-tsunami digital still images which were photographed from the International Space Station on January 13, 2005. This image is centered at 14.24 degrees north latitude and 80.12 east longitude and is in the Madras, India area, which sustained tsunami damage.

ISS010E12880 (13 January 2005) --- One of a series of post-tsunami digital still images which were photographed from the International Space Station on January 13, 2005 . This image is centered at 4.04 degrees north latitude and 96.28 degrees east longitude on the northwest coast of Sumatra. According to NASA scientists studying the ISS imagery, the frame shows a devegetated coastal condition, caused by the tsunami.

ISS010E12929 (13 January 2005) --- One of a series of post-tsunami digital still images which were photographed from the International Space Station on January 13, 2005. This image is centered at 14.41 degrees north latitude and 80.15 degrees east longitude and is located just south of Chennai (Madras) India. Scientists studying the ISS imagery have discerned a slight discoloration in coastal vegetation, likely caused by the December 2004 tsunami.

ISS010E12884 (13 January 2005) --- One of a series of post-tsunami digital still images which were photographed from the International Space Station on January 13, 2005 . This image is centered at 4.16 degrees north latitude and 96.15 degrees east longitude on the northwest coast of Sumatra. According to NASA scientists studying the ISS imagery, the frame shows a devegetated coastal condition, caused by the tsunami.

ISS010E12876 (13 January 2005) --- One of a series of post-tsunami digital still images which were photographed from the International Space Station on January 13, 2005. This image is centered at 4.07 degrees north latitude and 96.23 degrees east longitude on the northwest coast of Sumatra. According to NASA scientists studying the ISS imagery, the frame shows a devegetated coastal condition, caused by the tsunami.
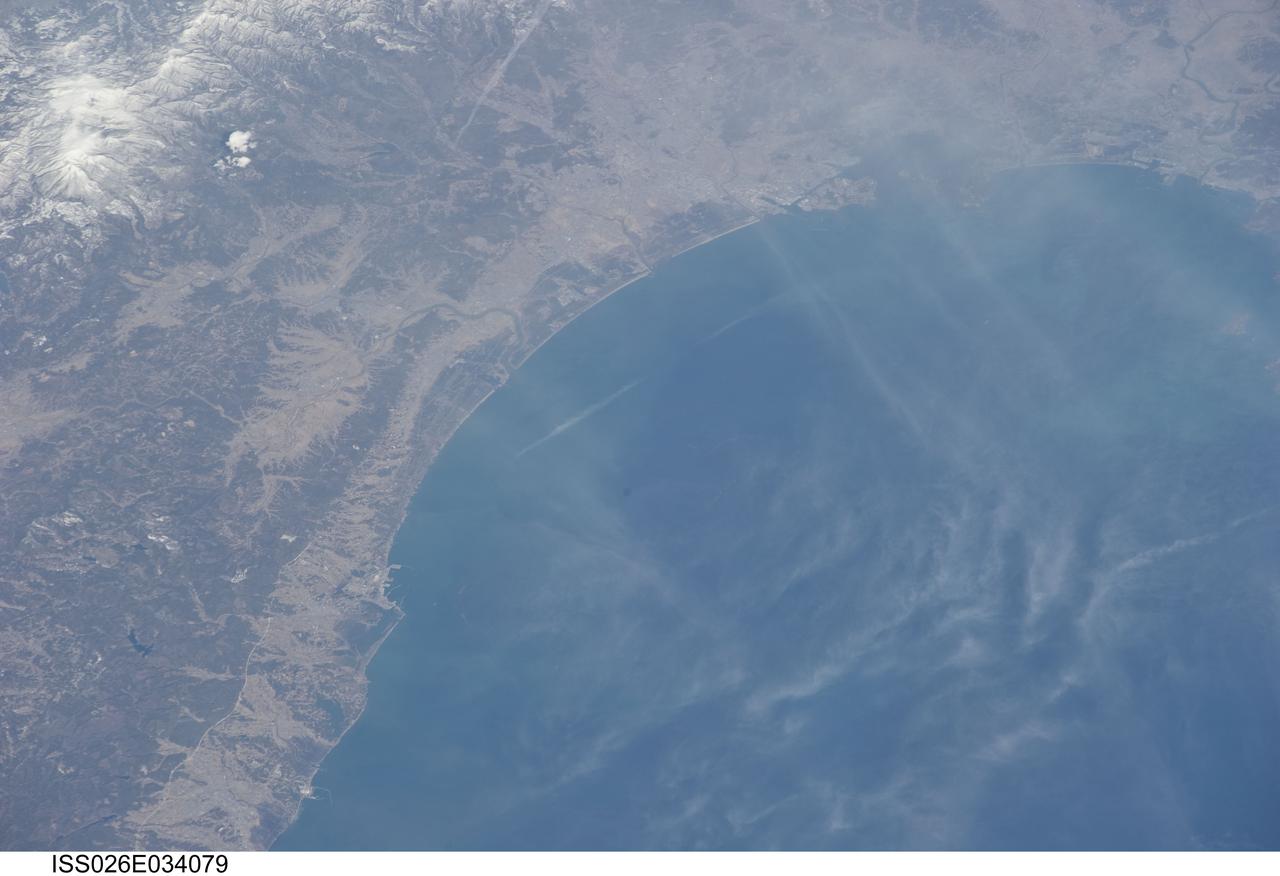
ISS026-E-034079 (14 March 2011) --- From 220 miles above Japan, an Expedition 26 crew member onboard the International Space Station took this 200mm view of the Sendai coast and southward, on March 14, three days after the one-two-punch of earthquake and tsunami.
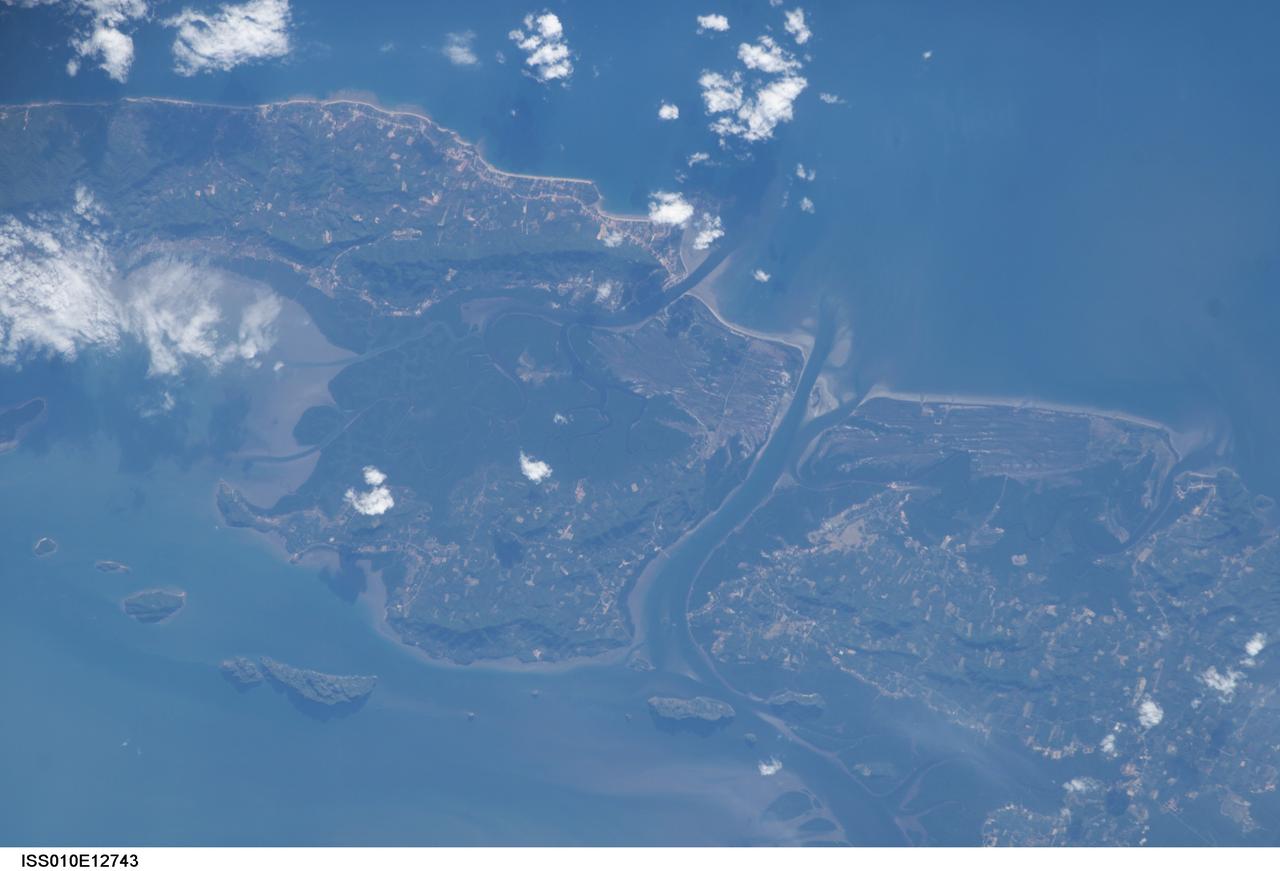
ISS010-E-12743 (11 January 2005) --- One of a series of post-tsunami digital still images photographed by the Expedition 10 crew aboard the International Space Station. This image, recorded on January 11, 2005 and centered at 7.61 degrees north latitude and 99.06 degrees east longitude, features Ko Lanta Yai (Thailand)
ISS010-E-12727 (11 January 2005) --- One of a series of post-tsunami digital still images photographed by the Expedition 10 crew aboard the International Space Station. This image, recorded on January 11, 2005 and centered at 7.61 degrees north latitude and 99.06 degrees east longitude, features Ko Lanta Yai (Thailand)

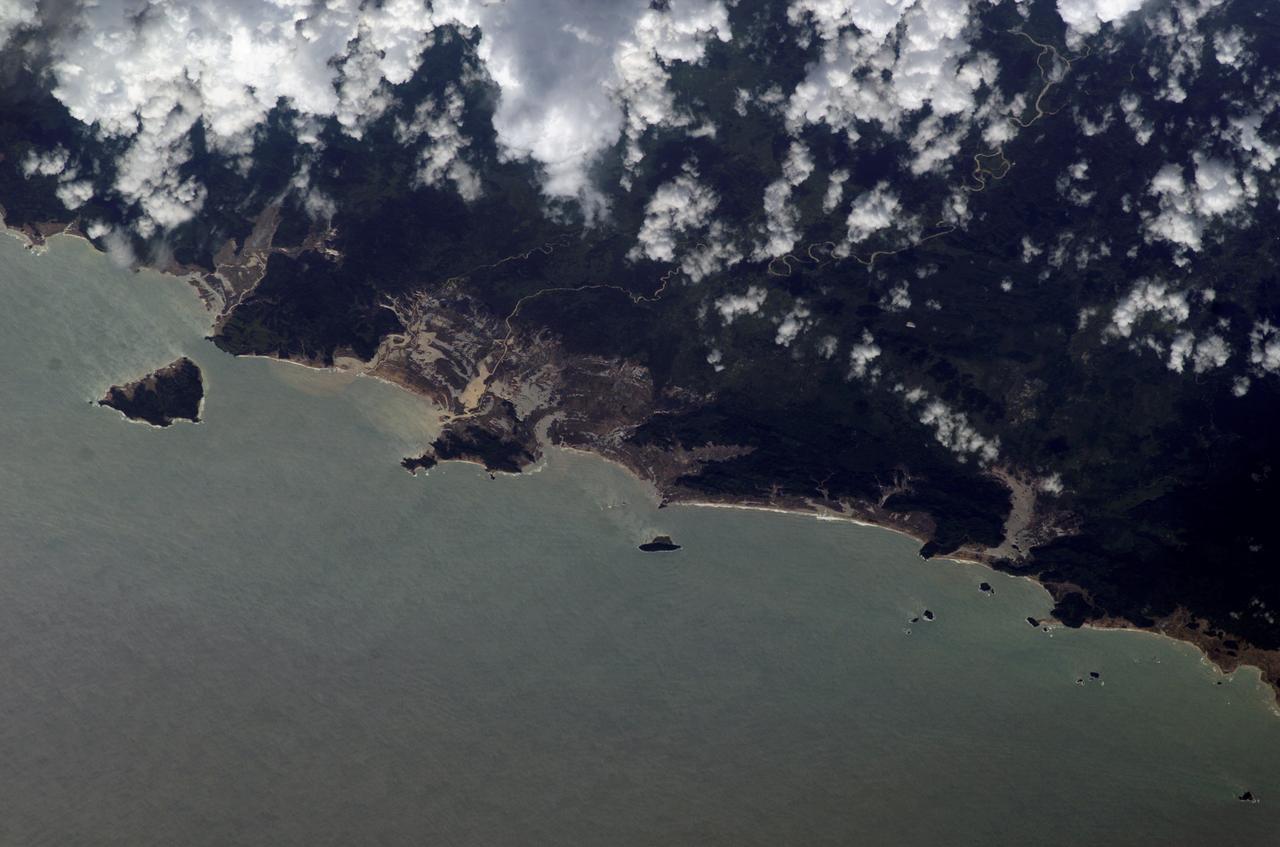
ISS010-E-12736 (11 January 2005) --- One of a series of post-tsunami digital still images photographed by the Expedition 10 crew aboard the International Space Station. This image, recorded on January 11, 2005 and centered at 7.83 degrees north latitude and 98.34 degrees east longitude, shows Phuket (Thailand)
ISS010-E-13088 (15 January 2005) --- Tsunami damage, northwestern Sumatra (Indonesia) is featured in this image photographed by an Expedition 10 crewmember on the International Space Station. On December 26, 2004 a large (magnitude 9.0) earthquake occurred off the western coast of Sumatra in the Indian Ocean. Scientists believe the earthquake was caused by the release of stresses accumulated as the India tectonic plate is overridden by the Burma tectonic plate. Movement of the seafloor due to the earthquake generated a tsunami, or seismic sea wave, that affected coastal regions around the Indian Ocean. The northwestern Sumatra coastline in particular suffered extensive damage and loss of life. This photo, along with image ISS010-E-13079, illustrates damage along the southwestern coast of Aceh Province in the vicinity of the city of Lho’ Kruet, Indonesia. The image captures the sunglint illuminating the Indian Ocean and standing water inland (light gray). Distortion and scale differences are caused by increased obliquity of the view from the Station.
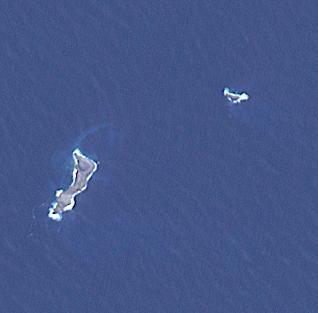
The eruption of Hunga Tonga-Hunga Ha'apai in 2022 produced a plume 58 km high, and produced the biggest atmospheric explosion ever recorded. At least six people lost their lives in the ensuing tsunami. The two small islands are all that is left visible of a huge underwater volcano. The image covers an area of 4.6 by 4.6 km, was acquired September 7, 2022, and is located at 20.5 degrees south, 175.4 degrees west. https://photojournal.jpl.nasa.gov/catalog/PIA26006
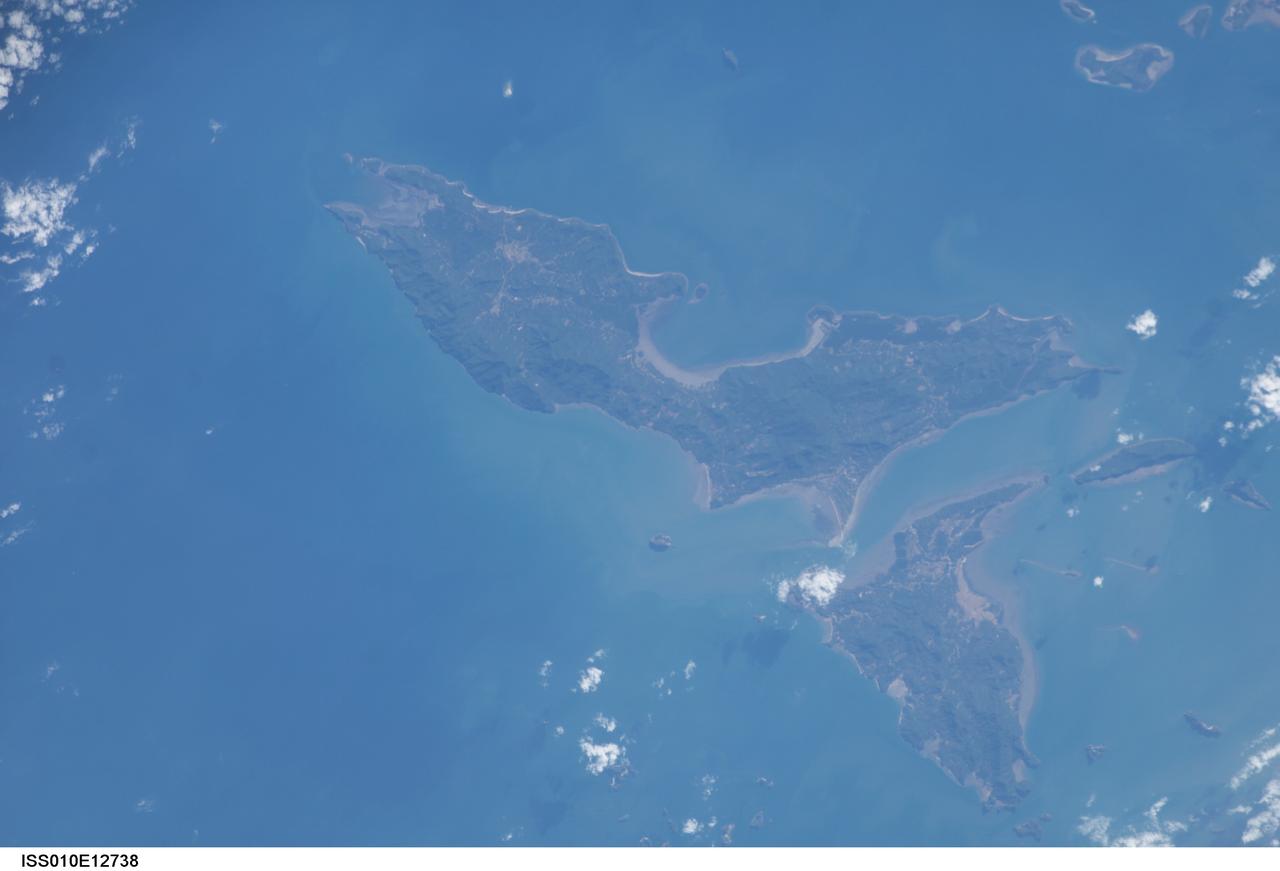
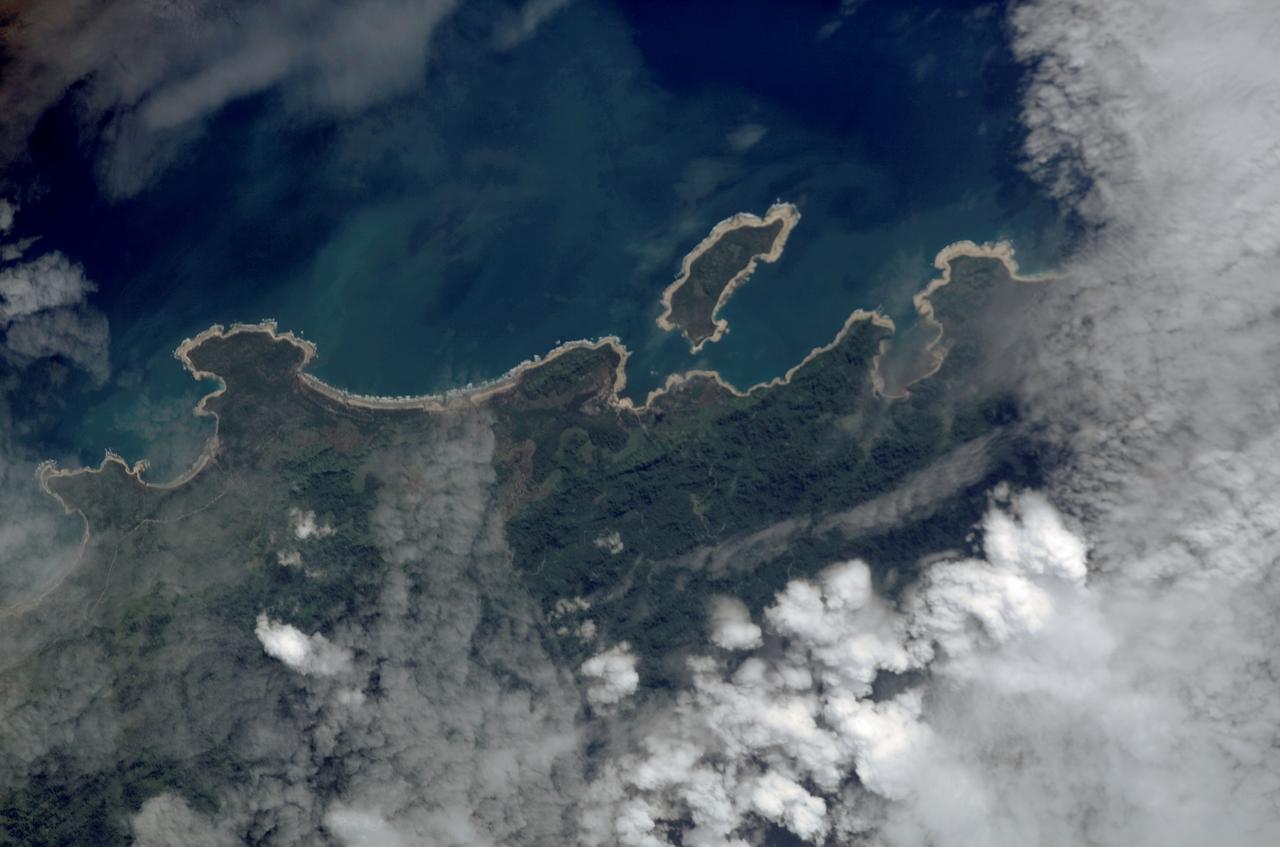
ISS010-E-12738 (11 January 2005) --- One of a series of post-tsunami digital still images photographed by the Expedition 10 crew aboard the International Space Station. This image, recorded on January 11, 2005 and centered at 8.00 degrees north latitude and 98.60 degrees east longitude, is Ko Yao Yai, northwest of Phuket (Thailand).
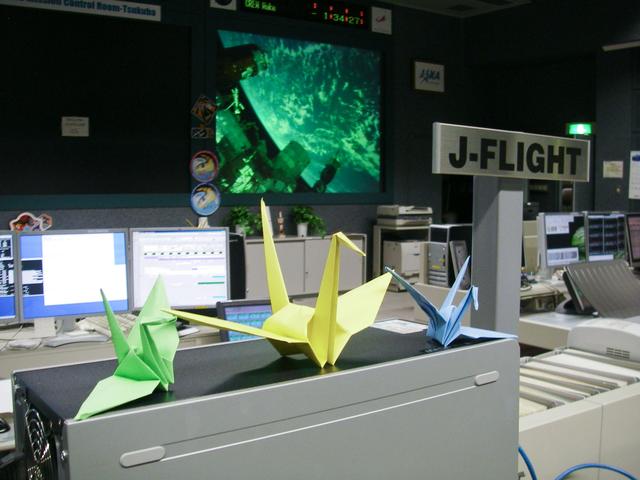
JSC2011-E-029164 (26 March 2011) --- In the HTV mission control room at the Tsukuba Space Center in Japan, some colorful new decoration appeared atop several of the consoles. The origami cranes were distributed in the control rooms in both Houston and Japan. Meantime the Expedition 27 crew onboard the International Space Station joined them in paying tribute to the Japanese population who suffered from the March 11 earthquake and tsunami. Photo credit: Japan Aerospace Exploration Agency (JAXA)
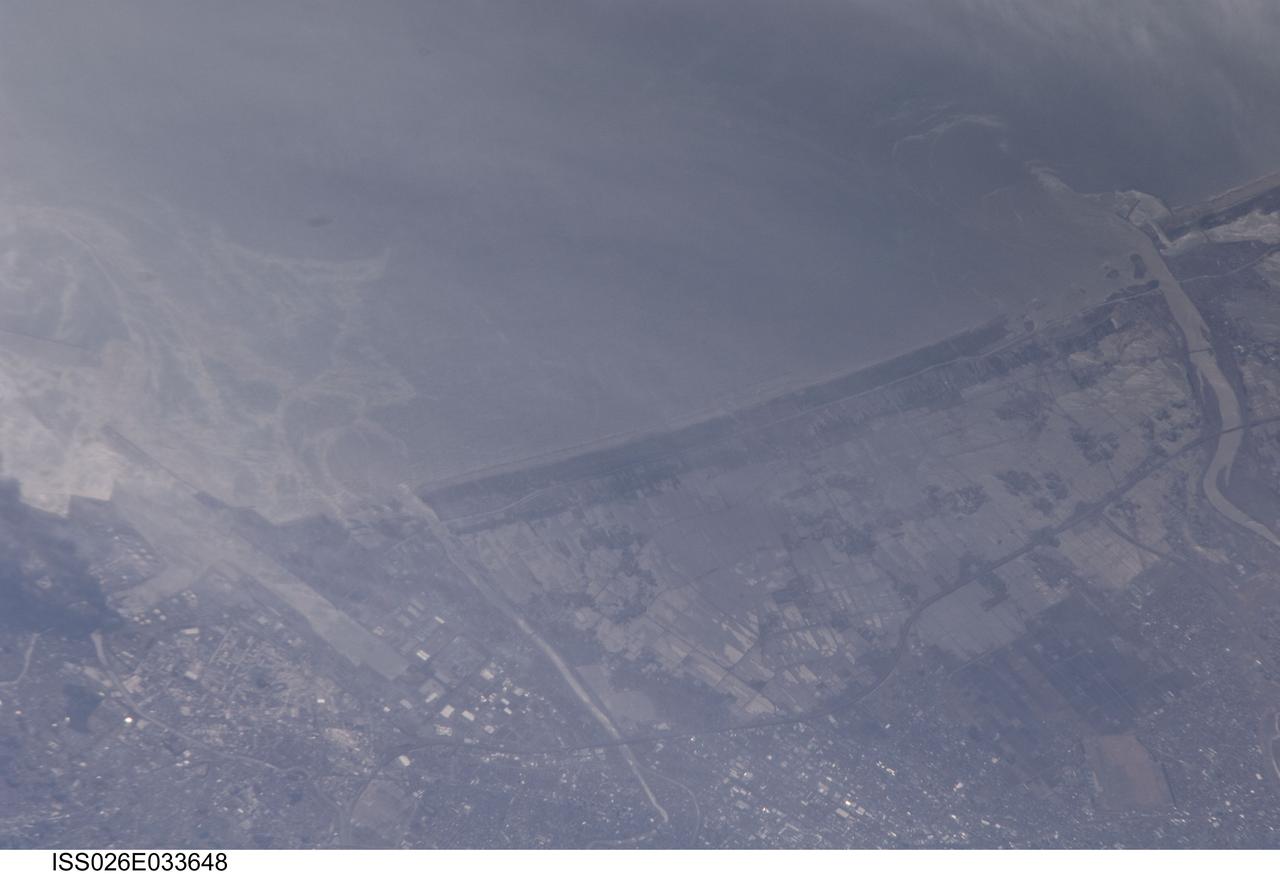
ISS026-E-033648 (13 March 2011) --- From 220 miles above Japan, an Expedition 26 crew member onboard the International Space Station took this 800mm view of Sendai, and the coast mostly north on March 13. Sunglint helps to highlight the flood waters over the land, flowing out the rivers, plus the heavy oils swirling on the surface with the currents. An earthquake and subsequent tsunami hit Japan on March 11.
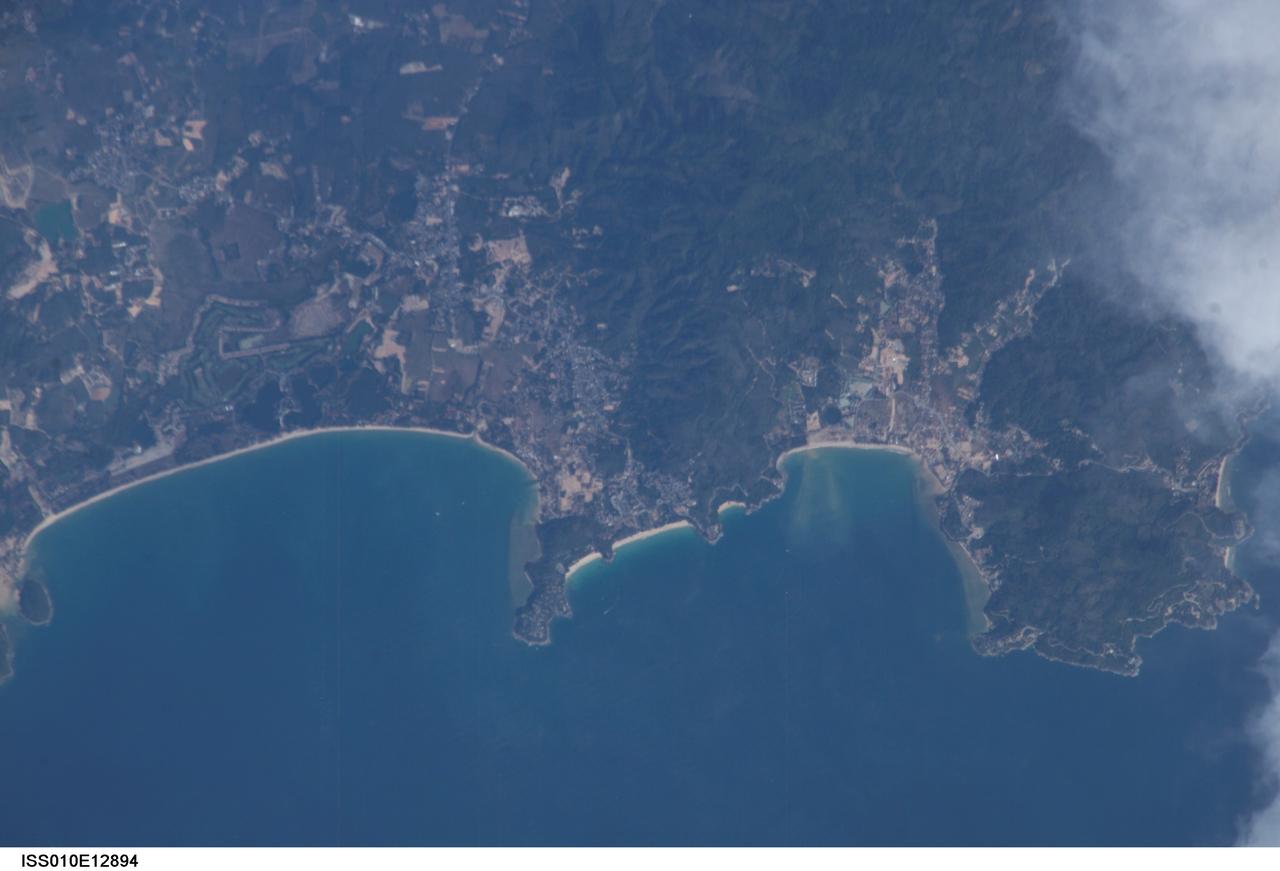
ISS010E12894 (13 January 2005) --- One of a series of post-tsunami digital still images which were photographed from the International Space Station on January 13, 2005. This image showing part of Thailand is centered at 7.96 degrees north latitude and 98.27 degrees east longitude near Phuket. According to NASA scientists studying the ISS imagery, the image shows some damage around the bays and low lying areas adjacent to the bays.
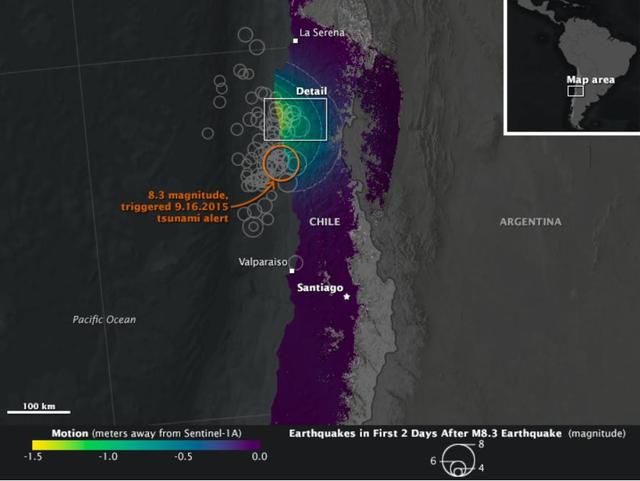
On Sept. 16, 2015, a magnitude 8.3 earthquake struck near the coast of central Chile along the boundary of the Nazca and South American tectonic plates. Dubbed the Illapel earthquake, the shaking lasted at least three minutes and propelled a 15-foot (4.5-meter) tsunami that washed into Coquimbo and other coastal areas. Smaller tsunami waves raced across the Pacific and showed up on the shores of Hawaii and other islands. The earthquake and tsunami caused substantial damage in several Chilean coastal towns, and at least 13 deaths have been reported. Demanding building codes and extensive disaster preparedness helped to limit the loss of life and property. The maps above, known as interferograms, show how the quake moved the ground, as observed by the Copernicus Sentinel-1A satellite (operated by the European Space Agency) and reported by ground stations to the U.S. Geological Survey. Sentinel-1A carries a synthetic aperture radar (SAR) instrument, which beams radio signals toward the ground and measures the reflections to determine the distance between the ground and the satellite. By comparing measurements made on Aug. 24 and Sept. 17, Cunren Liang, Eric Fielding, and other researchers from NASA's Jet Propulsion Laboratory were able to determine how the land surface shifted during and after the earthquake. Interferograms can be used to estimate where the fault moved deep in Earth and which areas have increased stress and higher likelihood of future earthquakes. The details can also provide important information to better understand the earthquake process. On both the close-up and the broad-view maps, the amount of land motion is represented in shades from yellow to purple. Areas where the ground shifted the most (vertically, horizontally, or both) are represented in yellow, while areas with little change are represented in purple. Circles show the location of earthquakes and aftershocks in the two days after the initial 8.3 earthquake, as reported by the USGS National Earthquake Information Center. Larger quakes are represented by larger circles. The base map layer uses a digital elevation model and a bathymetry map to show the contours of the land surface and seafloor. The interferograms above show that land moved as much as 1.4 meters toward to satellite (generally in the vertical direction) near the coast, and early estimates of the horizontal motion suggest it was as much as 2 meters. While SAR can see through clouds and the dark of night, it cannot see much through water. It is likely that much of the ground deformation from the earthquake occurred underwater, which explains the formation of the tsunami and the location of many aftershocks. http://photojournal.jpl.nasa.gov/catalog/PIA20002
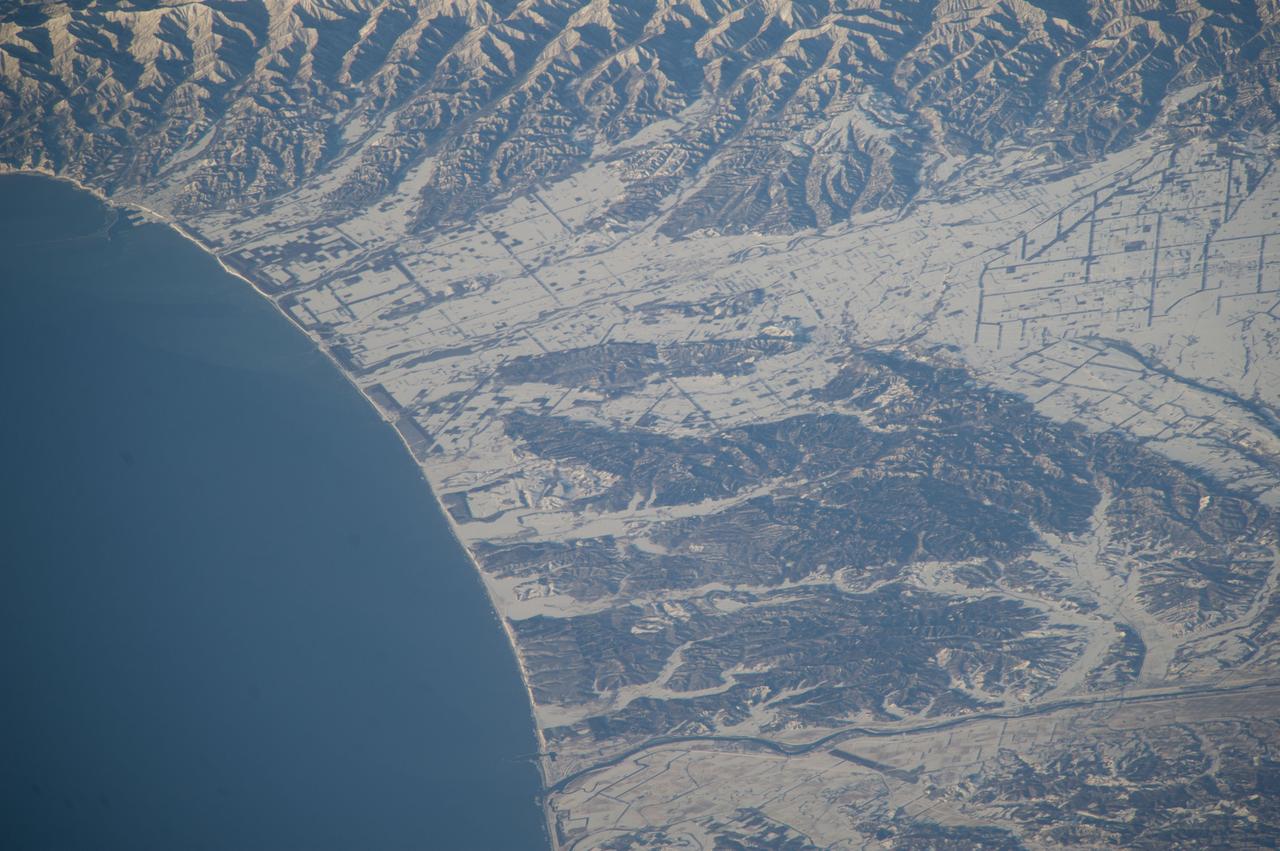
ISS039-E-003841 (21 March 2014) --- One of the Expedition 39 crew members aboard the International Space Station used an 800mm lens to record a still image documenting the unusually heavy snows which fell on northern Japan this winter. Snow highlights the flat, fenced landscape used for agriculture in this image taken on March 21, 2014. The large Tokachi River reaches the arc of the Pacific Ocean on Hokkaido?s east coast. Forests on steeper hillsides mask the snow and appear dark (upper image margin and image center). The view shows the narrow greenbelt forests that line the coast. Planted in Japan for at least the last four centuries, greenbelts protect coastlines from storms and sand movement, and are increasingly providing recreation areas. Greenbelts also reduce tsunami wave energy, protecting houses and roads from floating debris. Greenbelt forests reduced the destructive effects of the 2011 tsunami at Sendai by ?catching? entire seagoing vessels, preventing them from being washed inland.
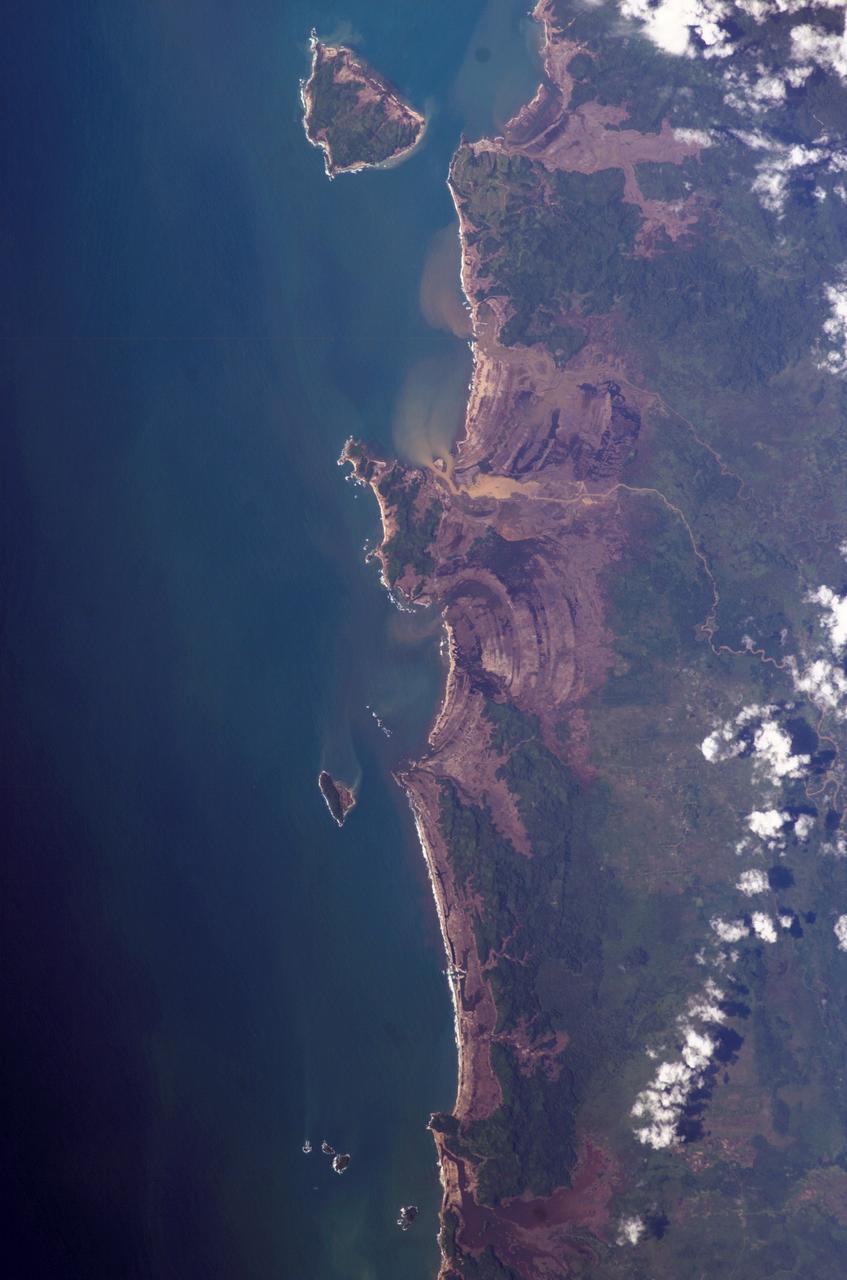
ISS010-E-13079 (15 January 2005) --- Tsunami damage, northwestern Sumatra (Indonesia) is featured in this image photographed by an Expedition 10 crewmember on the International Space Station (ISS). On December 26, 2004 a large (magnitude 9.0) earthquake occurred off the western coast of Sumatra in the Indian Ocean. Scientists believe the earthquake was caused by the release of stresses accumulated as the India tectonic plate is overridden by the Burma tectonic plate. Movement of the seafloor due to the earthquake generated a tsunami, or seismic sea wave, that affected coastal regions around the Indian Ocean. The northwestern Sumatra coastline in particular suffered extensive damage and loss of life. This photo, along with image ISS010-E-13088, illustrates damage along the southwestern coast of Aceh Province in the vicinity of the city of Lho’ Kruet, Indonesia. Large areas of bare and disturbed soil (brownish gray) previously covered with vegetation are visible along the coastline. Embayments in the coastline were particularly hard hit, while adjacent headlands were less affected.
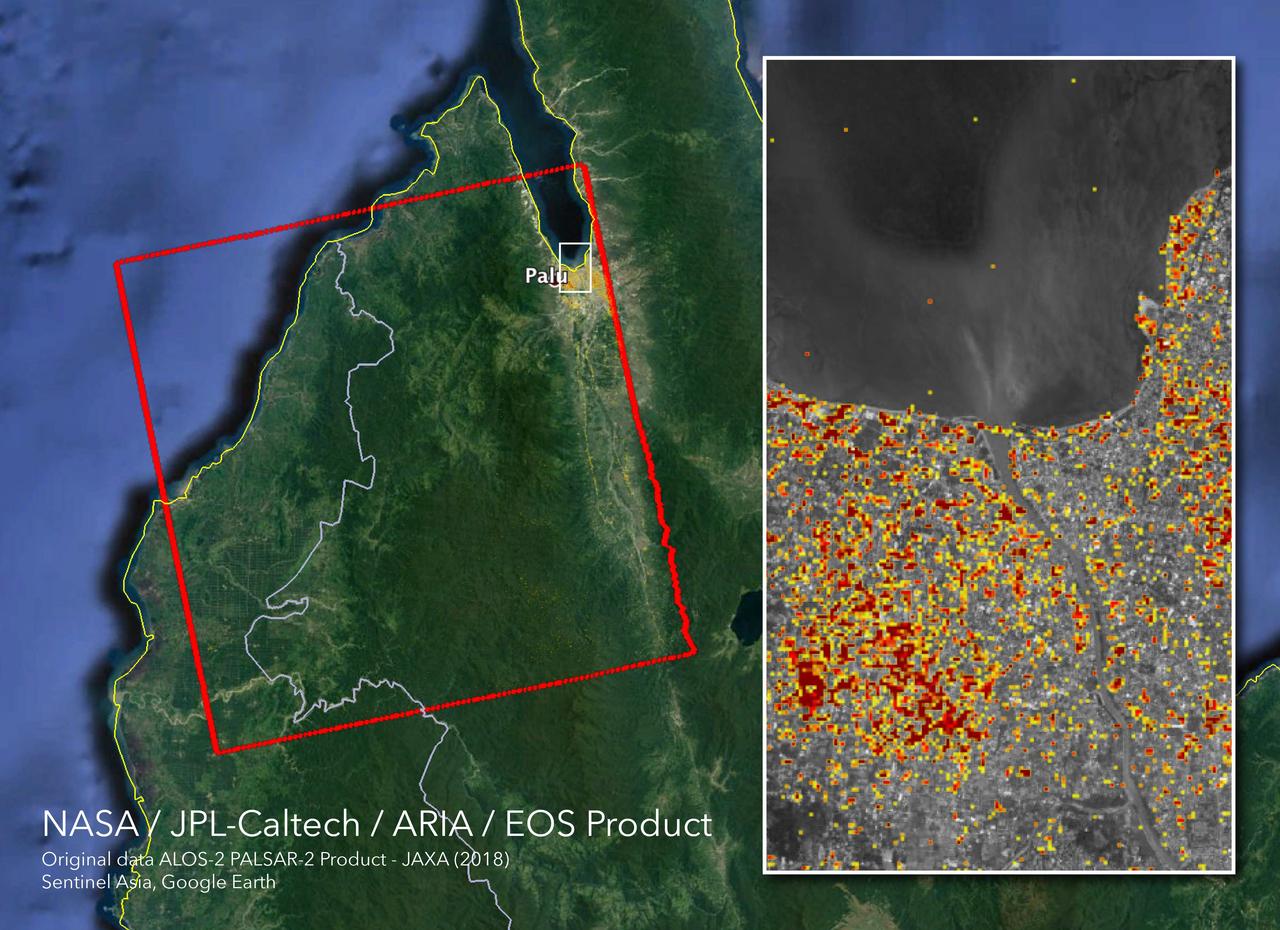
The Advanced Rapid Imaging and Analysis (ARIA) team at NASA's Jet Propulsion Laboratory in Pasadena, California, and Caltech, also in Pasadena, created this Damage Proxy Map (DPM) depicting areas in Central Sulawesi, Indonesia, including the city of Palu, that are likely damaged (shown by red and yellow pixels) as a result of the magnitude 7.5 September 28, 2018 earthquake. The map is derived from synthetic aperture radar (SAR) images from the ALOS-2 satellite, operated by Japan Aerospace Exploration Agency (JAXA). The images were taken before (Aug. 8, 2018) and after (Oct. 3, 2018) the earthquake. The map covers an area of 42 by 44 miles (67 by 70 kilometers), shown by the large red polygon. Each pixel measures about 33 yards (30 meters) across. The color variation from yellow to red indicates increasingly more significant ground surface change. Preliminary validation was done in collaboration with the Earth Observatory of Singapore by comparing with local media information and photos. This damage proxy map should be used as guidance to identify damaged areas, and may be less reliable over vegetated areas. For example, the scattered single colored pixels over vegetated areas may be false positives, and the lack of colored pixels over vegetated areas does not necessarily mean no damage. The DPM was created by the NASA-JPL/Caltech ARIA team, and the ALOS-2 data were provided by JAXA. The Earth Observatory of Singapore coordinated with the Sentinel Asia to timely task the ALOS-2 satellite. The algorithm development was carried out at JPL under a contract with NASA. https://photojournal.jpl.nasa.gov/catalog/PIA22746
On 26 December 2004, a magnitude 9.0 earthquake occurred off the west coast of Sumatra, Indonesia. These views were acquired by NASA Terra spacecraft.
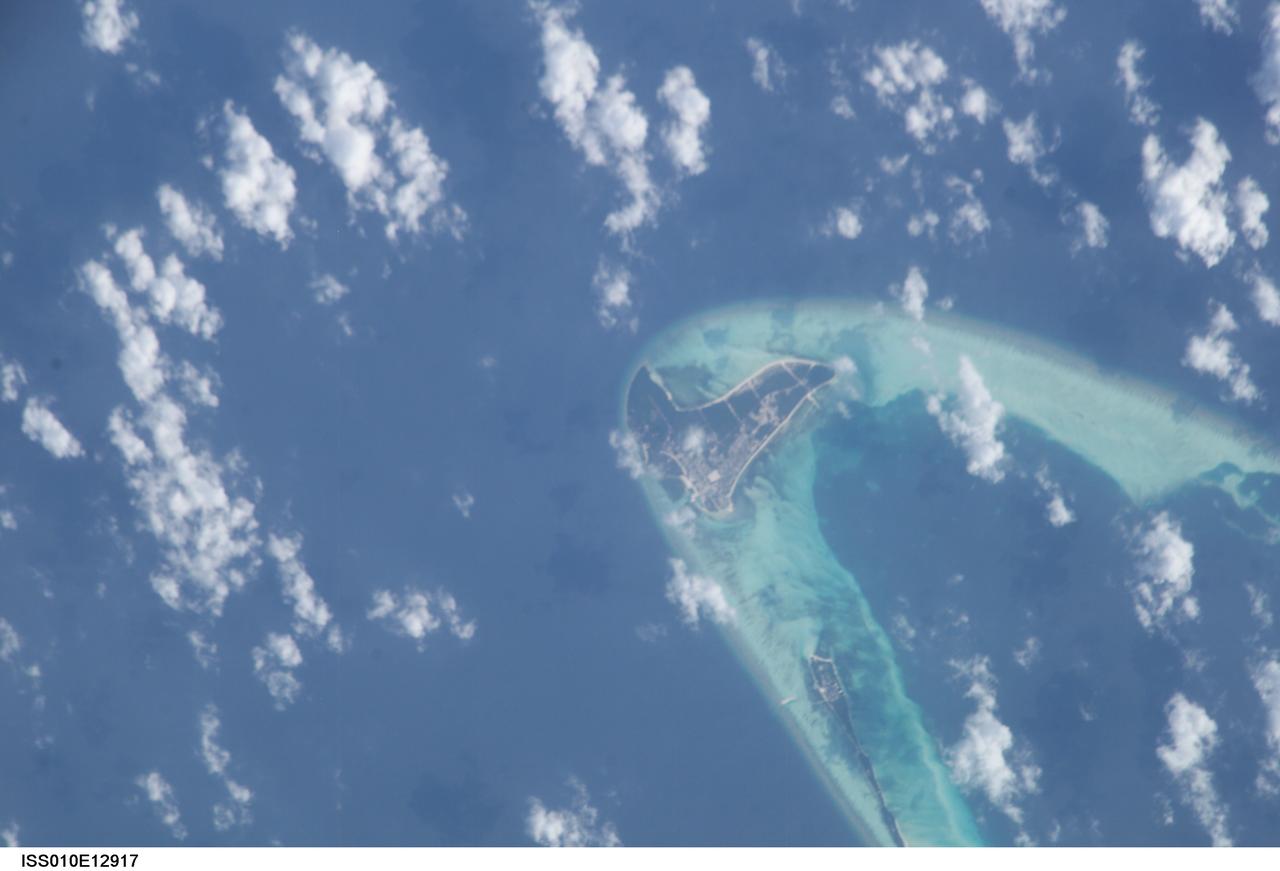
ISS010-E-12917 (13 January 2005) --- One of a series of post-tsunami digital still images photographed from the International Space Station on January 13, 2005. This image, centered at 4.9 degrees north latitude and 72.9 degrees east longitude, and one of several showing the Maldives, shows the east portion of Goidhoo (also called Horsburgh) Atoll. Also visible are Goidhoo (Goidu) Island and Fehendoo (Fehendu) Island. Information is sketchy on how much damage was actually sustained in the region, but NASA scientists studying the ISS imagery say that coral reefs likely mitigated the damage level.

This image pair from NASA Terra spacecraft includes the area around the damaged Fukushima Dai-ichi nuclear power facility and extends northward along the coast.
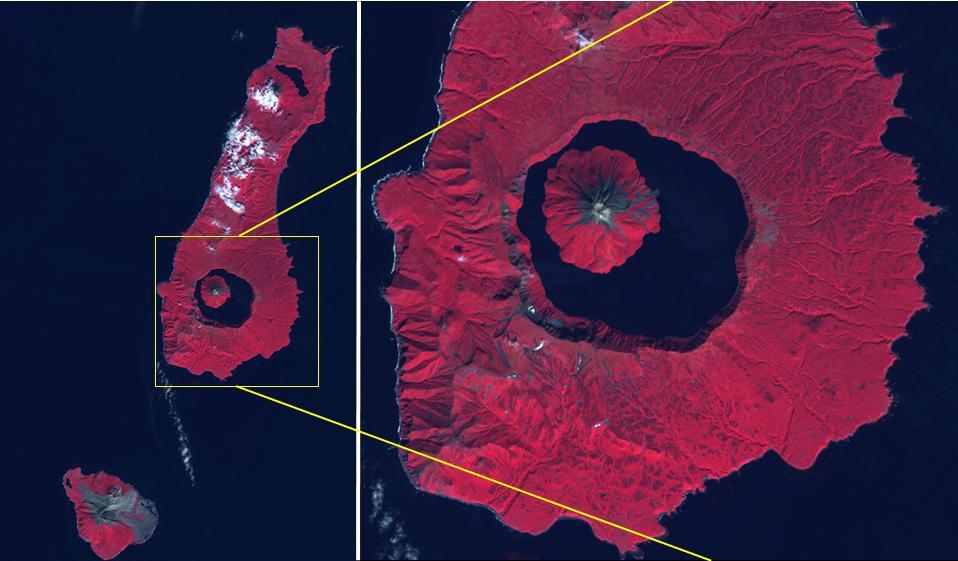
The Kuril Islands are a volcanic archipelago, stretching 1300 km from Hokkaido, Japan to Kamchatka, Russia. They are part of the Pacific Ring of Fire, the result of subduction of the Pacific Plate under the Okhotsk Plate along the Kuril Trench. At the southern end of Onekotan Island is the Tao-Rusyr Caldera stratovolcano, with its 7500 year old caldera lake. The most recent eruption was in 1952. The smaller Kharimkotan Island to the southwest last erupted in 1933. Collapse of this volcano created a horseshoe-shaped crater, and caused a tsunami that killed two people on a near-by island. The image was acquired June 4, 2012; the enlargement covers an area of 17 by 18.5 km, and is located at 49.3 degrees north, 154.7 degrees east. https://photojournal.jpl.nasa.gov/catalog/PIA24020
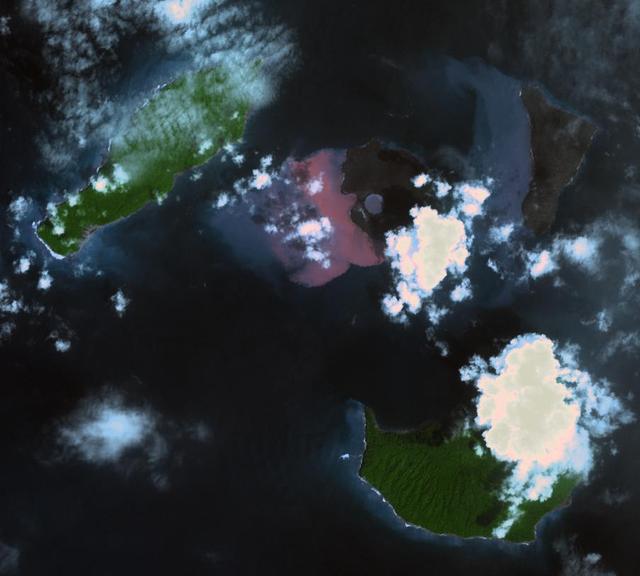
On Dec. 22, 2018, Indonesia's Anak Krakatau volcano erupted and partially collapsed. NASA's Advanced Spaceborne Thermal Emission and Reflection (ASTER) instrument imaged the volcano on Jan. 13 -- several weeks after the eruption. This image shows that the crater area has closed to become a lake and the forest on the island has been destroyed by ash falls. The reddish area in the water southwest of the island is likely due to either iron-rich ash in the water or the interaction of seawater with underwater volcanic eruption products. The image covers an area of 7.5 by 8.4 miles (12.2 by 13.5 kilometers), and is located at 6.1 degrees south, 105.4 degrees east. The tsunami that followed the eruption killed more than 400 people in western Indonesia. https://photojournal.jpl.nasa.gov/catalog/PIA22821
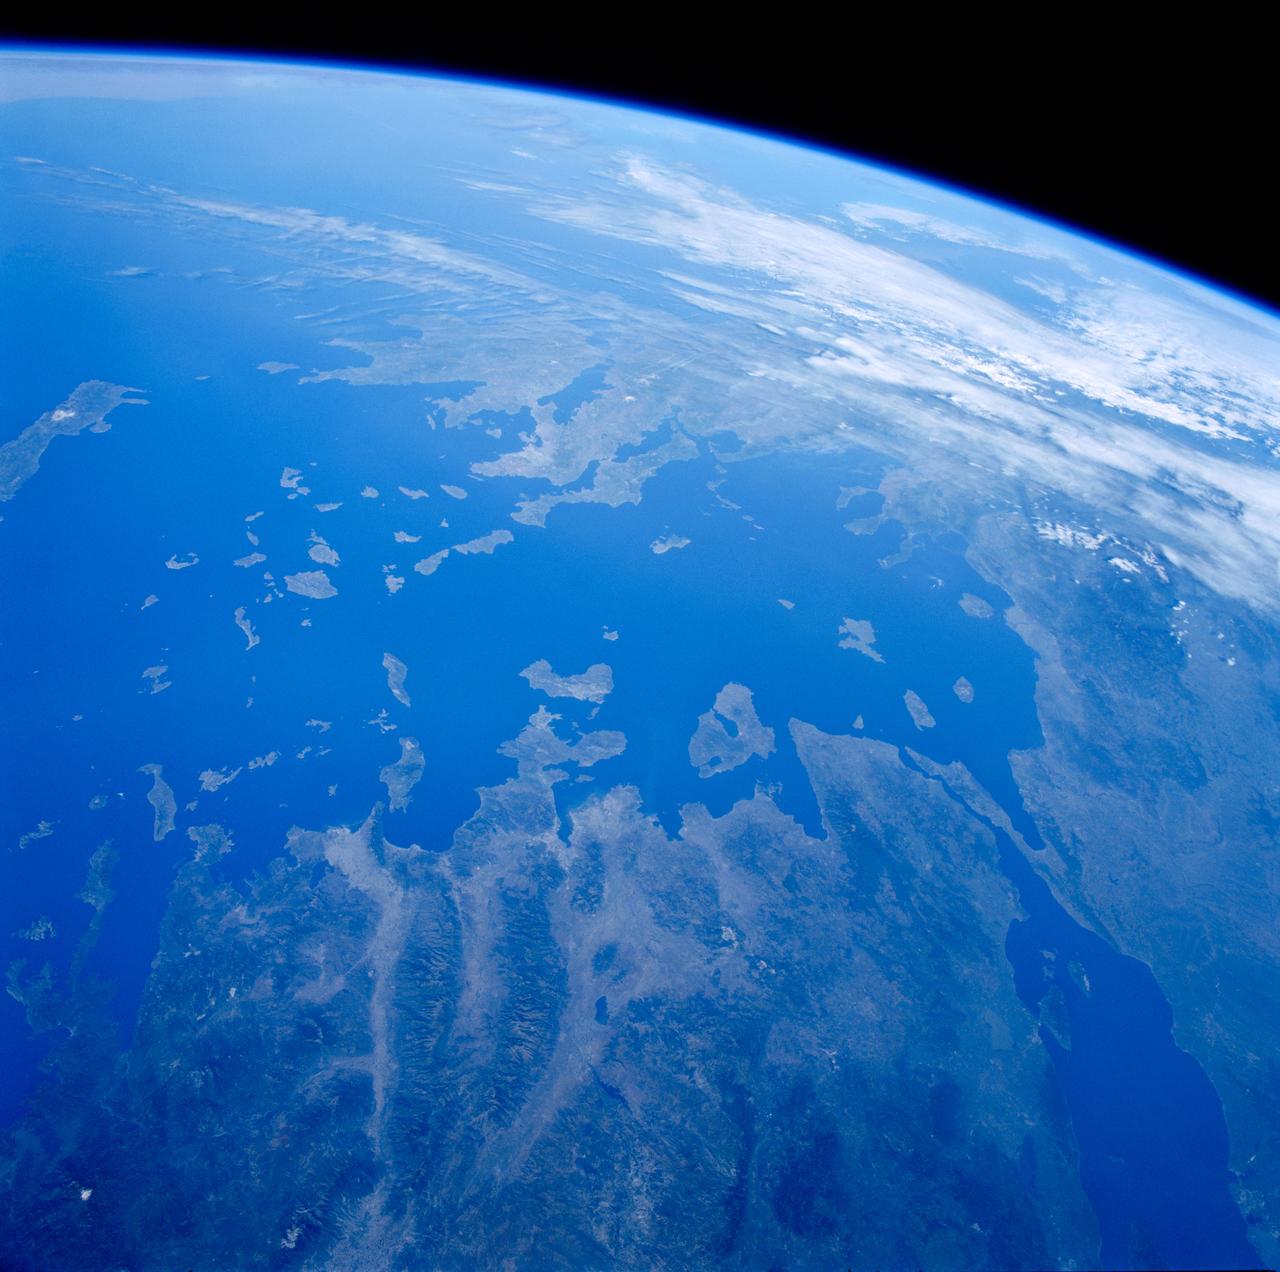
STS084-707-013 (15-24 May 1997) --- As photographed from the Earth-orbiting Space Shuttle Atlantis, this 70mm scene provides a modern view from space of a region rich in ancient history. The Minoan civilization thrived on Crete (western end of the island is visible on the left side of the image) from 3000 BC to about 1100 BC. It is believed by some historians that the eruption of the volcanic island of Thera (the "C" shaped island facing Crete) and possible tsunami helped to bring about the end of the Minoan civilization. The next great civilization to emerge was that of the Greeks. One of the most prominent city-states was Athens which can be seen as a light colored area on an elongated piece of land at center of view (near the clouds). The Aegean Sea separates Greece from Asia Minor (Turkey) in the foreground.
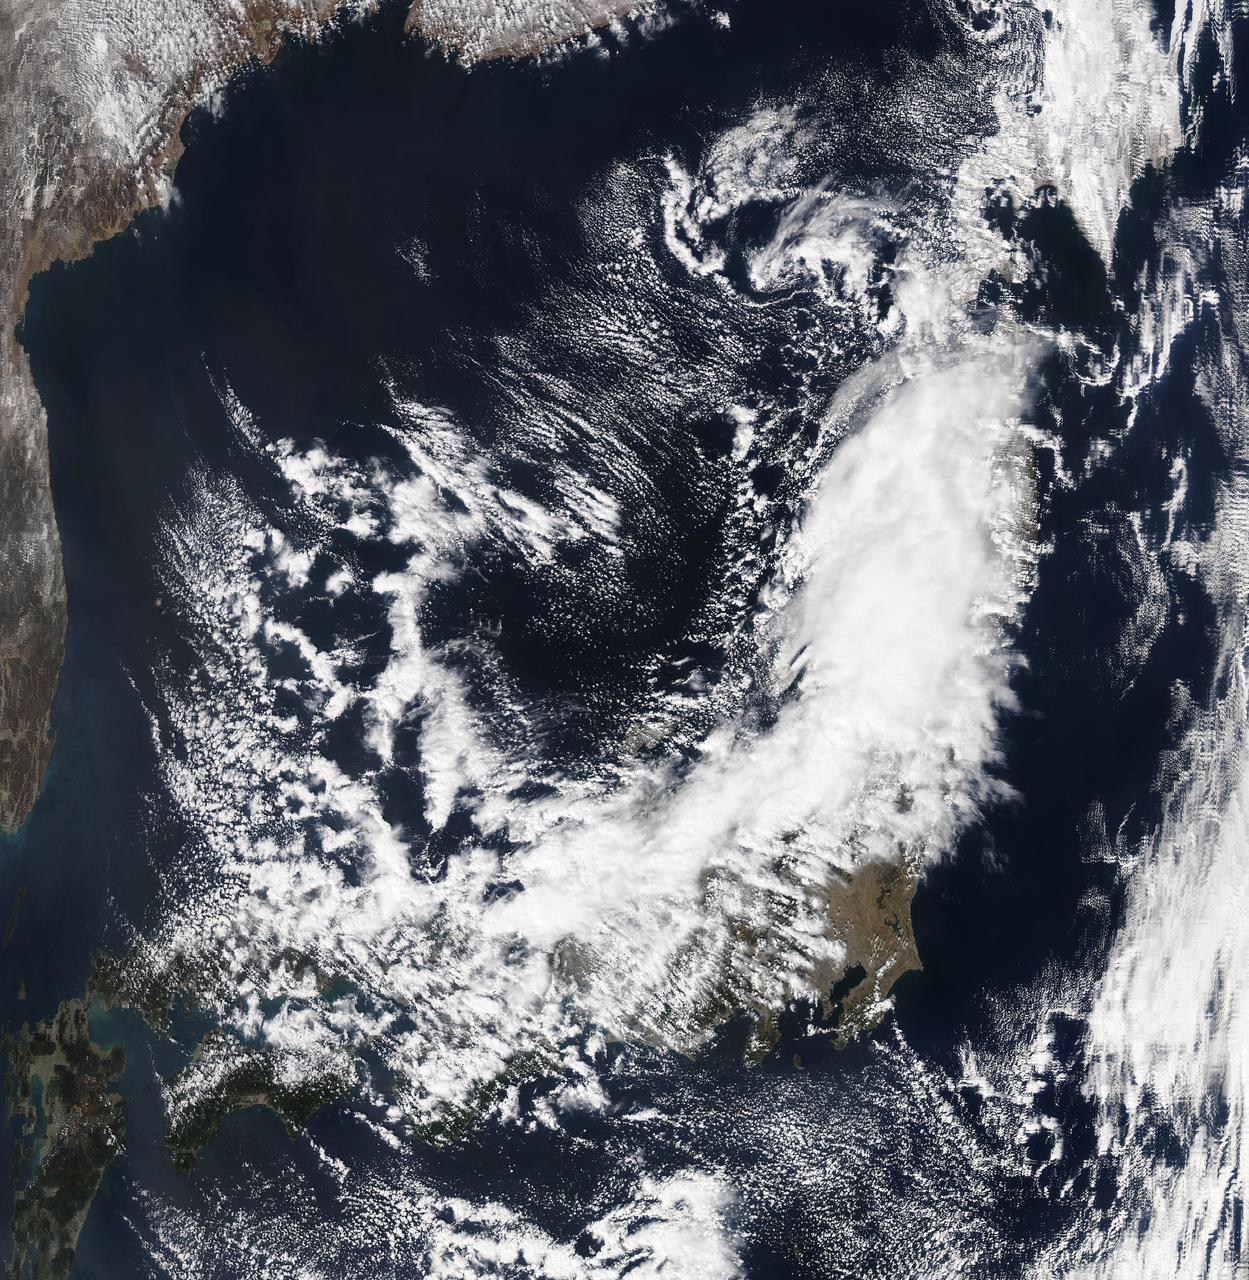
NASA's Aqua satellite passed over Japan one hour and 41 minutes before the quake hit. At the time Aqua passed overhead, the Moderate Resolution Imaging Spectroradiometer (MODIS) instrument captured a visible of Japan covered by clouds. The image was taken at 0405 UTC on March 11 (1:05 p.m. local time Japan /11:05 p.m. EST March 10). The quake hit at 2:46 p.m. local time/Japan. Satellite: Aqua Credit: NASA/GSFC/Aqua <b><a href="http://www.nasa.gov/centers/goddard/home/index.html" rel="nofollow">NASA Goddard Space Flight Center</a></b> enables NASA’s mission through four scientific endeavors: Earth Science, Heliophysics, Solar System Exploration, and Astrophysics. Goddard plays a leading role in NASA’s accomplishments by contributing compelling scientific knowledge to advance the Agency’s mission. <b>Follow us on <a href="http://twitter.com/NASA_GoddardPix" rel="nofollow">Twitter</a></b> <b>Join us on <a href="http://www.facebook.com/pages/Greenbelt-MD/NASA-Goddard/395013845897?ref=tsd" rel="nofollow">Facebook</a></b>
ISS032-E-006129 (10 July 2012) --- Flooding in Krymsk in the Krasnodar region of southern Russia is featured in this image photographed by an Expedition 32 crew member on the International Space Station. On the night of July 7, 2012 a major storm dumped more than a foot of water on the southern Russian area of Krasnodar, near the Black Sea. The resulting flood was likened to a tsunami, and to date, more than 170 people died, most from the city of Krymsk. The Moscow times reports that more than 19,000 people lost everything. This image taken by cosmonauts aboard the space station shows the city of Krymsk. The tan-colored areas indicate some of the regions that were flooded; the color is probably due to the mud and debris that were left by the floodwaters. Krymsk is located in the western foothills on the northern slope of the Caucasus Mountains?a range that stretches between the Black Sea and the Caspian Sea. The vast amount of rain quickly overwhelmed the small river channels that flow northward from the mountains to the Russian lowlands and the Kuban River; Krymsk, located on one of those tributaries, was directly in the pathway of the flash flood. As part of the international partner agreement to use the International Space Station to benefit humanity, crew members and other Earth observing instruments provide best-effort support to the International Disaster Charter (IDC) when it is activated by collecting imagery of areas on the ground impacted by natural events such as the flooding in Krymsk. This image was acquired July 10, 2012 in response to the IDC activation.
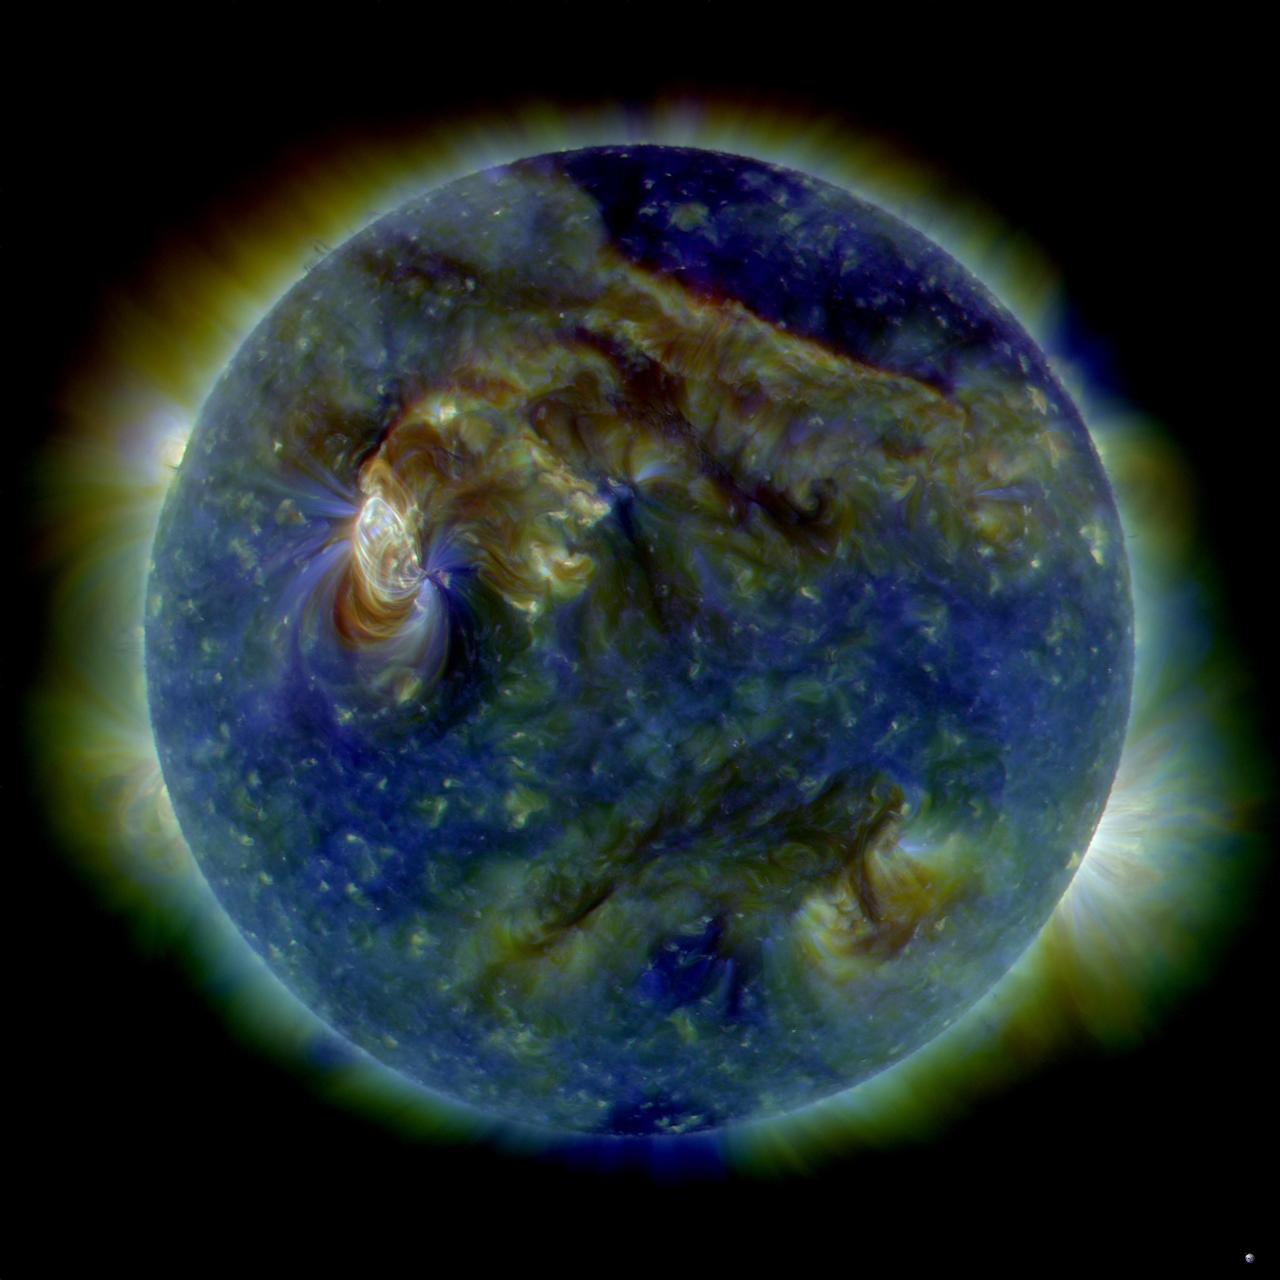
NASA image release August 6, 2010 On August 1, 2010, almost the entire Earth-facing side of the sun erupted in a tumult of activity. This image from the Solar Dynamics Observatory of the news-making solar event on August 1 shows the C3-class solar flare (white area on upper left), a solar tsunami (wave-like structure, upper right), multiple filaments of magnetism lifting off the stellar surface, large-scale shaking of the solar corona, radio bursts, a coronal mass ejection and more. This multi-wavelength extreme ultraviolet snapshot from the Solar Dynamics Observatory shows the sun's northern hemisphere in mid-eruption. Different colors in the image represent different gas temperatures. Earth's magnetic field is still reverberating from the solar flare impact on August 3, 2010, which sparked aurorae as far south as Wisconsin and Iowa in the United States. Analysts believe a second solar flare is following behind the first flare and could re-energize the fading geomagnetic storm and spark a new round of Northern Lights. Credit: NASA/SDO/AIA <b><a href="http://www.nasa.gov/centers/goddard/home/index.html" rel="nofollow">NASA Goddard Space Flight Center</a></b> is home to the nation's largest organization of combined scientists, engineers and technologists that build spacecraft, instruments and new technology to study the Earth, the sun, our solar system, and the universe. <b>Follow us on <a href="http://twitter.com/NASA_GoddardPix" rel="nofollow">Twitter</a></b> <b>Join us on <a href="http://www.facebook.com/pages/Greenbelt-MD/NASA-Goddard/395013845897?ref=tsd" rel="nofollow">Facebook</a><b> </b></b>
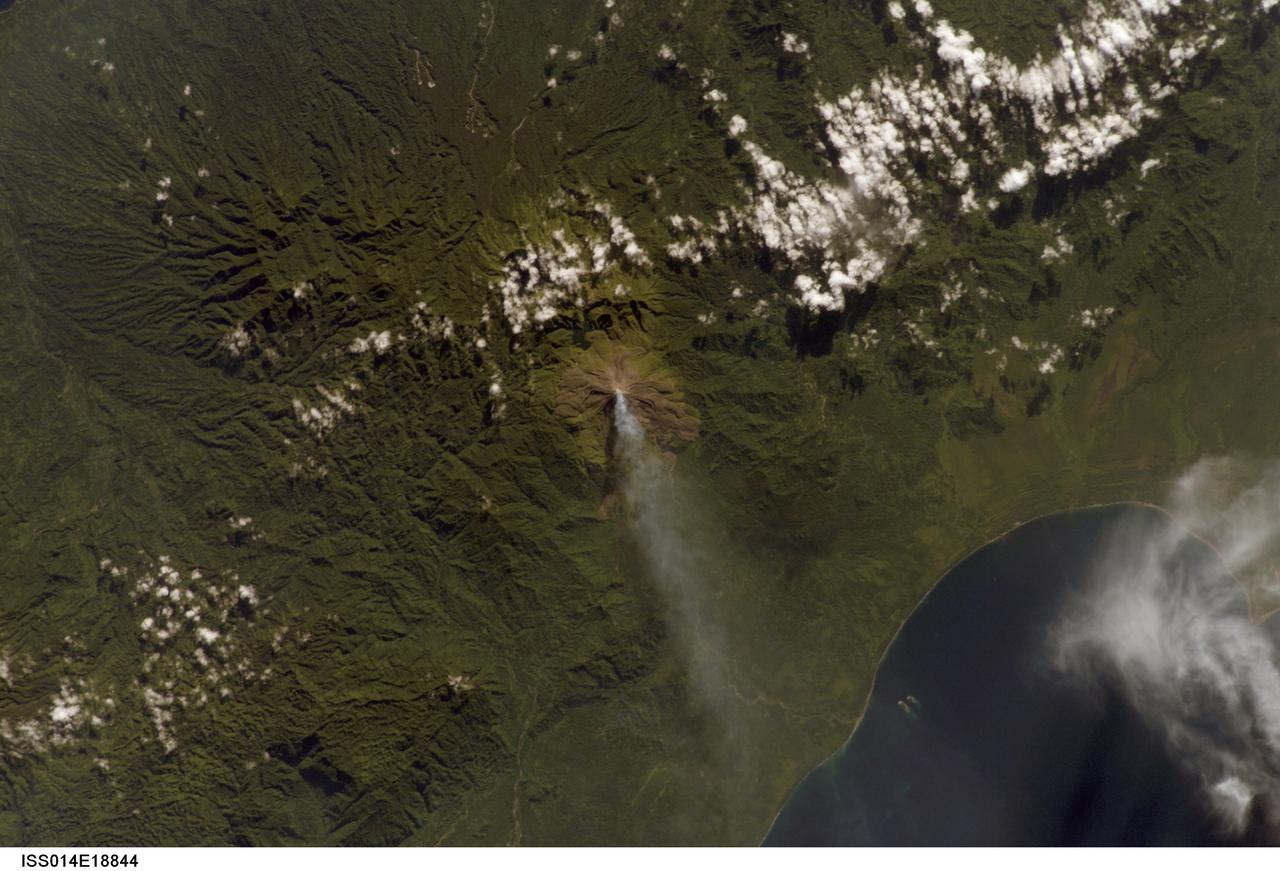
ISS014-E-18844 (2 April 2007) --- A plume at Mt. Bagana, Bougainville Island is featured in this image photographed by an Expedition 14 crewmember on the International Space Station. Bougainville Island, part of the Solomon Islands chain to the east of Papua New Guinea, is typical of many Pacific Rim islands in that volcanism has played a large part in both its geological and recorded history. The island hosts three large volcanoes along its northwest-southeast trending axis: Mt. Balbi, Mt. Bagana, and the Mt. Takuan volcanic complex. Mt. Bagana (near center) is the only volcano on the island that has been historically active. Light green stressed vegetation, and brown lobate lava flows mark the 1,750 meter high lava cone of Mt. Bagana within the verdant landscape of Bougainville Island. The eruptive style of the volcano is typically non-explosive, producing thick lobes of andesitic lava that run down the flanks and maintain a dome in the summit crater. Occasional pyroclastic flows have also been noted. The most recent phase of activity, which began on March 7, has been characterized by vapor plumes with occasional ash-producing emissions. This photograph, acquired almost one month (twenty days) after the last reported activity at Bagana, records a diffuse white vapor plume extending west-southwest from the summit. The Solomon Island region experiences other effects due to the geologic setting: earlier this week, a large but shallow earthquake shook the region and induced a tsunami that hit the western part of the Solomon Island chain.
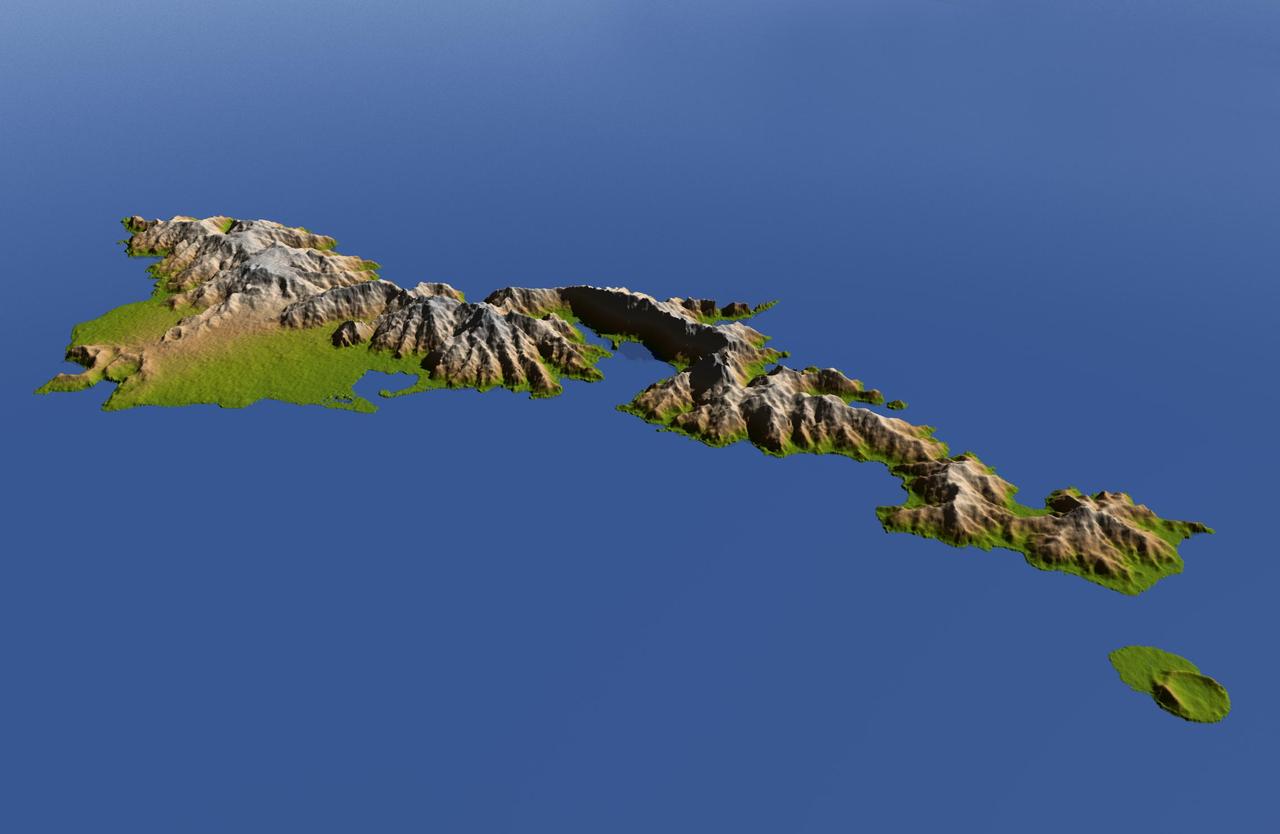
The topography of Tutuila, largest of the islands of American Samoa, is well shown in this color-coded perspective view generated with digital elevation data from the Shuttle Radar Topography Mission (SRTM.) The total area of Tutuila is about 141.8 square kilometers (54.8 square miles), slightly larger than San Francisco. The large bay near the center in this view is Pago Pago Harbor, actually a submerged volcanic crater whose south wall collapsed millions of years ago. Adjacent to the harbor is Pago Pago, the capital of American Samoa, and to the left (west) of the harbor in this view is Matafao Peak, Tutuila’s highest point at 653 meters (2,142 feet). On September 29, 2009, a tsunami generated by a major undersea earthquake located about 200 kilometers (120 miles) southwest of Tutuila inundated the more heavily populated southern coast of the island with an ocean surge more than 3 meters (10 feet) deep, causing scores of casualties. Digital topographic data such as those produced by SRTM aid researchers and planners in predicting which coastal regions are at the most risk from such waves, as well as from the more common storm surges caused by tropical storms and even sea level rise. Two visualization methods were combined to produce the image: shading and color coding of topographic height. The shaded image was derived by computing topographic slope in the northeast-southwest direction, so that northeast slopes appear bright and southwest slopes appear dark. Color coding is directly related to topographic height, with green at the lower elevations, rising through yellow and tan, to white at the highest elevations. The image was then projected using the elevation data to produce this perspective view, with the topography exaggerated by a factor of two. http://photojournal.jpl.nasa.gov/catalog/PIA11965

Peering deep into the core of the Crab Nebula, this close-up image reveals the beating heart of one of the most historic and intensively studied remnants of a supernova, an exploding star. The inner region sends out clock-like pulses of radiation and tsunamis of charged particles embedded in magnetic fields. The neutron star at the very center of the Crab Nebula has about the same mass as the sun but compressed into an incredibly dense sphere that is only a few miles across. Spinning 30 times a second, the neutron star shoots out detectable beams of energy that make it look like it's pulsating. The NASA Hubble Space Telescope snapshot is centered on the region around the neutron star (the rightmost of the two bright stars near the center of this image) and the expanding, tattered, filamentary debris surrounding it. Hubble's sharp view captures the intricate details of glowing gas, shown in red, that forms a swirling medley of cavities and filaments. Inside this shell is a ghostly blue glow that is radiation given off by electrons spiraling at nearly the speed of light in the powerful magnetic field around the crushed stellar core. The neutron star is a showcase for extreme physical processes and unimaginable cosmic violence. Bright wisps are moving outward from the neutron star at half the speed of light to form an expanding ring. It is thought that these wisps originate from a shock wave that turns the high-speed wind from the neutron star into extremely energetic particles. When this "heartbeat" radiation signature was first discovered in 1968, astronomers realized they had discovered a new type of astronomical object. Now astronomers know it's the archetype of a class of supernova remnants called pulsars - or rapidly spinning neutron stars. These interstellar "lighthouse beacons" are invaluable for doing observational experiments on a variety of astronomical phenomena, including measuring gravity waves. Observations of the Crab supernova were recorded by Chinese astronomers in 1054 A.D. The nebula, bright enough to be visible in amateur telescopes, is located 6,500 light-years away in the constellation Taurus. Credits: NASA and ESA, Acknowledgment: J. Hester (ASU) and M. Weisskopf (NASA/MSFC) <b><a href="http://www.nasa.gov/audience/formedia/features/MP_Photo_Guidelines.html" rel="nofollow">NASA image use policy.</a></b> <b><a href="http://www.nasa.gov/centers/goddard/home/index.html" rel="nofollow">NASA Goddard Space Flight Center</a></b> enables NASA’s mission through four scientific endeavors: Earth Science, Heliophysics, Solar System Exploration, and Astrophysics. Goddard plays a leading role in NASA’s accomplishments by contributing compelling scientific knowledge to advance the Agency’s mission. <b>Follow us on <a href="http://twitter.com/NASAGoddardPix" rel="nofollow">Twitter</a></b> <b>Like us on <a href="http://www.facebook.com/pages/Greenbelt-MD/NASA-Goddard/395013845897?ref=tsd" rel="nofollow">Facebook</a></b> <b>Find us on <a href="http://instagrid.me/nasagoddard/?vm=grid" rel="nofollow">Instagram</a></b>