On March 17, 2013, NASA Uninhabited Aerial Vehicle Synthetic Aperture Radar UAVSAR acquired synthetic aperture radar data over the Napo River in Ecuador and Peru.
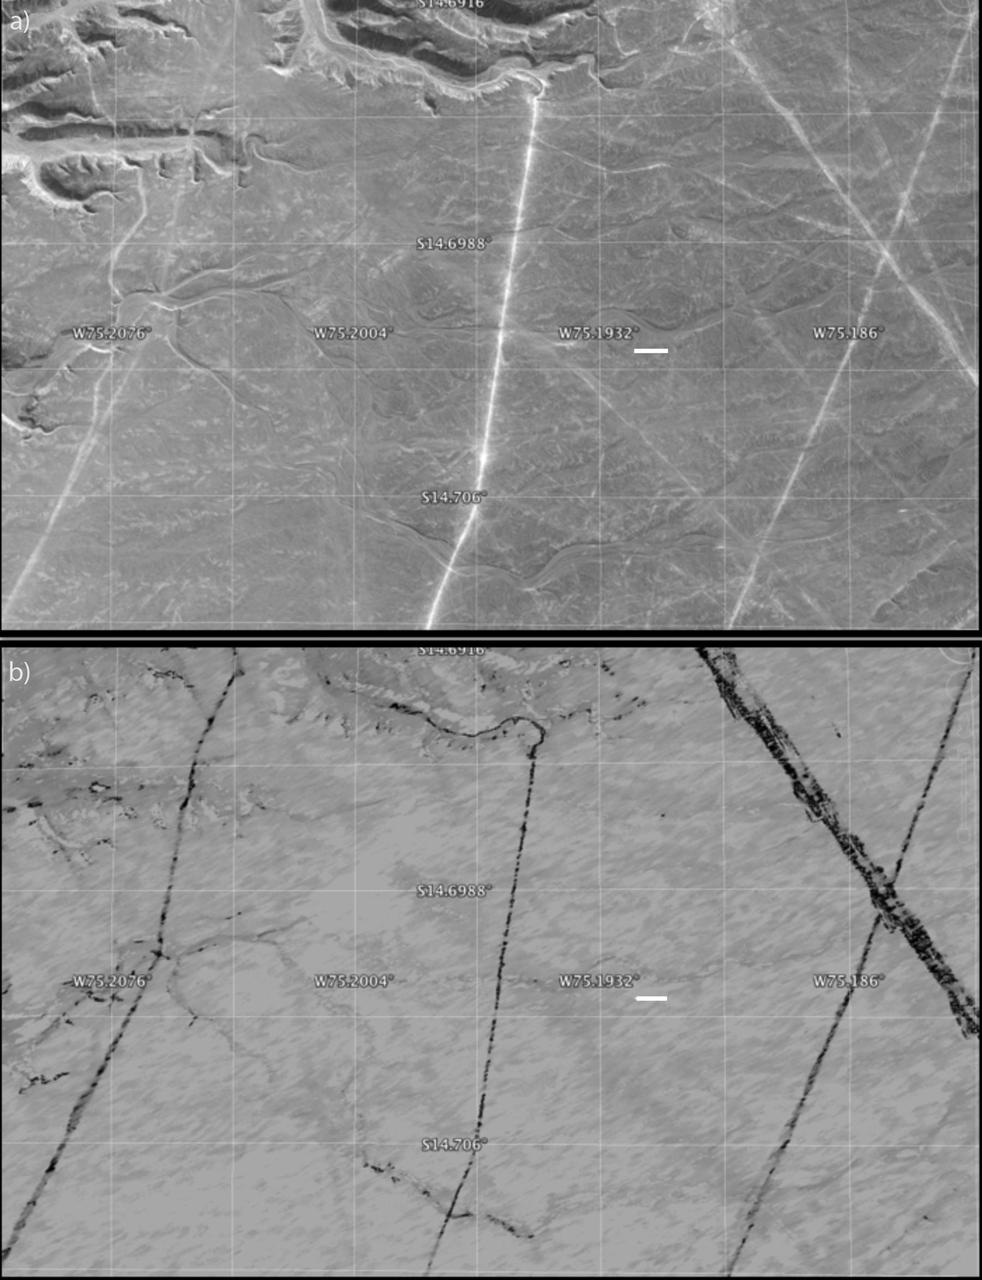
Different visualizations of an area with geometric geoglyphs at the Nasca World Heritage Site in Peru as seen by NASA Uninhabited Aerial Vehicle Synthetic Aperture Radar UAVSAR.

This radar image from NASA Uninhabited Aerial Vehicle Synthetic Aperture Radar UAVSAR shows the deformed Earth caused by a 7.2 earthquake in Mexico state of Baja California in 2010.

This radar image from NASA Uninhabited Aerial Vehicle Synthetic Aperture Radar UAVSAR shows the deformed Earth caused by a 7.2 earthquake in Mexico state of Baja California and parts of the American Southwest on April 4, 2010.

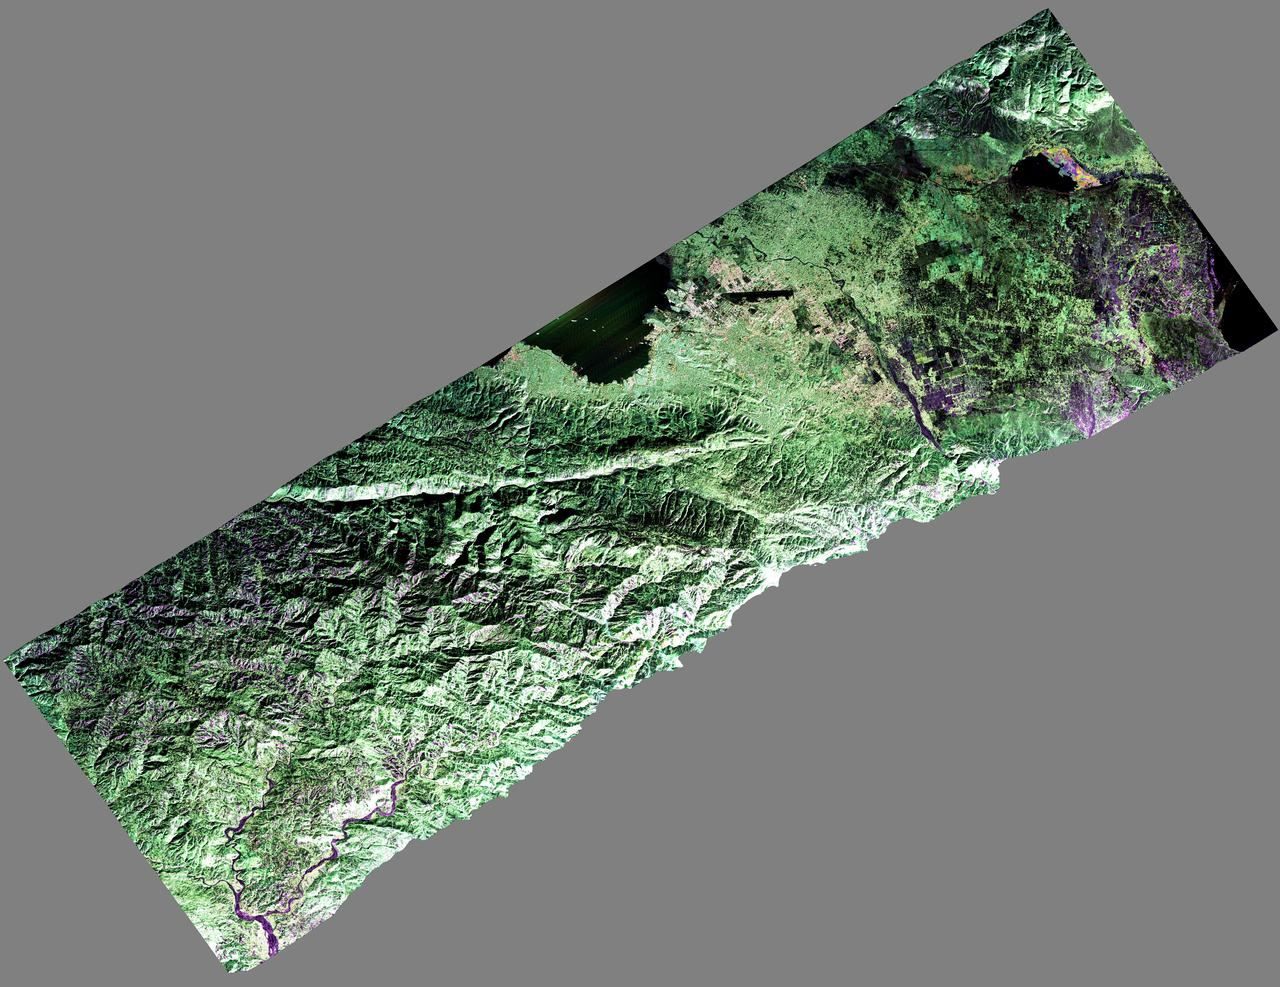
JPL Uninhabited Aerial Vehicle Synthetic Aperture Radar collected this composite radar image around Québec City, Canada, during an 11-day campaign to study the structure of temperate and boreal forests.
NASA Uninhabited Aerial Vehicle Synthetic Aperture Radar UAVSAR captured this false-color composite image of the city of Port-au-Prince, Haiti, and the surrounding region on Jan. 27, 2010.
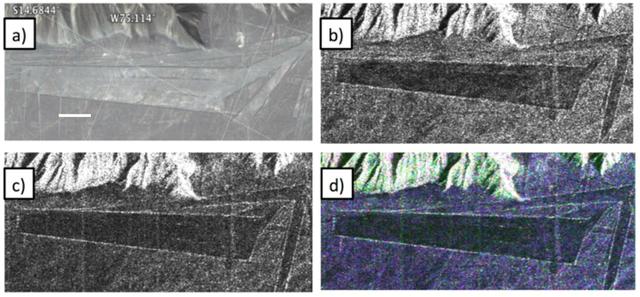
A protected area within the Nasca World Heritage Site in Peru that has experienced apparent disturbance between two different observations by NASA Uninhabited Aerial Vehicle Synthetic Aperture Radar UAVSAR.

Alvin Mitchell, a NASA C-20A aircraft quality assurance inspector, completes preflight checks at NASA’s Armstrong Flight Research Center in Edwards, California, on Wednesday, April 29, 2026. The aircraft conducted science flights over Central California carrying NASA’s UAVSAR (Uninhabited Aerial Vehicle Synthetic Aperture Radar), which collects detailed ground‑movement data to improve earthquake‑hazard models and support a new Earth‑observing satellite.

NASA’s C-20A takes off from NASA’s Armstrong Flight Research Center in Edwards, California, on Wednesday, April 29, 2026. The aircraft conducted science flights over Central California carrying NASA’s UAVSAR (Uninhabited Aerial Vehicle Synthetic Aperture Radar), which collects detailed ground‑movement data to improve earthquake‑hazard models and support a new Earth‑observing satellite.

NASA’s C-20A takes off from NASA’s Armstrong Flight Research Center in Edwards, California, on Wednesday, April 29, 2026. The aircraft conducted science flights over Central California carrying NASA’s UAVSAR (Uninhabited Aerial Vehicle Synthetic Aperture Radar), which collects detailed ground‑movement data to improve earthquake‑hazard models and support a new Earth‑observing satellite.

NASA’s C-20A takes off from NASA’s Armstrong Flight Research Center in Edwards, California, on Wednesday, April 29, 2026. The aircraft conducted science flights over Central California carrying NASA’s UAVSAR (Uninhabited Aerial Vehicle Synthetic Aperture Radar), which collects detailed ground‑movement data to improve earthquake‑hazard models and support a new Earth‑observing satellite.
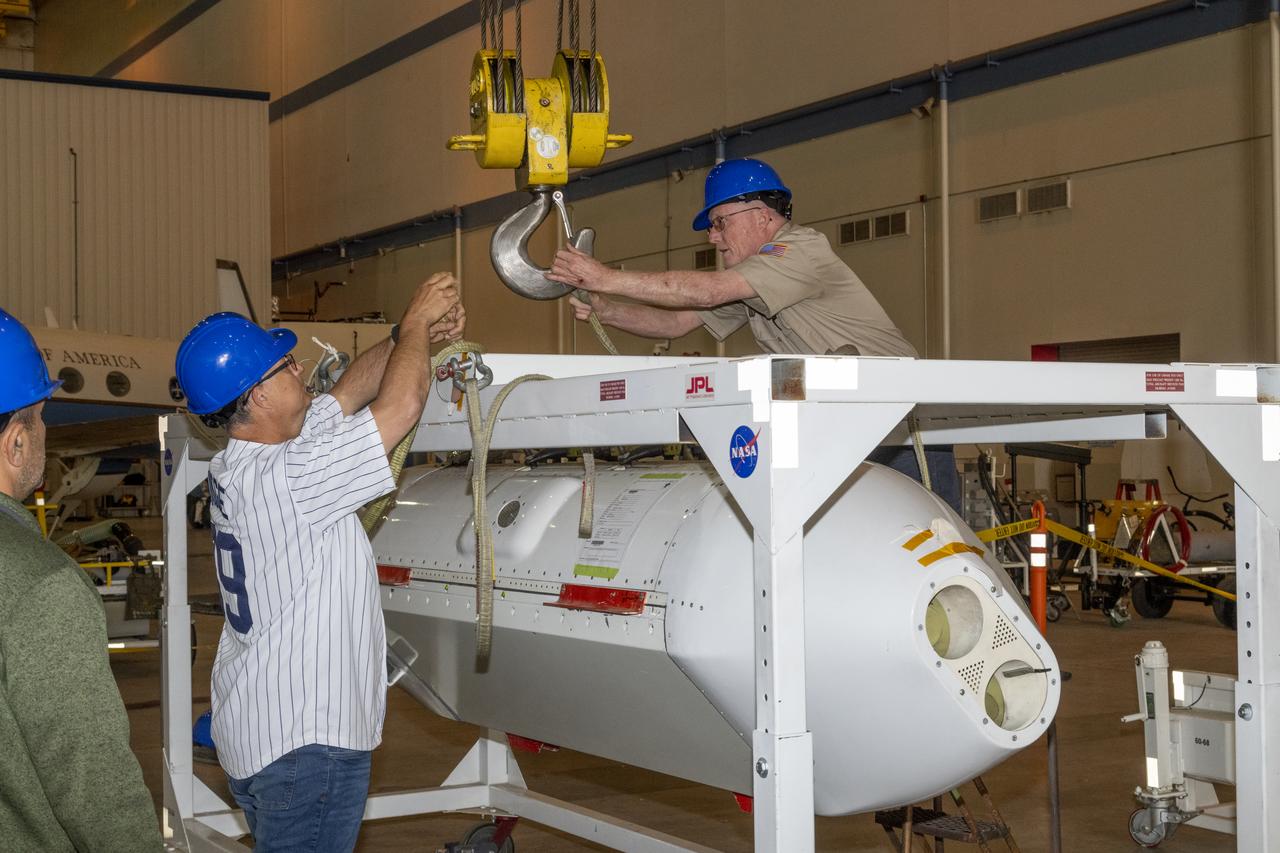
The Uninhabited Aerial Vehicle Synthetic Aperture Radar, UAVSAR, is prepared for installation onto NASA’s C-20A aircraft. THE UAVSAR uses a technique called interferometry to detect and measure very subtle deformations in the Earth’s surface, and the pod is specially designed to be interoperable with unmanned aircraft in the future. It will gather data from Gabon, Africa in September of 2023.
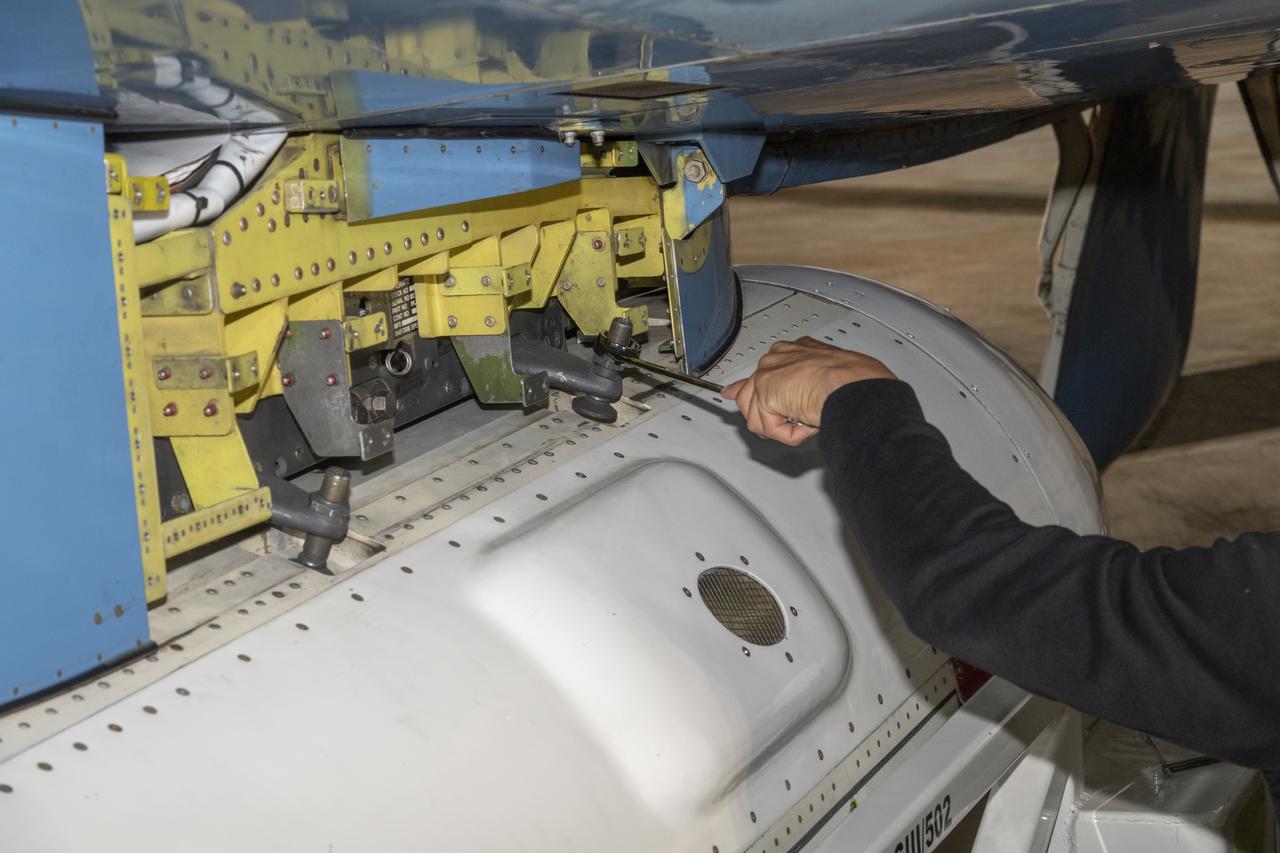
The Uninhabited Aerial Vehicle Synthetic Aperture Radar, UAVSAR, is prepared for installation onto NASA’s C-20A aircraft. THE UAVSAR uses a technique called interferometry to detect and measure very subtle deformations in the Earth’s surface, and the pod is specially designed to be interoperable with unmanned aircraft in the future. It will gather data from Gabon, Africa in September of 2023.
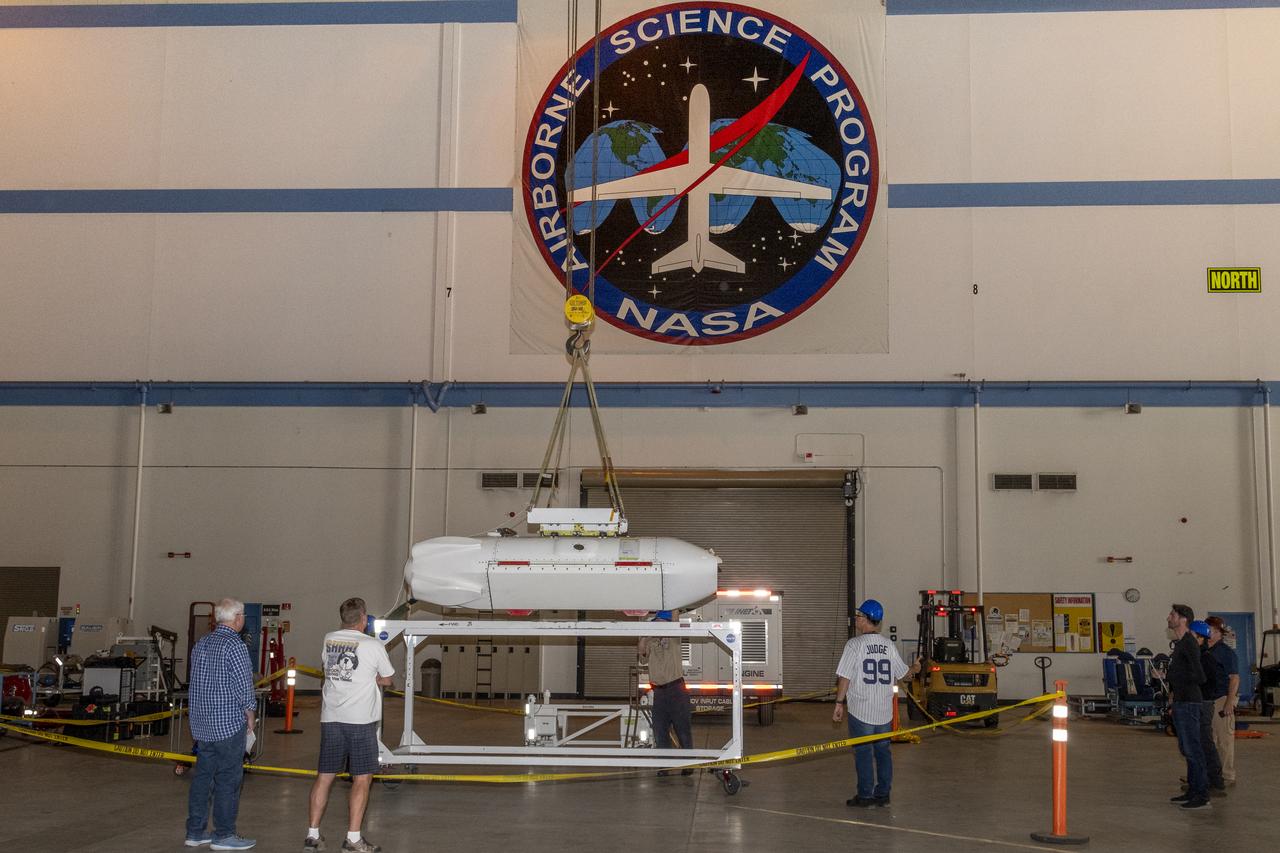
The Uninhabited Aerial Vehicle Synthetic Aperture Radar, UAVSAR, is prepared for installation onto NASA’s C-20A aircraft. THE UAVSAR uses a technique called interferometry to detect and measure very subtle deformations in the Earth’s surface, and the pod is specially designed to be interoperable with unmanned aircraft in the future. It will gather data from Gabon, Africa in September of 2023.

The Uninhabited Aerial Vehicle Synthetic Aperture Radar, UAVSAR, is prepared for installation onto NASA’s C-20A aircraft. THE UAVSAR uses a technique called interferometry to detect and measure very subtle deformations in the Earth’s surface, and the pod is specially designed to be interoperable with unmanned aircraft in the future. It will gather data from Gabon, Africa in September of 2023.
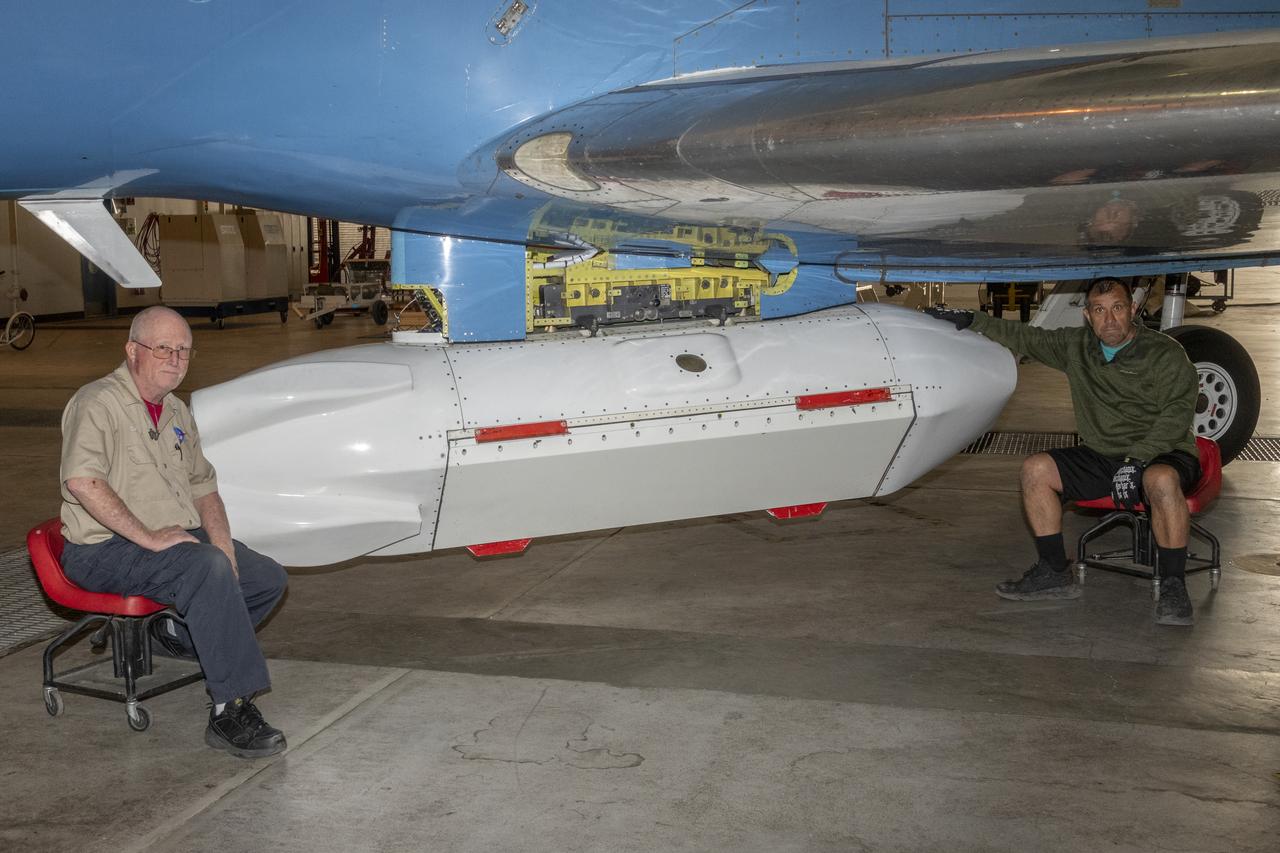
The Uninhabited Aerial Vehicle Synthetic Aperture Radar, UAVSAR, is prepared for installation onto NASA’s C-20A aircraft. THE UAVSAR uses a technique called interferometry to detect and measure very subtle deformations in the Earth’s surface, and the pod is specially designed to be interoperable with unmanned aircraft in the future. It will gather data from Gabon, Africa in September of 2023.

C-20A crew chief Isac Mata stows metal pins used to secure the landing gear, while Ian Elkin, operations engineer, boards the aircraft to prepare for takeoff from NASA’s Armstrong Flight Research Center in Edwards, California, on Wednesday, April 29, 2026. The aircraft conducted science flights over Central California carrying NASA’s UAVSAR (Uninhabited Aerial Vehicle Synthetic Aperture Radar), which collects detailed ground‑movement data to improve earthquake‑hazard models and support a new Earth‑observing satellite.
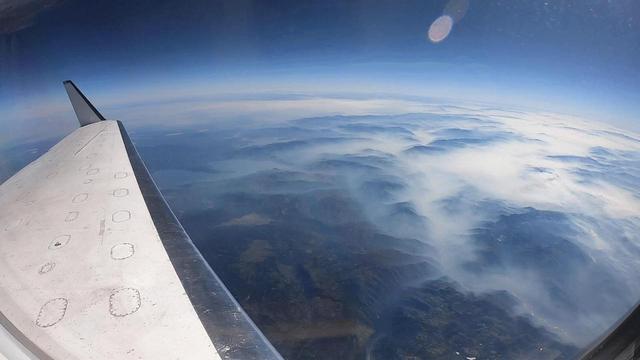
NASA flew an aircraft equipped with Uninhabited Aerial Vehicle Synthetic Aperture Radar (UAVSAR) flew above California fires on Sept. 3 and 10. The smoke-penetrating UAVSAR enables scientists to get a close-up view of how these fires have altered the landscape. Attached to the bottom of the aircraft, the radar is flown repeatedly over an area to measure tiny changes in surface height with extreme accuracy. The flight is part of the ongoing effort by NASA's Applied Sciences Disaster Program in the Earth Sciences Division, which generates maps and other data products that can be used by partner agencies on the ground to track fire hotspots, map the extent of the burn areas, and even measure the height of the smoke plumes that have drifted over California and neighboring states. Movie available at https://photojournal.jpl.nasa.gov/catalog/PIA24102

A C-20 based at NASA’s Armstrong Flight Research Center in Edwards, California, departs to use its Uninhabited Aerial Vehicle Synthetic Aperture Radar to support the Marine Oil Spill Thickness mission. Thousands of gallons of oil seep through cracks in the ocean floor and rise to the surface just off the coast of Santa Barbara. It’s one of the largest naturally occurring oil seeps and serves as a laboratory for NASA and the National Oceanic and Atmospheric Administration to test automated oil spill detection, oil extent mapping, and oil thickness characterization.
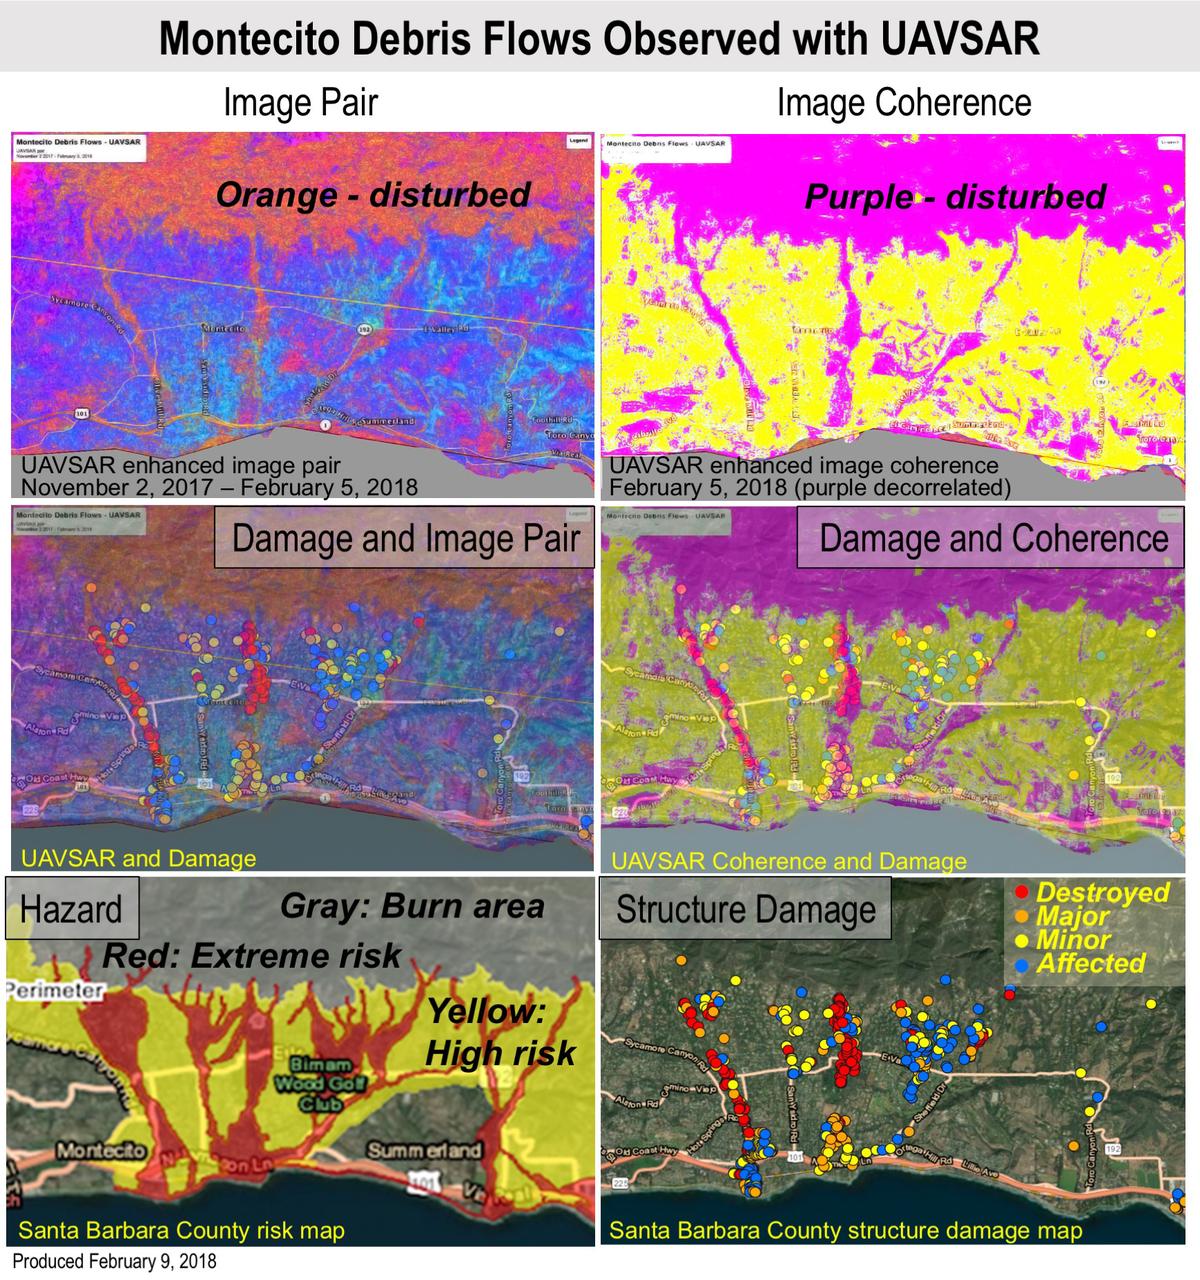
Extreme winter rains in January 2018 following the Thomas Fire in Ventura and Santa Barbara Counties caused severe debris flows, resulting in significant loss of life and considerable property damage in the town on Montecito, just east of Santa Barbara. NASA's Uninhabited Aerial Vehicle Synthetic Aperture Radar (UAVSAR) airborne radar platform detected changes caused by the debris flows between two images acquired on Nov. 2, 2017, and Feb. 5, 2018. An enhanced image pair (top left) shows disturbed areas in orange. In areas of severe surface disruption from the fire scar and debris flows the two image pairs can't be matched and decorrelate (top right). In the middle panels, the radar images are overlaid on the structure damage map produced by the County of Santa Barbara. The fire scars and damage correspond well with the risk map (lower left) and damage map (lower right). With an operational system, products such as these have the potential to augment information available for search and rescue, and for damage assessment for government agencies or the insurance industry. Radar has the advantage of being available in all weather conditions, as it can image through clouds. NASA's Uninhabited Aerial Vehicle Synthetic Aperture Radar (UAVSAR), developed and managed by the Jet Propulsion Laboratory, Pasadena, California, can record changes on the ground beneath the aircraft that occur between multiple flights, which take exactly the same flight path. The instrument is used to monitor how volcanoes, earthquakes, and other natural hazards are changing Earth. The JPL UAVSAR team collected and processed the imagery for Principal Investigator Andrea Donnellan who performed the analysis. She has been conducting ground change research using UAVSAR in this and other regions of California since 2009. https://photojournal.jpl.nasa.gov/catalog/PIA22243

An oil slick from naturally occurring oil seeps off the coast of Santa Barbara, California. The NASA-NOAA Marine Oil Spill Thickness (MOST) project is using the area to test the ability of a radar instrument called UAVSAR to detect the thickness of oil in oil slicks – important information for first responders to oil spills. Having concluded their second field campaign in Santa Barbara at the end of October, 2021, the MOST team is working to develop a way for NOAA – the lead federal agency for detecting and tracking coastal oil spills – to use remote sensing data to determine not just where oil is, but where the thickest parts of it are. NASA's UAVSAR, or Uninhabited Aerial Vehicle Synthetic Aperture Radar, attaches to the fuselage of an airplane that collects a roughly 12-mile-wide (19-kilometer-wide) image of the area. The instrument sends radar pulses down to the surface of the ocean, and the signals that bounce back are used to detect roughness, caused by waves, at the ocean's surface. Oil dampens the waves, creating areas of smoother water that appear darker than the surrounding clean water in the SAR imagery – the thicker the oil, the darker the area appears. When the project concludes, likely in 2023, scientists hope to have a prototype system for detecting oil spill thickness that can be deployed in emergencies. https://photojournal.jpl.nasa.gov/catalog/PIA23699
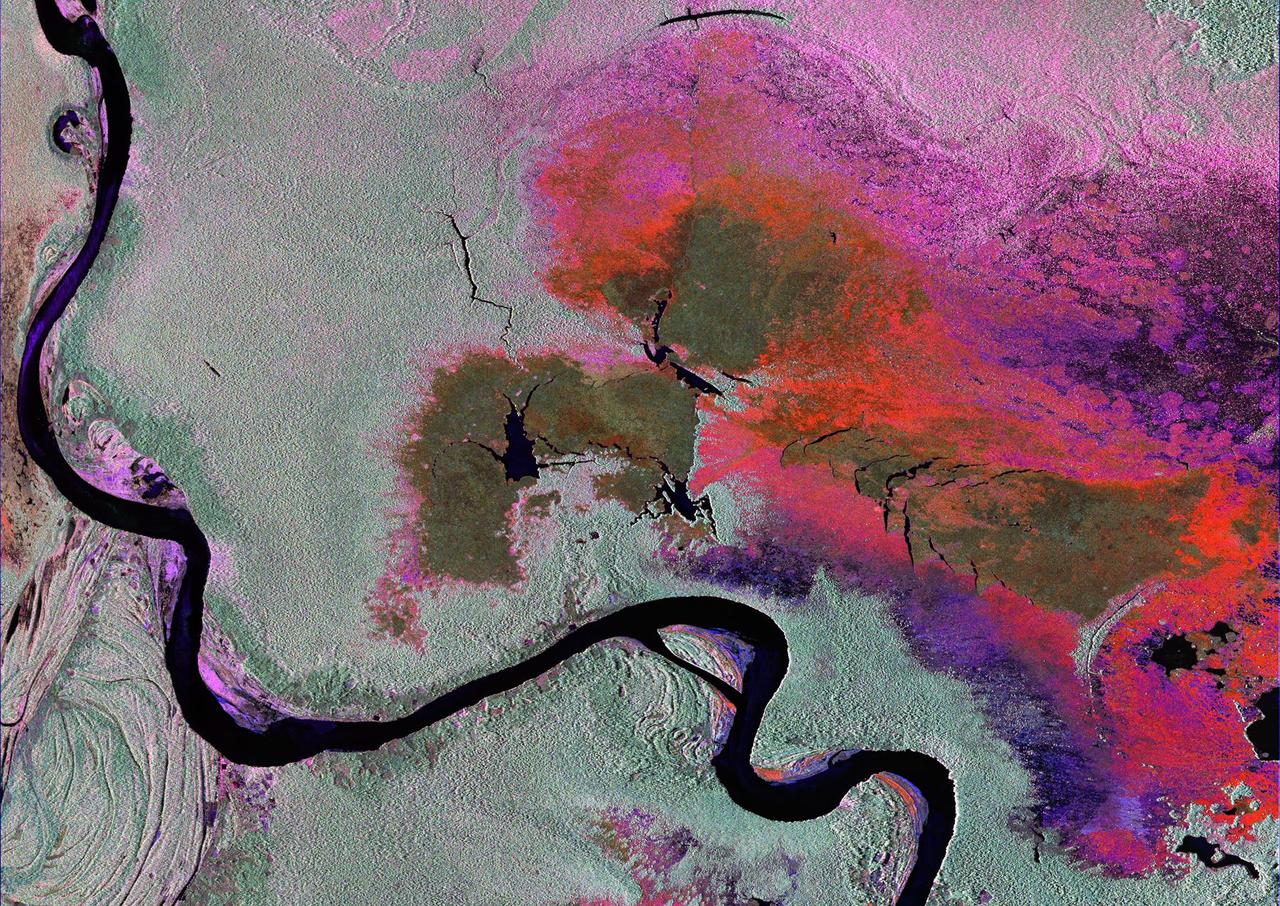
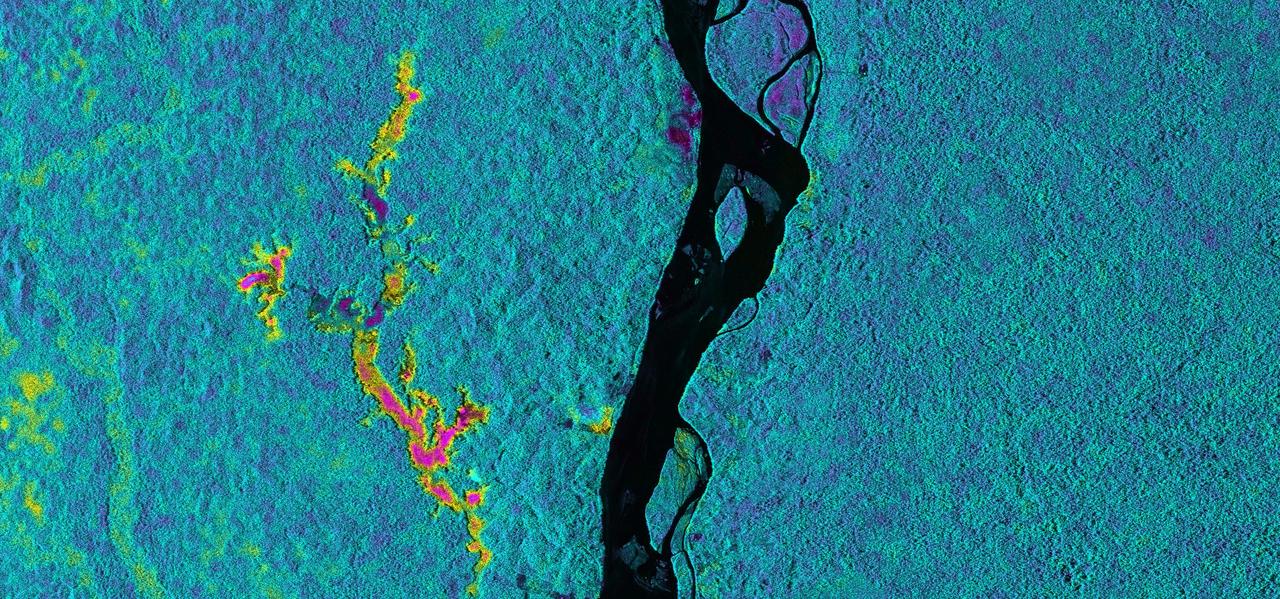
To show the kind of imagery that data from the NISAR (NASA-ISRO Synthetic Aperture Radar) satellite mission will be used to produce, researchers pointed to a 2013 image of flooding extent in the Pacaya-Samaria National Reserve that used data from the Uninhabited Aerial Vehicle Synthetic Aperture Radar (UAVSAR), an airborne system. In the image of this flood-prone area of the Amazonian jungle in Peru, black indicates open water, grayish-green is tropical forest, dark green is low-lying or floating vegetation, and red and pink are two different types of flooded vegetation. NISAR will offer detailed insights into the flooding patterns of the planet's wetland ecosystems, which will help researchers understand how these areas are being affected by climate change and human activity and the role they play in the global carbon cycle. NISAR is a joint mission of the U.S. and Indian space agencies. When in orbit, its sophisticated L- and S-band radar systems will scan nearly all of Earth's land and ice surfaces twice every 12 days with exquisite precision. Scheduled to launch in early 2024, NISAR is an equal collaboration between NASA and the Indian Space Research Organisation and marks the first time the two agencies have cooperated on hardware development for an Earth-observing mission. NASA's Jet Propulsion Laboratory, which is managed for the agency by Caltech in Pasadena, leads the U.S. component of the project and is providing the mission's L-band SAR. NASA is also providing the radar reflector antenna, the deployable boom, a high-rate communication subsystem for science data, GPS receivers, a solid-state recorder, and payload data subsystem. ISRO's U R Rao Satellite Centre in Bengaluru, which is leading the ISRO component of the mission, is providing the spacecraft bus, the S-band SAR electronics, the launch vehicle, and associated launch services and satellite mission operations. https://photojournal.jpl.nasa.gov/catalog/PIA26112
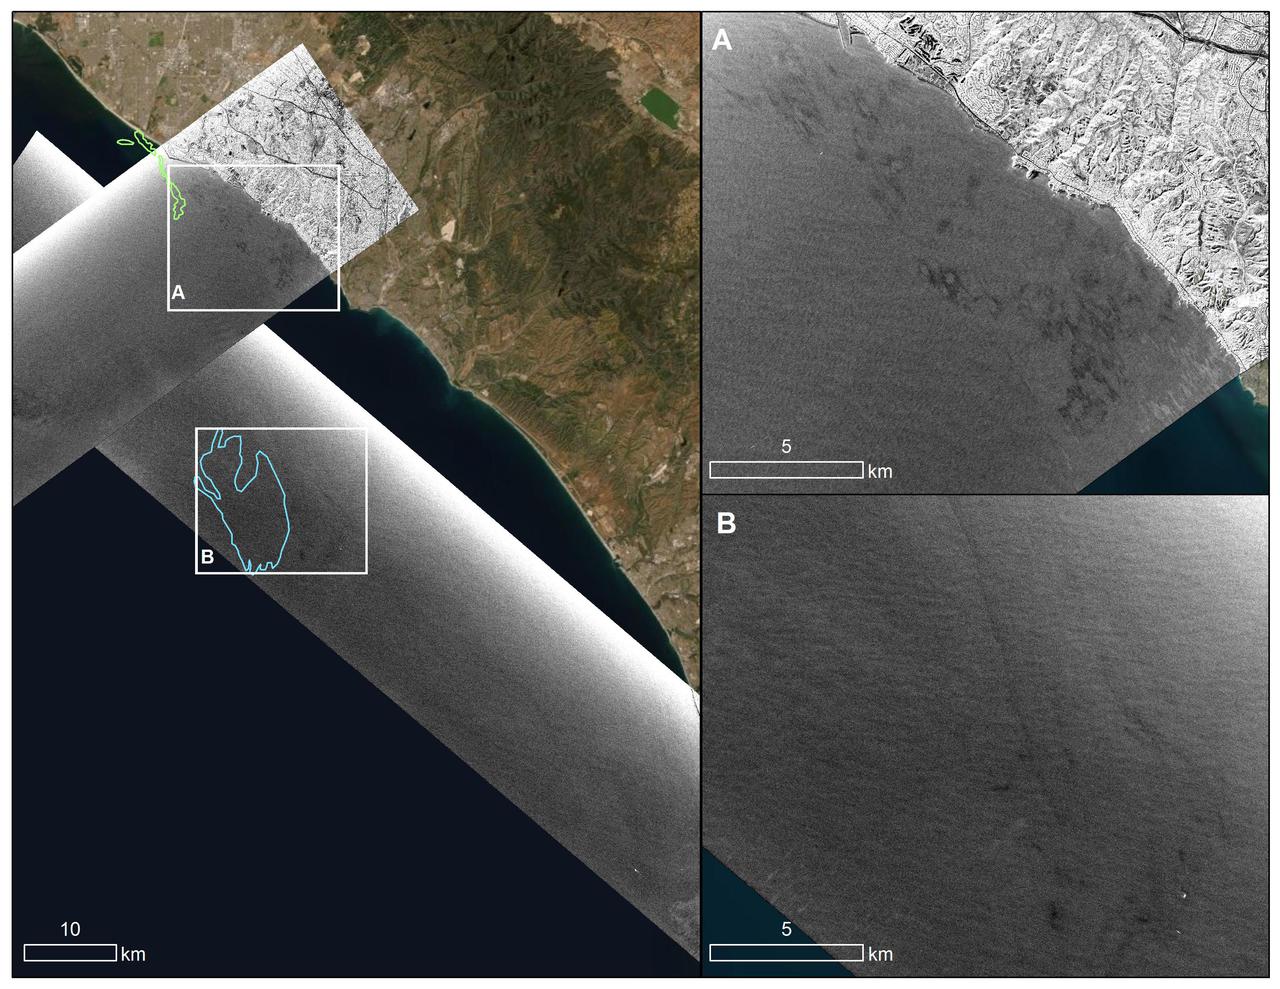
An oil spill off the Southern California coast – first reported to the U.S. Coast Guard on Oct. 2, 2021 – prompted an effort by NASA's Applied Sciences Disasters Program to determine what NASA resources and capabilities could be available to support response efforts for the spill. As part of those efforts, a team from NASA's Jet Propulsion Laboratory in Southern California flew an airplane equipped with an instrument known as the Uninhabited Aerial Vehicle Synthetic Aperture Radar (UAVSAR) over the spill area on Oct. 6 to corroborate the presence and location of oil slicks. Mapping the location of oil slicks and determining how thick the oil is can also help with clean-up activities. The JPL researchers collected the UAVSAR data in support of the National Oceanic and Atmospheric Administration (NOAA), which regularly monitors U.S. coastal waters for potential spills. This image shows a composite of two images taken during passes (grayscale regions) made by the UAVSAR instrument off the coast of Huntington Beach. Dark smudges off the coast in the close-up images to the right (labeled A and B) are potential oil slicks – NOAA researchers will analyze the data to look for the presence of oil. The area outlined in light green (image on the left) was identified by NOAA using satellite data as a region possibly containing oil on Oct.3, while the blue outline shows an area on Oct. 6 that could also contain oil. Attached to the bottom of a Gulfstream-III based at NASA's Armstrong Flight Research Center near Palmdale, California, UAVSAR is an all-weather tool that bounces radar signals off of Earth's surface. Repeated images of the same areas, taken at different times, enable scientists to detect changes in those regions. The radar signals will reflect differently off of different surfaces, including oil and seawater. These signal variations can tell researchers about the presence of an oil slick in the ocean, and in some cases provide information about its thickness. https://photojournal.jpl.nasa.gov/catalog/PIA23782
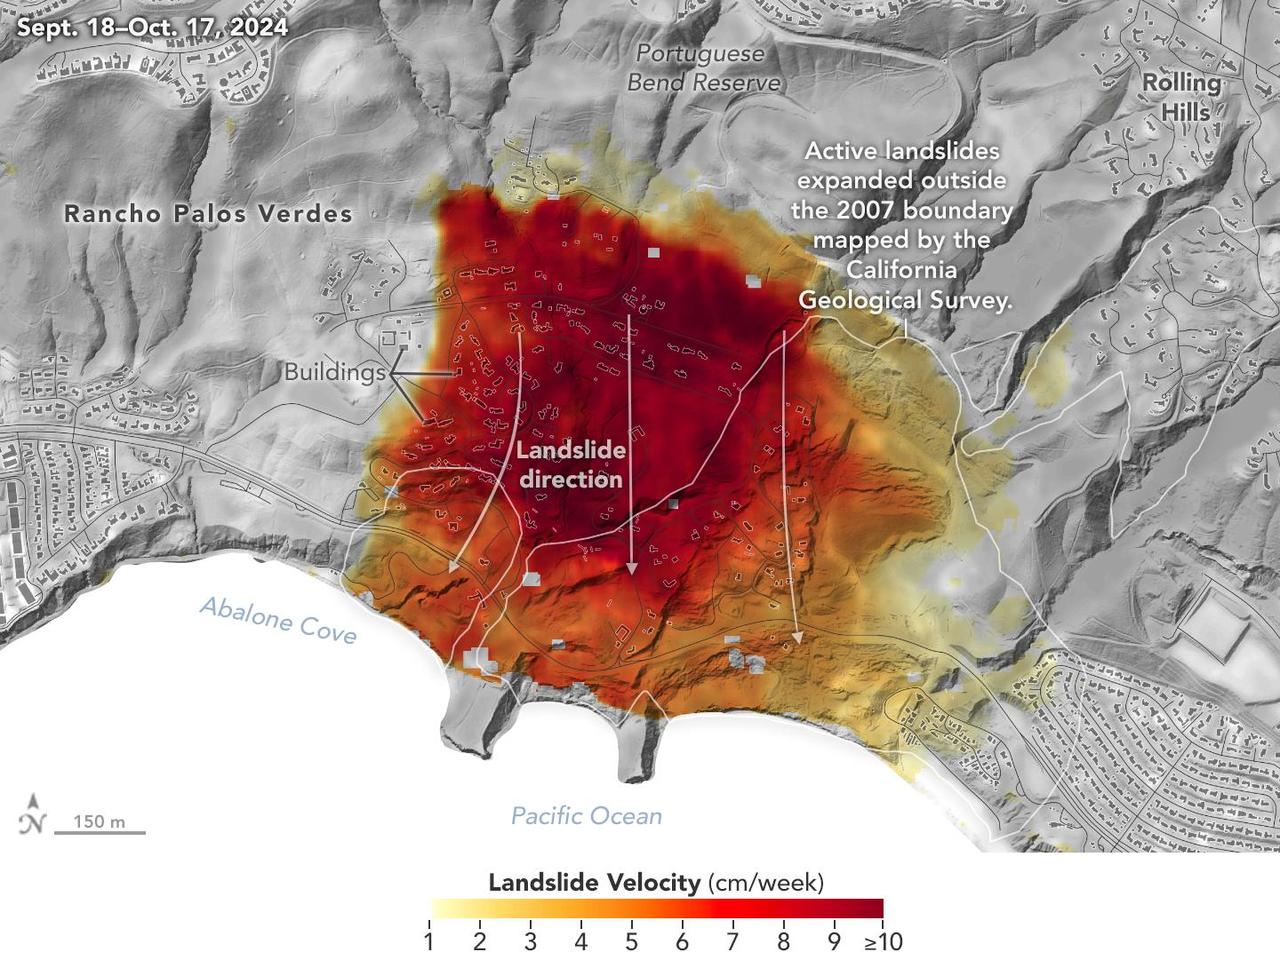
Researchers at NASA's Jet Propulsion Laboratory in Southern California used data from an airborne radar to measure the movement of the slow-moving landslides on the Palos Verdes Peninsula in Los Angeles County. The analysis determined that, during a period of four weeks in the fall of 2024, land in the residential area slid toward the ocean by as much as 4 inches (10 centimeters) per week. Portions of the peninsula, which juts into the Pacific Ocean just south of the city of Los Angeles, is part of an ancient complex of landslides and has been moving for at least the past six decades, affecting hundreds of buildings in local communities. The motion accelerated and the active area expanded following record-breaking rainfall in Southern California in 2023 and another heavy-precipitation winter in 2024. To create this visualization, the Advanced Rapid Imaging and Analysis (ARIA) team used data from four flights of NASA's Uninhabited Aerial Vehicle Synthetic Aperture Radar (UAVSAR) that took place between Sept. 18 and Oct. 17. The UAVSAR instrument was mounted to a Gulfstream III jet flown out of NASA's Armstrong Flight Research Center in Edwards, California, and the four flights were planned to estimate the speed and direction of the landslides in three dimensions. In the image, colors indicate how fast parts of the landslide complex were moving in late September and October, with the darkest reds indicating the highest speeds. The arrows represent the direction of horizontal motion. The white solid lines are the boundaries of active landslide areas as defined in 2007 by the California Geological Survey. The insights from the UAVSAR flights were part of a package of analyses by the ARIA team that also used data from ESA's (the European Space Agency's) Copernicus Sentinel-1A/B satellites. The analyses were provided to California officials to support the state's response to the landslides and made available to the public at NASA's Disaster Mapping Portal. The ARIA mission is a collaboration between JPL and Caltech, which manages JPL for NASA, to leverage radar and optical remote-sensing, GPS, and seismic observations for science as well as to aid in disaster response. The project investigates the processes and impacts of earthquakes, volcanoes, landslides, fires, subsurface fluid movement, and other natural hazards. UAVSAR has flown thousands of radar missions around the world since 2007 studying phenomena such as glaciers and ice sheets, vegetation in ecosystems, and natural hazards like earthquakes, volcanoes, and landslides. https://photojournal.jpl.nasa.gov/catalog/PIA26495
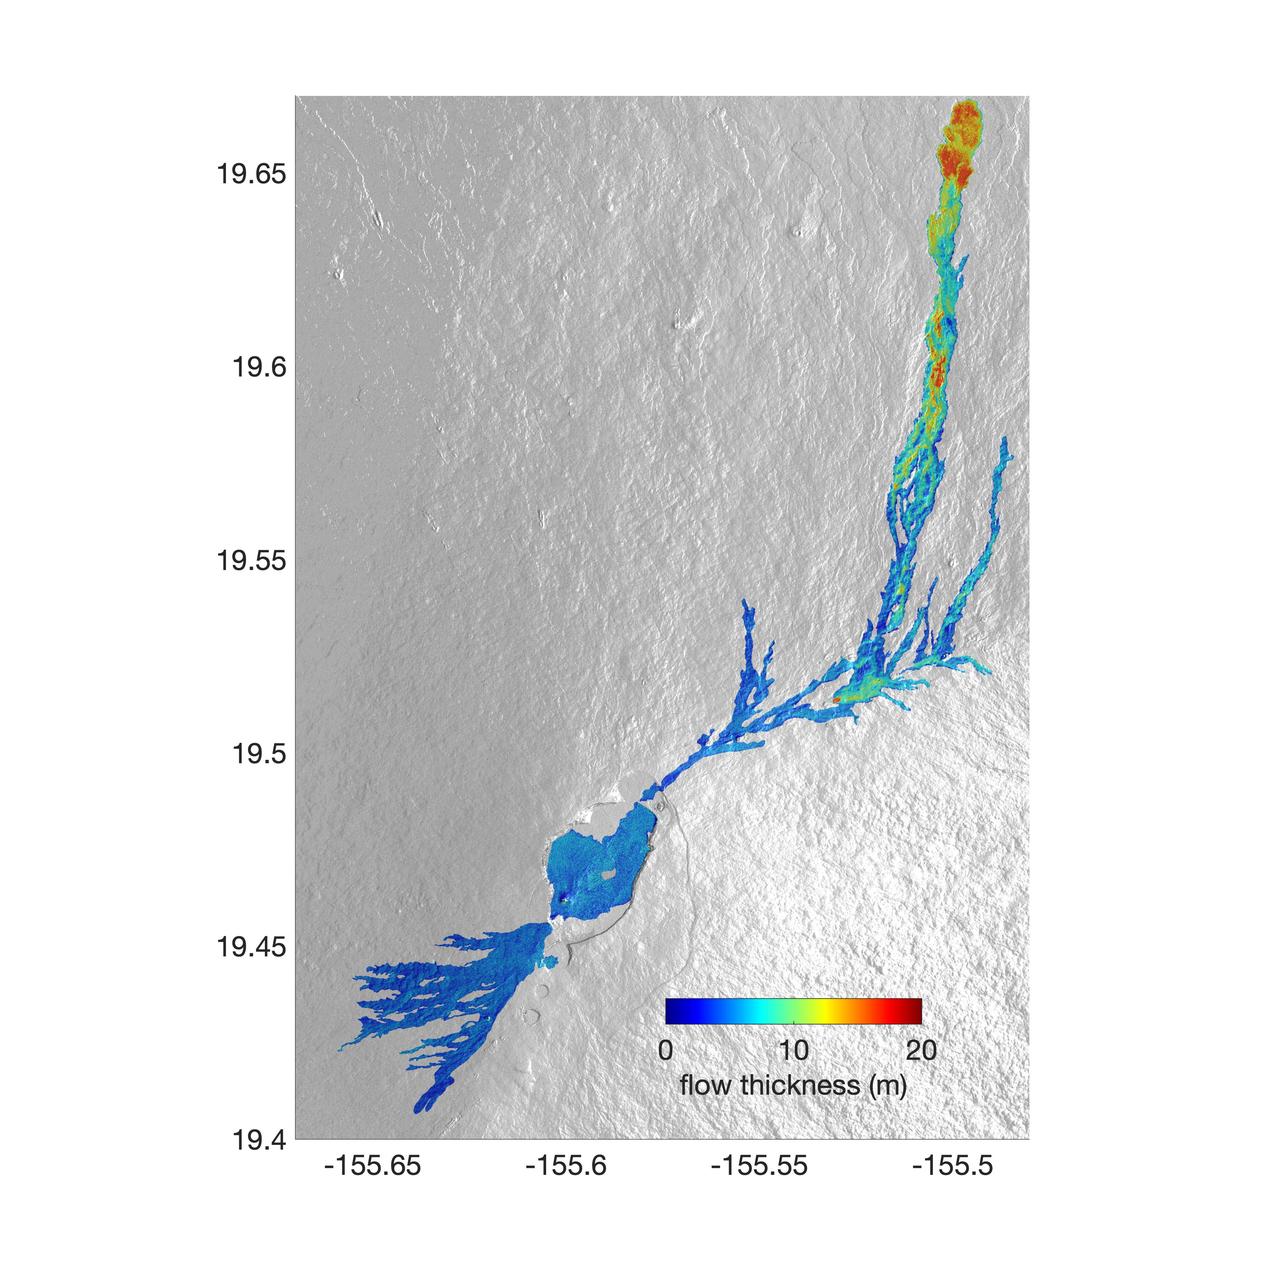
The world's largest active volcano – Hawaii's Mauna Loa – had been quiet for 38 years. But in 2022, the volcano began to stir, showing increased numbers of small earthquakes and subtle swelling of certain land surfaces in September. On November 27, fountains of lava began spurting from the mountain's Northeast Rift Zone and streams of molten rock flowed to the north. Ten days into the eruption, a NASA aircraft conducted its first flight over the erupting volcano. It carried NASA's Uninhabited Aerial Vehicle Synthetic Aperture Radar (UAVSAR) system, which was used to map the volcano's topography in fine detail with a Ka-band instrument called GLISTIN-A. Teams from NASA's Jet Propulsion Laboratory and the United States Geological Survey (USGS) used data from that sensor to map the thickness of those flows during a series of flights on December 7, 8, and 10. The map above shows the thickness of the lava flows during the flight on December 7, the day before USGS scientists noticed a significant decline in the pace of the eruption. A few days later, they declared the eruption had stopped. The map shows the thickness of the lava flows in the summit caldera, where the eruption began, and of lava flows on Mauna Loa's northeastern flank. The color variation from blue to orange indicates increasing lava flow thickness. A maximum thickness of roughly 25 meters (82 feet) is shown, though values exceeding 40 meters (131 feet) were observed in some areas. The thickening at the northern end of the flow is due to lava accumulating away from the vent, along with a flattening of the terrain at the saddle between the Mauna Loa and Mauna Kea volcanoes. By comparing to pre-eruption maps of this area's topography, including GLISTIN-A data collected in 2017, the USGS researchers were able to calculate the size and volume of the lava flow. Over the roughly 14-day eruption, Mauna Loa erupted more than 8.8 billion cubic feet (230 million cubic meters) along a lava flow that extended up to 16.5 miles (19.5 kilometers) from the vent, according to the USGS. The UAVSAR operates from a pod mounted beneath a crewed Gulfstream III jet from NASA's Armstrong Flight Research Center in California. Repeated topographic maps generated with each flight reveal the progression and thickening of lava with time – important information for scientific understanding of volcano processes and for emergency response. For the Mauna Loa science flights, the instrument suite featured an additional state-of-the-art imaging tool: the synthetic aperture radar-fusion optical short-wave infrared (SAR-Fusion Optical/SWIR) camera system. SAR-Fusion collects data over the same ground swath as GLISTIN-A to map land surface changes using optical/SWIR photogrammetry methods. GLISTIN-A was designed to provide all-weather, high-resolution surface topography not available through existing lidar or radar sensors. GLISTIN-A was originally demonstrated as a new radar technique for mapping ice surfaces. Science demonstration flights began in 2013 over alpine glaciers and sea ice in Alaska, and a floodplain in California. Its applications have since expanded to other areas, such as snow accumulation and volcano dynamics. The first time the instrument was deployed for volcano response was in 2018 during the three-month eruption of Kilauea. The success of that operation paved the way for deployment to Mauna Loa. https://photojournal.jpl.nasa.gov/catalog/PIA25526

An oil slick in the Gulf of Mexico following Hurricane Ida – a high-end Category 4 when it made landfall near Port Fourchon, Louisiana, on Aug. 29, 2021 – appears as a green trail in the inset false-color graphic provided by NASA's Delta-X project, while the surrounding seawater appears orange. The National Oceanic and Atmospheric Administration (NOAA) regularly monitors U.S. coastal waters for potential spills and noticed slicks that appeared just off the coast after the hurricane. They were able to use this information from Delta-X to corroborate other data they had about oil slicks in the area (satellite image in the second inset picture). The blue-green swath crossing from the Gulf of Mexico over the Louisiana coast denotes the flight path of the Delta-X radar instrument on Sept. 1, just before 11:30 a.m. CDT. Charged with studying the Mississippi River Delta, Delta-X was gearing up to collect data on Louisiana's coastal wetlands when Hurricane Ida barreled ashore in late August. The storm damaged buildings and infrastructure alike, resulting in power outages, flooding, and oil slicks in the Gulf of Mexico. Oil tends to smooth out the bumps on the ocean's surface, which results in a distinct radar signal that the Delta-X mission was able to pick out of their data. Delta-X added flight paths to their planned schedule – with the support of NASA's Applied Science Disaster Program – in order to collect information over the gulf in areas of interest to NOAA. Delta-X is studying two wetlands – the Atchafalaya and Terrebonne Basins – by land, boat, and air to quantify water and sediment flow as well as vegetation growth. While the Atchafalaya Basin has been gaining land through sediment accumulation, Terrebonne Basin, which is right next to the Atchafalaya, has been rapidly losing land. The data collected by the project will be applied to models used to forecast which areas of the delta are likely to gain or lose land under various sea level rise, river flow, and watershed management scenarios. The mission uses several instruments to collect its data. Affixed to the bottom of a Gulfstream-III airplane, one of those instruments, the all-weather Uninhabited Aerial Vehicle Synthetic Aperture Radar (UAVSAR), bounces radar signals off of Earth's surface, forming a kind of image of a particular area. Repeated images of the same regions, captured at different times, enable researchers to detect changes in those areas, such as fluctuating water levels beneath the vegetation as the tides move in and out of these wetlands. In addition to radar measurements, teams from Caltech, Louisiana State University, Florida International University, and other collaborating institutions gather water and vegetation samples – among other data – by boat, other airborne sensors, and from instruments on the ground. Funded by NASA's Earth Venture Suborbital (EVS-3) program, Delta-X is managed by the agency's Jet Propulsion Laboratory. Caltech in Pasadena, California, manages JPL for NASA. Fall 2021 was Delta-X's last scheduled field campaign, although the five-year mission will run through the end of 2023. https://photojournal.jpl.nasa.gov/catalog/PIA24540