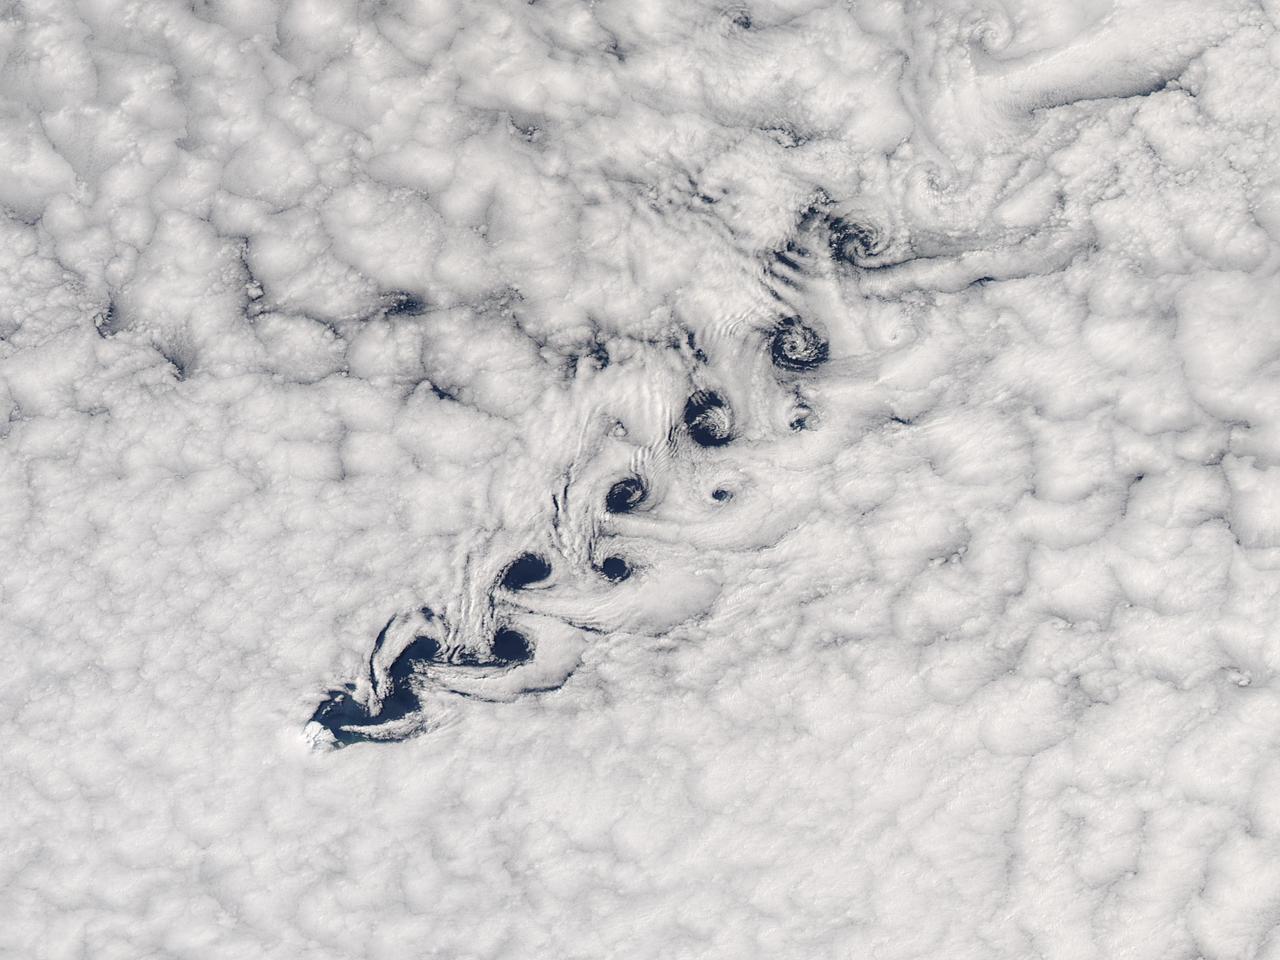
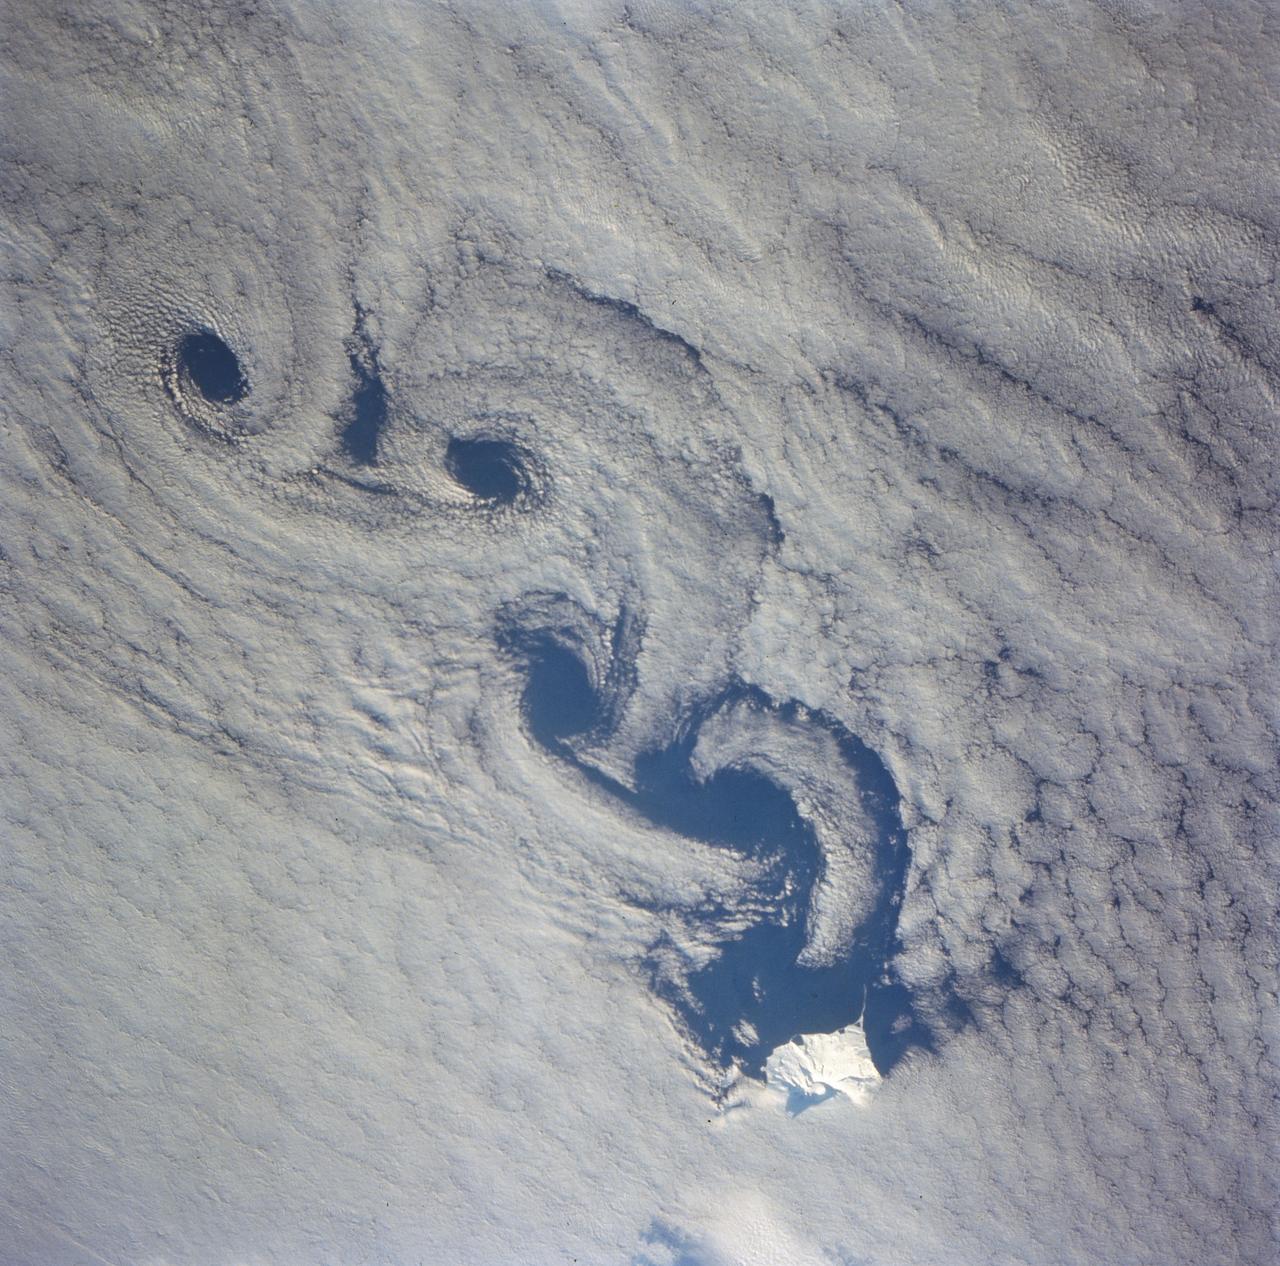
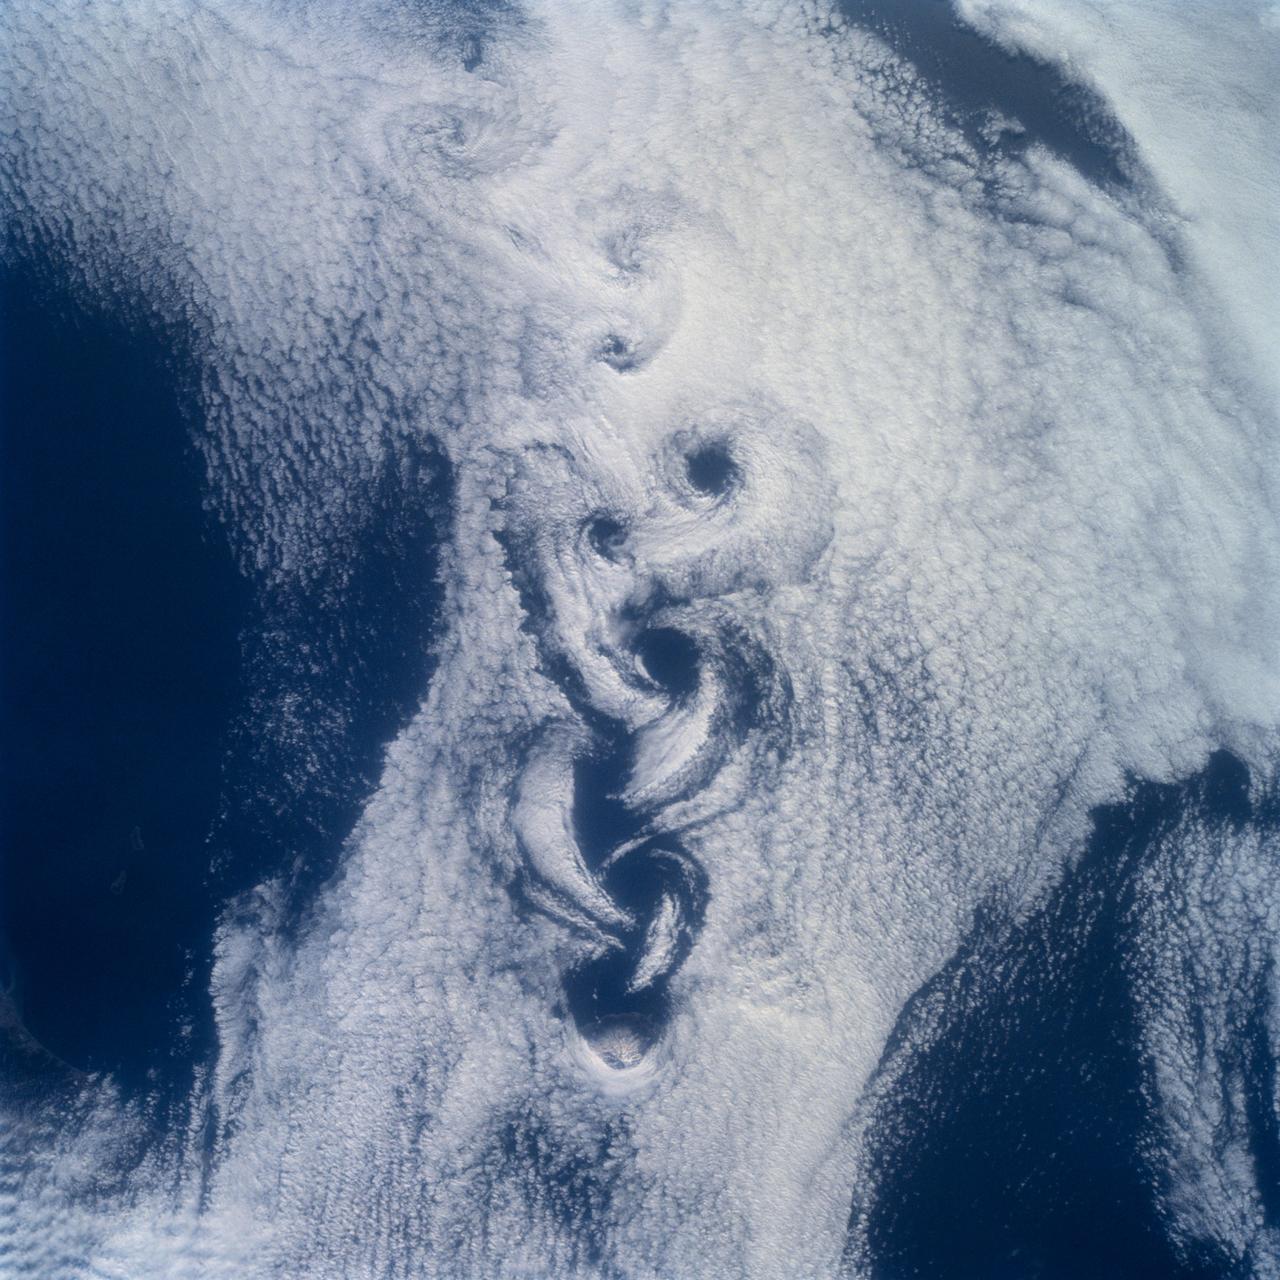
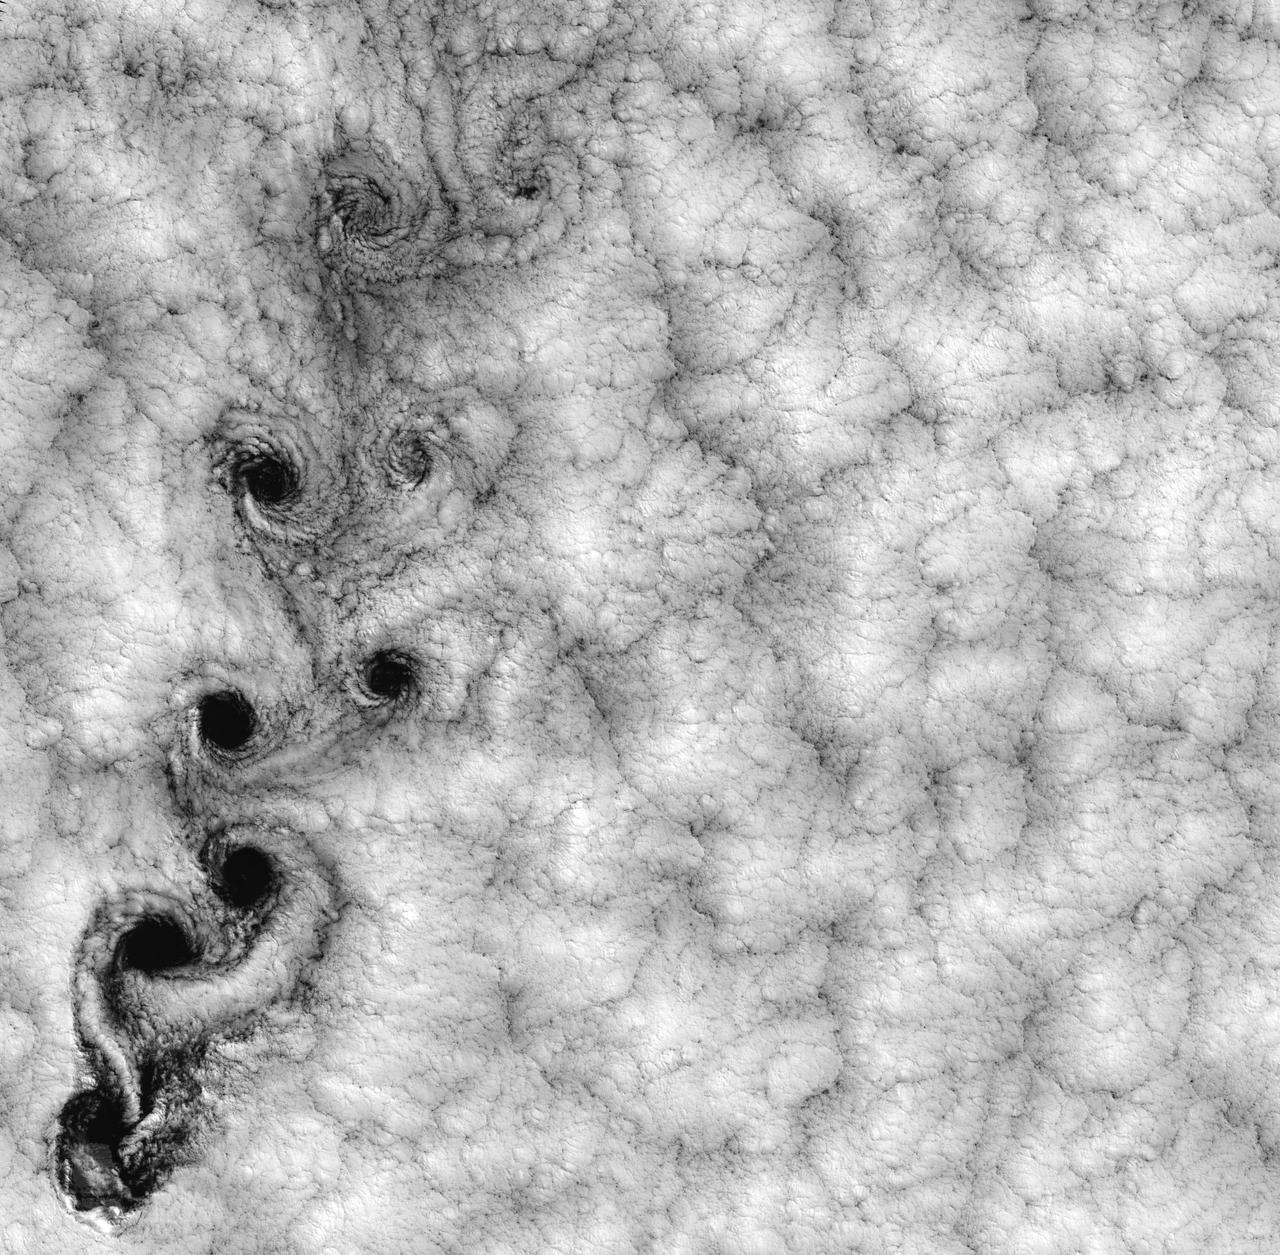
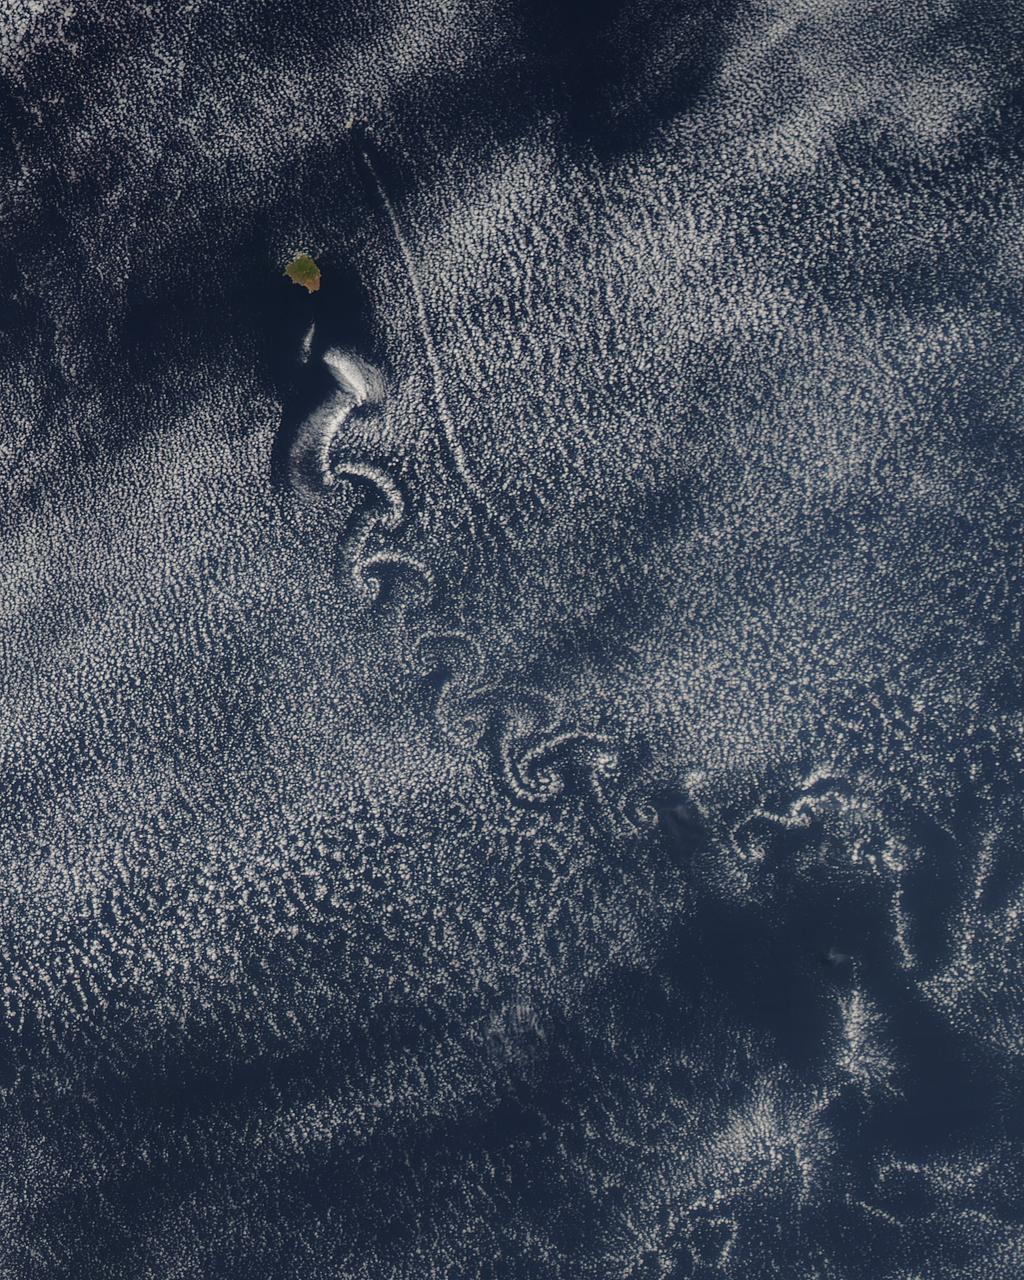
Cloud vortices off Heard Island, south Indian Ocean. The Moderate Resolution Imaging Spectroradiometer (MODIS) aboard NASA’s Aqua satellite captured this true-color image of sea ice off Heard Island on Nov 2, 2015 at 5:02 AM EST (09:20 UTC). Credit: NASA/GSFC/Jeff Schmaltz/MODIS Land Rapid Response Team
Filaments and Vortices
Raging Vortices
Dual Vortices
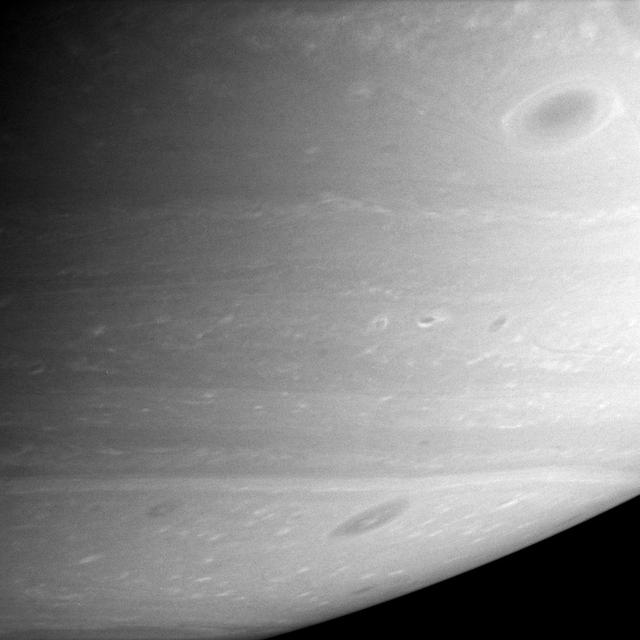
Vortices Abound
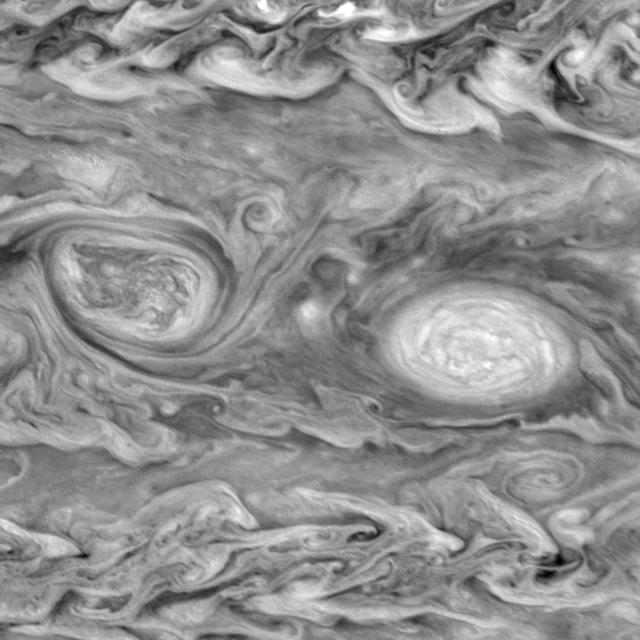
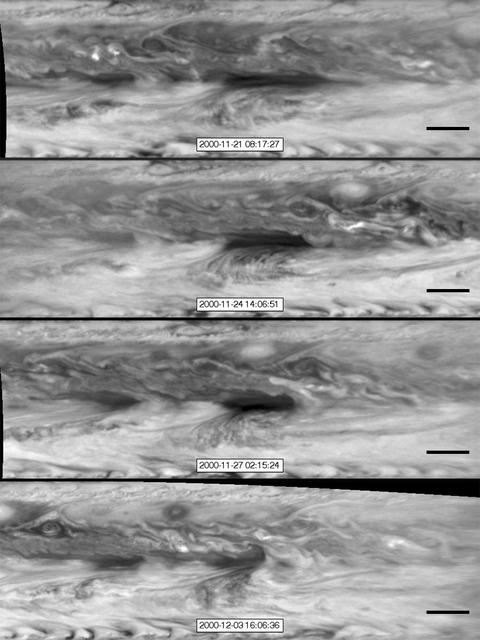
Two frame "movie" of a pair of vortices in Jupiter's southern hemisphere. The two frames are separated by ten hours. The right oval is rotating counterclockwise, like other anticyclonic bright vortices in Jupiter's atmosphere. The left vortex is a cyclonic (clockwise) vortex. The differences between them (their brightness, their symmetry, and their behavior) are clues to how Jupiter's atmosphere works. The frames span about fifteen degrees in latitude and longitude and are centered at 141 degrees west longitude and 36 degrees south planetocentric latitude. Both vortices are about 3500 kilometers in diameter in the north-south direction. The images were taken in near infrared light at 756 nanometers and show clouds that are at a pressure level of about 1 bar in Jupiter's atmosphere. North is at the top. The smallest resolved features are tens of kilometers in size. These images were taken on May 7, 1997, at a range of 1.5 million kilometers by the Solid State Imaging system on NASA's Galileo spacecraft. An animation is available at http://photojournal.jpl.nasa.gov/catalog/PIA01230

Cloud vortices off Heard Island, south Indian Ocean. The Moderate Resolution Imaging Spectroradiometer (MODIS) aboard NASA’s Aqua satellite captured this true-color image of sea ice off Heard Island on Nov 2, 2015 at 5:02 AM EST (09:20 UTC). Credit: NASA/GSFC/Jeff Schmaltz/MODIS Land Rapid Response Team <b><a href="http://www.nasa.gov/audience/formedia/features/MP_Photo_Guidelines.html" rel="nofollow">NASA image use policy.</a></b> <b><a href="http://www.nasa.gov/centers/goddard/home/index.html" rel="nofollow">NASA Goddard Space Flight Center</a></b> enables NASA’s mission through four scientific endeavors: Earth Science, Heliophysics, Solar System Exploration, and Astrophysics. Goddard plays a leading role in NASA’s accomplishments by contributing compelling scientific knowledge to advance the Agency’s mission. <b>Follow us on <a href="http://twitter.com/NASAGoddardPix" rel="nofollow">Twitter</a></b> <b>Like us on <a href="http://www.facebook.com/pages/Greenbelt-MD/NASA-Goddard/395013845897?ref=tsd" rel="nofollow">Facebook</a></b> <b>Find us on <a href="http://instagrid.me/nasagoddard/?vm=grid" rel="nofollow">Instagram</a></b>
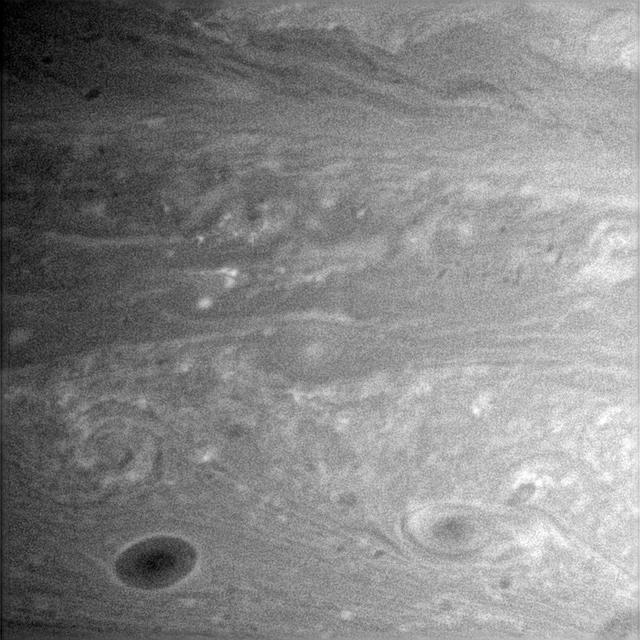
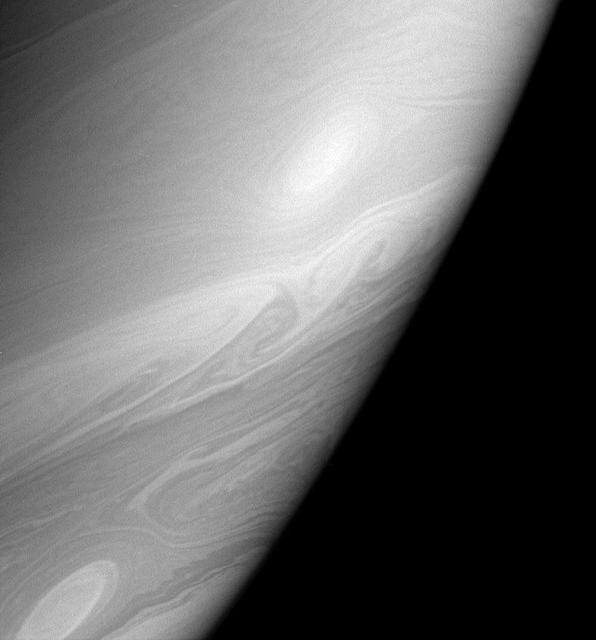
With no solid land to obstruct their progress, dark vortices often roll through Saturn atmosphere for months or years, before merging with other vortices
July 4th, 2002: Description: As air flows over and around objects in its path, spiraling eddies, known as Von Karman vortices, may form. The vortices in this image were created when prevailing winds sweeping east across the northern Pacific Ocean encountered Alaska’s Aleutian Islands. Source: Landsat 7 To learn more about the Landsat satellite go to: <a href="http://landsat.gsfc.nasa.gov/" rel="nofollow">landsat.gsfc.nasa.gov/</a>
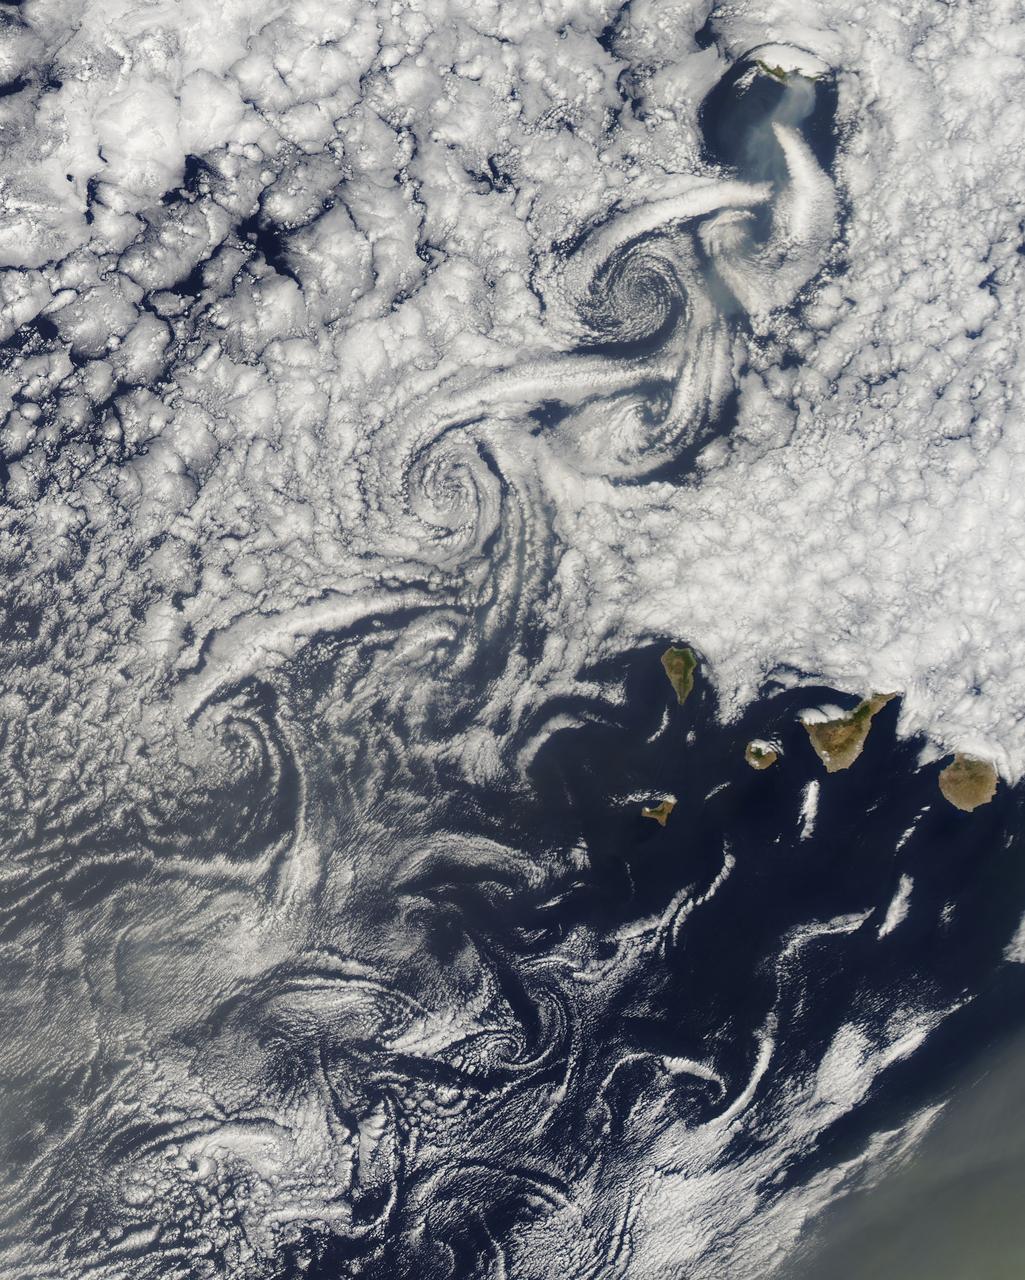
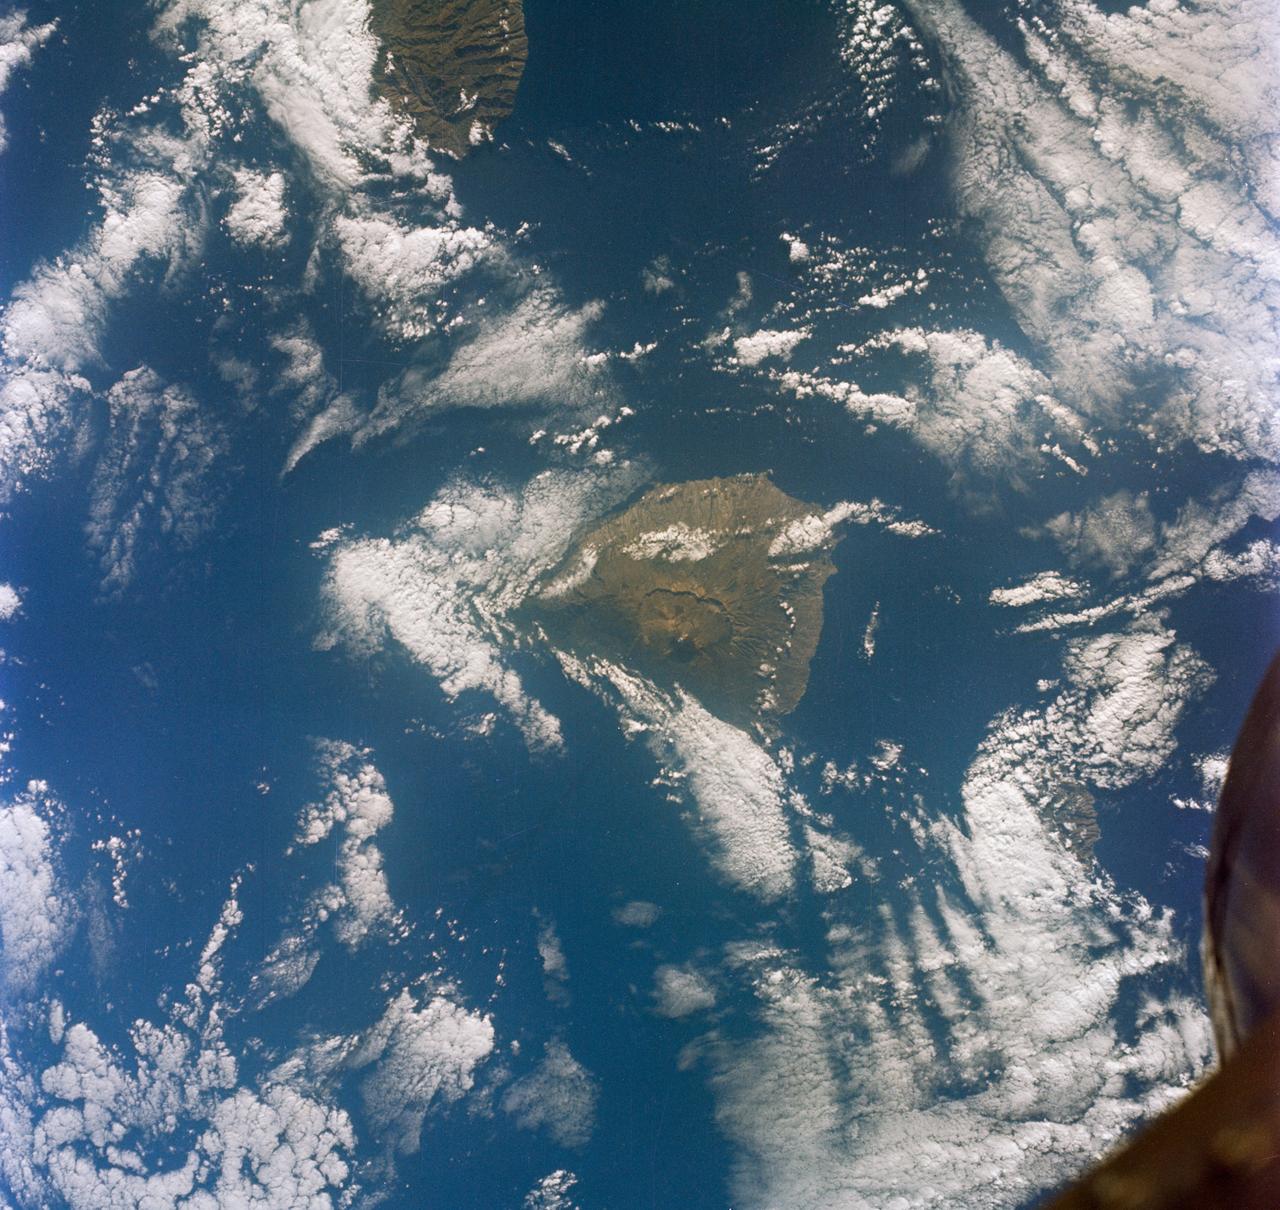
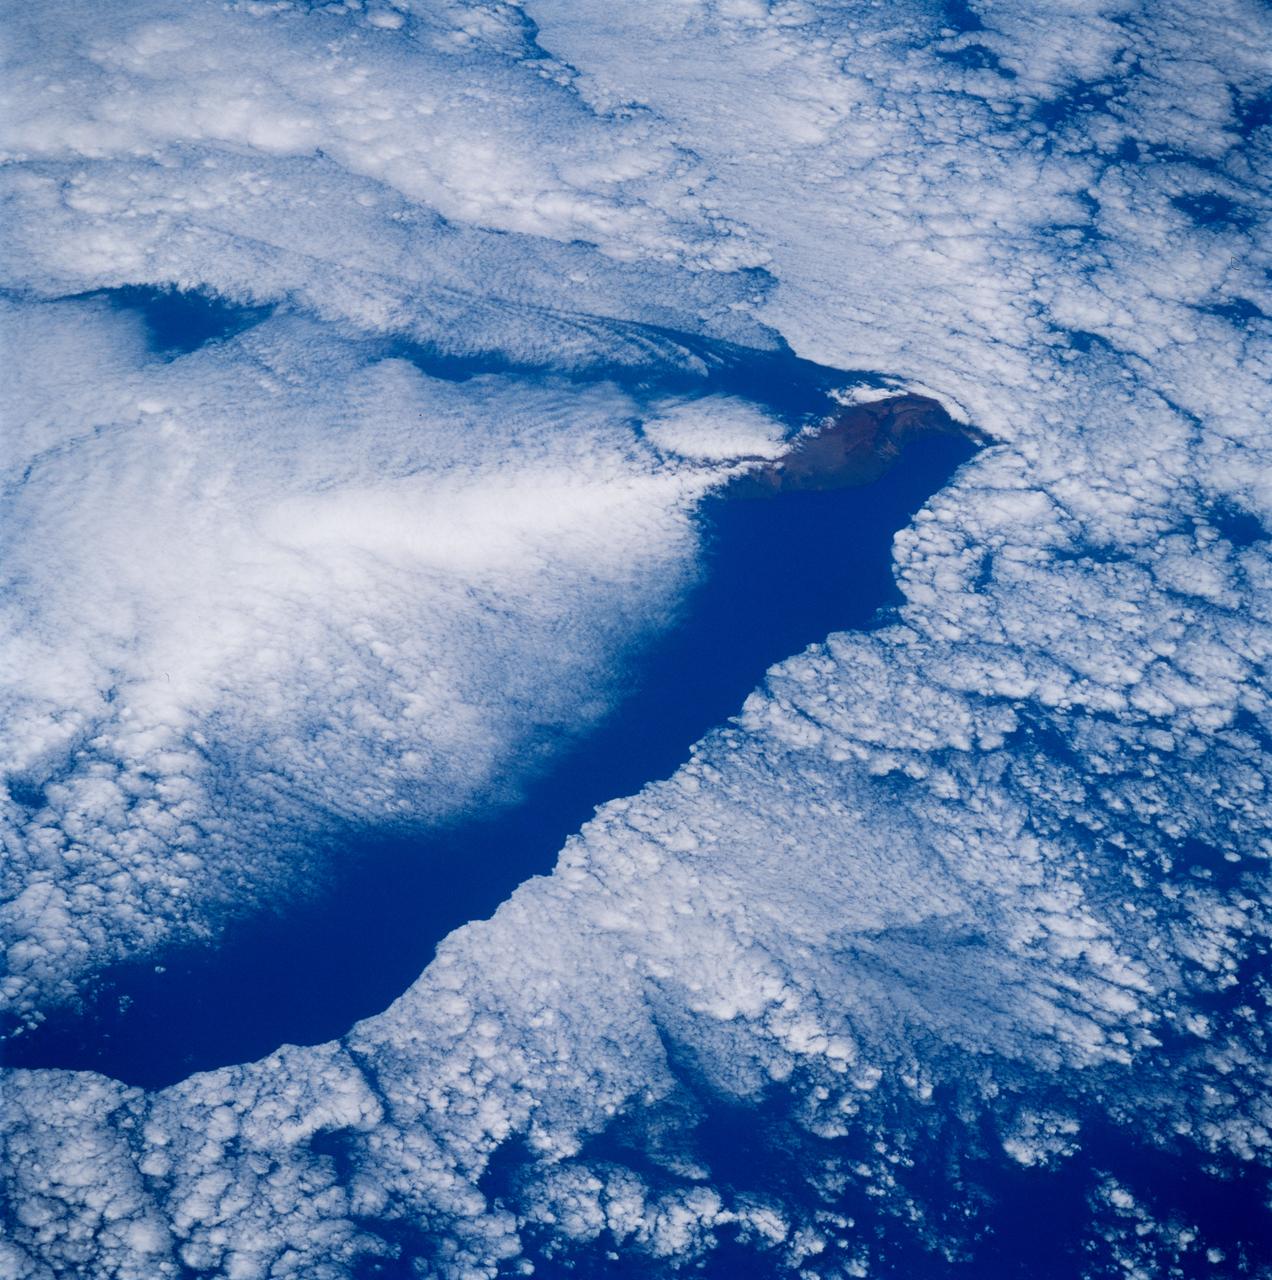
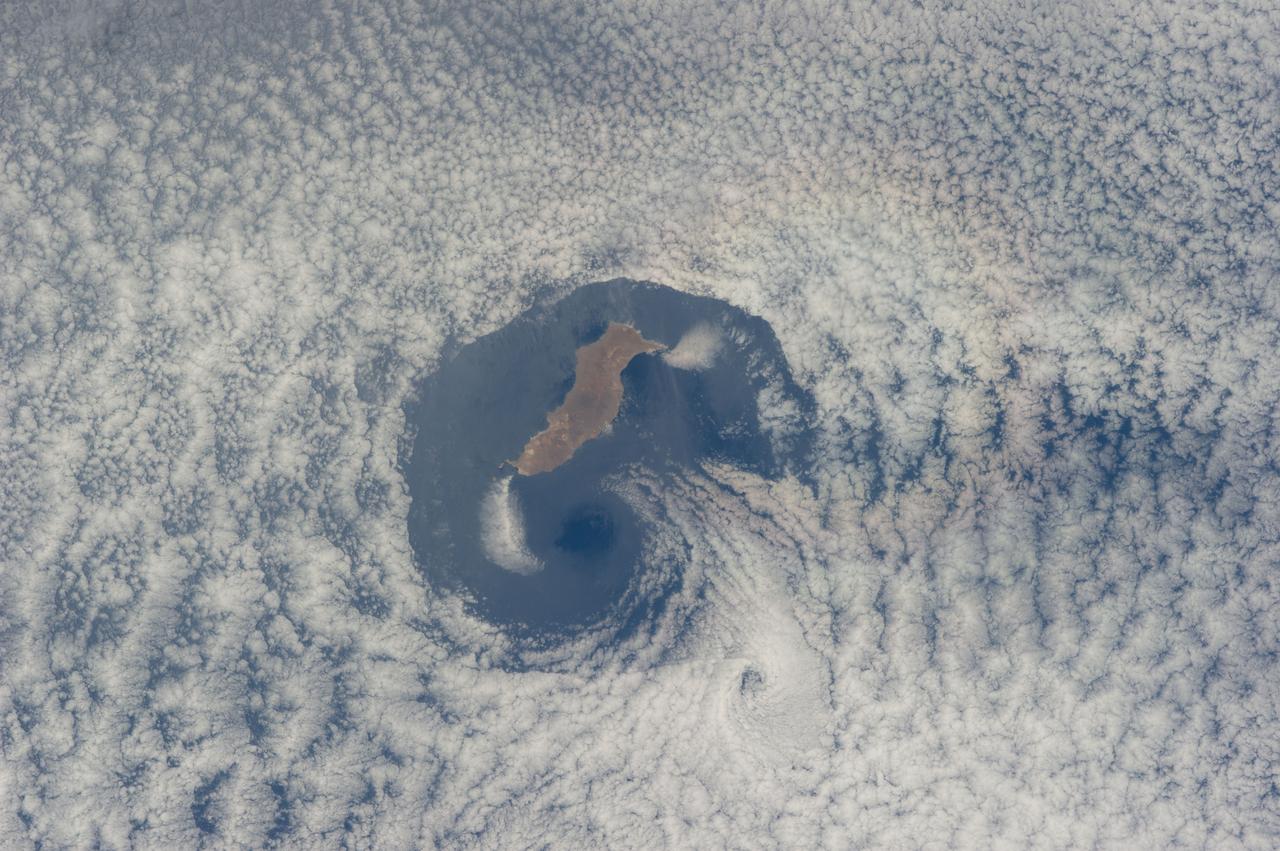
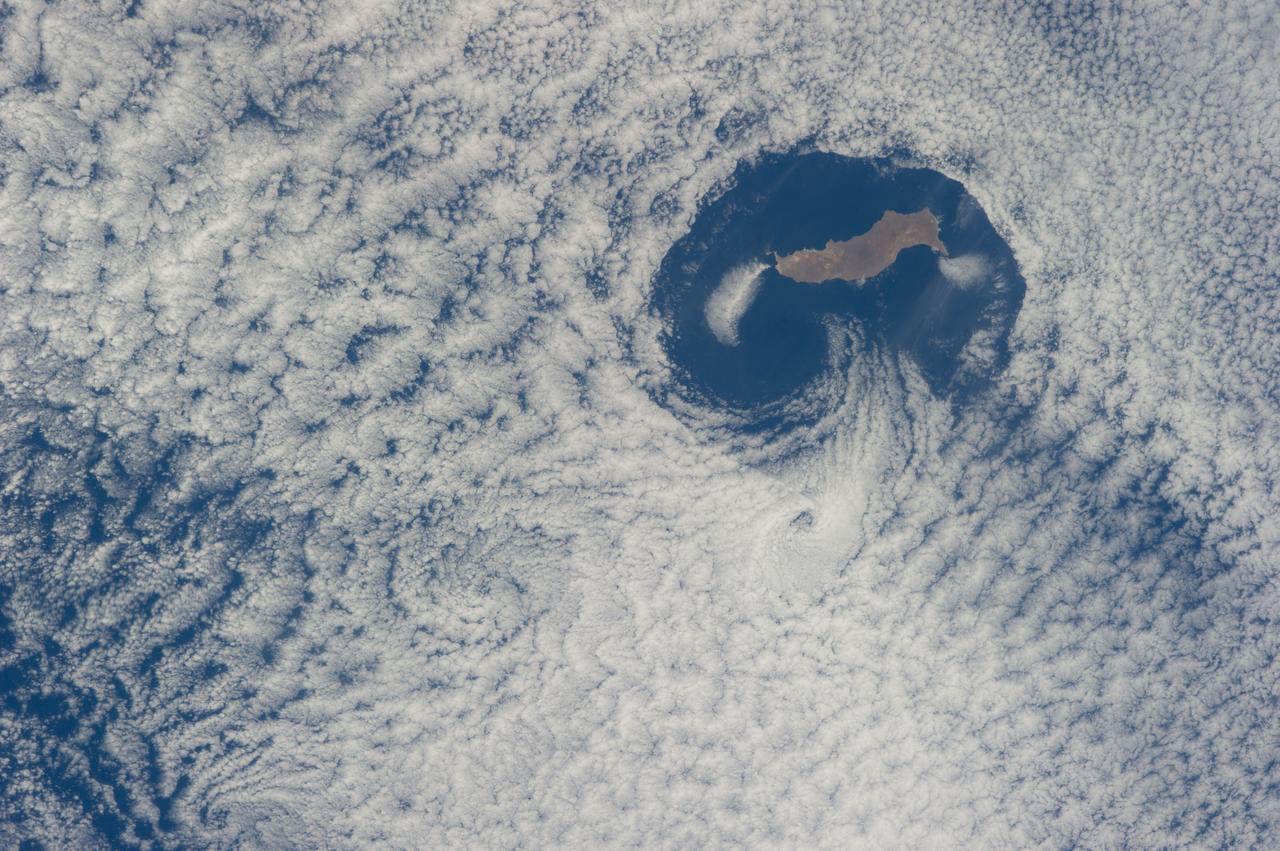
NASA image acquired August 14, 2010 at 14:55 UTC Cloud vortices off Madeira and Canary Islands Satellite: Aqua Credit: NASA/GSFC/Jeff Schmaltz/MODIS Land Rapid Response Team Click here to see more images from <b><a href="http://rapidfire.sci.gsfc.nasa.gov/gallery/?latest" rel="nofollow">MODIS</a></b> <b><a href="http://www.nasa.gov/centers/goddard/home/index.html" rel="nofollow">NASA Goddard Space Flight Center</a></b> is home to the nation's largest organization of combined scientists, engineers and technologists that build spacecraft, instruments and new technology to study the Earth, the sun, our solar system, and the universe. <b>Follow us on <a href="http://twitter.com/NASA_GoddardPix" rel="nofollow">Twitter</a></b> <b>Join us on <a href="http://www.facebook.com/pages/Greenbelt-MD/NASA-Goddard/395013845897?ref=tsd" rel="nofollow">Facebook</a><b></b></b>
A trio of large storms embraces in Saturn high north. The three prominent vortices seen here are each wide enough to span the distance from New York City to Denver, or from London to Moscow
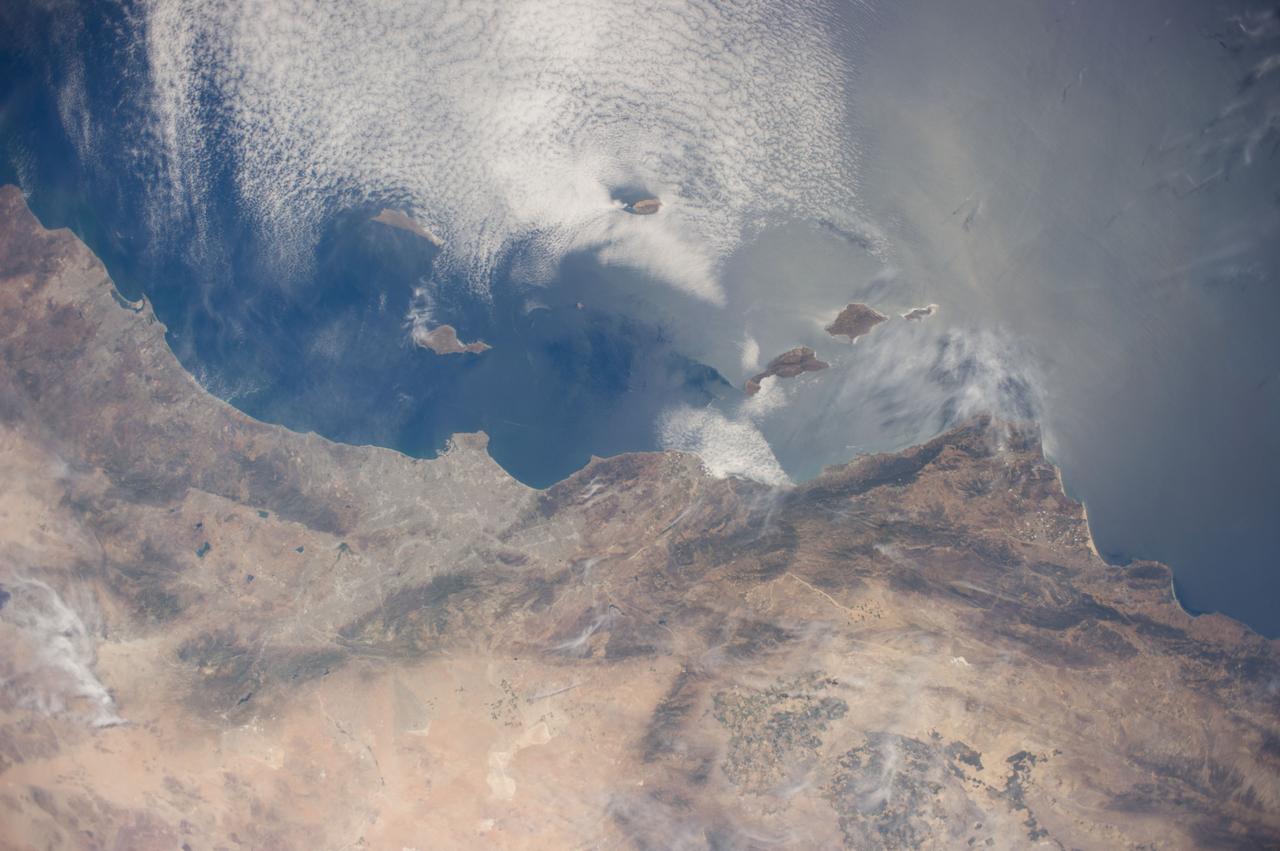
STS040-75-003 (5-14 June 1991) --- This image shows several of the Canary Islands, located in the North Atlantic Ocean just west of Africa. Low level stratus clouds often form here (and along the west coast of continents at these latitudes) are trapped in vertical movement due to an overlying atmospheric temperature inversion. The islands are generating disturbances in the low-level wind flow which is generally from the north-northeast or from top to bottom in the image. These disturbances travel downstream from the islands and manifest themselves as cloud swirls which are called von Karman vortices. The northern extent of a large dust storm moving off the coast of Africa is apparent at the lower right of the image. The dust, extended across the Atlantic Ocean as far west as the Dominican Republic later in the mission.
In this series of images from NASA Cassini spacecraft, a dark, rectangular hot spot interacts with a line of vortices that approaches from on the upper-right side. The interaction distorts the shape of the hot spot, leaving it diminished.
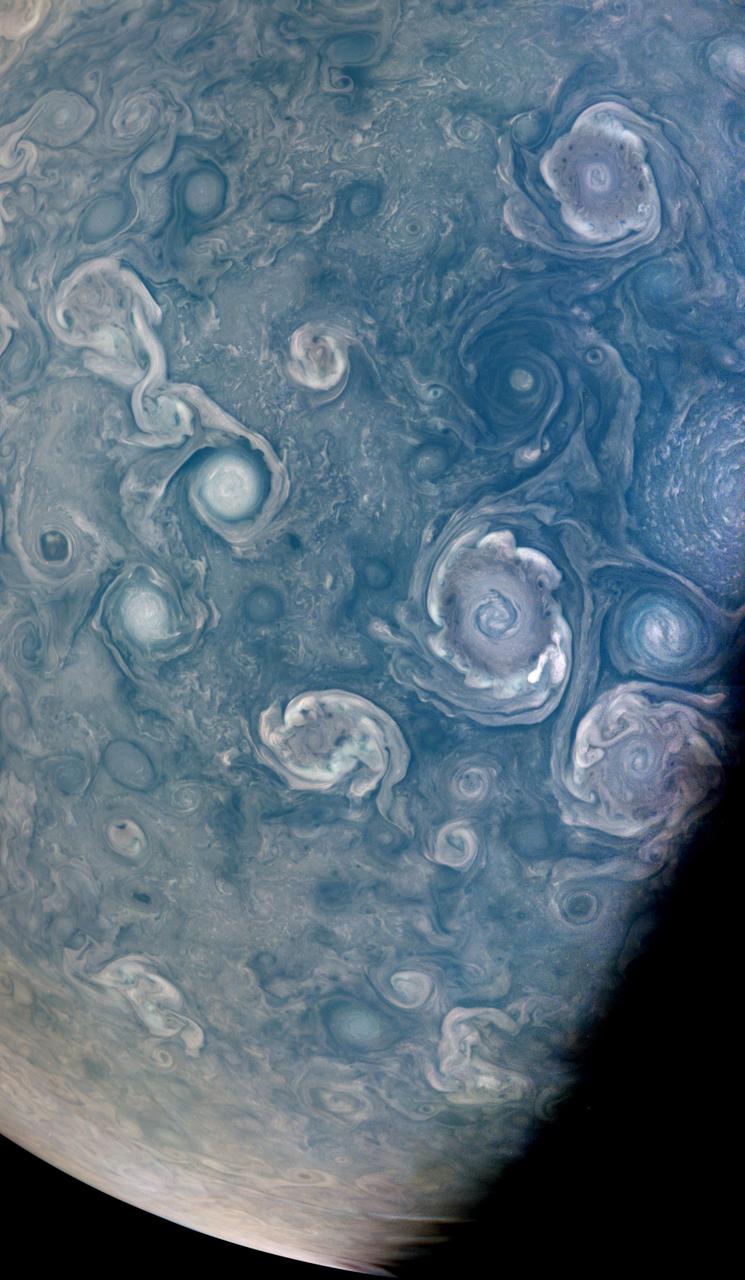
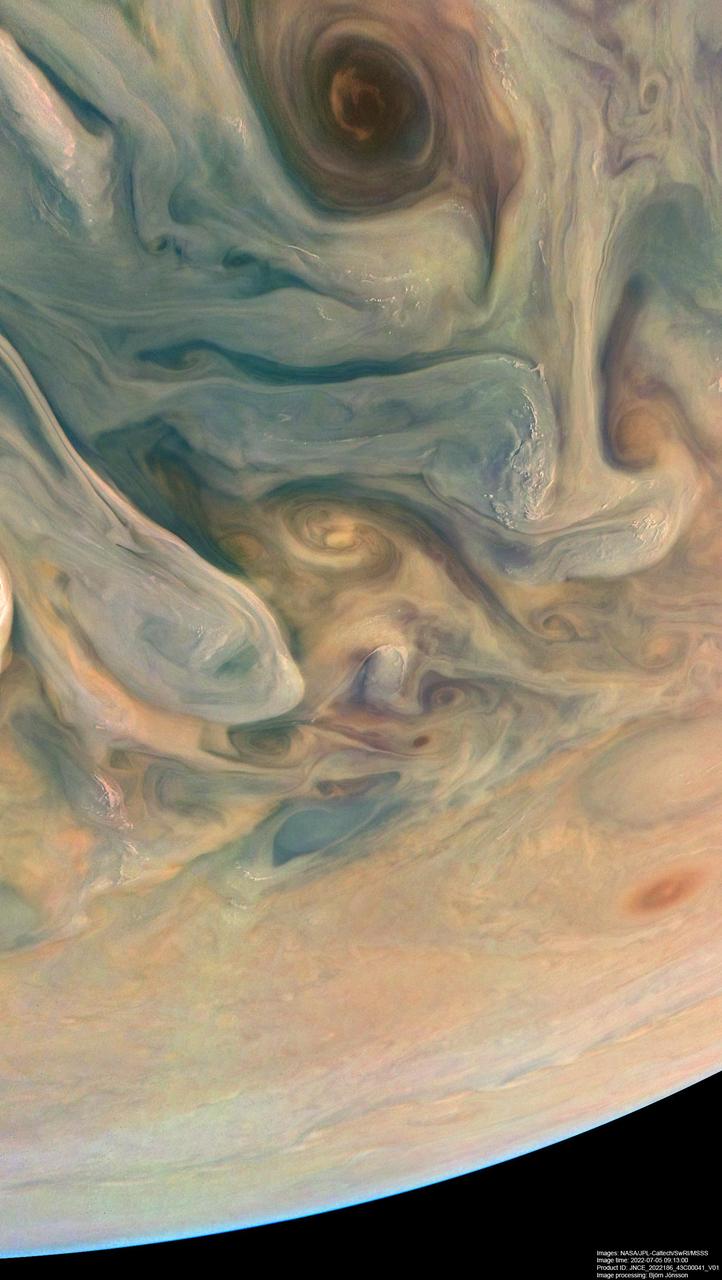
As NASA's Juno mission completed its 43rd close flyby of Jupiter on July 5, 2022, its JunoCam instrument captured this striking view of vortices – hurricane-like spiral wind patterns – near the planet's north pole. These powerful storms can be over 30 miles (50 kilometers) in height and hundreds of miles across. Figuring out how they form is key to understanding Jupiter's atmosphere, as well as the fluid dynamics and cloud chemistry that create the planet's other atmospheric features. Scientists are particularly interested in the vortices' varying shapes, sizes, and colors. For example, cyclones, which spin counter-clockwise in the northern hemisphere and clockwise in the southern, and anti-cyclones, which rotate clockwise in the northern hemisphere and counter-clockwise in the southern hemisphere, exhibit very different colors and shapes. A NASA citizen science project, Jovian Vortex Hunter, seeks help from volunteer members of the public to spot and help categorize vortices and other atmospheric phenomena visible in JunoCam photos of Jupiter. This process does not require specialized training or software, and can be done by anyone, anywhere, with a cellphone or laptop. As of July 2022, 2,404 volunteers had made 376,725 classifications using the Jovian Vortex Hunter project web site at https://www.zooniverse.org/projects/ramanakumars/jovian-vortex-hunter. Another citizen scientist, Brian Swift, created this enhanced color and contrast view of vortices using raw JunoCam image data. At the time the raw image was taken, the Juno spacecraft was about 15,600 miles (25,100 kilometers) above Jupiter's cloud tops, at a latitude of about 84 degrees. https://photojournal.jpl.nasa.gov/catalog/PIA25017
Streamers, swirls and vortices roll across the dynamic face of Saturn
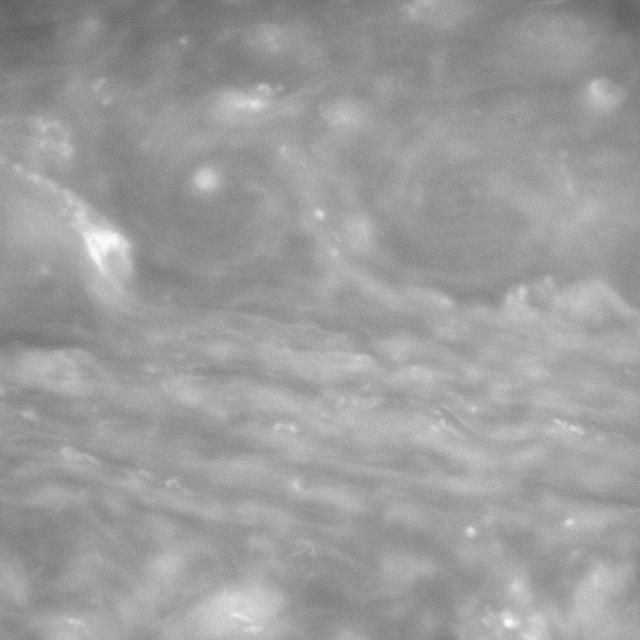
Three large and impressive vortices, including two that appear to be interacting, are captured here as they swirl through Saturn active southern latitudes
As the air blows over the tops of the mountain peaks, seen here in the clear region, the direction of the air flow is disturbed. These disturbances in the flow pattern are generally small circular eddies with one circulating in a clockwise direction and the next in the reverse direction. The wind here has caused the shallow cloud cover to change accordingly. These eddies are commonly called von Karmen Vortices.
Stable, south flowing air over the western Pacific Ocean (26.0N, 131.0E) is disturbed by islands south of Korea, resulting in sinuous clouds known as von Karman vortices. The smoke plume from Japan's Mount Unzen Volcano on Kyushu, is visible just west of the large cloud mass and extending southward. A very large, purple tinged dust pall, originating in Mongolia, can be seen on the Earth's Limb, covering eastern China and extending into the East China Sea.
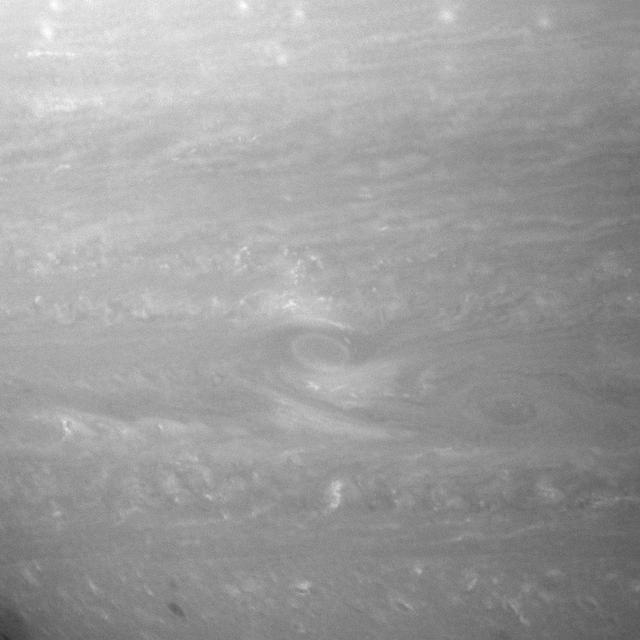
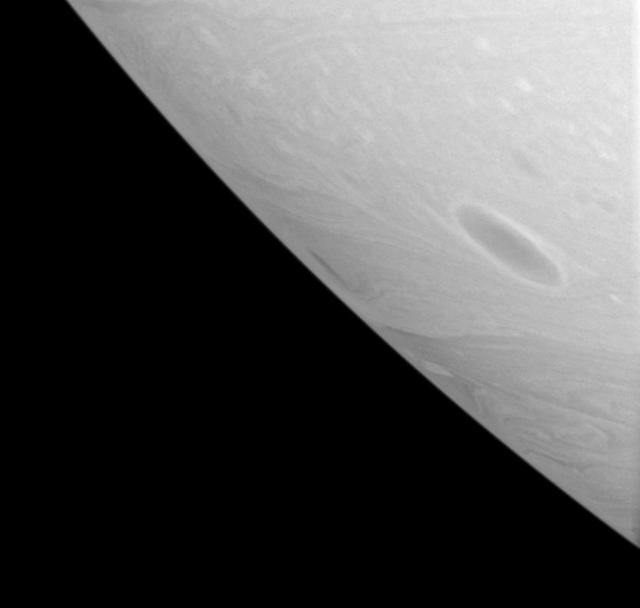
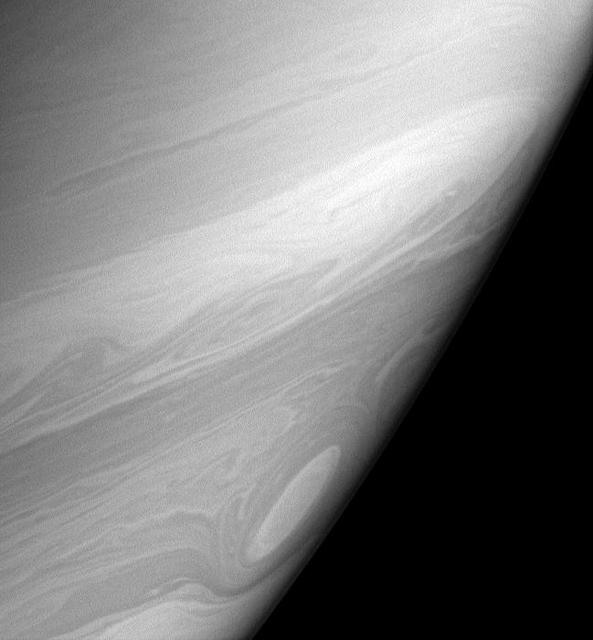
Two bright vortices roll across the cloud-lined face of Saturn, where winds howl at high speeds never experienced on Earth
STS100-710-182 (19 April-1 May 2001) --- Easily recognizable in this STS-100 70mm frame are phenomena known as the von Karman vortices, which were forming in the stratocumulus field downwind from the volcanic island of Rishiri-to in the northern Sea of Japan off the northwest coast of Hokkaido, Japan. According to NASA scientists studying the STS-100 photo collection, these features form when a stable atmosphere with low clouds flows past a relatively small obstacle with a height greater than the depth of the cloud layer. Because the atmosphere is stable, a series of eddies form in the moving cloud field.
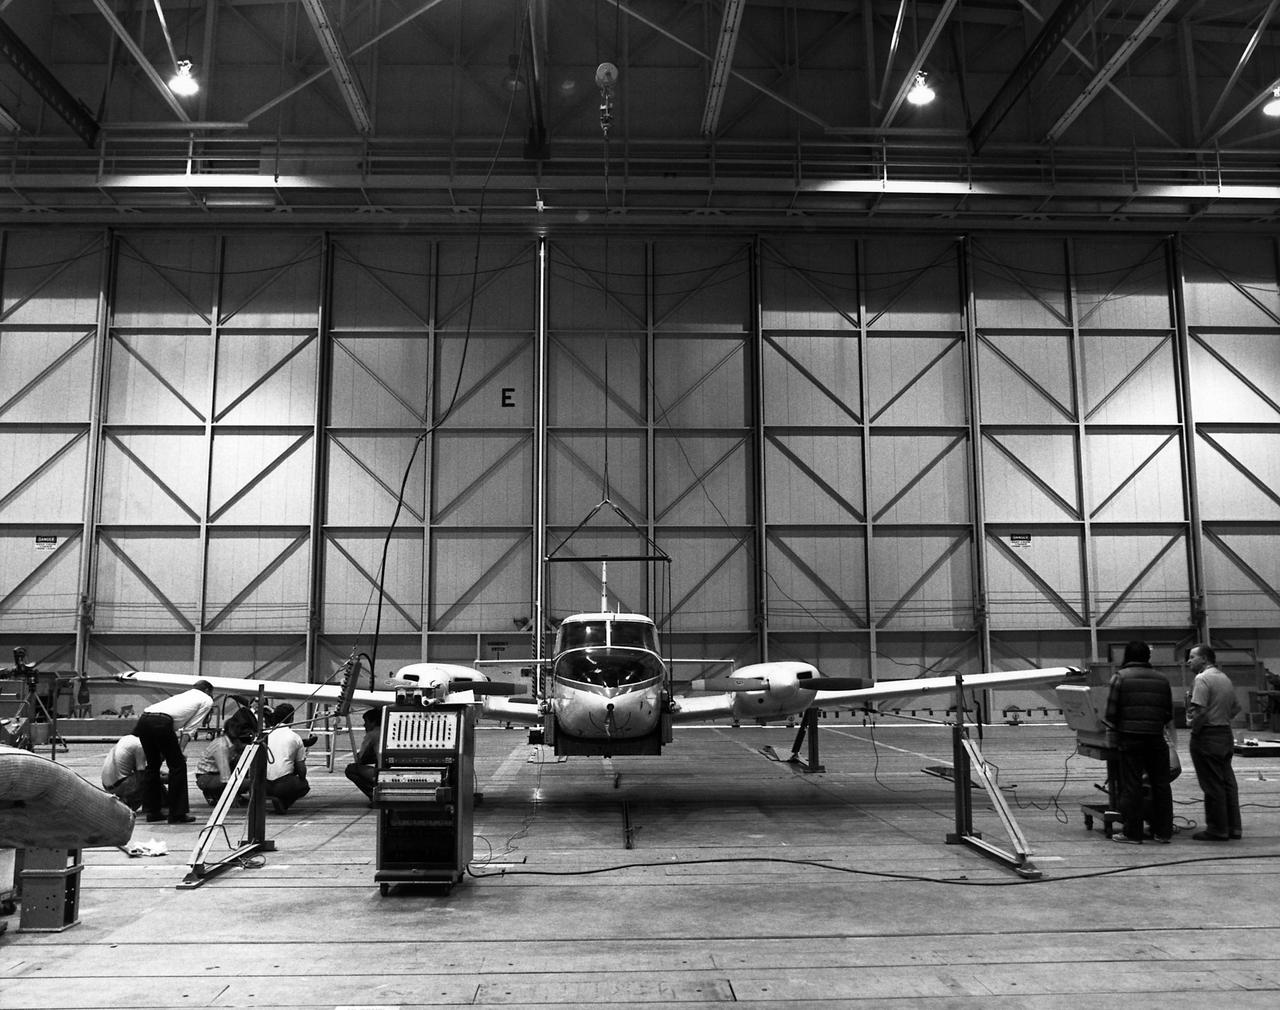
Technicians check instrumentation and systems on NASA 808, a PA-30 aircraft, prior to a research flight. The aircraft was used as the testbed in development of control systems for remotely piloted vehicles that were "flown" from the ground. The concept led to highly successful programs such as the HiMAT and the subscale F-15 remotely piloted vehicles. Over the years, NASA 808 has also been used for spin and stall research related to general aviation aircraft and also research to alleviate wake vortices behind large jetliners. This 1980 photograph taken inside a hangar shows technicians measuring moment of inertia.
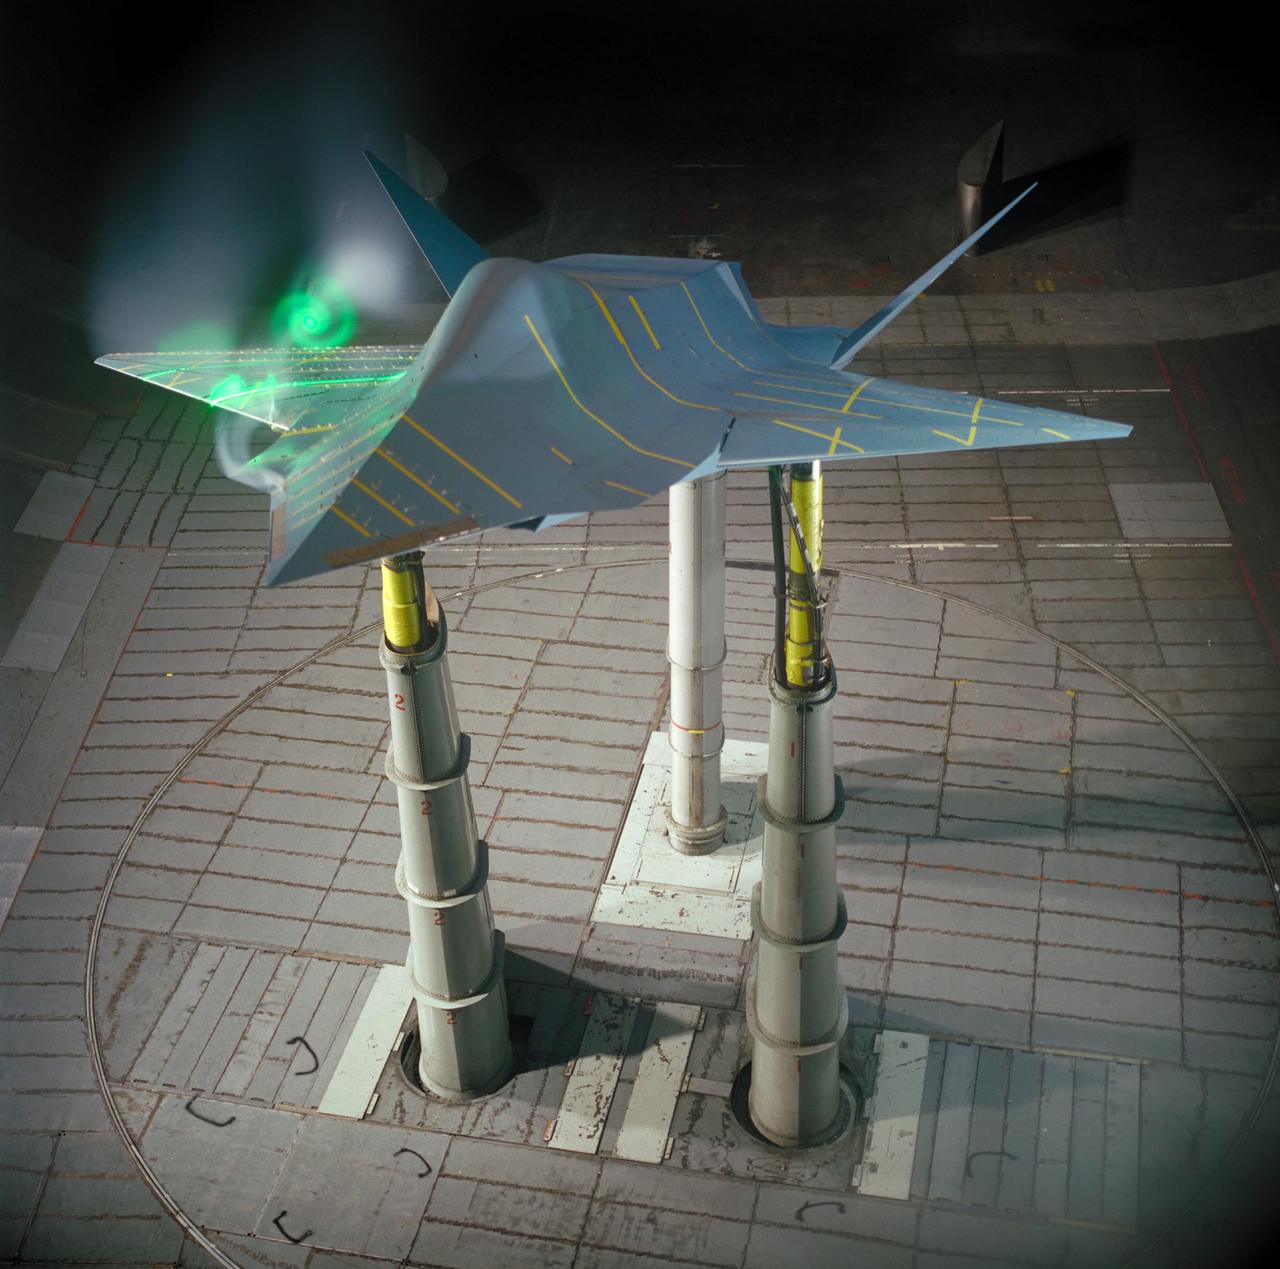
55% SHARC (Subsonic High Alpha Research Concept) Model test-597 in 40x80 ft. w.t. during laser sheet phase of testing with vortices forming
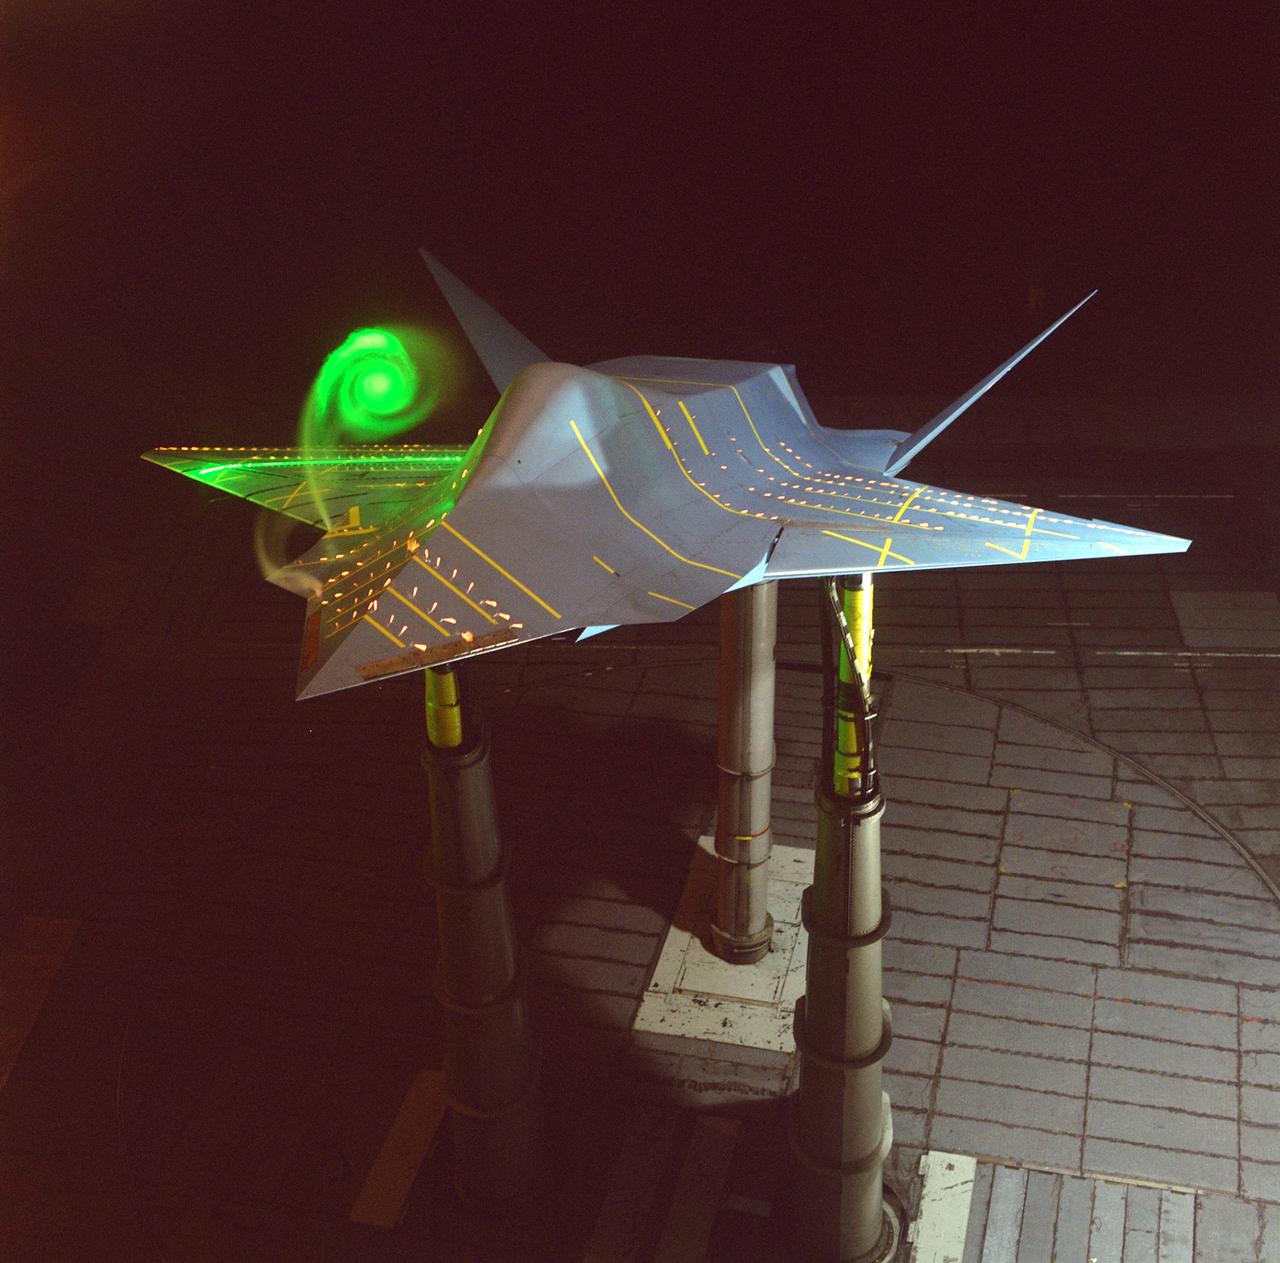
55% SHARC (Subsonic High Alpha Research Concept) Model test-597 in 40x80 ft. w.t. during laser sheet phase of testing with vortices forming
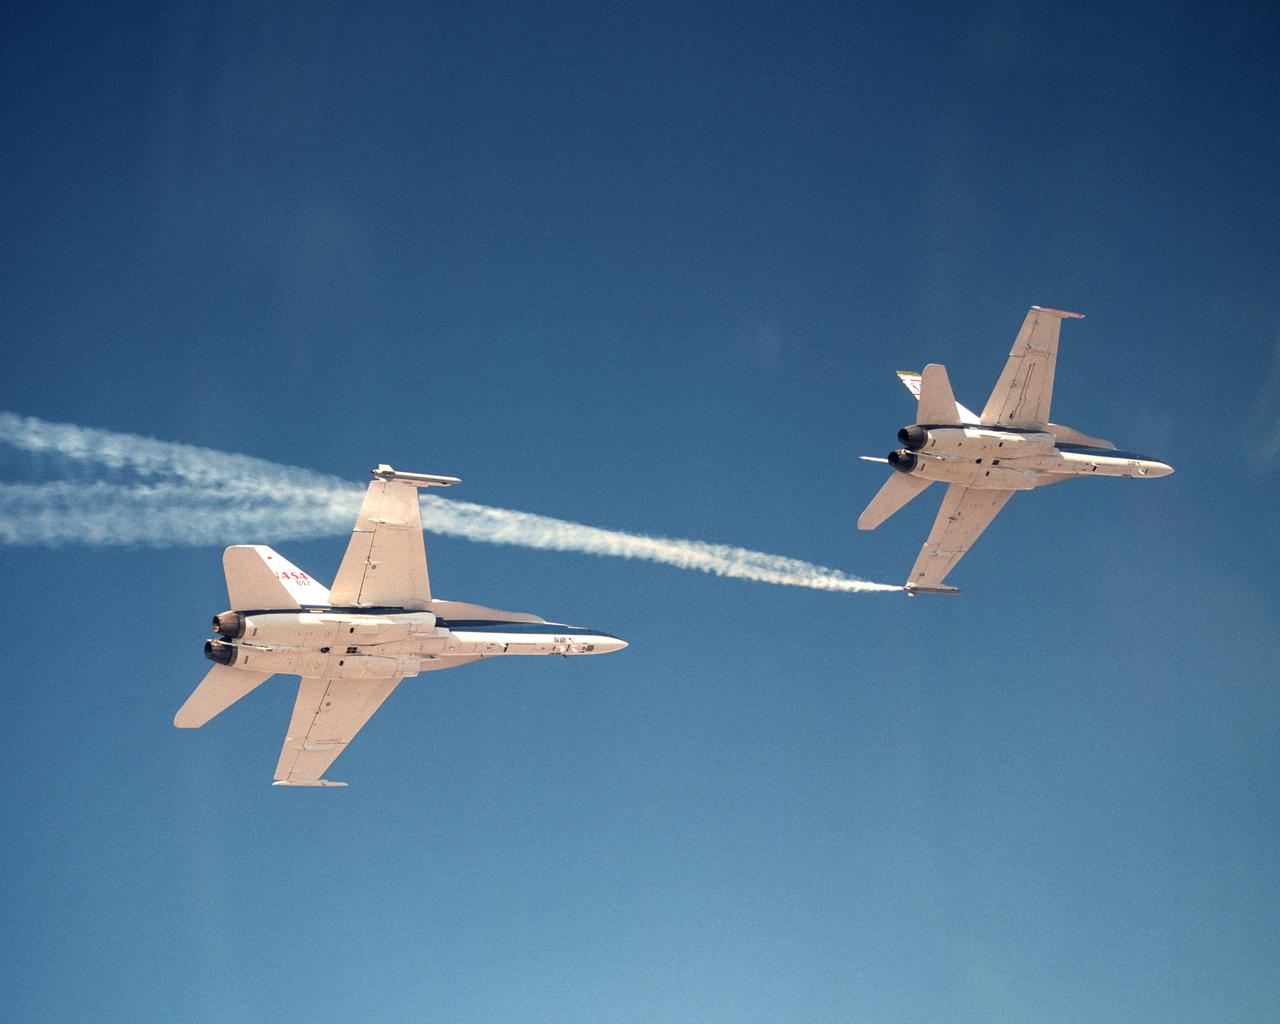
Smoke generators show the twisting paths of wingtip vortices behind two NASA Dryden F/A-18 jets used in the Autonomous Formation Flight (AFF) program
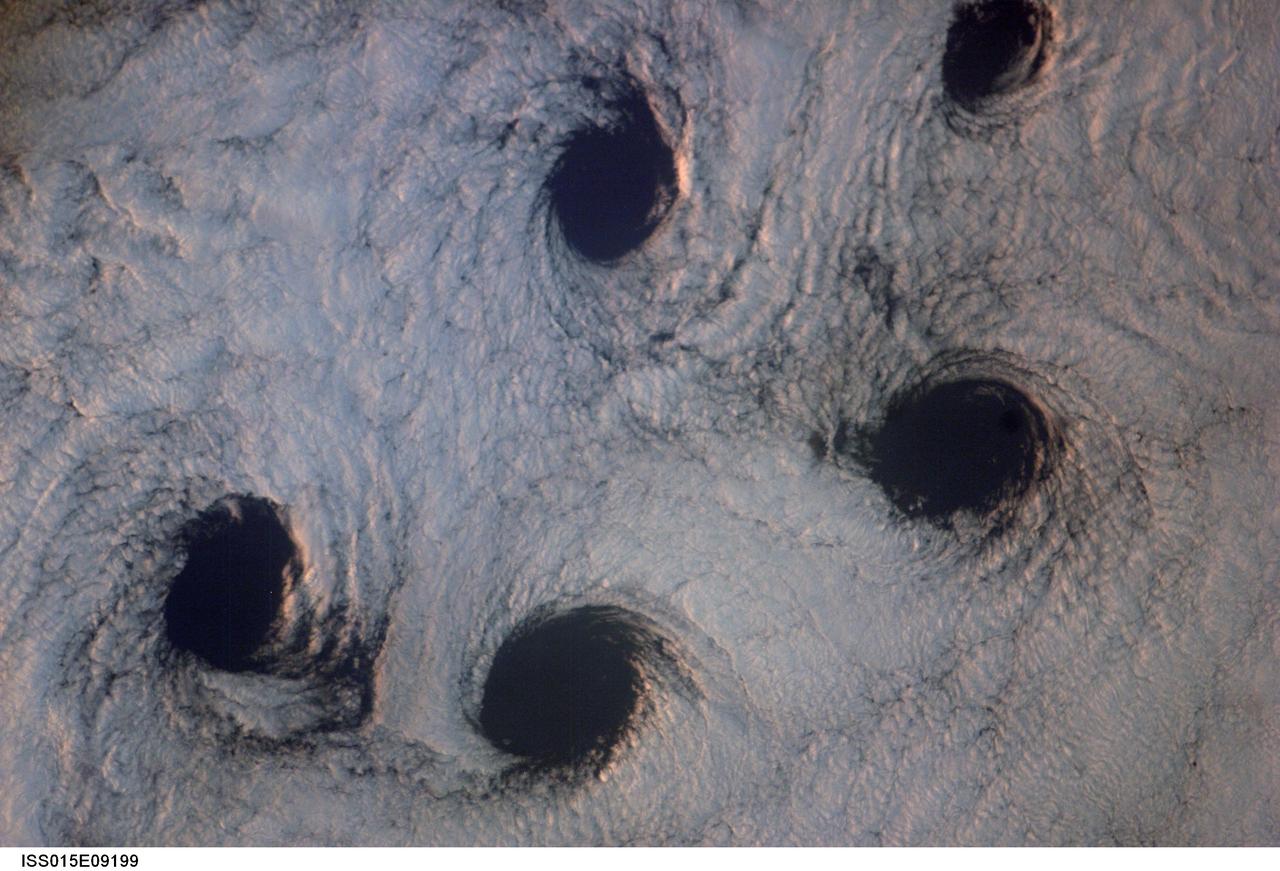
ISS015-E-09199 (23 May 2007) --- Von Karman cloud vortices near the Aleutian Islands are featured in this image photographed by an Expedition 15 crewmember on the International Space Station. The vortices are created by the wind encountering a barrier such as an island, changing direction and velocity and forming eddies in the wind and cloud pattern on the lee side of the island. The nadir point of the space station when the image was taken was 51.1 degrees north latitude and 178.8 degrees west longitude.
Bright, high altitude clouds, like those imaged here, often appear more filamentary or streak-like than clouds imaged at slightly deeper levels in Saturn atmosphere. This view also shows one of the many cat eye vortices.
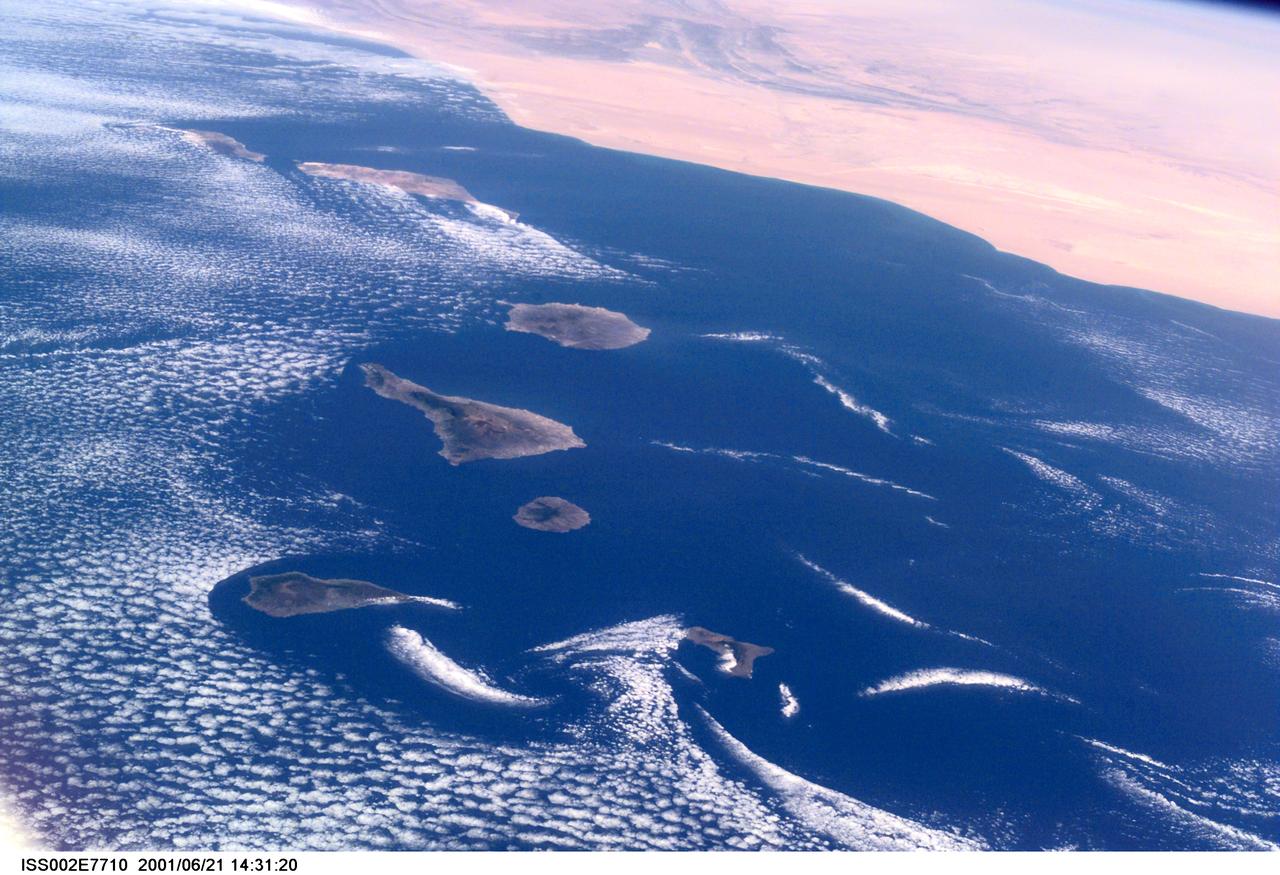
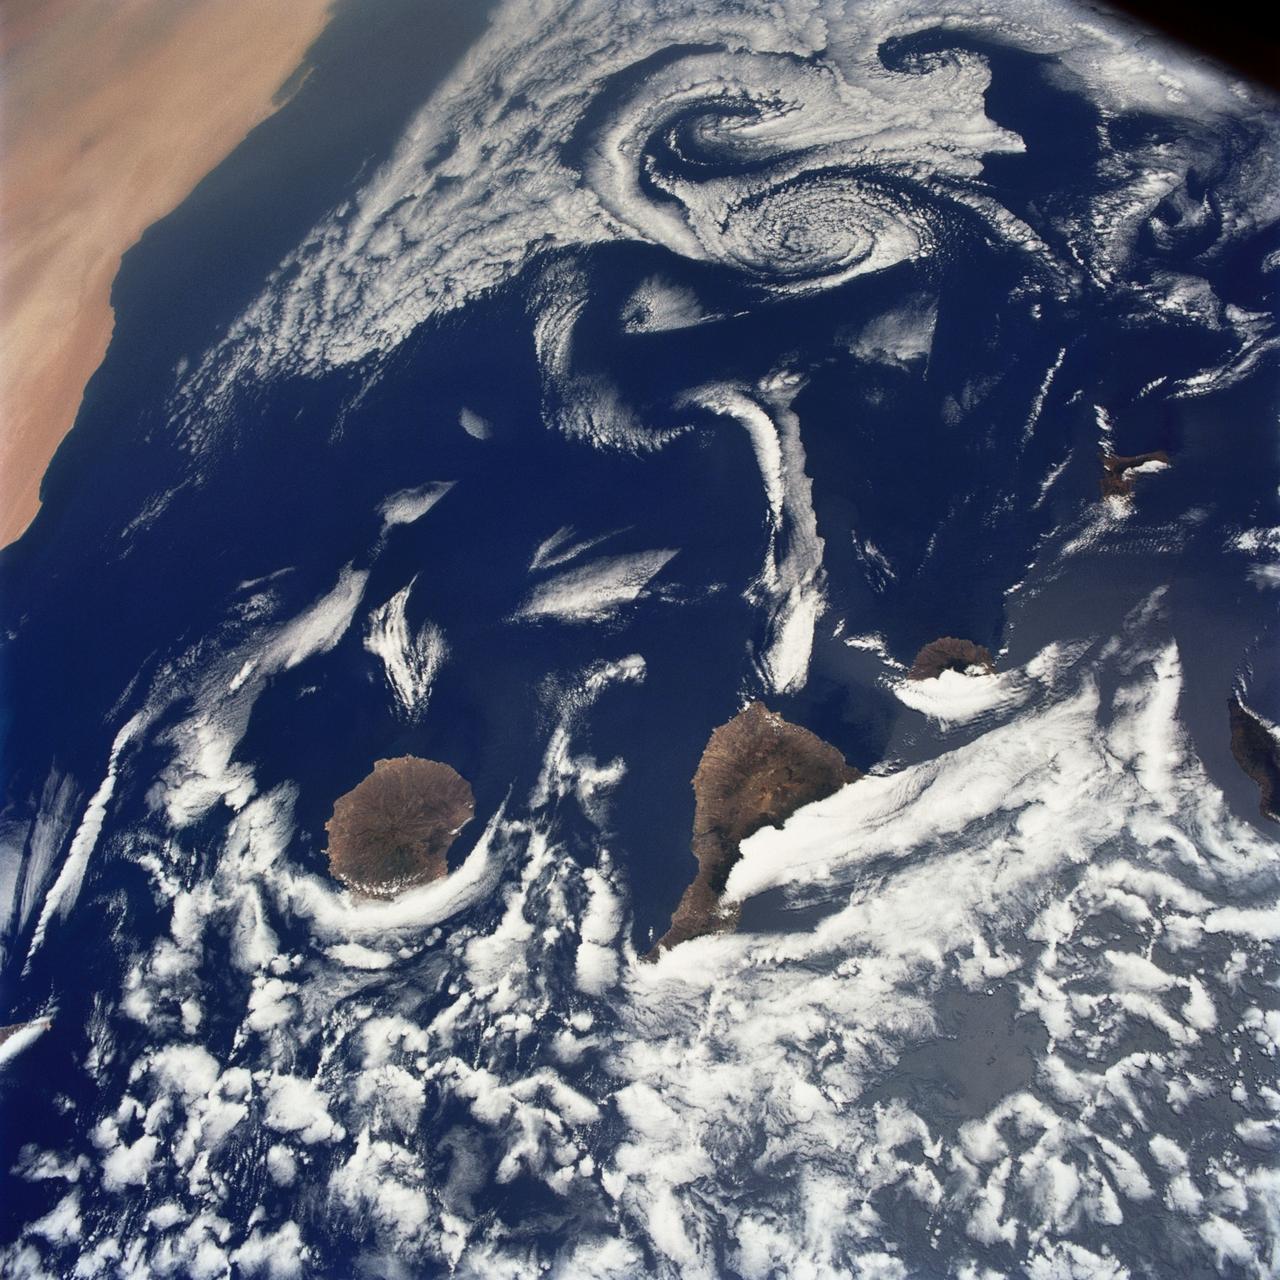
ISS002-E-7710 (21 June 2001) --- Commonly visible cloud vortices hover in the area of the Canary Islands off the coast of Morocco in this Expedition Two digital still camera's view from the International Space Station (ISS).
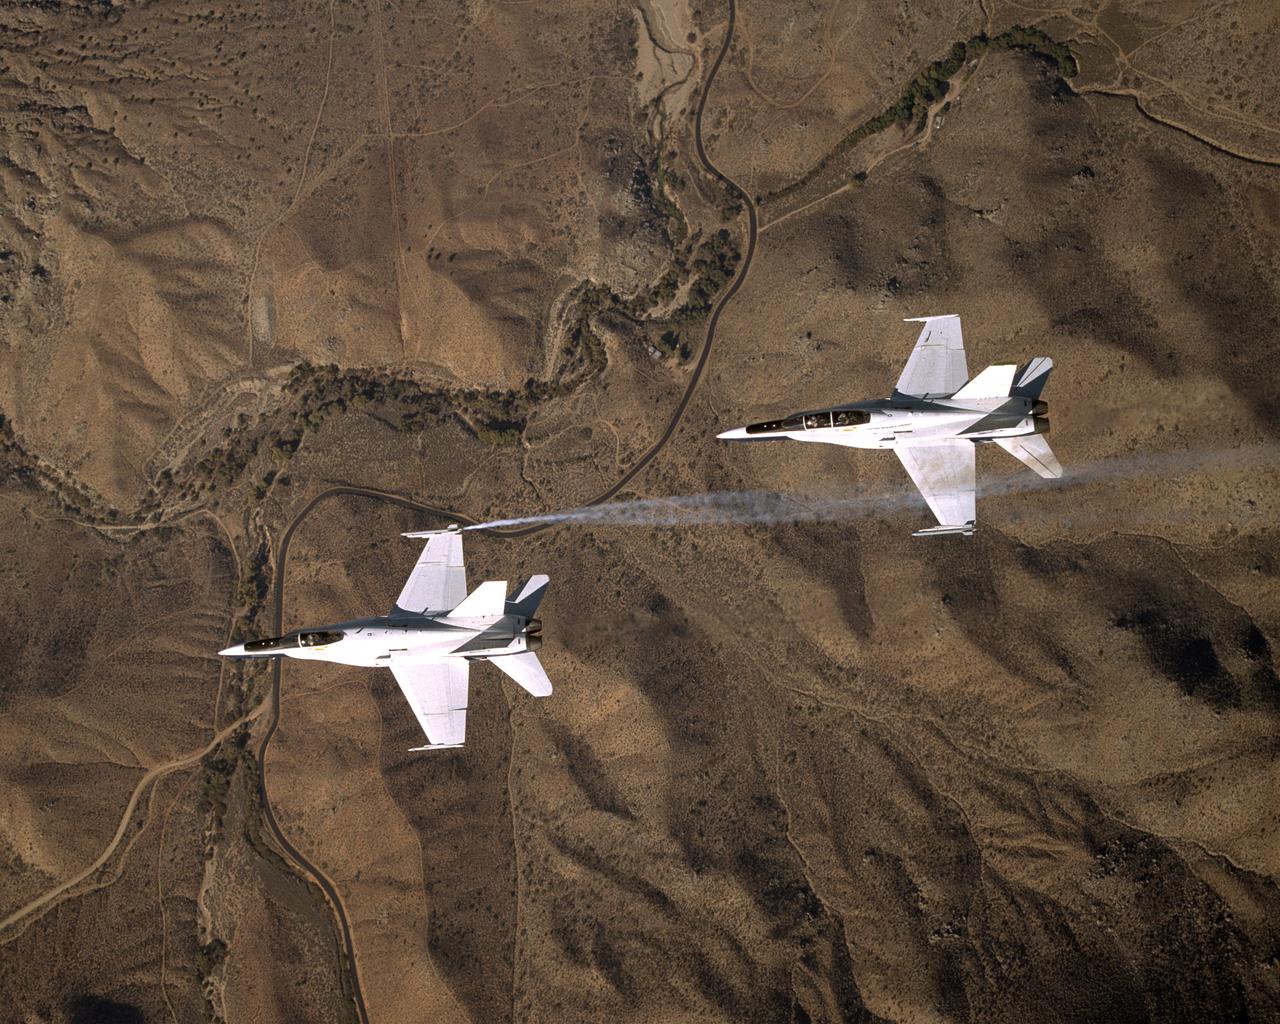
Smoke generators show the twisting paths of wingtip vortices behind two NASA Dryden F/A-18's used in the Autonomous Formation Flight (AFF) program during flight #743.
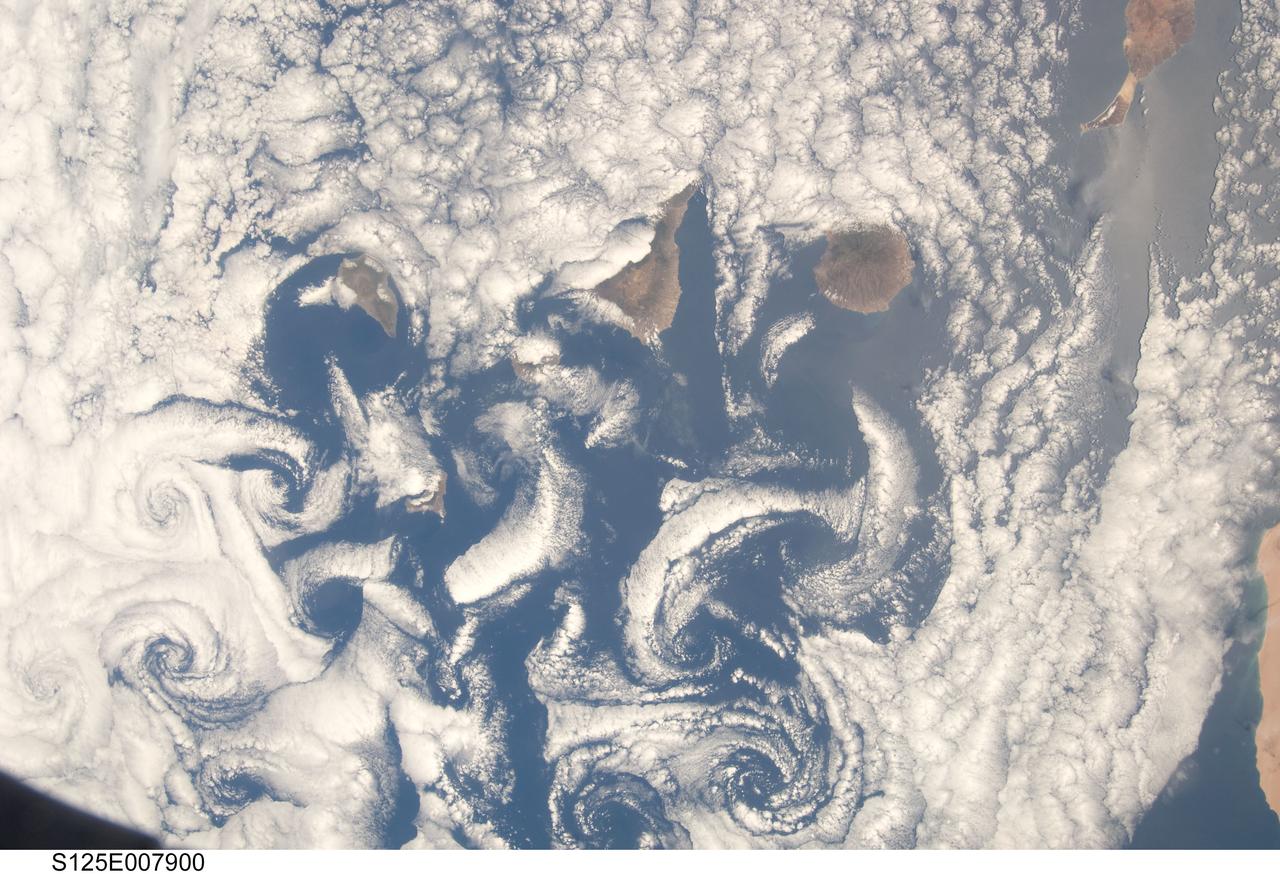
S125-E-007900 (16 May 2009) --- A nadir view of cloud vortices in the area of the Canary Islands in the North Atlantic Ocean was recorded by one of the STS-125 crewmembers on a busy flight day six.
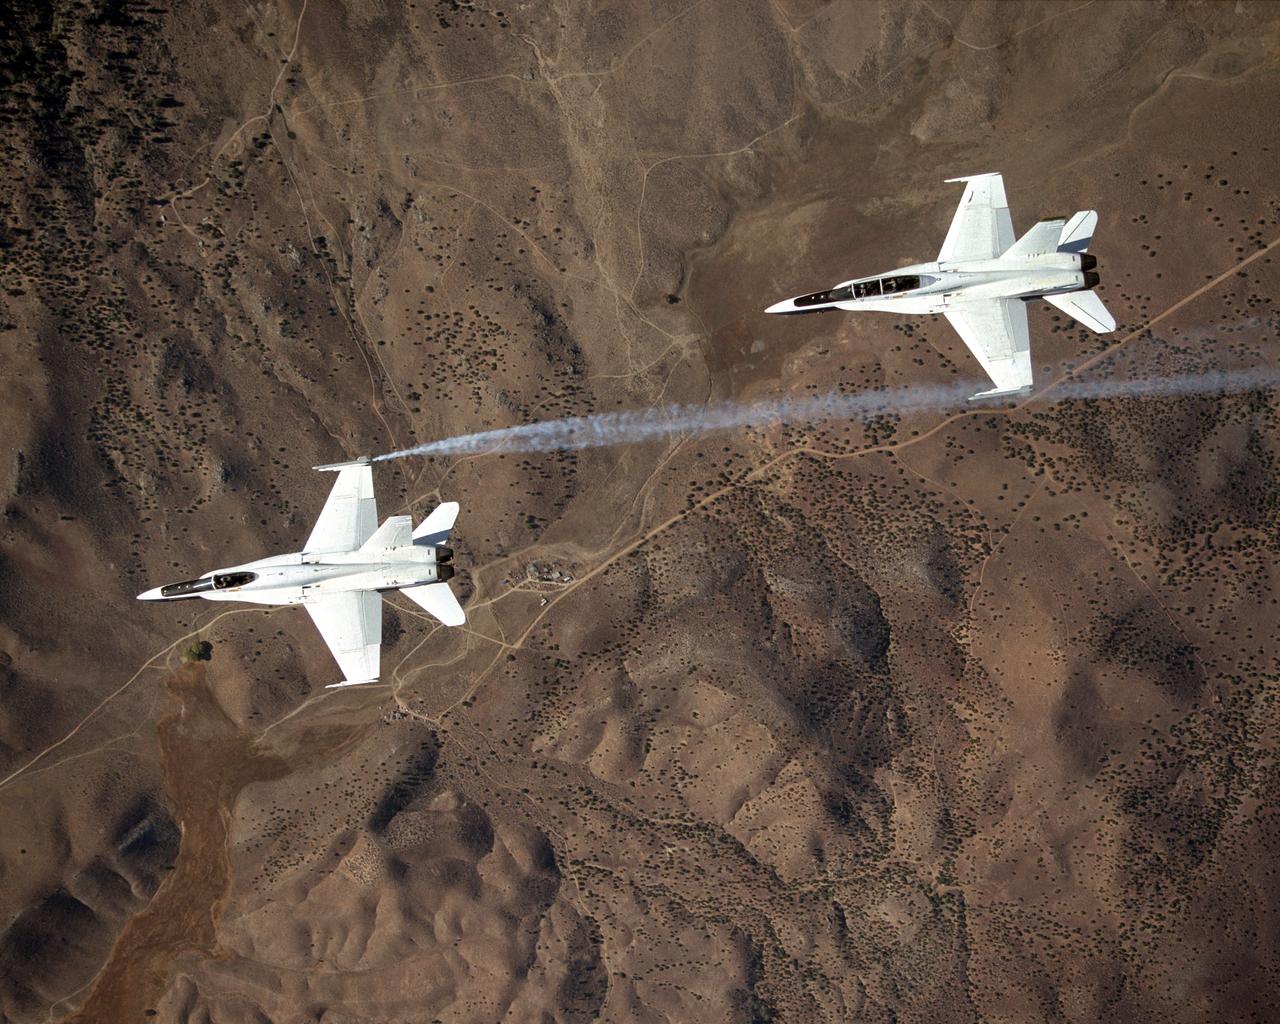
Smoke generators show the twisting paths of wingtip vortices behind two NASA Dryden F/A-18's used in the Autonomous Formation Flight (AFF) program during flight #743.
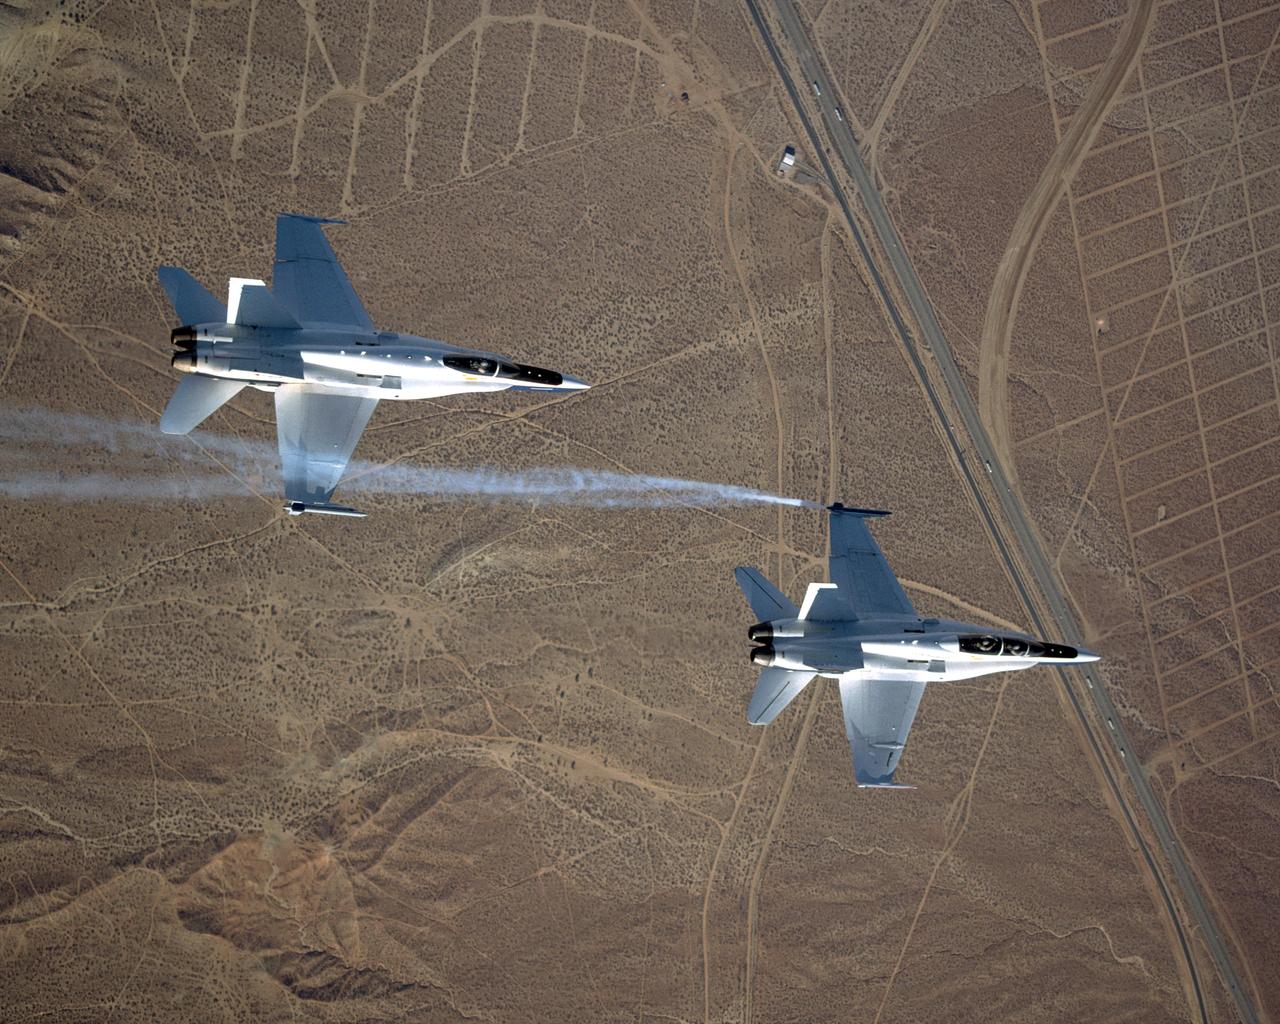
Smoke generators show the twisting paths of wingtip vortices behind two NASA Dryden F/A-18's used in the Autonomous Formation Flight (AFF) program during flight #743.
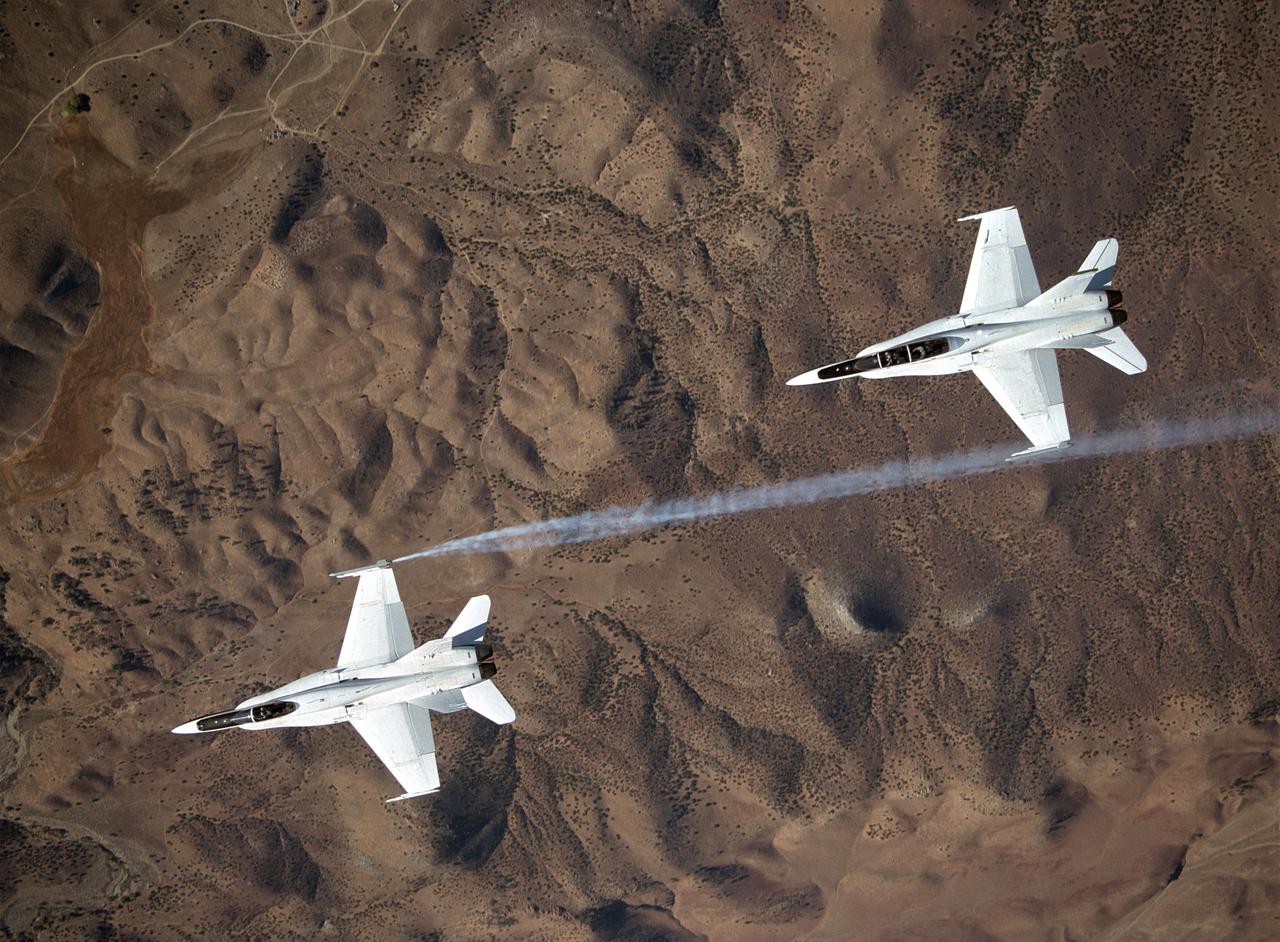
Smoke generators show the twisting paths of wingtip vortices behind two NASA Dryden F/A-18's used in the Autonomous Formation Flight (AFF) program during flight #743.
S66-63494 (13 Nov. 1966) --- Guadalupe Island, unique vortices off Baja California, Mexico, as seen from the Gemini-12 spacecraft during its 29th revolution of Earth. Photo credit: NASA
S65-63150 (16 Dec. 1965) --- Eddies in stratocumulus clouds over the Canary Islands as seen from the Gemini-6 spacecraft during its 14th revolution of Earth. Photo credit: NASA or National Aeronautics and Space Administration

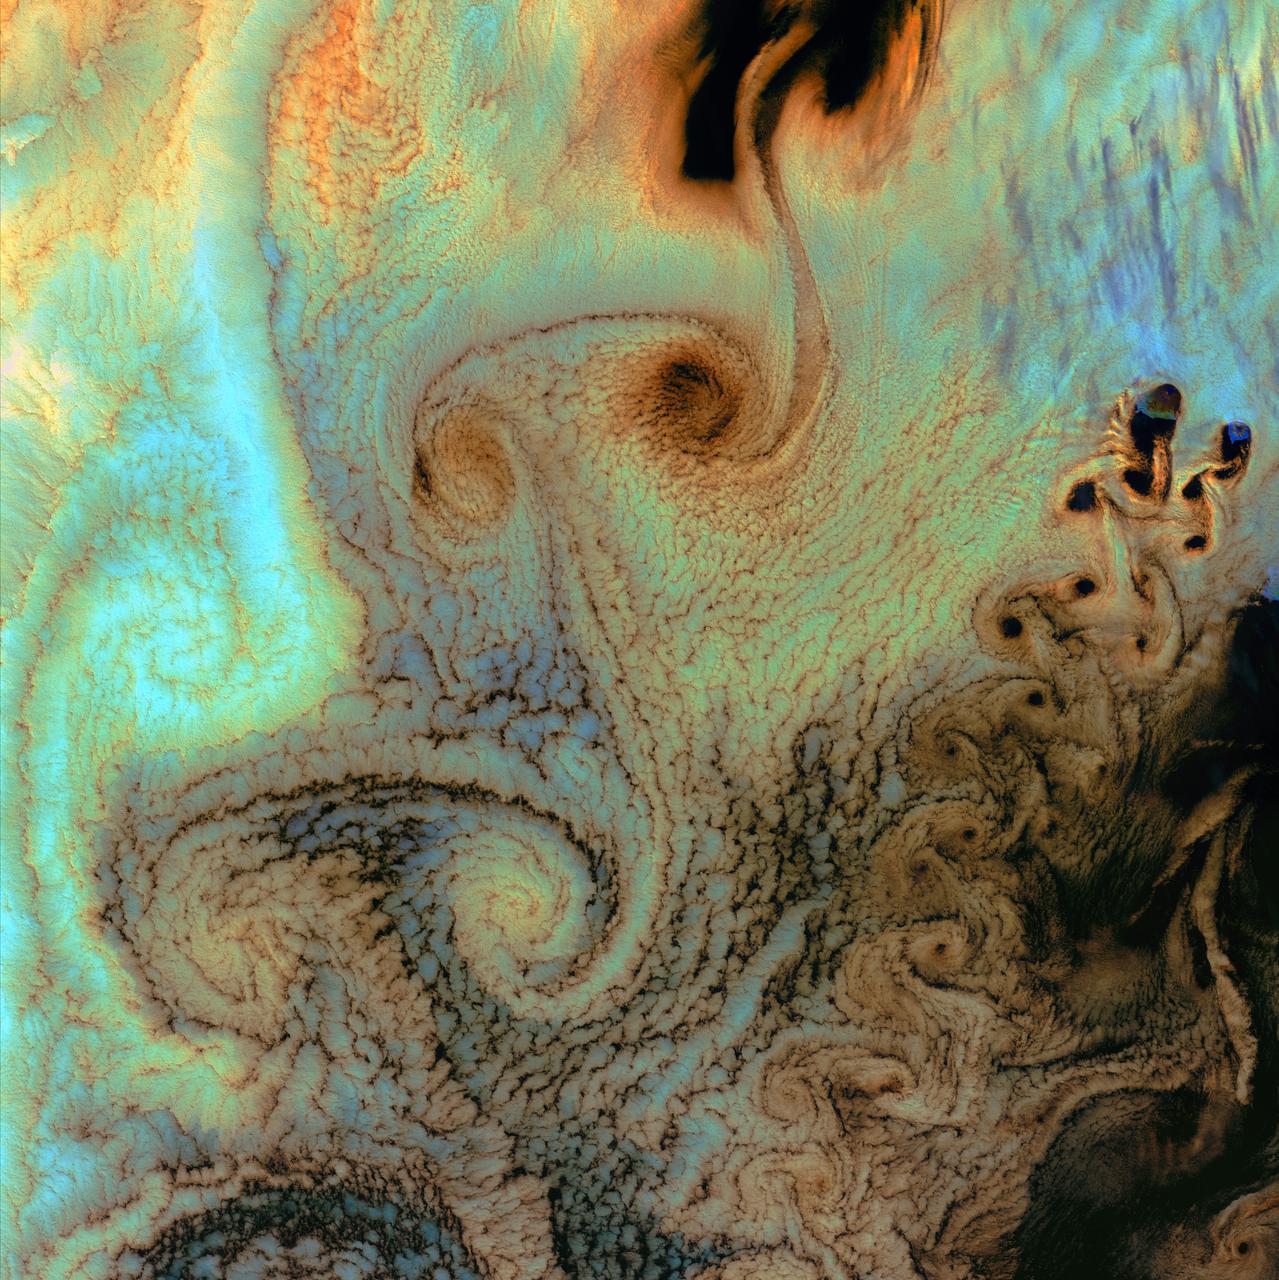
The left image shows a phytoplankton bloom in the Norwegian Sea. The right image shows turbulent clouds in Jupiter's atmosphere. Jupiter's atmosphere is one of the most turbulent places in the solar system. Orbiting Jupiter and its 79 moons is NASA's Juno spacecraft, which sends images from the largest planet in our solar system back to researchers on Earth. These images from Juno have given oceanographers the raw materials to study the rich turbulence at Jupiter's poles and the physical forces that drive large cyclones on Jupiter. Lia Siegelman, a physical oceanographer and postdoctoral scholar at Scripps Institution of Oceanography at the University of California, San Diego, observed similarities between the richness of turbulence around Jovian cyclones and the filaments around smaller eddies with turbulence seen in Earth's oceans. https://photojournal.jpl.nasa.gov/catalog/PIA25037

SL4-140-4111 (14 Jan. 1974) --- The Aleutian Islands area of Alaska, as photographed from the Skylab space station in Earth orbit by one of the Skylab 4 crewmen. The camera used was a hand-held Hasselblad, with SO-368 medium-speed Ektachrome. Here is another macro scale phenomenon which is difficult to observe except from a space platform. The Aleutian Islands and clouds with very elaborate van Karman vortices was photographed on Jan. 14, 1974. In addition to the vortices the waves in the clouds due to the mountains on the islands are very evident. In fact, the easiest way to find the mountains is to start with their atmospheric disturbance and work back to the mountain. Photo credit: NASA
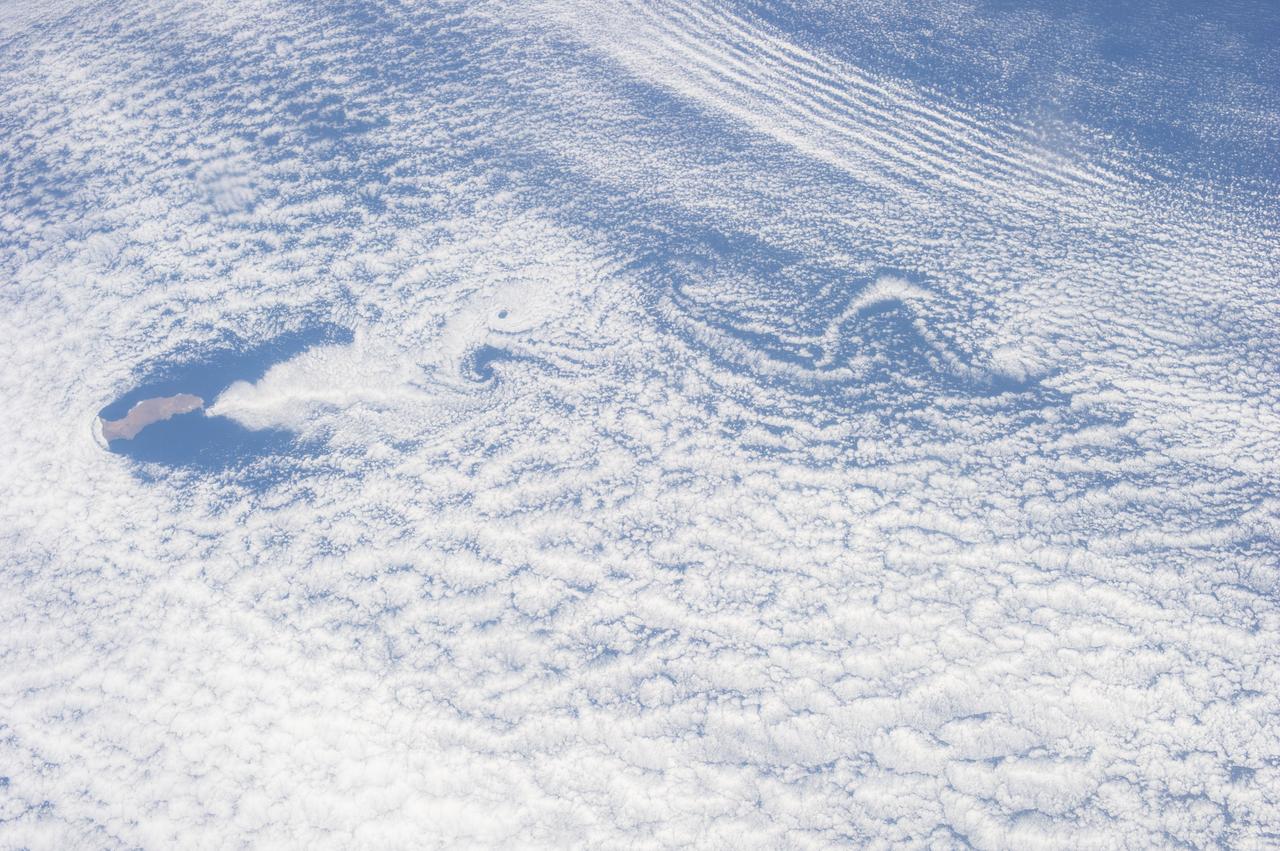
ISS036-E-035663 (24 Aug. 2013) --- One of the Expedition 36 crew members aboard the International Space Station recorded this still image of unusual cloud patterns surrounding Guadalupe Island in the Pacific Ocean (left center). These are the result of a ubiquitous occurrence in the motion of fluids—a vortex street, which is a linear chain of spiral eddies called von Karman vortices. Von Karman vortices are named after Theodore von Karman, a co-founder of NASA's Jet Propulsion Laboratory. who first described the phenomenon in the atmosphere. Guadalupe Island or Isla Guadalupe is a volcanic island located 241 kilometers (150 statute miles) off the west coast of Mexico's Baja California peninsula.
STS083-749-079 (4-8 April 1997) --- Cloud wake covers the Leeward Islands. Like a ship making a wake in the water, Guadeloupe Island is making a wake in the clouds. Seeing certain weather features tells us information as to what the conditions were at the time the photo was taken. For instance, a solid cloud area is formed behind the island in this photo so the winds are under or at 5 meters per second (mps). If the winds were greater Von Karman Vortices would develop. Formation of Von Karman Vortices requires wind speeds of 5 and 13 mps and a strong low level temperature inversion below the highest peak of the island.
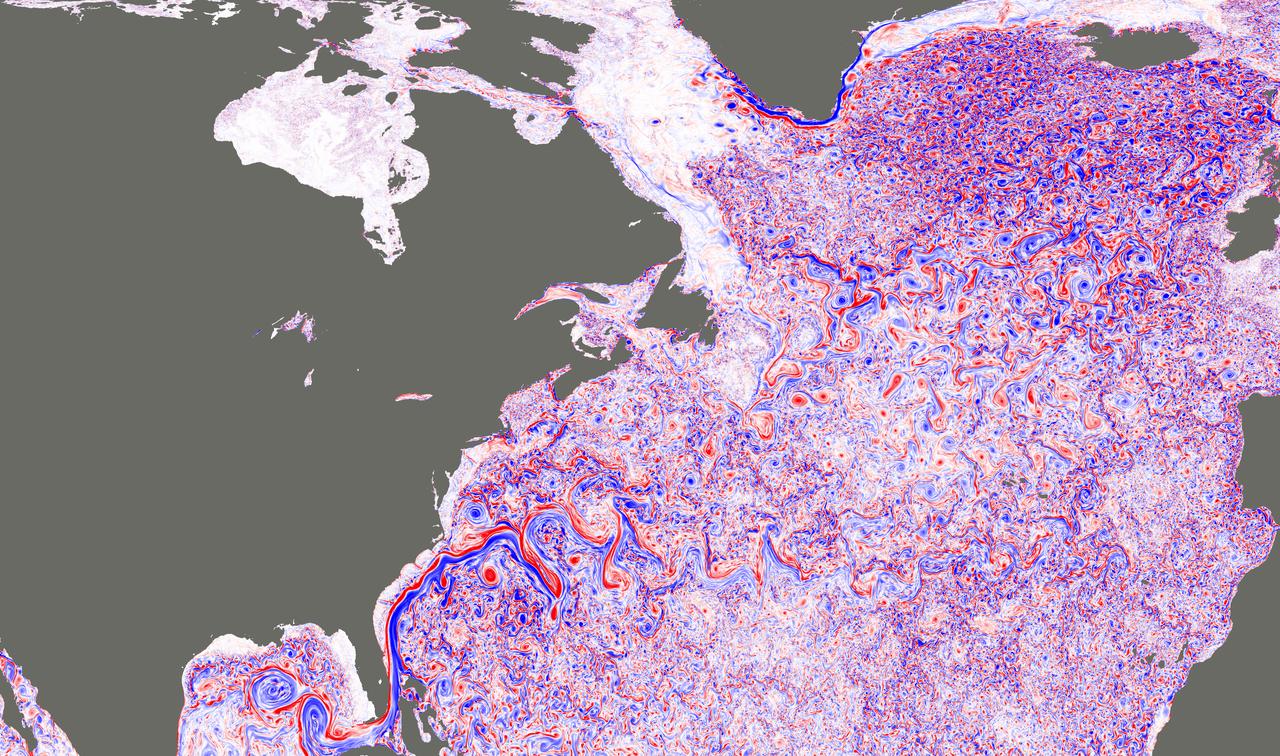
This image shows a simulated snapshot of ocean turbulence in the North Atlantic Ocean in March 2012, from a groundbreaking super-high-resolution global ocean simulation (approximately 1.2 miles, or 2 kilometers, horizontal resolution) developed at JPL (http://wwwcvs.mitgcm.org/viewvc/MITgcm/MITgcm_contrib/llc_hires/llc_4320/). The colors represent the magnitude of surface relative vorticity, a measure of the spin of fluid parcels. The image emphasizes fast-rotating, small-scale (defined here as 6.2 to 31-mile, or 10 to 50 kilometer, range) turbulence, especially during the winter. High levels of relative vorticity caused by small-scale turbulence are believed to strongly transport heat and carbon vertically in the ocean. The image appears in a study (Su et al. 2018), entitled "Ocean submesoscales as a key component of the global heat budget," published recently in Nature Communications. The study suggests that upper-ocean small-scale turbulence transports heat upward in the ocean at a level five times larger than larger-scale heat transport by ocean eddies, significantly affecting the exchange of heat between the ocean interior and atmosphere. Such interactions have a crucial impact on the Earth's climate. A movie is available at https://photojournal.jpl.nasa.gov/catalog/PIA22256
NASA image acquired September 15, 1999 This Landsat 7 image of clouds off the Chilean coast near the Juan Fernandez Islands (also known as the Robinson Crusoe Islands) on September 15, 1999, shows a unique pattern called a “von Karman vortex street.” This pattern has long been studied in the laboratory, where the vortices are created by oil flowing past a cylindrical obstacle, making a string of vortices only several tens of centimeters long. Study of this classic “flow past a circular cylinder” has been very important in the understanding of laminar and turbulent fluid flow that controls a wide variety of phenomena, from the lift under an aircraft wing to Earth’s weather. Here, the cylinder is replaced by Alejandro Selkirk Island (named after the true “Robinson Crusoe,” who was stranded here for many months in the early 1700s). The island is about 1.5 km in diameter, and rises 1.6 km into a layer of marine stratocumulus clouds. This type of cloud is important for its strong cooling of the Earth’s surface, partially counteracting the Greenhouse warming. An extended, steady equatorward wind creates vortices with clockwise flow off the eastern edge and counterclockwise flow off the western edge of the island. The vortices grow as they advect hundreds of kilometers downwind, making a street 10,000 times longer than those made in the laboratory. Observing the same phenomenon extended over such a wide range of sizes dramatizes the “fractal” nature of atmospheric convection and clouds. Fractals are characteristic of fluid flow and other dynamic systems that exhibit “chaotic” motions. Both clockwise and counter-clockwise vortices are generated by flow around the island. As the flow separates from the island’s leeward (away from the source of the wind) side, the vortices “swallow” some of the clear air over the island. (Much of the island air is cloudless due to a local “land breeze” circulation set up by the larger heat capacity of the waters surrounding the island.) The “swallowed” gulps of clear island air get carried along within the vortices, but these are soon mixed into the surrounding clouds. Landsat is unique in its ability to image both the small-scale eddies that mix clear and cloudy air, down to the 30 meter pixel size of Landsat, but also having a wide enough field-of-view, 180 km, to reveal the connection of the turbulence to large-scale flows such as the subtropical oceanic gyres. Landsat 7, with its new onboard digital recorder, has extended this capability away from the few Landsat ground stations to remote areas such as Alejandro Island, and thus is gradually providing a global dynamic picture of evolving human-scale phenomena. For more details on von Karman vortices, refer to <a href="http://climate.gsfc.nasa.gov/~cahalan" rel="nofollow">climate.gsfc.nasa.gov/~cahalan</a>. Image and caption courtesy Bob Cahalan, NASA GSFC Instrument: Landsat 7 - ETM+ Credit: NASA/GSFC/Landsat <b><a href="http://www.nasa.gov/centers/goddard/home/index.html" rel="nofollow">NASA Goddard Space Flight Center</a></b> enables NASA’s mission through four scientific endeavors: Earth Science, Heliophysics, Solar System Exploration, and Astrophysics. Goddard plays a leading role in NASA’s accomplishments by contributing compelling scientific knowledge to advance the Agency’s mission. <b>Follow us on <a href="http://twitter.com/NASA_GoddardPix" rel="nofollow">Twitter</a></b> <b>Join us on <a href="http://www.facebook.com/pages/Greenbelt-MD/NASA-Goddard/395013845897?ref=tsd" rel="nofollow">Facebook</a></b>
ISS040-E-016570 (21 June 2014) --- From an altitude of 223 nautical miles, one of the Expedition 40 crew members on the International Space Station photographed this nearly vertical image of Guadalupe Island and the Von Karman cloud vortices that are its storied neighbors just off southern California's Pacific Coast.
ISS040-E-016569 (21 June 2014) --- From an altitude of 223 nautical miles, one of the Expedition 40 crew members on the International Space Station photographed this nearly vertical image of Guadalupe Island and the Von Karman cloud vortices that are its storied neighbors just off southern California's Pacific Coast.
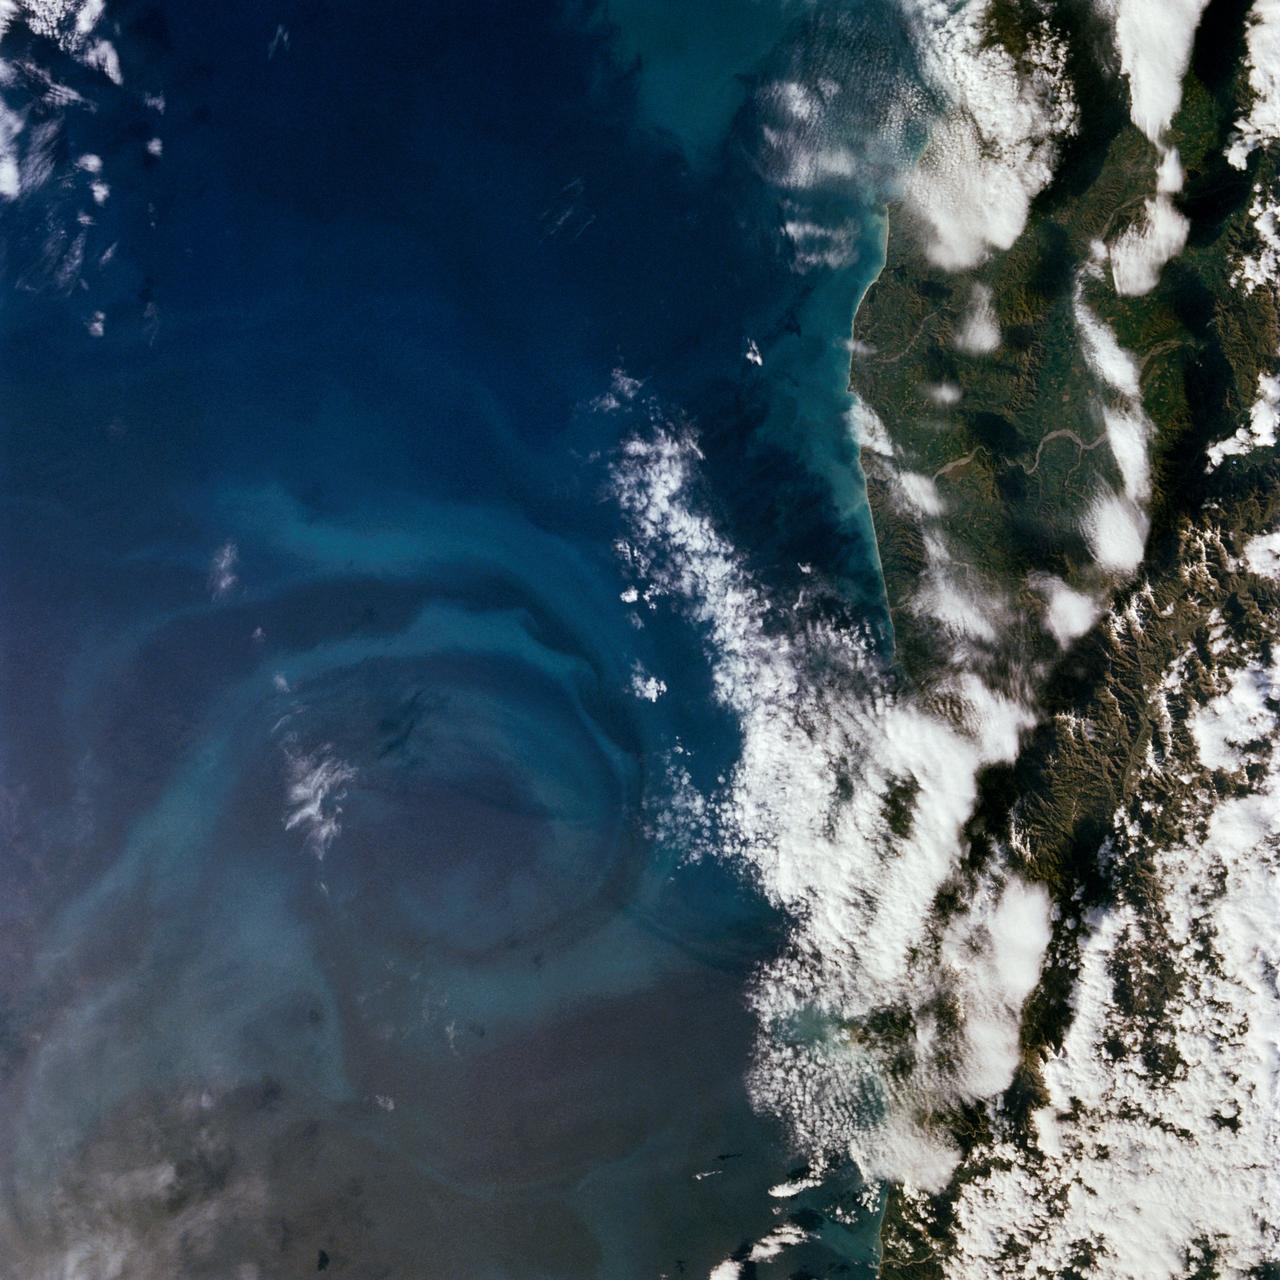
61A-50-020 (30 Oct-6 Nov 1985) --- Large photo plankton vortex along the coast of New Zealand's South Island, about 100 kilometers to the north by northeast of Christchurch. Southern hemisphere vortices are clearly clockwise as opposed to counter-clockwise in the northern hemisphere.

These images near Guadalupe Island from NASA Terra satellite from June 11, 2000 Terra orbit 2569 demonstrate a turbulent atmospheric flow pattern known as the von Karman vortex.
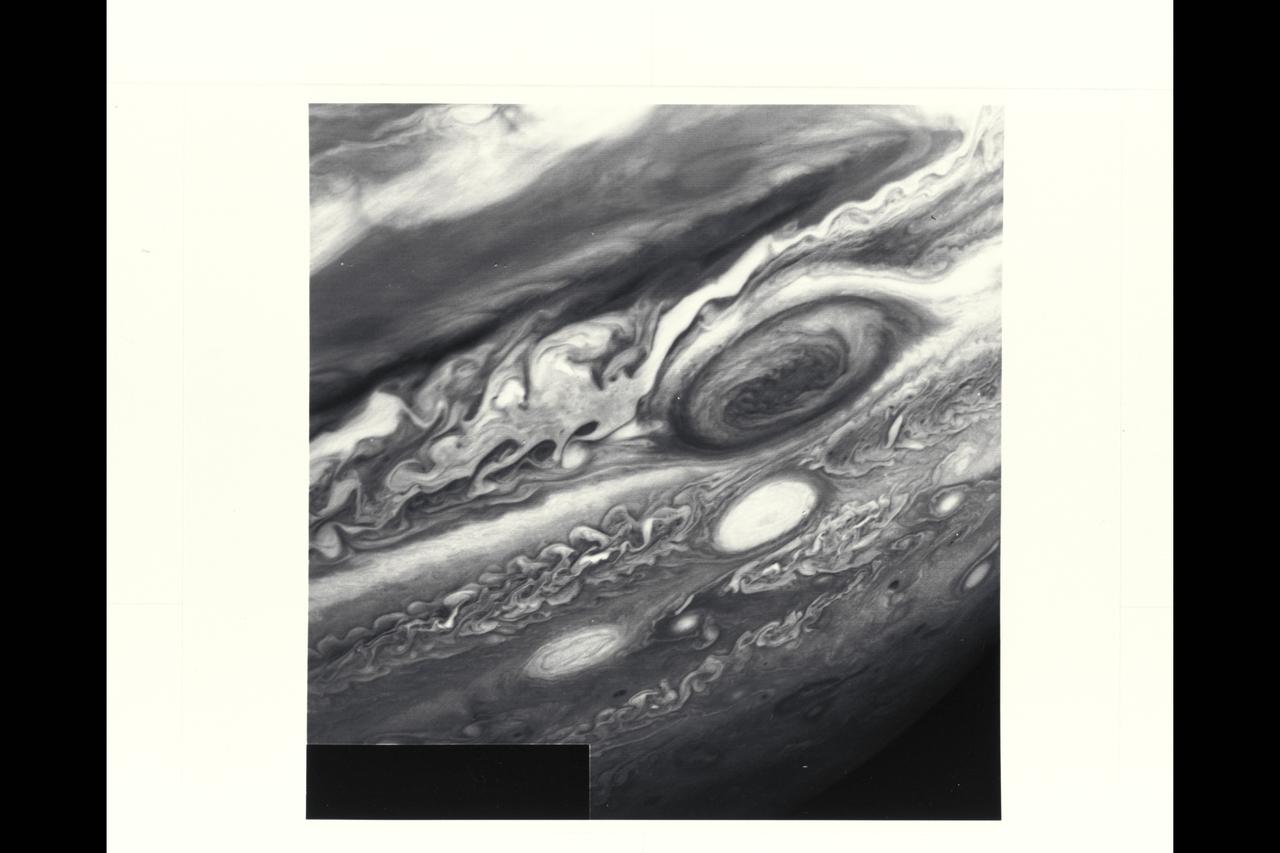
P-21742 BW Range: 6 million kilometers (3.72 million miles) This Voyager 2 image shows the region of Jupiter extending from the equator to the southern polar latitudes in the neighborhood of the Great Red Spot. A white oval, different from the one observed in a similiar position at the time of the Voyager 1 encounter, is situated south of the Great Red Spot. The region of white clouds now extends from east of the red spot and around its northern boundary, preventing small cloud vortices from circling the feature. The disturbed region west of the red spot has also changed since the equivalent Voyager 1 image. It shows more small scale structure and cloud vortices being formed out of the wave structures.
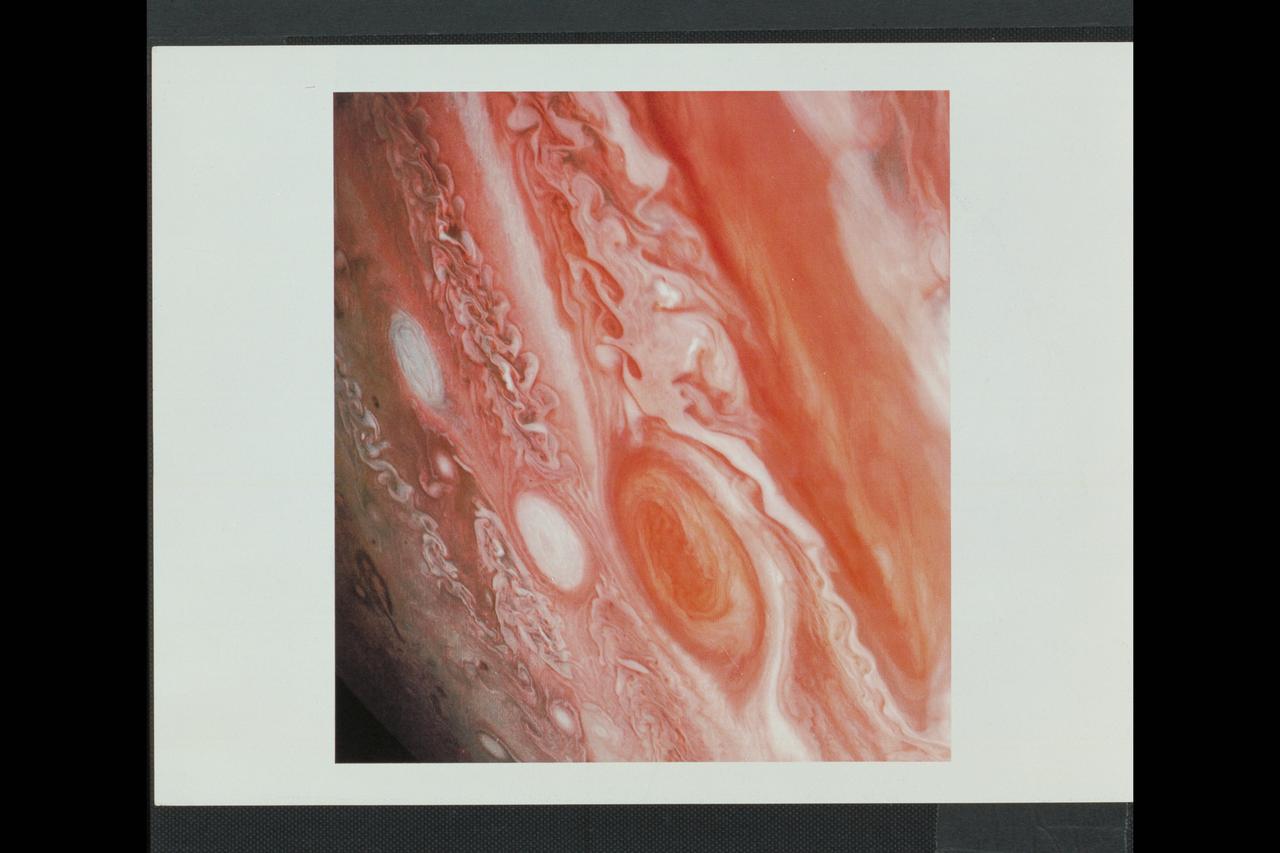
P-21742 C Range: 6 million kilometers (3.72 million miles) This Voyager 2 image shows the region of Jupiter extending from the equator to the southern polar latitudes in the neighborhood of the Great Red Spot. A white oval, different from the one observed in a similiar position at the time of the Voyager 1 encounter, is situated south of the Great Red Spot. The region of white clouds now extends from east of the red spot and around its northern boundary, preventing small cloud vortices from circling the feature. The disturbed region west of the red spot has also changed since the equivalent Voyager 1 image. It shows more small scale structure and cloud vortices being formed out of the wave structures.
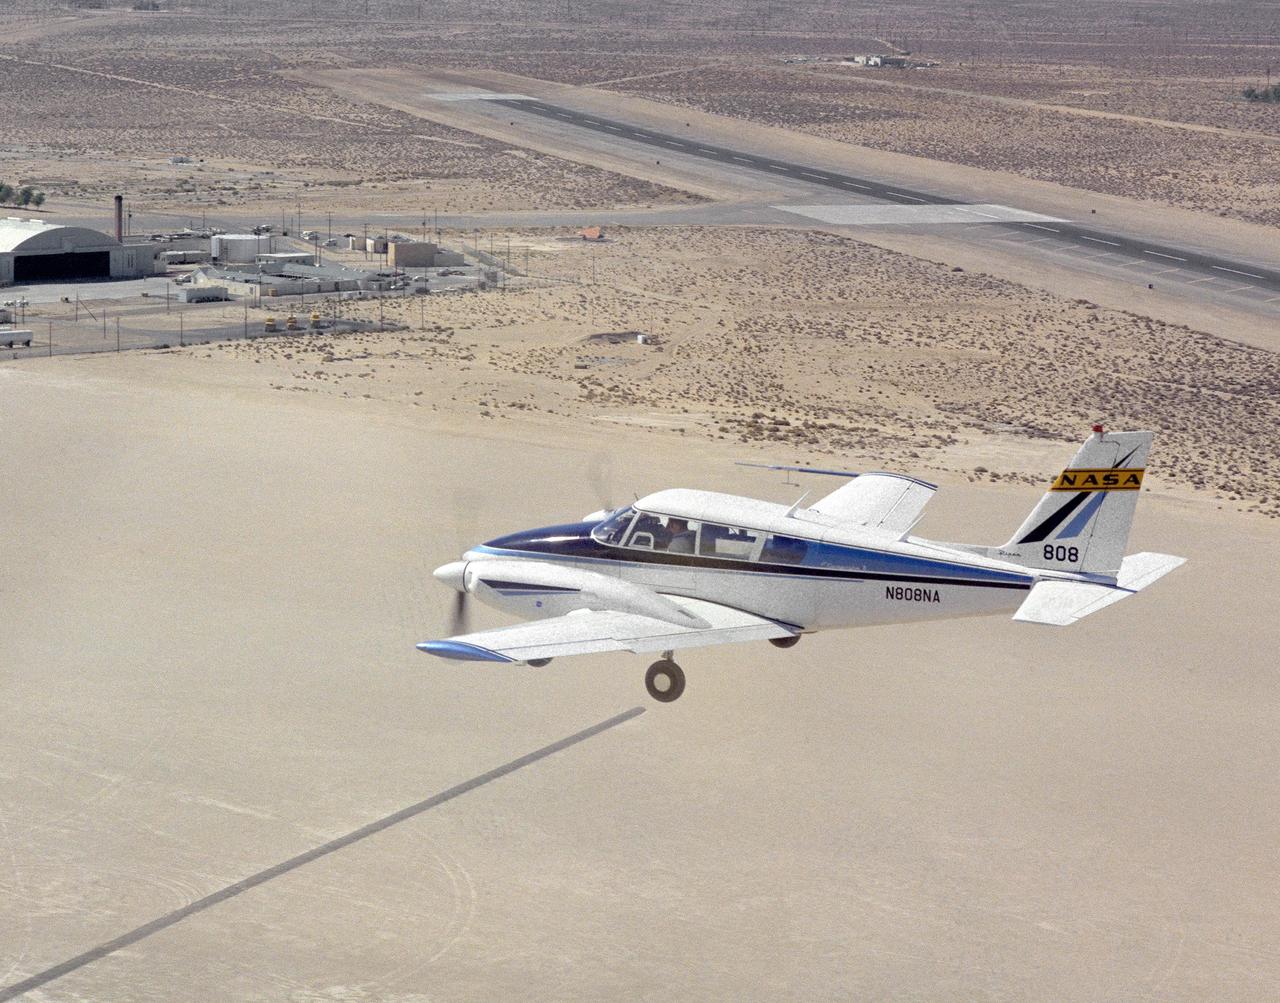
Dryden Flight Research Center's Piper PA-30 Twin Commanche, which helped validate the RPRV concept, descends to a remotely controlled landing on Rogers Dry Lake, unassisted by the onboard pilot. A Piper PA-30 Twin Commanche, known as NASA 808, was used at the NASA Dryden Flight Research Center as a rugged workhorse in a variety of research projects associated with both general aviation and military projects. In the early 1970s, the PA-30, serial number 301498, was used to test a flight technique used to fly Remotely Piloted Research Vehicles (RPRV's). The technique was first tested with the cockpit windows of the light aircraft blacked out while the pilot flew the aircraft utilizing a television monitor which gave him a "pilot's eye" view ahead of the aircraft. Later pilots flew the aircraft from a ground cockpit, a procedure used with all RPRV's. TV and two-way telemetry allow the pilot to be in constant control of the aircraft. The apparatus mounted over the cockpit is a special fish eye lens camera, used to obtain images that are transmitted to the ground based cockpit. This project paved the way for sophisticated, highly successful research programs involving high risk spin, stall, and flight control conditions, such as the HiMAT and the subscale F-15 remotely piloted vehicles. Over the years, NASA 808 has also been used for spin and stall research related to general aviation aircraft and also research to alleviate wake vortices behind large jetliners.
ISS040-E-016422 (20 June 2014) --- One of the Expedition 40 crew members aboard the International Space Station used a 28mm focal length to record this long stretch of California's Pacific Coast on June 20, 2014. Guadalupe Island and the surrounding von Karman cloud vortices over the Pacific can be seen just above frame center. San Diego is visible in upper left and the Los Angeles Basin is just to the left of center frame. Much of the Mojave Desert is visible in bottom frame.
STS099-703-007 (11-22 February 2000) ---A distinct cumulus cloud pattern marks the island wake within a weak northerly wind field in the vicinity of Isla Socorro, south of the Baja Peninsula of Mexico. The photo was taken by one of the astronauts aboard the Space Shuttle Endeavour as it orbited Earth in February 2000. A smaller companion island, San Benedicto, is visible to the north-northeast. Socorro rises to just over 3,400 feet and disrupts the winds which apparently are not strong or persistent enough to form closed vortices.
ISS030-E-254259 (22 April 2012) --- Cloud vortices off the Pacific coast of Mexico's Baja California were captured by one of the six expedition 30 crew members aboard the International Space Station as three of their number ready for their return trip to Earth in a few days. The Gulf of California or Sea of Cortez is completely clear of clouds as are the inland parts of Mexico and California pictured. The Salton Sea is visible at the lower right edge.
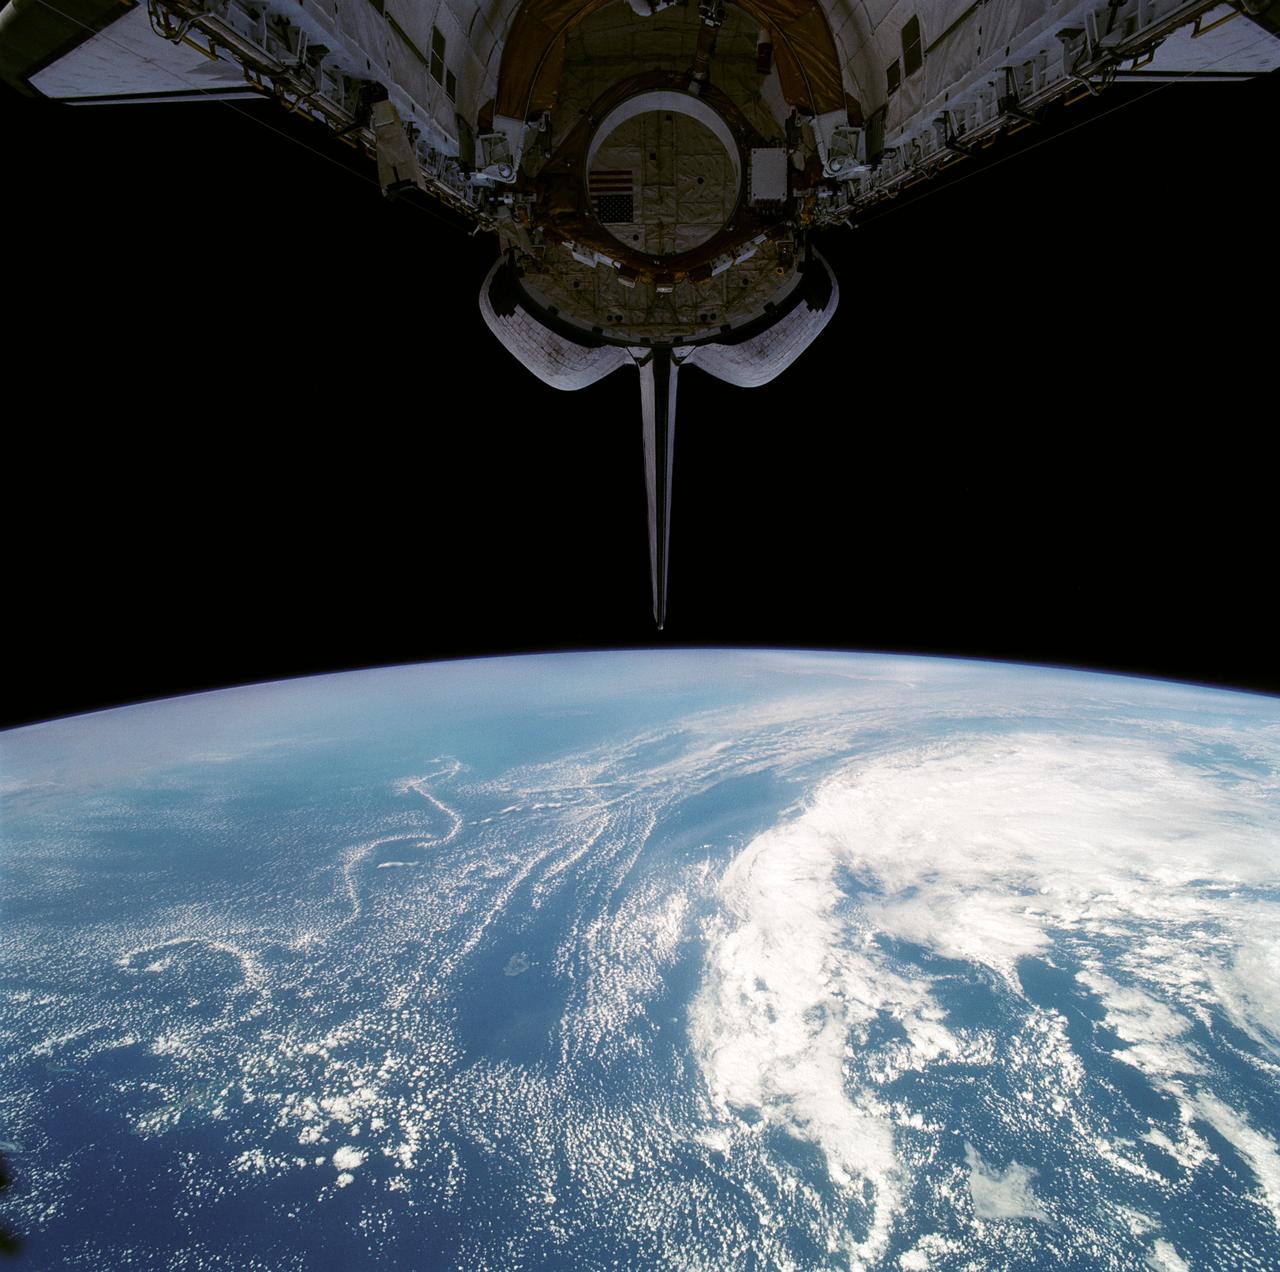
STS080-752-011 (19 Nov.-7 Dec. 1996) --- This view, photographed by one the crewmembers aboard the Earth-orbiting space shuttle Columbia, shows an area covered with clouds near the terminator thus the long shadows from the towering clouds. A portion of the vertical stabilizer of the space shuttle Columbia is seen on the right. Vortices indicate that it is a Southern Hemisphere photograph.
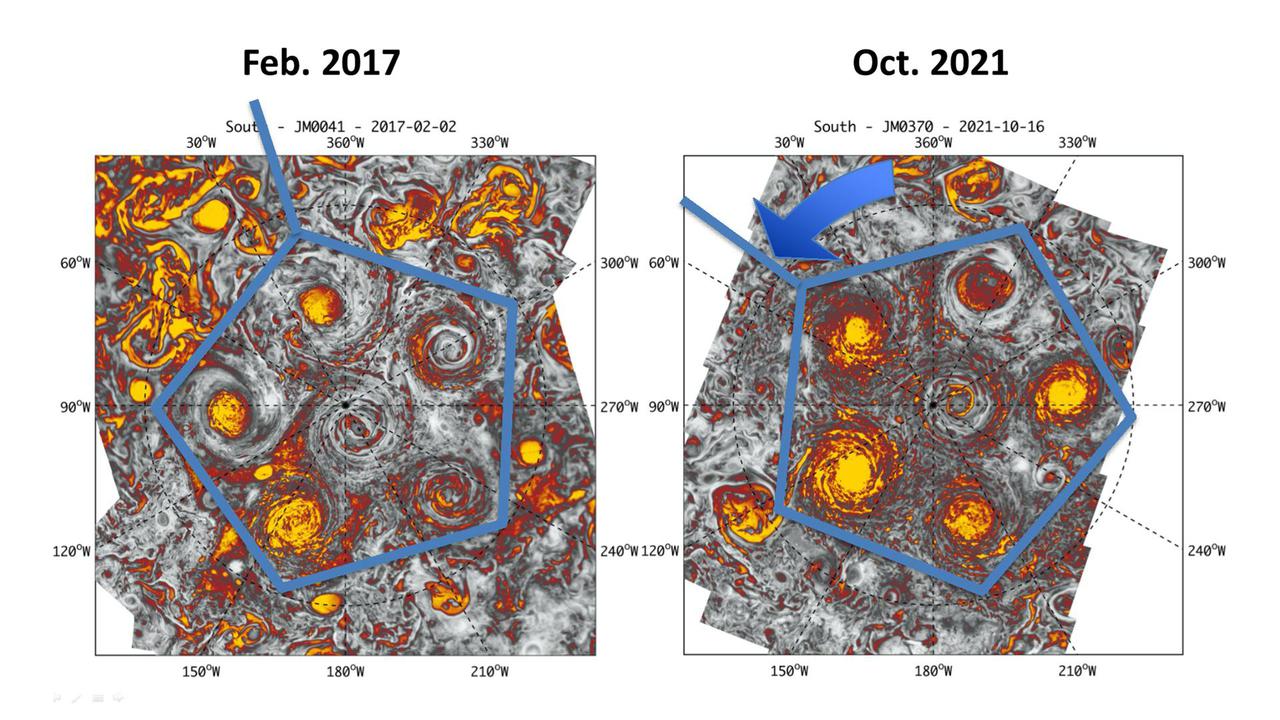
This annotated composite image depicts the movement of the polar and circumpolar cyclones of Jupiter's south pole between 2016 (left) and 2021 (right) as seen by the Jovian Infrared Auroral Mapper (JIRAM) instrument aboard NASA's Juno spacecraft. In both images, five cyclones are arranged as a pentagon, with a sixth cyclone in the center (south pole). JIRAM "sees" in infrared light not visible to the human eye. It was designed to capture the infrared light emerging from deep inside Jupiter, probing the weather layer down to 30 to 45 miles (50 to 70 kilometers) below Jupiter's cloud tops. https://photojournal.jpl.nasa.gov/catalog/PIA24967
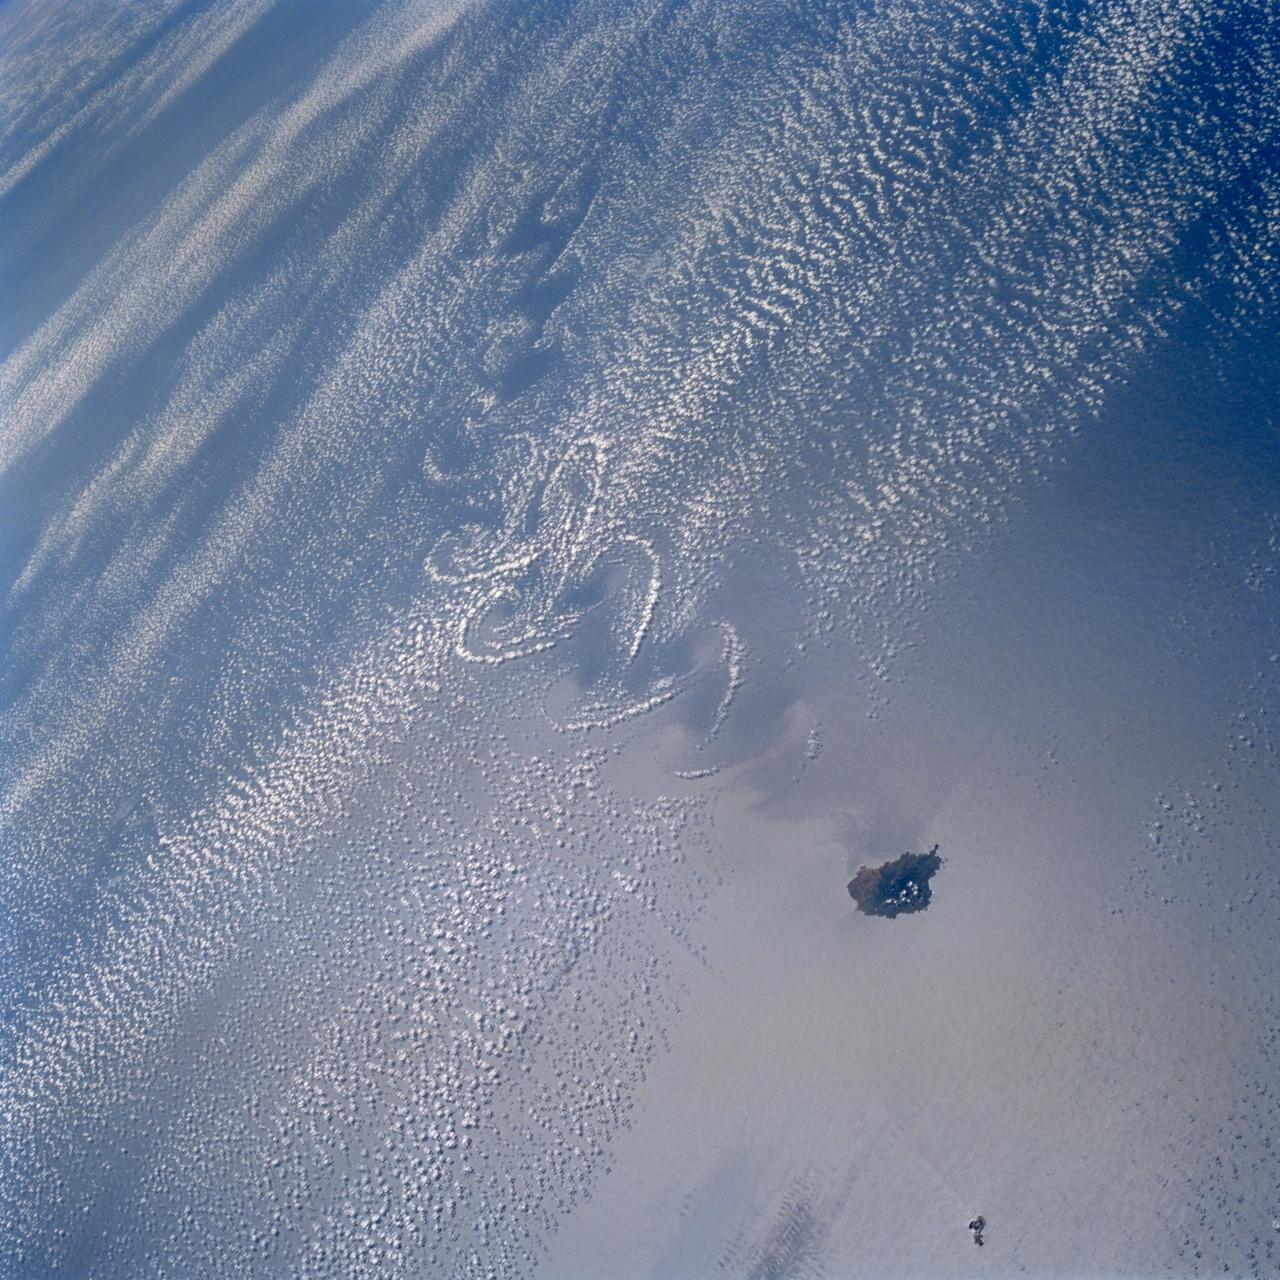
Theodore von Kármán, a Hungarian-American physicist, was the first to describe the physical processes that create long chains of spiral eddies like the one shown above. Known as von Kármán vortices the patterns can form nearly anywhere that fluid flow is disturbed by an object. Since the atmosphere behaves like a fluid, the wing of an airplane, a bridge, even an island can trigger the distinctive phenomenon. On May 22, 2013, the Moderate Resolution Imaging Spectroradiometer (MODIS) on NASA’s Terra satellite captured this natural-color image of cloud vortices behind Isla Socorro, a volcanic island located in the Pacific Ocean. The island, which is located a few hundred kilometers off the west coast of Mexico and the southern tip of Baja California, is part of the Revillagigedo Archipelago. Satellite sensors have spotted von Kármán vortices around the globe, including off of Guadalupe Island, near the coast of Chile, in the Greenland Sea, in the Arctic, and even next to a tropical storm. NASA image courtesy Jeff Schmaltz, LANCE/EOSDIS MODIS Rapid Response Team at NASA GSFC. Caption by Adam Voiland. Instrument: Terra - MODIS More info: <a href="http://1.usa.gov/14VSDQa" rel="nofollow">1.usa.gov/14VSDQa</a> Credit: <b><a href="http://www.earthobservatory.nasa.gov/" rel="nofollow"> NASA Earth Observatory</a></b> <b><a href="http://www.nasa.gov/audience/formedia/features/MP_Photo_Guidelines.html" rel="nofollow">NASA image use policy.</a></b> <b><a href="http://www.nasa.gov/centers/goddard/home/index.html" rel="nofollow">NASA Goddard Space Flight Center</a></b> enables NASA’s mission through four scientific endeavors: Earth Science, Heliophysics, Solar System Exploration, and Astrophysics. Goddard plays a leading role in NASA’s accomplishments by contributing compelling scientific knowledge to advance the Agency’s mission. <b>Follow us on <a href="http://twitter.com/NASA_GoddardPix" rel="nofollow">Twitter</a></b> <b>Like us on <a href="http://www.facebook.com/pages/Greenbelt-MD/NASA-Goddard/395013845897?ref=tsd" rel="nofollow">Facebook</a></b> <b>Find us on <a href="http://instagram.com/nasagoddard?vm=grid" rel="nofollow">Instagram</a></b>
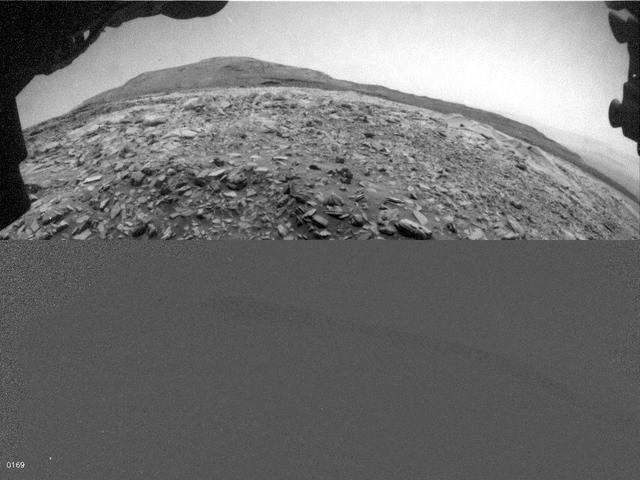
NASA's Curiosity Mars rover used one of its Hazard-Avoidance Cameras (Hazcams) to catch this dusty wind gust blowing overhead on March 18, 2022, the 3,418th Martian day, or sol, of the mission. Scientists believe it's a wind gust rather than a dust devil since it doesn't appear to have the trademark vorticity, or twisting, of a dust devil. The series of images captured by the Hazcam is viewable in the top image; the bottom image shows the frames after they've been processed by change-detection software, which helps the viewer see how the wind gust moves over time. Movie available at https://photojournal.jpl.nasa.gov/catalog/PIA25177
ISS041-E-016962 (18 Sept. 2014) --- Although land and waters of Mexico's Pacific area pictured here are influenced by masses of clouds, for Baja California and other parts of Mexico in this photograph made from the International Space Station, things are quite calmer than a few days ago when Hurricane Odile unleashed its power on the peninsula, especially Baja's south end (right side of frame) and Cabo San Lucas (just out of frame right). The Sea of Cortez (Gulf of California) experiences rather calm weather in this view. California's Salton Sea is visible at left center; and Guadalupe Island is visible at lower left, surrounded by von Karman vortices.
The large dark feature is a classic Martian sand dune. Most sand on Earth is made from the mineral quartz, which is white and bright. On Mars, most sand is composed of dark basalt, a volcanic rock. For this reason, dunes on Mars are darker than those on Earth. The dunes in this observation, within Wirtz Crater, are known as "barchans." The steepest slope is on the eastern (right) side, partially in shadow, and represents the direction the dune is migrating as the sand is blown and transported by the wind. Small ripples are visible on much of the dune surface. The dark streaks on the dune are tracks left by passing vortices known to us as dust devils. These raise dust off the dune, revealing a darker substrate. http://photojournal.jpl.nasa.gov/catalog/PIA12289
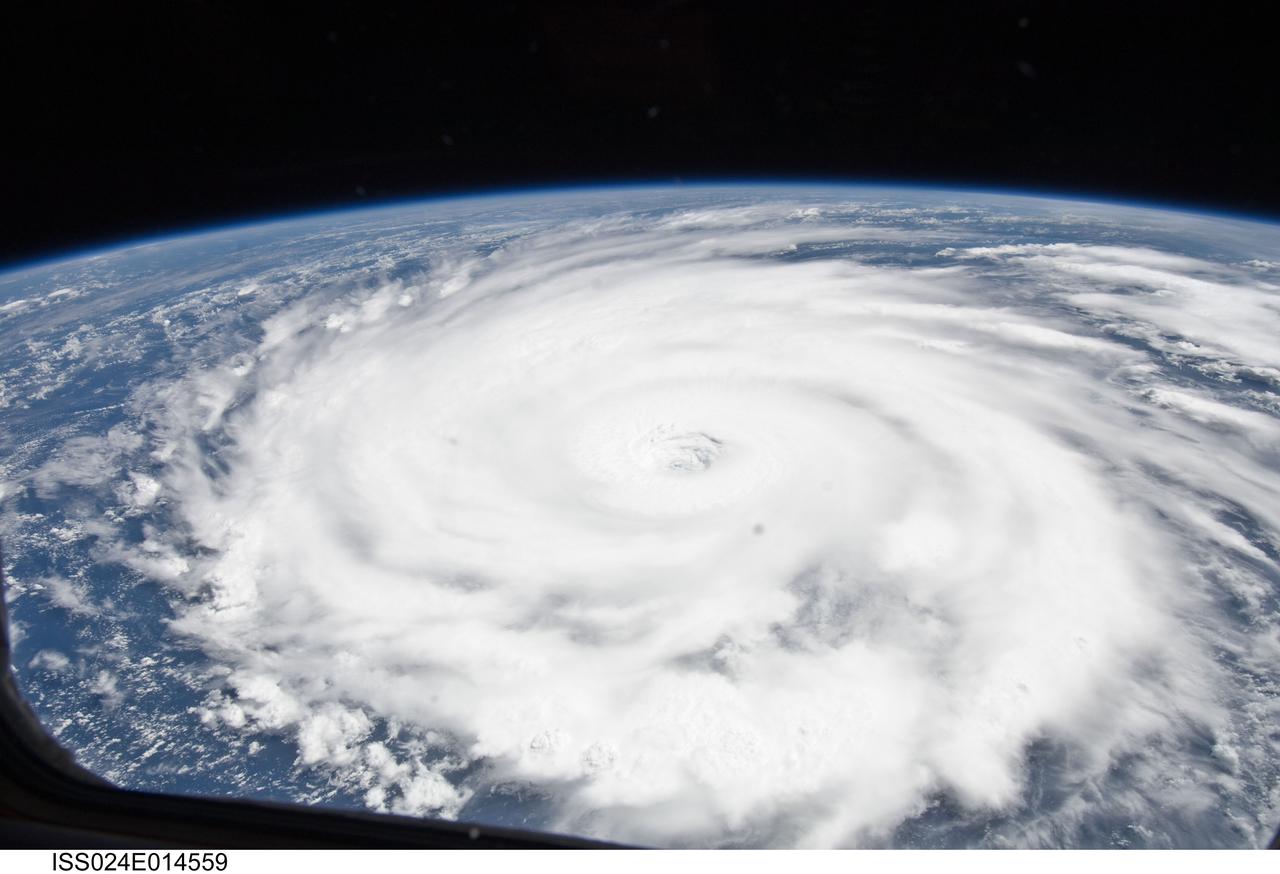
ISS024-E-014559 (14 Sept. 2010) --- Hurricane Igor is featured in this Sept. 14 image photographed by an Expedition 24 crew member on the International Space Station. At the time this image was taken, Hurricane Igor was about 648 miles east of Barbuda Island in the Lesser Antilles. It was travelling to the northeast (290 degrees) at 6.2 mph (6 kts). The winds were already 132.5 mph (115 kts) gusting to 161.3 mph (140 kts) and forecast to intensify. Igor?s well-defined eye was a dynamic area of swift rising winds in the outer wall and sinking winds in the center. His strong eye wall surrounded a low level cloud deck of clouds containing additional vortices.
This image captures the intensity of the jets and vortices in Jupiter's North North Temperate Belt. NASA's Juno spacecraft took this color-enhanced image at 10:31 p.m. PDT on May 23, 2018 (1:31 a.m. EDT on May 24), as Juno performed its 13th close flyby of Jupiter. At the time, the spacecraft was about 4,900 miles (7,900 kilometers) from the tops of the clouds of the gas giant planet at a northern latitude of about 41 degrees. The view is oriented with south on Jupiter toward upper left and north toward lower right. The North North Temperate Belt is the prominent reddish-orange band left of center. It rotates in the same direction as the planet and is predominantly cyclonic, which in the northern hemisphere means its features spin in a counter-clockwise direction. Within the belt are two gray-colored anticyclones. To the left of the belt is a brighter band (the North North Temperate Zone) with high clouds whose vertical relief is accentuated by the low angle of sunlight near the terminator. These clouds are likely made of ammonia-ice crystals, or possibly a combination of ammonia ice and water. Although the region as a whole appears chaotic, there is an alternating pattern of rotating, lighter-colored features on the zone's north and south sides. Scientists think the large-scale dark regions are places where the clouds are deeper, based on infrared observations made at the same time by Juno's JIRAM experiment and Earth-based supporting observations. Those observations show warmer, and thus deeper, thermal emission from these regions. To the right of the bright zone, and farther north on the planet, Jupiter's striking banded structure becomes less evident and a region of individual cyclones can be seen, interspersed with smaller, darker anticyclones. https://photojournal.jpl.nasa.gov/catalog/PIA22423 . - Enhanced image by Kevin M. Gill (CC-BY) based on images provided courtesy of NASA/JPL-Caltech/SwRI/MSSS
SL4-137-3632 (February 1974) --- A photograph taken from the Skylab space station in Earth orbit illustrating an atmospheric wave pattern by the affect of a small mountainous island on wind currents. Various patterns can be seen downwind of small islands. Often a Von Karmon vortex can be seen which appears as a spiral pattern. Multiple vortices have been photographed on previous missions. This photograph illustrates a "bow wave" pattern which extends for hundreds of miles downwind from the island. The island itself is often clear when a wave pattern is formed downstream. This particular pattern is very symmetrical. These wave patterns are most common in the South Pacific. This picture was taken by a Skylab 4 crewmen using a hand-held 70mm Hasselblad camera. Photo credit: NASA

Outlined with gold stripes are the hinged nose strakes, modifications made to NASA's F-18 HARV (High Alpha Research Vehicle) at the Dryden Flight Research Center, Edwards, California. Actuated Nose Strakes for Enhanced Rolling (ANSER) were installed to fly the third and final phase in the HARV flight test project. Normally folded flush, the units -- four feet long and six inches wide -- can be opened independently to interact with the nose vortices to produce large side forces for control. Early wind tunnel tests indicated that the strakes would be as effective in yaw control at high angles of attack as rudders are at lower angles. Testing involved evaluation of the strakes by themselves as well as combined with the aircraft's Thrust Vectoring System. The strakes were designed by NASA's Langley Research Center, then installed and flight tested at Dryden.
![This large crescent dune in Kaiser Crater shows the scars of many types of seasonal erosional activities. Along its downwind slope are large gullies which are active during winter, when frost drives dune material downslope, carving out channels and creating fan-shaped aprons. On the upwind slope (bottom), dust devil tracks are visible: dark lines and curliques created during the spring season by small wind vortices vacuuming up a thin layer of dust and exposing the dark dune sand. Note: Both the cutout and the above image are rotated so that North is to the right. The map is projected here at a scale of 25 centimeters (9.8 inches) per pixel. [The original image scale is 25.3 centimeters (10 inches) per pixel (with 1 x 1 binning); objects on the order of 76 centimeters (30 inches) across are resolved.] North is up. http://photojournal.jpl.nasa.gov/catalog/PIA21458](https://images-assets.nasa.gov/image/PIA21458/PIA21458~medium.jpg)
This large crescent dune in Kaiser Crater shows the scars of many types of seasonal erosional activities. Along its downwind slope are large gullies which are active during winter, when frost drives dune material downslope, carving out channels and creating fan-shaped aprons. On the upwind slope (bottom), dust devil tracks are visible: dark lines and curliques created during the spring season by small wind vortices vacuuming up a thin layer of dust and exposing the dark dune sand. Note: Both the cutout and the above image are rotated so that North is to the right. The map is projected here at a scale of 25 centimeters (9.8 inches) per pixel. [The original image scale is 25.3 centimeters (10 inches) per pixel (with 1 x 1 binning); objects on the order of 76 centimeters (30 inches) across are resolved.] North is up. http://photojournal.jpl.nasa.gov/catalog/PIA21458
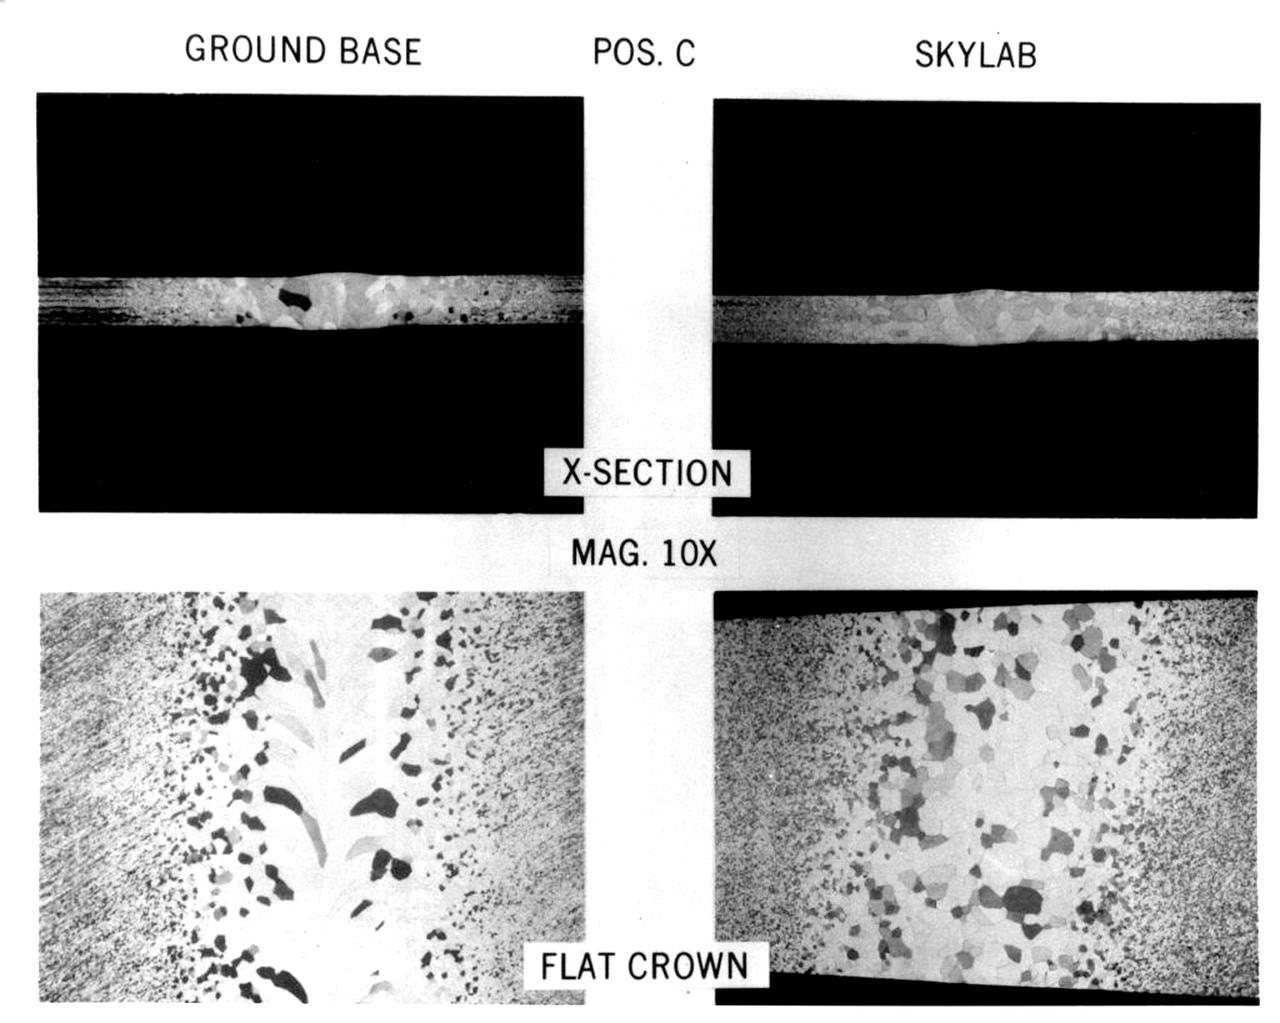
Comparison of ground-based (left) and Skylab (right) electron beam welds in pure tantalum (Ta) (10X magnification). Residual votices left behind in the ground-based sample after the electron beam passed were frozen into the grain structure. These occurred because of the rapid cooling rate at the high temperature. Although the thermal characteristics and electron beam travel speeds were comparable for the skylab sample, the residual vortices were erased in the grain structure. This may have been due to the fact that final grain size of the solidified material was smaller in the Skylab sample compared to the ground-based sample. The Skylab sample was processed in the M512 Materials Processing Facility (MPF) during Skylab SL-2 Mission. Principal Investigator was Richard Poorman.
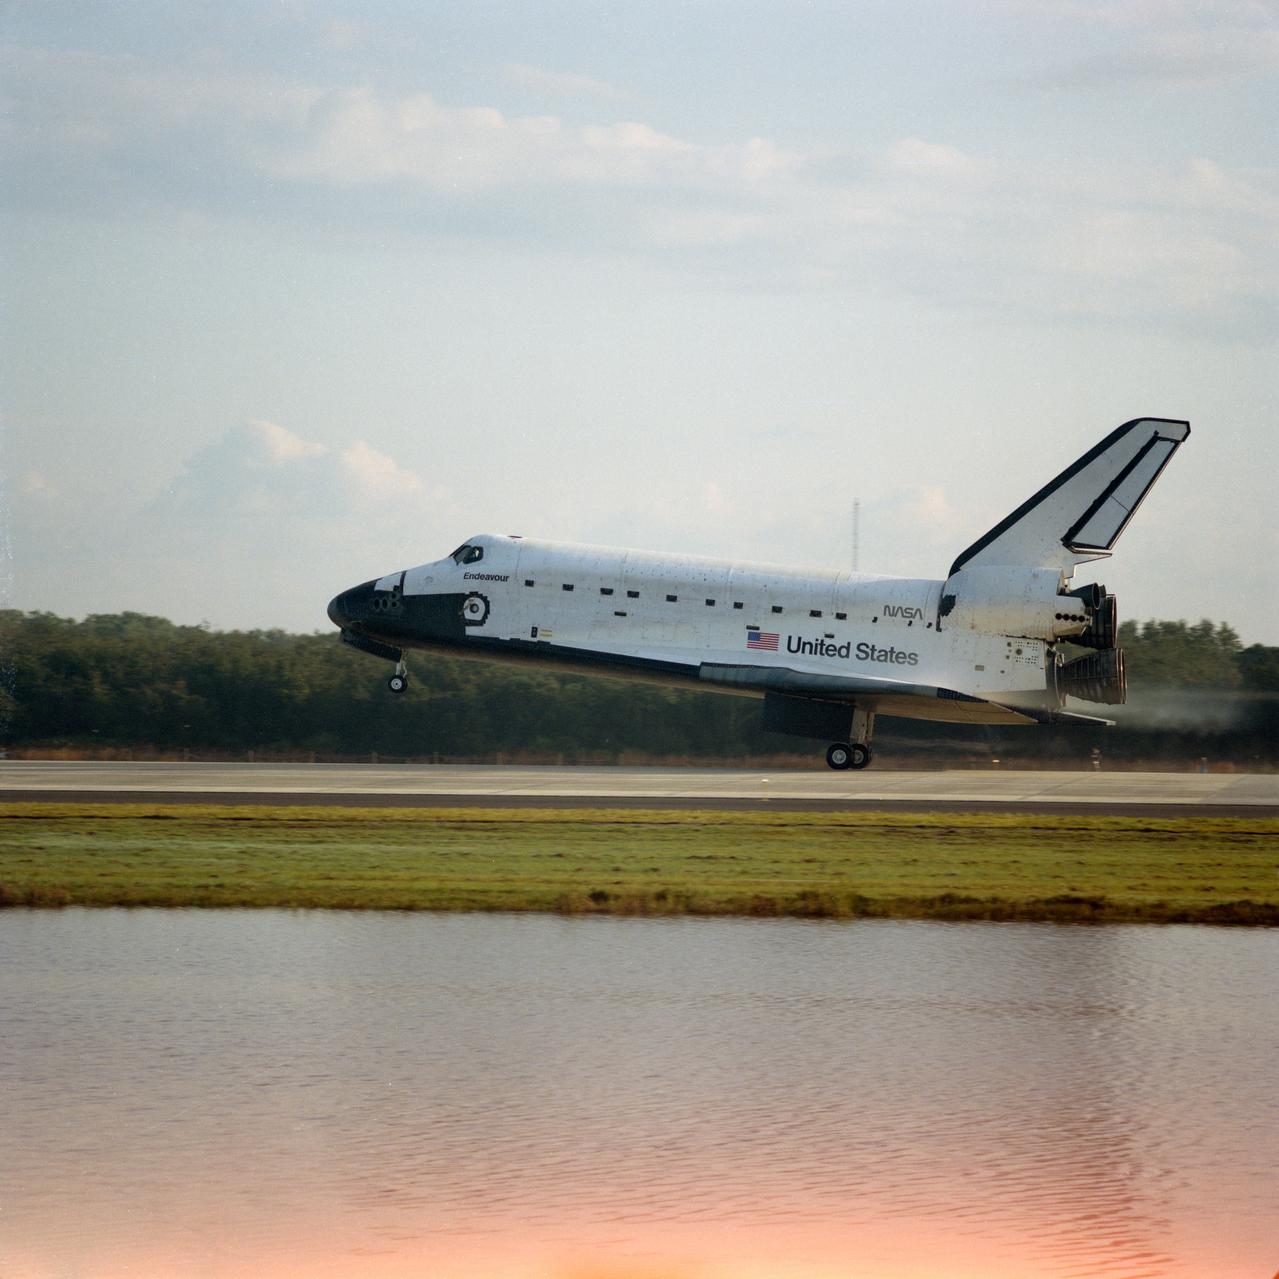
STS054-S-098 (19 Jan 1993) --- This ground-level side view shows the Space Shuttle Endeavour during main landing gear touchdown at KSC's Shuttle Landing Facility to successfully complete a six day Earth-orbital mission. Landing occurred at 8:38 a.m. (EST), Jan. 19, 1993. Onboard were astronauts John H. Casper, mission commander; Donald R. McMonagle, pilot; Gregory J. Harbaugh, Mario Runco Jr. and Susan J. Helms, mission specialists.

This image captures swirling cloud belts and tumultuous vortices within Jupiter's northern hemisphere. NASA's Juno spacecraft took this color-enhanced image at 10:23 p.m. PDT on May 23, 2018 (1:23 a.m. EDT on May 24), as the spacecraft performed its 13th close flyby of Jupiter. At the time, Juno was about 9,600 miles (15,500 kilometers) from the planet's cloud tops, above a northern latitude of 56 degrees. The region seen here is somewhat chaotic and turbulent, given the various swirling cloud formations. In general, the darker cloud material is deeper in Jupiter's atmosphere, while bright cloud material is high. The bright clouds are most likely ammonia or ammonia and water, mixed with a sprinkling of unknown chemical ingredients. A bright oval at bottom center stands out in the scene. This feature appears uniformly white in ground-based telescope observations. However, with JunoCam we can observe the fine-scale structure within this weather system, including additional structures within it. There is not significant motion apparent in the interior of this feature; like the Great Red Spot, its winds probably slows down greatly toward the center. Citizen scientists Gerald Eichstädt and Seán Doran created this image using data from the spacecraft's JunoCam imager. The view is a composite of several separate JunoCam images that were re-projected, blended, and healed. https://photojournal.jpl.nasa.gov/catalog/PIA22424
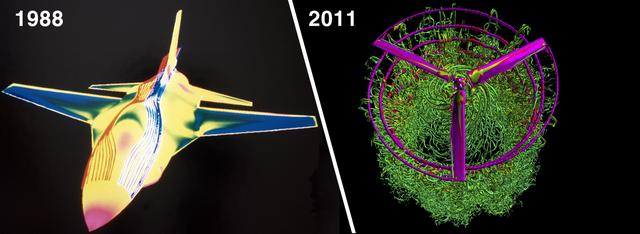
Then and Now: These images illustrate the dramatic improvement in NASA computing power over the last 23 years, and its effect on the number of grid points used for flow simulations. At left, an image from the first full-body Navier-Stokes simulation (1988) of an F-16 fighter jet showing pressure on the aircraft body, and fore-body streamlines at Mach 0.90. This steady-state solution took 25 hours using a single Cray X-MP processor to solve the 500,000 grid-point problem. Investigator: Neal Chaderjian, NASA Ames Research Center At right, a 2011 snapshot from a Navier-Stokes simulation of a V-22 Osprey rotorcraft in hover. The blade vortices interact with the smaller turbulent structures. This very detailed simulation used 660 million grid points, and ran on 1536 processors on the Pleiades supercomputer for 180 hours. Investigator: Neal Chaderjian, NASA Ames Research Center; Image: Tim Sandstrom, NASA Ames Research Center
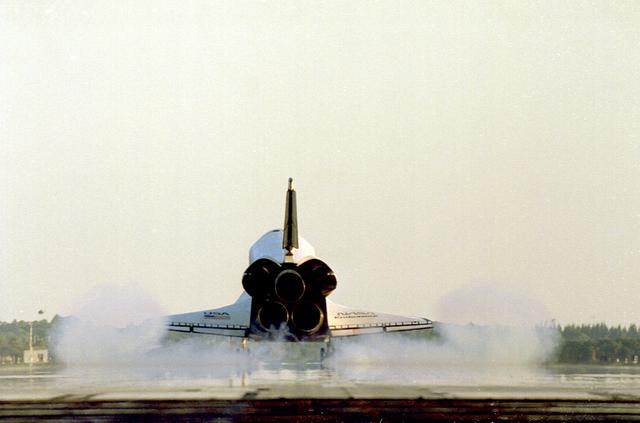
STS089-S-013 (31 Jan. 1998) --- Interesting vortices at the wingtips of the space shuttle Endeavour tell-tale the spacecraft's landing on Runway 15 of the Shuttle Landing Facility (SLF), at the Kennedy Space Center (KSC). Main gear touchdown for the almost nine-day flight was at 5:35:09 p.m. (EST) Jan. 31, 1998. Complete wheel stop occurred at 5:36:19 p.m., making a total mission elapsed time of eight days, 19 hours, 48 minutes and four seconds. The 89th space shuttle mission marked the 42nd (and 13th consecutive) landing of a space shuttle at KSC. Onboard were astronauts Terrence W. Wilcutt, Joe F. Edwards Jr., Bonnie J. Dunbar, David A. Wolf, James F. Reilly and Michael P. Anderson; and the Russian Space Agency's (RSA) cosmonaut Salizhan S. Sharipov. Andrew S. W. Thomas had earlier gone into space aboard the Endeavour to replace Wolf aboard Russia's Mir Space Station. The ninth and final shuttle/Mir docking mission in the spring of this year will retrieve Thomas from the Mir complex. Photo credit: NASA
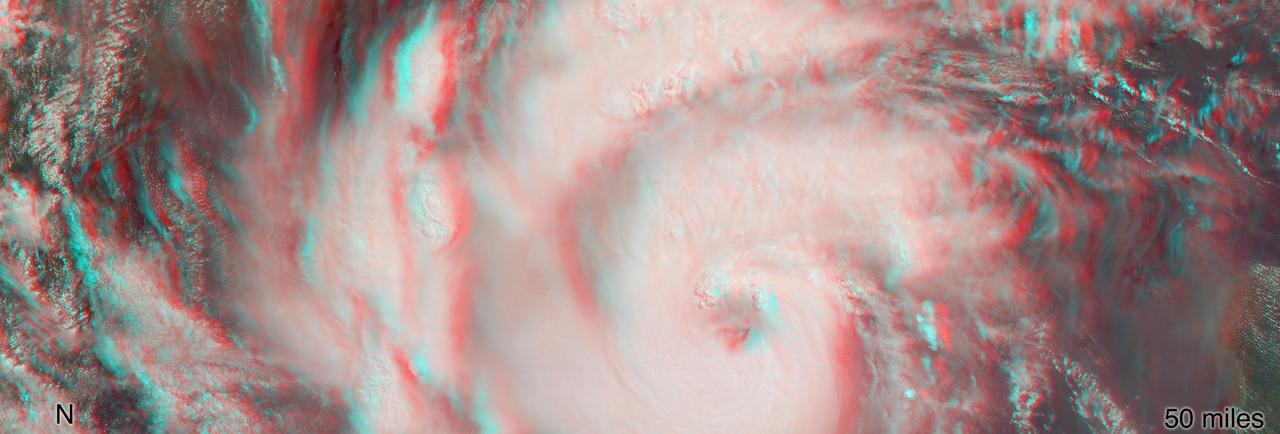
MISR's stereo anaglyph shows a three-dimensional view of Michael and combines two of MISR's nine camera angles. Using 3D red-blue glasses, you can see the 3D effect. Apparent in the 3D stereo anaglyph as well as the height field are a number of bright "clumps." These are groups of strong thunderstorms embedded within the larger circulation of the hurricane. Known as "vortical hot towers" the presence of these features indicates rapid transport of heat energy from the ocean surface into the storm, typically indicative of rapid intensification of the hurricane. In fact, between 11 a.m. and 2 p.m. EDT, while MISR imaged the hurricane, the estimated central pressure dropped 8 hPa and the maximum sustained winds increased about 12 mph (19 kph) and over the next 24 hours Hurricane Michael intensified from a Category 2 to a Category 4 storm. The National Hurricane Center clocked Michael's sustained wind speed at 150 mph (240 kph) just before noon local time on Wednesday. It is expected to bring strong winds, storm surge and heavy rain to much of the southeast. https://photojournal.jpl.nasa.gov/catalog/PIA22748
A swirling storm somersaults through Jupiter's South Equatorial Belt in this view taken by NASA's Juno spacecraft. This feature -- not to be confused with the planet's iconic Great Red Spot -- is escorted by several smaller, reddish vortices above and to the left. This natural color view offers an approximation of what Jupiter would look like to human eyes from Juno's vantage point near the time of closest approach in its orbit. Jupiter's stunning appearance is due to its atmosphere of colorful cloud bands and spots. The vivid red and orange hues are created by chemicals of uncertain composition called "chromophores." The image was taken at 10:28 p.m. PDT on July 15, 2018 (1:28 a.m. EDT on July 16), as the spacecraft performed its 14th close flyby of Jupiter. At the time, Juno was about 4,900 miles (8,000 kilometers) from the planet's cloud tops, above a southern latitude of 36 degrees. Citizen scientist Björn Jónsson created this image using data from the spacecraft's JunoCam imager. https://photojournal.jpl.nasa.gov/catalog/PIA22427. - Enhanced image by Björn Jónsson (CC-NC-SA) based on images provided courtesy of NASA/JPL-Caltech/SwRI/MSSS
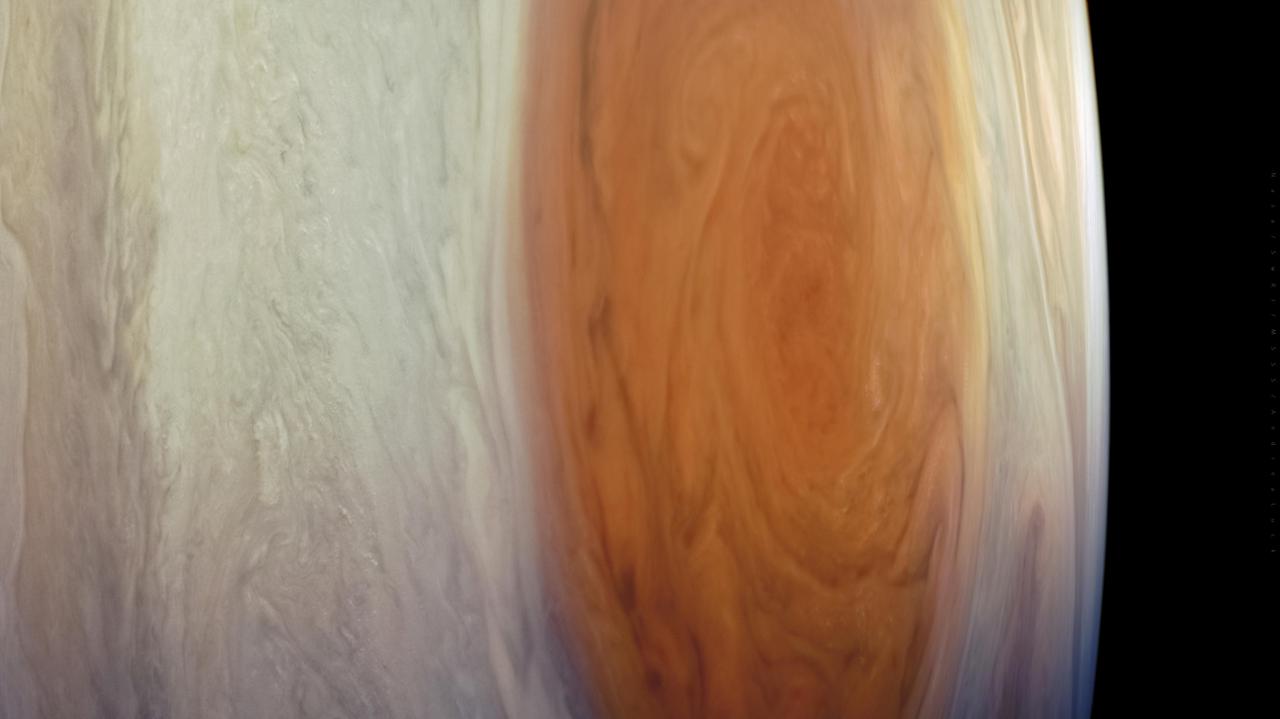
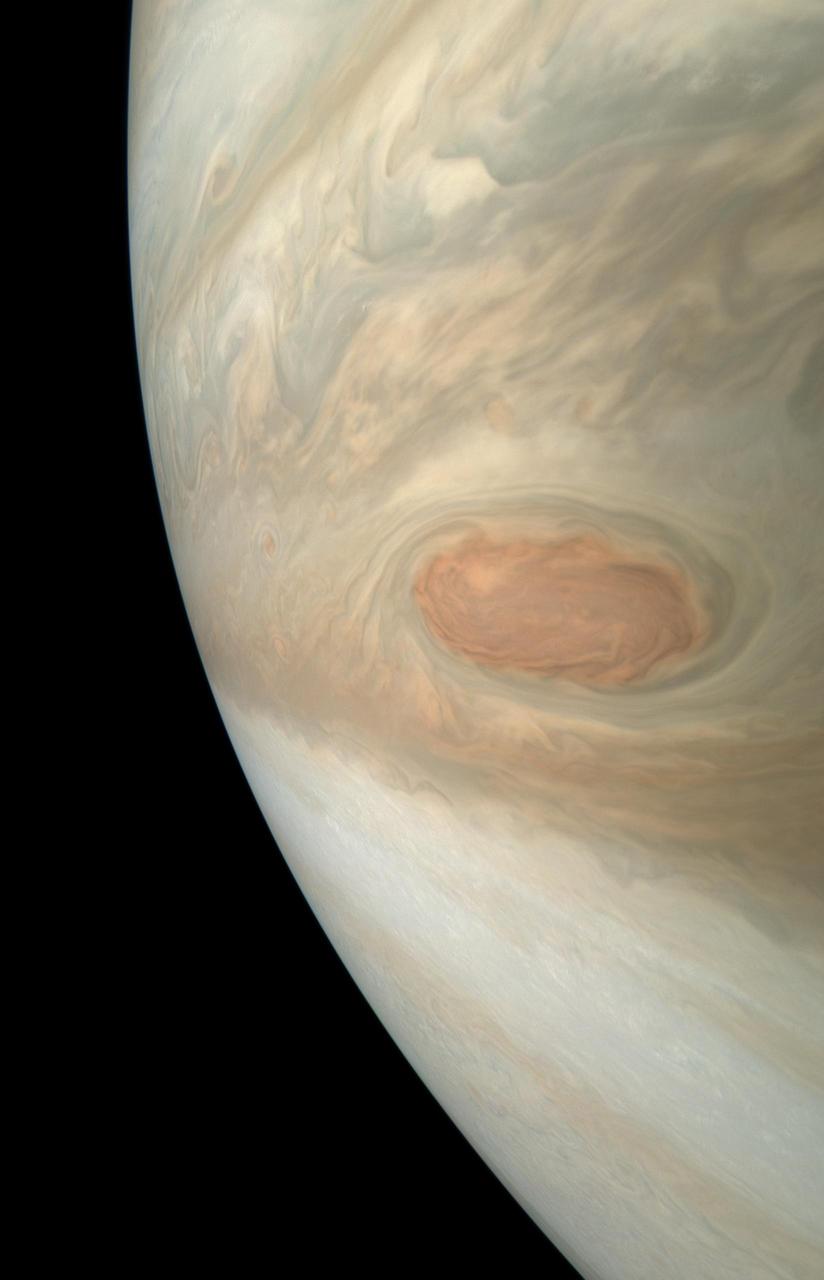
NASA's Juno spacecraft captured this detailed look at Jupiter's most recognizable feature, the Great Red Spot. Data from Juno's instruments indicate this giant, long-lived vortex extends far deeper into Jupiter's atmosphere than scientists previously expected, to about 300 miles (500 kilometers) below the cloud tops. The surprising discovery demonstrates that the Great Red Spot and other vortices descend below the depth where sunlight warms the atmosphere, providing new clues about the inner workings of the planet's beautiful but violent atmosphere. Researchers published the findings in the journal Science in Oct. 2021: https://www.nasa.gov/press-release/nasa-s-juno-science-results-offer-first-3d-view-of-jupiter-atmosphere Citizen scientist Andrea Luck processed this image from raw JunoCam data. The original image was taken on July 10, 2017, at 07:10 p.m. PDT (10:10 p.m. EDT), as the Juno spacecraft performed its seventh close flyby of Jupiter. At the time, the spacecraft was about 8,600 miles (13,840 kilometers) from the cloud tops, above latitude 33 degrees south. https://photojournal.jpl.nasa.gov/catalog/PIA25011
During the 1970s, the focus at Dryden shifted from high-speed and high-altitude flight to incremental improvements in technology and aircraft efficiency. One manifestation of this trend occurred in the winglet flight research carried out on a KC-135 during 1979 and 1980. Richard Whitcomb at the Langley Research Center had originated the idea of adding small vertical fins to an aircraft's wing tips. His wind tunnel tests indicated that winglets produced a forward thrust, which reduced the strength of the vortices generated by an aircraft's wing tips and resulted in a reduction of drag and an increase in aircraft range. Whitcomb, who had previously developed the area rule concept and the supercritical wing, selected the best winglet shape for flight tests on a KC-135 tanker. When the tests were completed, the data showed that the winglets provided a 7 percent improvement in range over the standard KC-135. The obvious economic advantage at a time of high fuel costs caused winglets to be adopted on business jets, airliners, and heavy military transports.
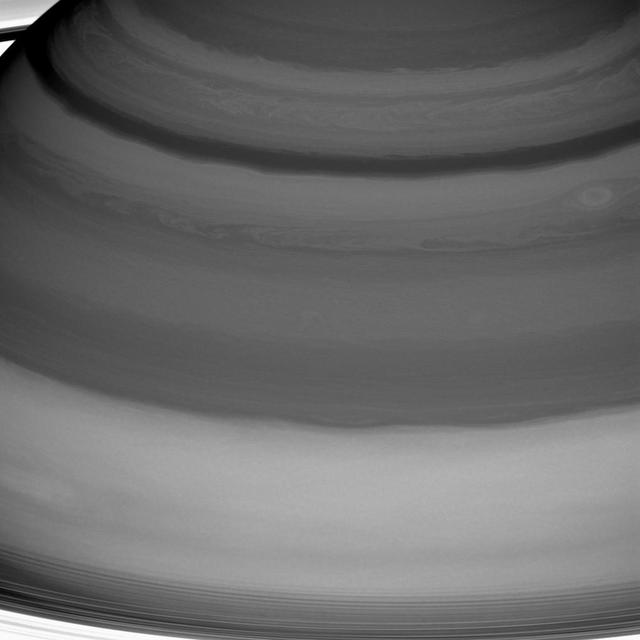
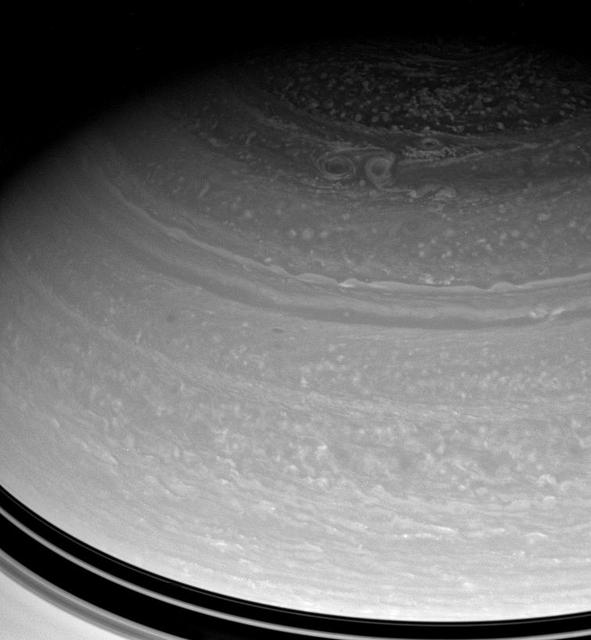
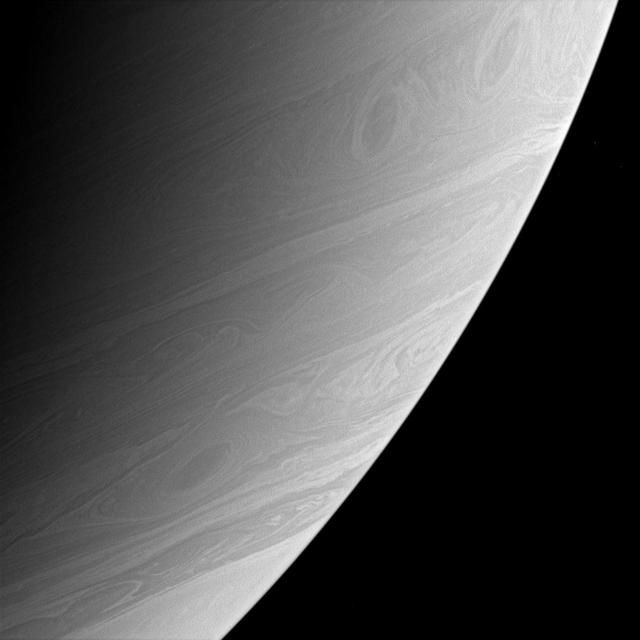
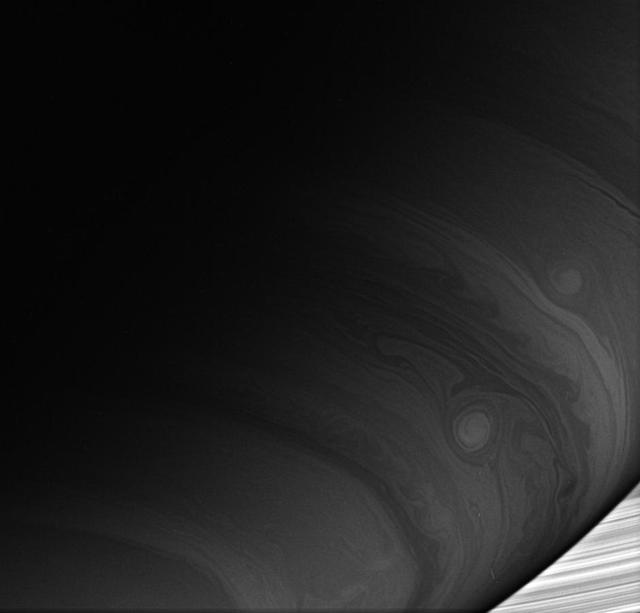
Saturn's clouds are full of raw beauty, but they also represent a playground for a branch of physics called fluid dynamics, which seeks to understand the motion of gases and liquids. Saturn's lack of a solid planetary surface (as on Earth, Mars or Venus) means that its atmosphere is free to flow around the planet essentially without obstruction. This is one factor that generates Saturn's pattern of alternating belts and zones -- one of the main features of its dynamic atmosphere. Winds in the belts blow at speeds different from those in the adjacent zones, leading to the formation of vortices along the boundaries between the two. And vigorous convection occasionally leads to storms and waves. Saturn's innermost rings are just visible at the bottom and in the upper left corner. This view is centered on clouds at 25 degrees north latitude on Saturn. The image was taken with the Cassini spacecraft wide-angle camera on July 20, 2016 using a spectral filter which preferentially admits wavelengths of near-infrared light centered at 728 nanometers. The view was obtained at a distance of approximately 752,000 miles (1.21 million kilometers) from Saturn and at a Sun-Saturn-spacecraft, or phase, angle of 6 degrees. Image scale is 45 miles (72 kilometers) per pixel. http://photojournal.jpl.nasa.gov/catalog/PIA20503
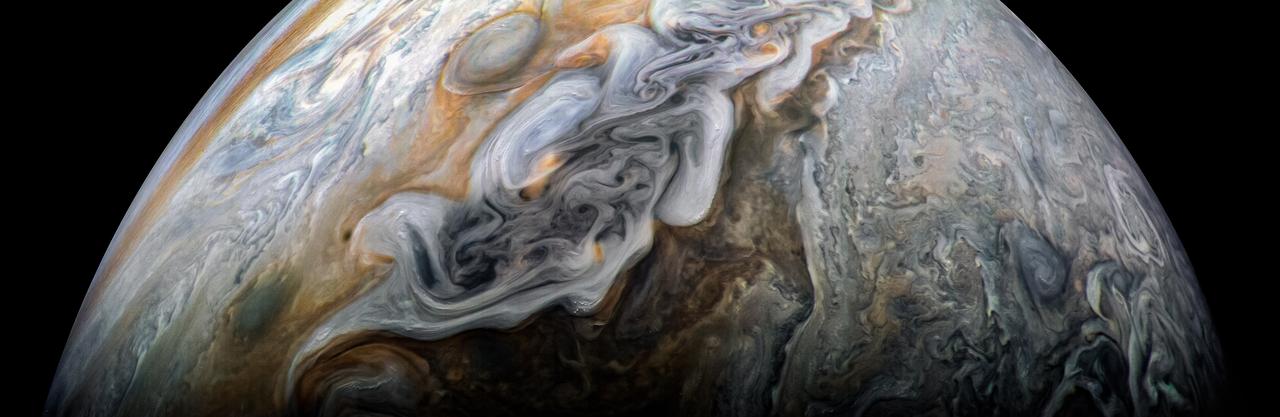
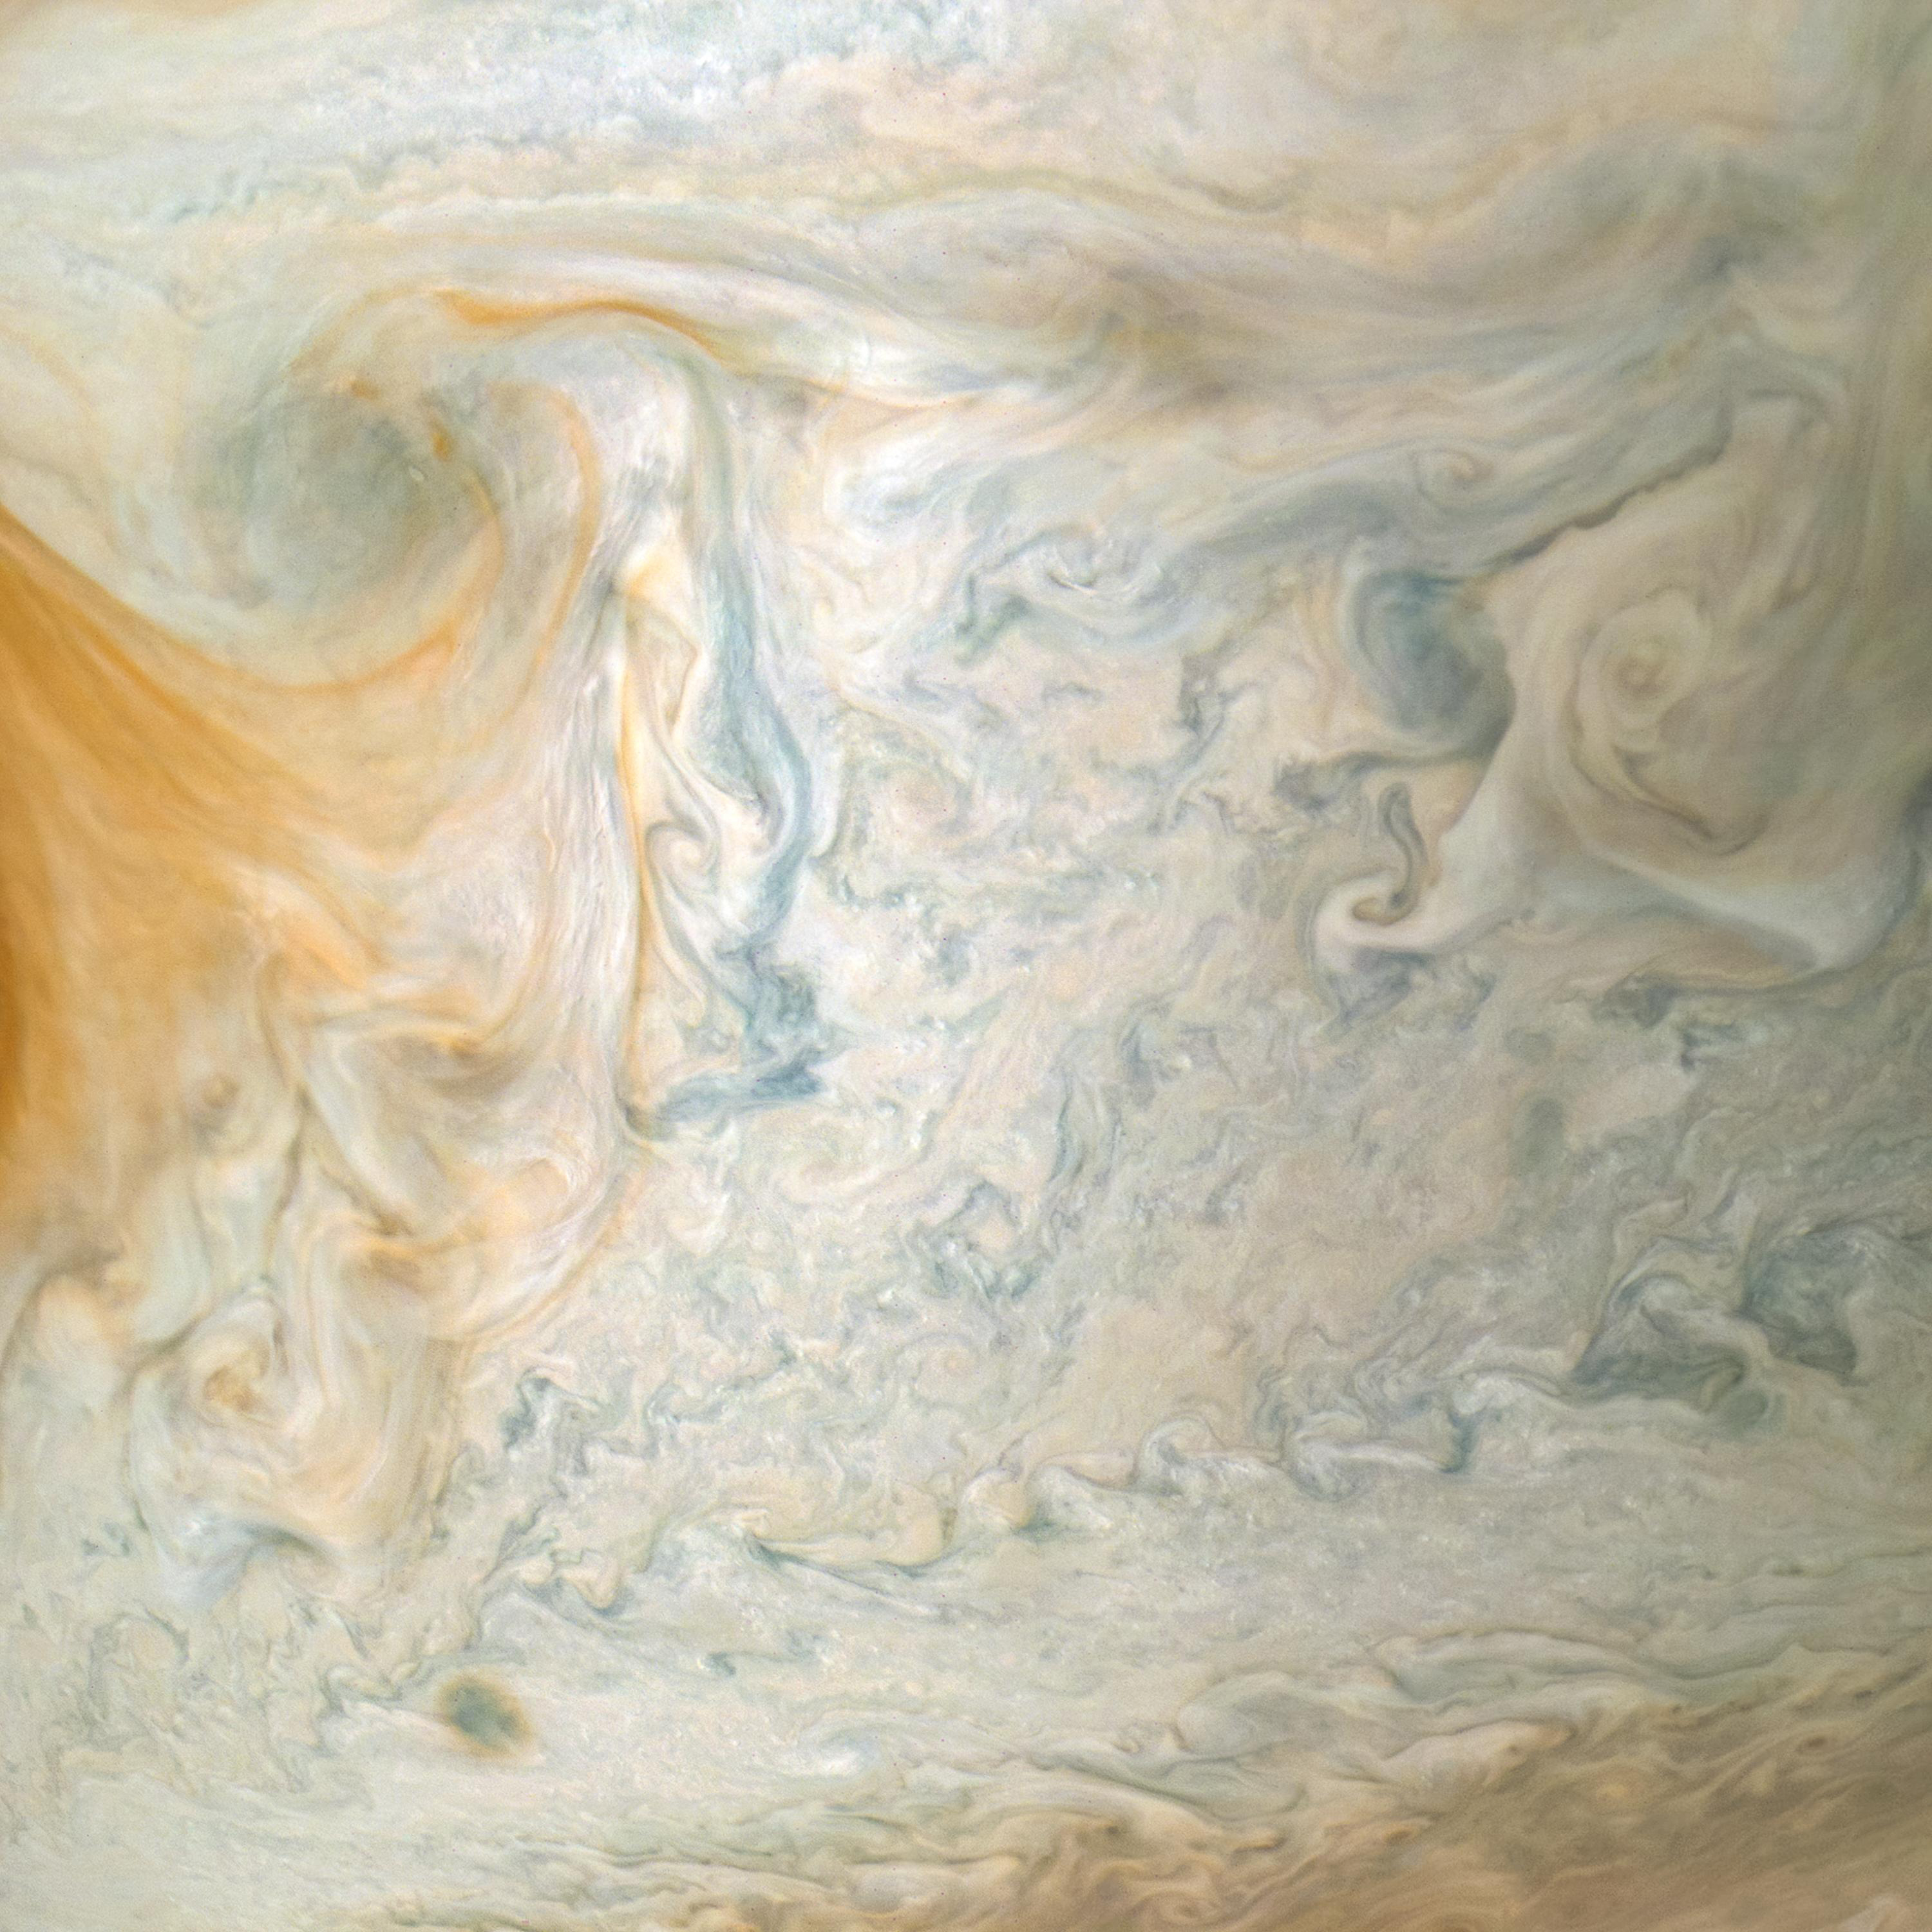
NASA's Juno spacecraft observed the complex colors and structure of Jupiter's clouds as it completed its 43rd close flyby of the giant planet on July 5, 2022. Citizen scientist Björn Jónsson created these two images using raw data from the JunoCam instrument aboard the spacecraft. At the time the raw image was taken, Juno was about 3,300 miles (5,300 kilometers) above Jupiter's cloud tops, at a latitude of about 50 degrees. North is up. At that moment, the spacecraft was traveling at about 130,000 mph (209,000 kilometers per hour) relative to the planet. The image was digitally processed to increase both the color saturation and contrast to sharpen small-scale features and to reduce compression artifacts and noise that typically appear in raw images. This clearly reveals some of the most intriguing aspects of Jupiter's atmosphere, including color variation that results from differing chemical composition, the three-dimensional nature of Jupiter's swirling vortices, and the small, bright "pop-up" clouds that form in the higher parts of the atmosphere. https://photojournal.jpl.nasa.gov/catalog/PIA25018
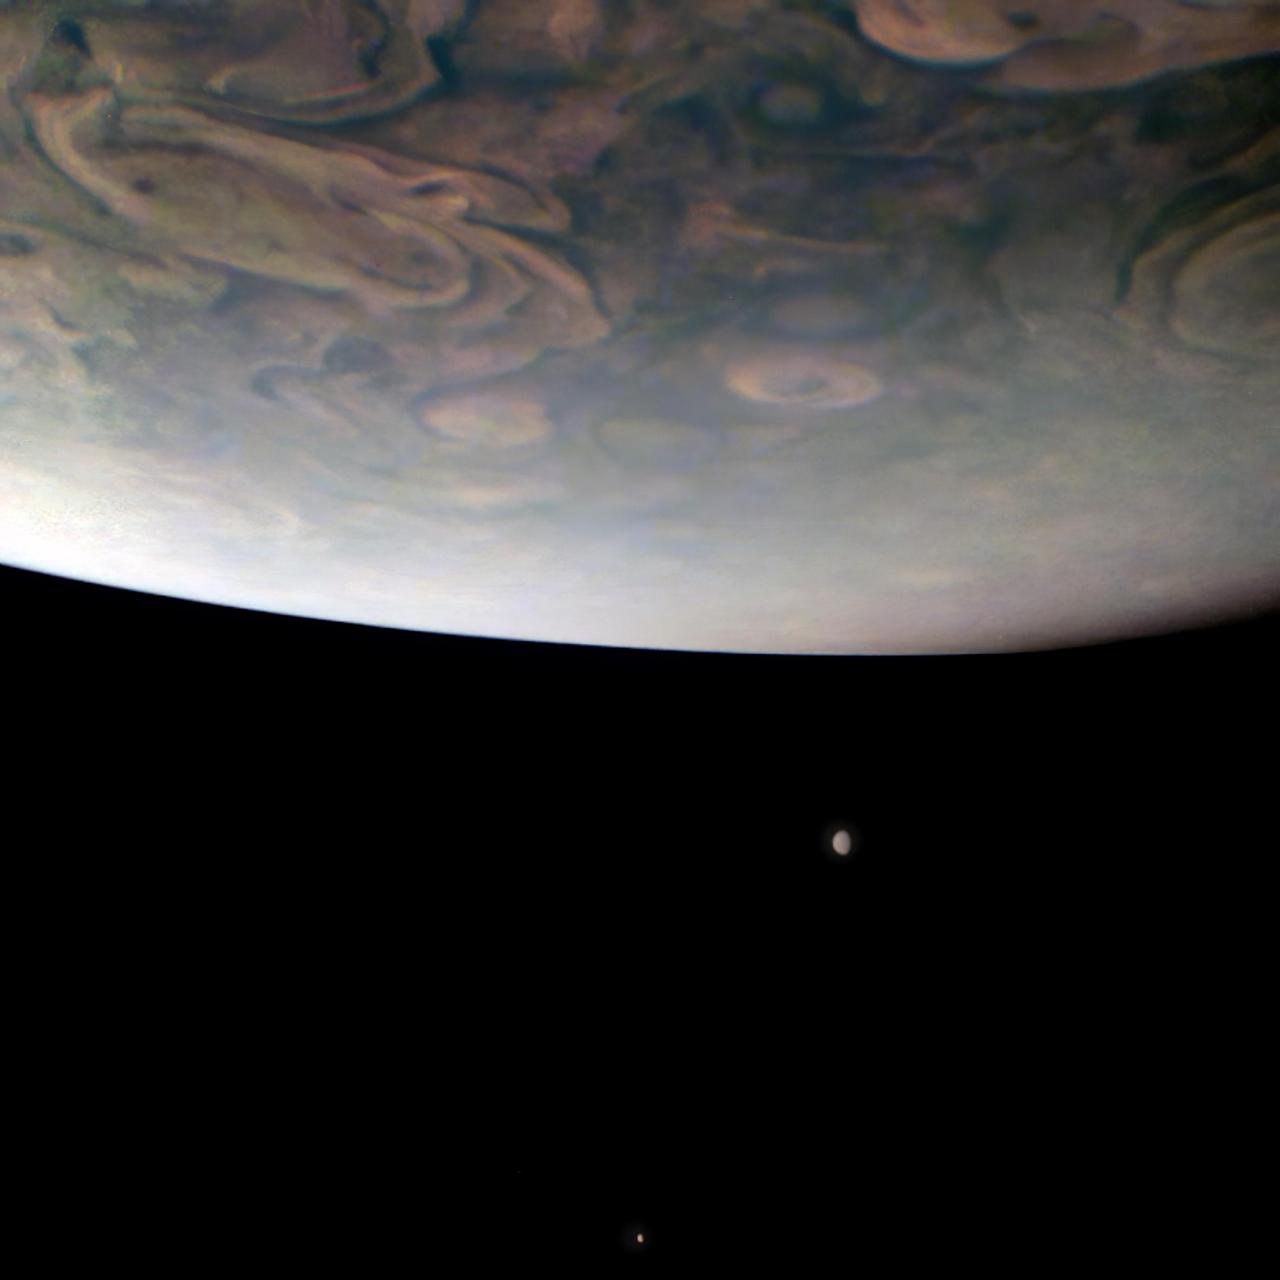
On Nov. 29, 2021, NASA's Juno mission completed its 38th close flyby of Jupiter. As the spacecraft sped low over the giant planet's cloud tops, its JunoCam instrument captured this look at two of Jupiter's largest moons. In the foreground, hurricane-like spiral wind patterns called vortices can be seen spinning in the planet's north polar region. These powerful storms can be over 30 miles (50 kilometers) in height and hundreds of miles across. Below Jupiter's curving horizon, two Jovian moons make an appearance: Callisto (below) and Io (above). Juno will make close flybys of Io in December 2023 and February 2024, the first such close encounters with this intriguing moon in over two decades. Io is the most volcanic body in our solar system, and its eruptions leave a trail of material behind that both fills Jupiter's magnetosphere and creates a torus of gas and dust around Jupiter. During the flybys, Juno will study Io's volcanoes and geology, search for signs of a magma ocean, and investigate how Io interacts with Jupiter's giant magnetosphere. Citizen scientist Gerald Eichstädt used raw JunoCam data to make the original version of this image, and then another citizen scientist, Thomas Thomopoulos, further processed it, zooming in and making color enhancements. In this view, north is down. At the time the image was taken, Juno was about 8,700 miles (14,000 kilometers) above Jupiter's cloud tops, at a latitude of about 69 degrees, traveling at a speed of about 123,000 mph (198,000 kilometers per hour) relative to the planet. https://photojournal.jpl.nasa.gov/catalog/PIA25019
The easternmost edge of Jupiter's Great Red Spot and surrounding south tropical disturbance are captured in this image from NASA's Juno spacecraft. At left, wispy tendrils from the Red Spot give the atmosphere a layered appearance as they partially obscure cloud features below. Jupiter's appearance is a tapestry of vivid colors and swirling atmospheric vortices. Many aspects of the planet's atmosphere are still a mystery. For example, the origin of individual storms or churning cloud features is unknown. By studying Jupiter's weather up close for the first time, Juno is helping researchers better understand how atmospheres work in general -- including our own. What we learn about Jupiter's atmosphere will also help scientists understand how gas-giant planets work in general, including those now being discovered beyond our solar system. This color-enhanced image was taken at 3:01 a.m. PDT on April 1, 2018 (6:01 a.m. EDT), as the spacecraft performed its 12th close flyby of Jupiter. At the time, Juno was about 7,900 miles (12,750 kilometers) from the planet's cloud tops, above a southern latitude of approximately 26 degrees. Citizen scientist Kevin M. Gill created this image using data from the spacecraft's JunoCam imager. https://photojournal.jpl.nasa.gov/catalog/PIA22429 . - Enhanced image by Kevin M. Gill (CC-BY) based on images provided courtesy of NASA/JPL-Caltech/SwRI/MSSS
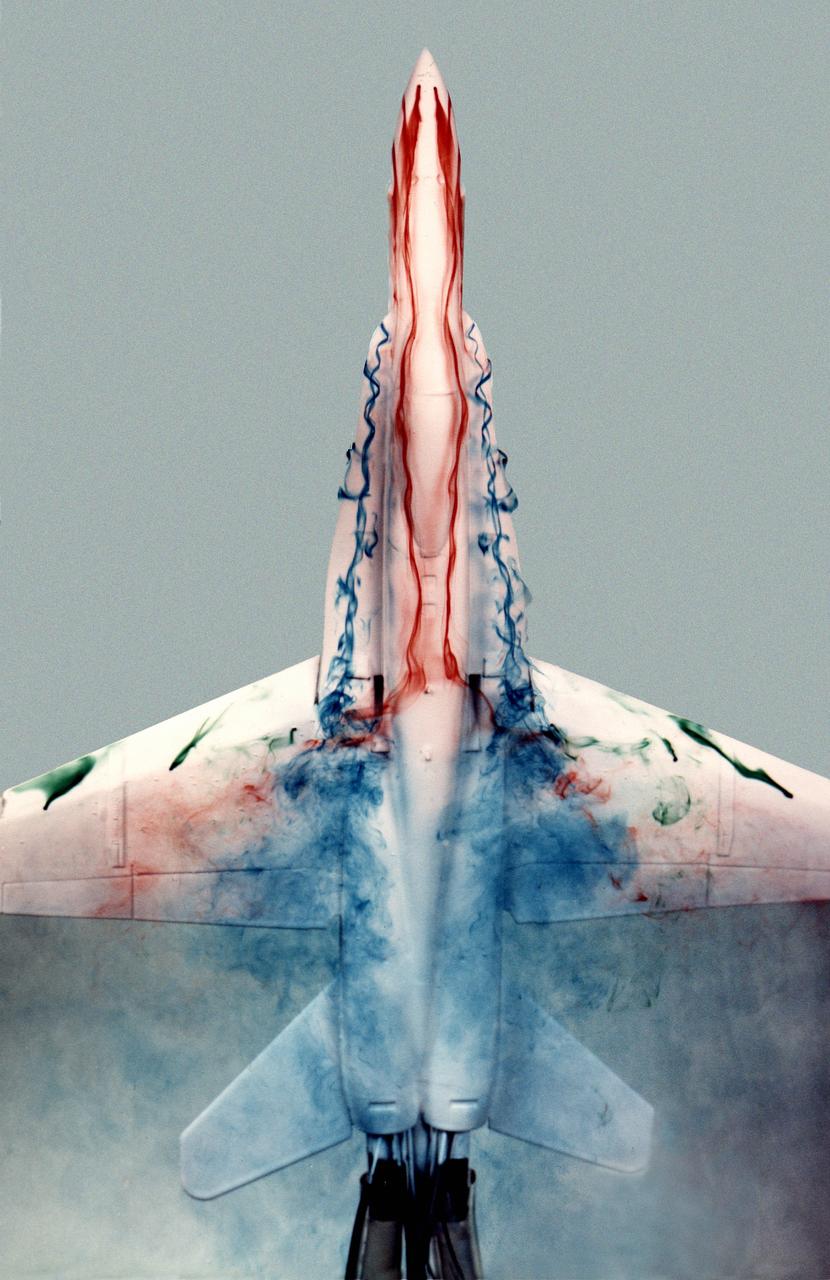
This image shows a plastic 1/48-scale model of an F-18 aircraft inside the "Water Tunnel" more formally known as the NASA Dryden Flow Visualization Facility. Water is pumped through the tunnel in the direction of normal airflow over the aircraft; then, colored dyes are pumped through tubes with needle valves. The dyes flow back along the airframe and over the airfoils highlighting their aerodynamic characteristics. The aircraft can also be moved through its pitch axis to observe airflow disruptions while simulating actual flight at high angles of attack. The Water Tunnel at NASA's Dryden Flight Research Center, Edwards, CA, became operational in 1983 when Dryden was a Flight Research Facility under the management of the Ames Research Center in Mountain View, CA. As a medium for visualizing fluid flow, water has played a significant role. Its use dates back to Leonardo da Vinci (1452-1519), the Renaissance Italian engineer, architect, painter, and sculptor. In more recent times, water tunnels have assisted the study of complex flows and flow-field interactions on aircraft shapes that generate strong vortex flows. Flow visualization in water tunnels assists in determining the strength of vortices, their location, and possible methods of controlling them. The design of the Dryden Water Tunnel imitated that of the Northrop Corporation's tunnel in Hawthorne, CA. Called the Flow Visualization Facility, the Dryden tunnel was built to assist researchers in understanding the aerodynamics of aircraft configured in such a way that they create strong vortex flows, particularly at high angles of attack. The tunnel provides results that compare well with data from aircraft in actual flight in another fluid-air. Other uses of the tunnel have included study of how such flight hardware as antennas, probes, pylons, parachutes, and experimental fixtures affect airflow. The facility has also been helpful in finding the best locations for emitting smoke from flight vehicles for flow vi
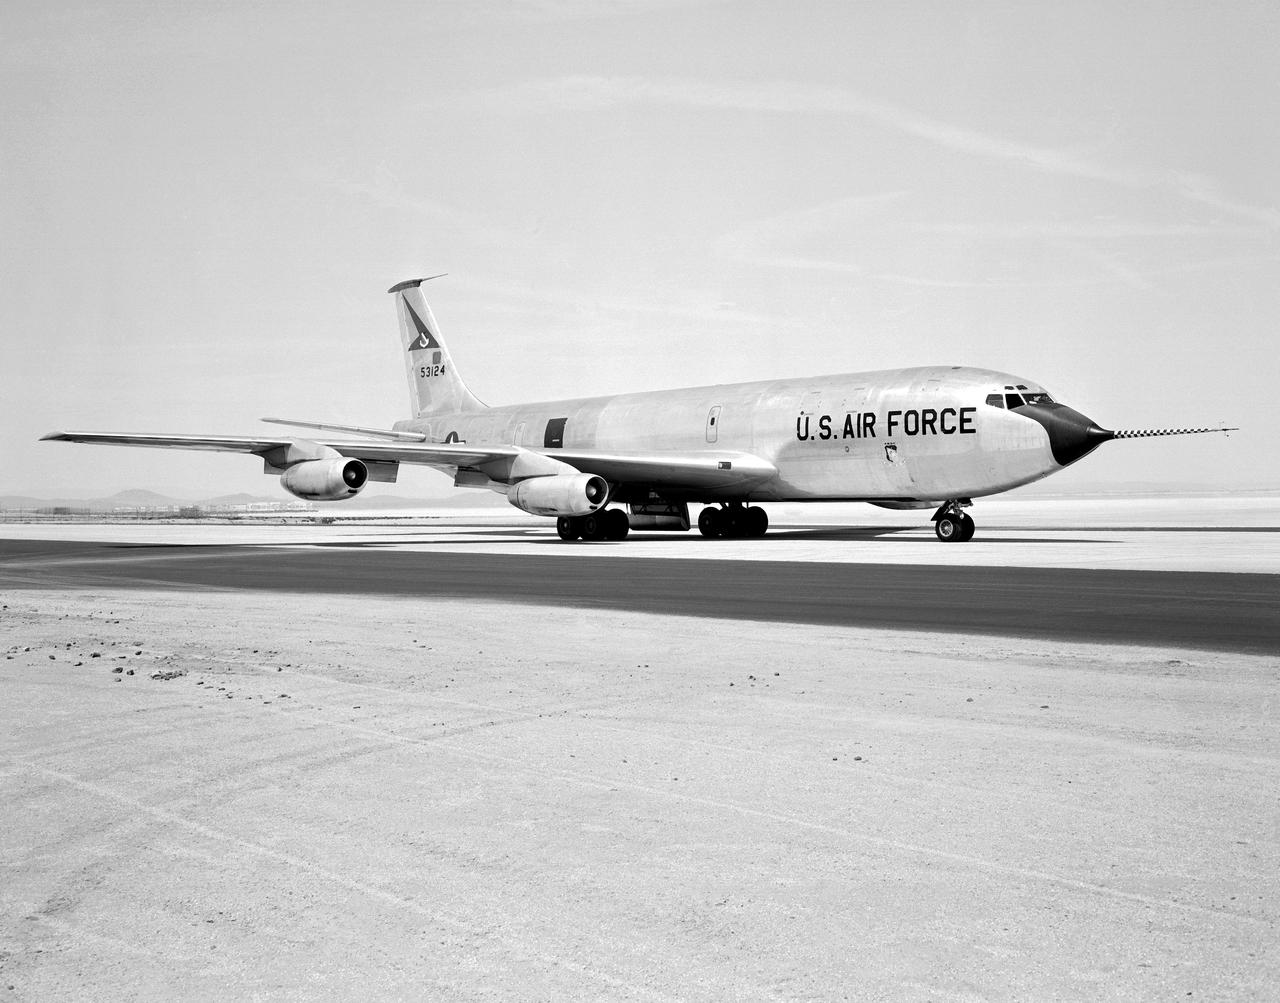
The Boeing KC-135 Stratotanker, besides being used extensively in its primary role as an inflight aircraft refueler, has assisted in several projects at the NASA Dryden Flight Research Center, Edwards, California. In 1957 and 1958, Dryden was asked by what was then the Civil Aeronautics Administration (later absorbed into the Federal Aviation Administration (FAA) in 1958) to help establish new approach procedure guidelines on cloud-ceiling and visibility minimums for Boeing's first jet airliner, the B-707. Dryden used a KC-135 (the military variant of the 707), seen here on the runway at Edwards Air Force Base, to aid the CAA in these tests. In 1979 and 1980, Dryden was again involved with general aviation research with the KC-135. This time, a special wingtip "winglet", developed by Richard Whitcomb of Langley Research Center, was tested on the jet aircraft. Winglets are small, nearly vertical fins installed on an airplane's wing tips to help produce a forward thrust in the vortices that typically swirl off the end of the wing, thereby reducing drag. This winglet idea was tested at the Dryden Flight Research Center on a KC-135A tanker loaned to NASA by the Air Force. The research showed that the winglets could increase an aircraft's range by as much as 7 percent at cruise speeds. The first application of NASA's winglet technology in industry was in general aviation business jets, but winglets are now being incorporated into most new commercial and military transport jets, including the Gulfstream III and IV business jets, the Boeing 747-400 and MD-11 airliners, and the C-17 military transport. In the 1980's, a KC-135 was used in support of the Space Shuttle program. Since the Shuttle was to be launched from Florida, researchers wanted to test the effect of rain on the sensitive thermal tiles. Tiles were mounted on special fixtures on an F-104 aircraft and a P-3 Orion. The F-104 was flown in actual rain conditions, and also behind the KC-135 spray tanker as it rel
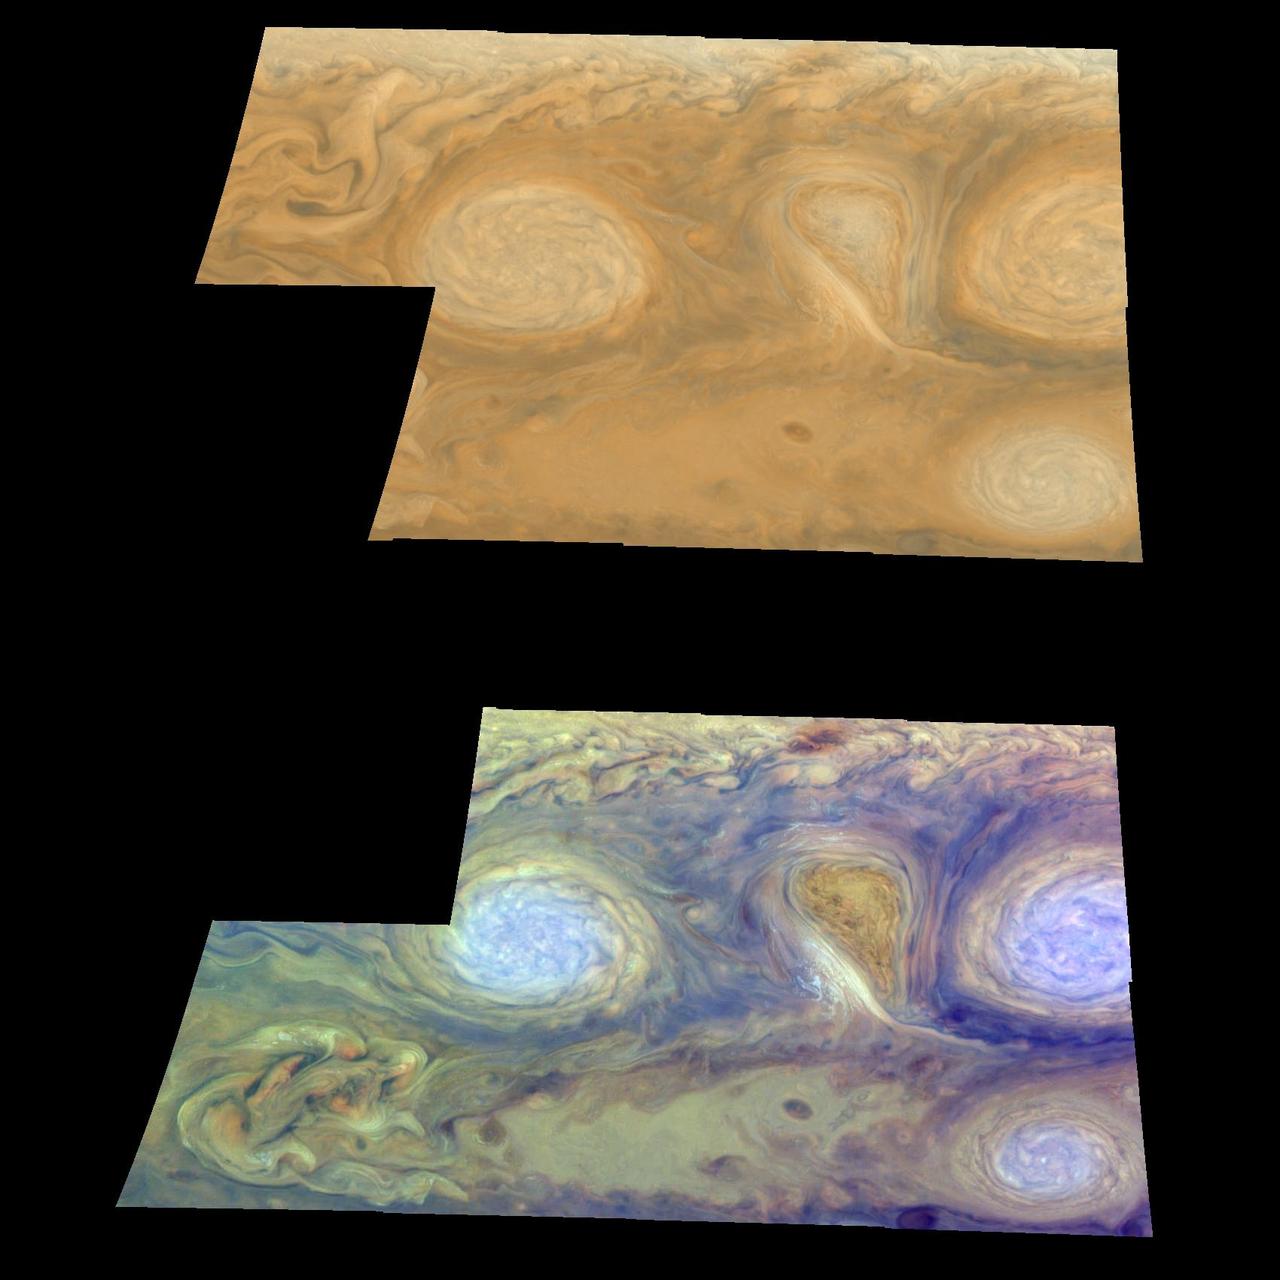
Oval cloud systems of this type are often associated with chaotic cyclonic systems such as the balloon-shaped vortex seen here between the well-formed ovals. This system is centered near 30 degrees south latitude relative to the center of the planet and 100 degrees west longitude, and rotates in a clockwise direction about its center. The oval shaped vortices in the upper half of the mosaic are two of the three long-lived white ovals that formed to the south of the Great Red Spot in the 1930's and, like the Great Red Spot, rotate in a counterclockwise sense. The east-to-west dimension of the left-most white oval is 9,000 kilometers (5,592 miles) across. For comparison, the diameter of Earth is 12,756 kilometers, or 7,928 miles. The white ovals drift in longitude relative to one another and are presently restricting the cyclonic structure. To the south, the smaller oval and its accompanying cyclonic system are moving eastward at about 0.4 degrees per day relative to the larger ovals. The interaction between these two cyclonic storm systems is producing high, thick cumulus-like clouds in the southern part of the more northerly trapped system. The top mosaic combines the violet (410 nanometers) and near infrared continuum (756 nanometers) filter images to create a mosaic similar to how Jupiter would appear to human eyes. Differences in coloration are due to the composition and abundance of trace chemicals in Jupiter's atmosphere. The lower mosaic uses the Galileo imaging camera's three near-infrared wavelengths (756 nanometers, 727 nanometers, and 889 nanometers displayed in red, green, and blue) to show variations in cloud height and thickness. Light blue clouds are high and thin, reddish clouds are deep, and white clouds are high and thick. The clouds and haze over the white ovals are high, extending into Jupiter's stratosphere. There is a lack of high haze over the cyclonic feature. Dark purple most likely represents a high haze overlying a clear deep atmosphere. Galileo is the first spacecraft to distinguish cloud layers on Jupiter. North is at the top of these mosaics. The smallest resolved features are tens of kilometers in size. These images were taken on February 19, 1997, at a range of 1.1 million kilometers (683,507 miles) by the solid state imaging (CCD) system aboard NASA's Galileo spacecraft. http://photojournal.jpl.nasa.gov/catalog/PIA00700
Hubble Catches Jupiter's Largest Moon Going to the 'Dark Side' HST/WFPC2 Image of Jupiter and Ganymede Taken April 9, 2007 NASA's Hubble Space Telescope has caught Jupiter's moon Ganymede playing a game of "peek-a-boo." In this crisp Hubble image, Ganymede is shown just before it ducks behind the giant planet. Ganymede completes an orbit around Jupiter every seven days. Because Ganymede's orbit is tilted nearly edge-on to Earth, it routinely can be seen passing in front of and disappearing behind its giant host, only to reemerge later. Composed of rock and ice, Ganymede is the largest moon in our solar system. It is even larger than the planet Mercury. But Ganymede looks like a dirty snowball next to Jupiter, the largest planet in our solar system. Jupiter is so big that only part of its Southern Hemisphere can be seen in this image. Hubble's view is so sharp that astronomers can see features on Ganymede's surface, most notably the white impact crater, Tros, and its system of rays, bright streaks of material blasted from the crater. Tros and its ray system are roughly the width of Arizona. The image also shows Jupiter's Great Red Spot, the large eye-shaped feature at upper left. A storm the size of two Earths, the Great Red Spot has been raging for more than 300 years. Hubble's sharp view of the gas giant planet also reveals the texture of the clouds in the Jovian atmosphere as well as various other storms and vortices. Astronomers use these images to study Jupiter's upper atmosphere. As Ganymede passes behind the giant planet, it reflects sunlight, which then passes through Jupiter's atmosphere. Imprinted on that light is information about the gas giant's atmosphere, which yields clues about the properties of Jupiter's high-altitude haze above the cloud tops. This color image was made from three images taken on April 9, 2007, with the Wide Field Planetary Camera 2 in red, green, and blue filters. The image shows Jupiter and Ganymede in close to natural colors. For additional information go to: <a href="http://hubblesite.org/newscenter/archive/releases/2008/42/" rel="nofollow">hubblesite.org/newscenter/archive/releases/2008/42/</a> Credit: NASA, ESA, and E. Karkoschka (University of Arizona) <b><a href="http://www.nasa.gov/audience/formedia/features/MP_Photo_Guidelines.html" rel="nofollow">NASA image use policy.</a></b> <b><a href="http://www.nasa.gov/centers/goddard/home/index.html" rel="nofollow">NASA Goddard Space Flight Center</a></b> enables NASA’s mission through four scientific endeavors: Earth Science, Heliophysics, Solar System Exploration, and Astrophysics. Goddard plays a leading role in NASA’s accomplishments by contributing compelling scientific knowledge to advance the Agency’s mission. <b>Follow us on <a href="http://twitter.com/NASAGoddardPix" rel="nofollow">Twitter</a></b> <b>Like us on <a href="http://www.facebook.com/pages/Greenbelt-MD/NASA-Goddard/395013845897?ref=tsd" rel="nofollow">Facebook</a></b> <b>Find us on <a href="http://instagram.com/nasagoddard?vm=grid" rel="nofollow">Instagram</a></b>

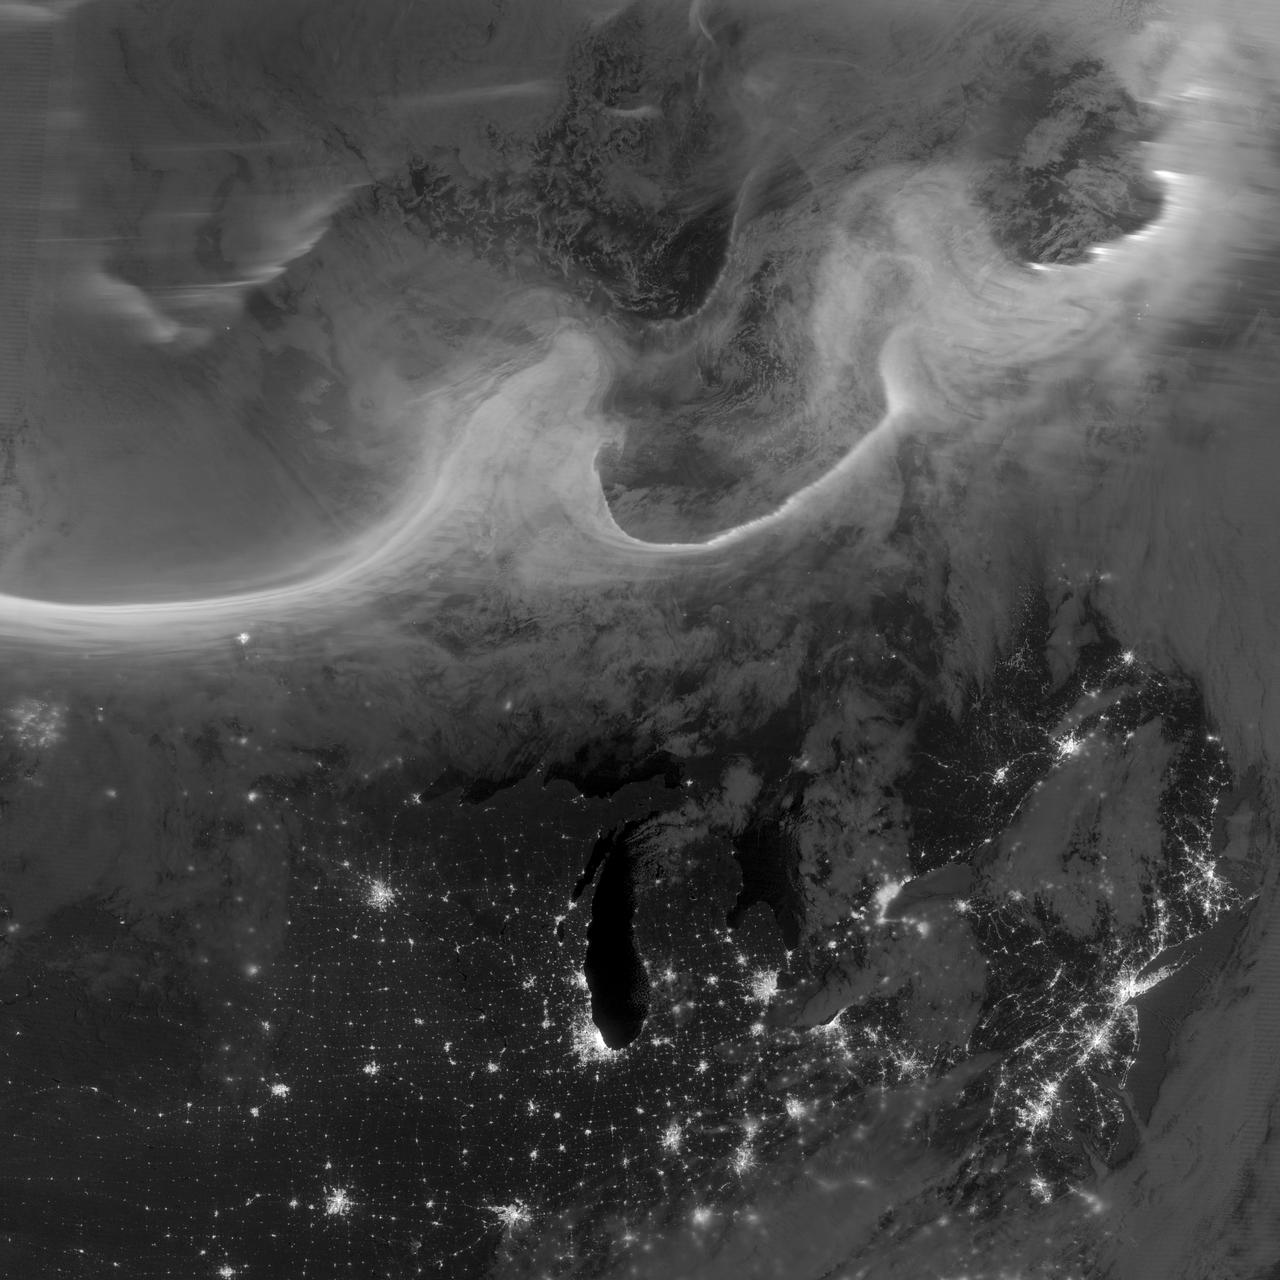
The Polar Vortex is a whirling and persistent large area of low pressure, found typically over both north and south poles. The northern Polar Vortex is pushing southward over western Wisconsin/eastern Minnesota today, Monday, January 6, 2014 and is bringing frigid temperatures to half of the continental United States. It is expected to move northward back over Canada toward the end of the week. This image was captured by NOAA's GOES-East satellite on January 6, 2014 at 1601 UTC/11:01 a.m. EST. A frontal system that brought rain to the coast is draped from north to south along the U.S. East Coast. Behind the front lies the clearer skies bitter cold air associated with the Polar Vortex. The GOES image also revealed snow on the ground in Minnesota, Wisconsin, Illinois, Indiana, Ohio, Michigan, Iowa and Missouri, stretching into the Great Plains. Cloudiness over Texas is associated with a low pressure system centered over western Oklahoma that is part of the cold front connected to the movement of the Polar Vortex. The GOES image was created at NASA's GOES Project, located at NASA's Goddard Space Flight Center in Greenbelt, Md. Both the northern and southern polar vortices are located in the middle and upper troposphere (lowest level of the atmosphere) and the stratosphere (next level up in the atmosphere). The polar vortex is a winter phenomenon. It develops and strengthens in its respective hemisphere's winter as the sun sets over the polar region and temperatures cool. They weaken in the summer. In the northern hemisphere, they circulate in a counter-clockwise direction, so the vortex sitting over western Wisconsin is sweeping in cold Arctic air around it. The Arctic Polar Vortex peaks in the Northern Hemisphere's wintertime and has already moved southward several times this winter. In the past, it has also moved southward over Europe.On January 21, 1985, the National Oceanic and Atmospheric Administration Daily Weather Map series showed a strong polar vortex centered over Maine. The Polar Vortex also affects ozone. For more information on the Polar Vortex and how it affects ozone, visit NASA's Ozone Watch page: <a href="http://ozonewatch.gsfc.nasa.gov/facts/vortex_NH.html" rel="nofollow">ozonewatch.gsfc.nasa.gov/facts/vortex_NH.html</a> Rob Gutro NASA's Goddard Space Flight Center <b><a href="http://goes.gsfc.nasa.gov/" rel="nofollow">Credit: NOAA/NASA GOES Project</a></b> <b><a href="http://www.nasa.gov/audience/formedia/features/MP_Photo_Guidelines.html" rel="nofollow">NASA image use policy.</a></b> <b><a href="http://www.nasa.gov/centers/goddard/home/index.html" rel="nofollow">NASA Goddard Space Flight Center</a></b> enables NASA’s mission through four scientific endeavors: Earth Science, Heliophysics, Solar System Exploration, and Astrophysics. Goddard plays a leading role in NASA’s accomplishments by contributing compelling scientific knowledge to advance the Agency’s mission. <b>Follow us on <a href="http://twitter.com/NASA_GoddardPix" rel="nofollow">Twitter</a></b> <b>Like us on <a href="http://www.facebook.com/pages/Greenbelt-MD/NASA-Goddard/395013845897?ref=tsd" rel="nofollow">Facebook</a></b> <b>Find us on <a href="http://instagram.com/nasagoddard?vm=grid" rel="nofollow">Instagram</a></b>
Overnight on October 4-5, 2012, a mass of energetic particles from the atmosphere of the Sun were flung out into space, a phenomenon known as a coronal mass ejection. Three days later, the storm from the Sun stirred up the magnetic field around Earth and produced gorgeous displays of northern lights. NASA satellites track such storms from their origin to their crossing of interplanetary space to their arrival in the atmosphere of Earth. Using the “day-night band” (DNB) of the Visible Infrared Imaging Radiometer Suite (VIIRS), the Suomi National Polar-orbiting Partnership (Suomi NPP) satellite acquired this view of the aurora borealis early on the morning of October 8, 2012. The northern lights stretch across Canada’s Quebec and Ontario provinces in the image, and are part of the auroral oval that expanded to middle latitudes because of a geomagnetic storm. The DNB sensor detects dim light signals such as auroras, airglow, gas flares, city lights, and reflected moonlight. In the case of the image above, the sensor detected the visible light emissions as energetic particles rained down from Earth’s magnetosphere and into the gases of the upper atmosphere. The images are similar to those collected by the Operational Linescan System flown on U.S. Defense Meteorological Satellite Program (DMSP) satellites for the past three decades. “When I first saw images like this as a graduate student, I was immediately struck by the fluid dynamic characteristics of the aurora,” said Tom Moore, a space physicist at NASA's Goddard Space Flight Center. “Viewing the aurora in this way makes it immediately clear that space weather is an interaction of fluids from the Sun with those of the Earth's upper atmosphere. The electrodynamics make for important differences between plasmas and ordinary fluids, but familiar behaviors (for example, waves and vortices) are still very apparent. It makes me wonder at the ability of apparently empty space to behave like a fluid.” Auroras typically occur when solar flares and coronal mass ejections—or even an active solar wind stream—disturb and distort the magnetosphere, the cocoon of space protected by Earth’s magnetic field. The collision of solar particles and pressure into our planet’s magnetosphere accelerates particles trapped in the space around Earth (such as in the radiation belts). Those particles are sent crashing down into Earth’s upper atmosphere—at altitudes of 100 to 400 kilometers (60 to 250 miles)—where they excite oxygen and nitrogen molecules and release photons of light. The results are rays, sheets, and curtains of dancing light in the sky. Auroras are a beautiful expression of the connection between Sun and Earth, but not all of the connections are benign. Auroras are connected to geomagnetic storms, which can distort radio communications (particularly high frequencies), disrupt electric power systems on the ground, and give slight but detectable doses of radiation to flight crews and passengers on high-latitude airplane flights and on spacecraft. The advantage of images like those from VIIRS and DMSP is resolution, according to space physicist Patrick Newell of the Johns Hopkins University Applied Physics Laboratory. “You can see very fine detail in the aurora because of the low altitude and the high resolution of the camera,” he said. Most aurora scientists prefer to use images from missions dedicated to aurora studies (such as Polar, IMAGE, and ground-based imagers), which can offer many more images of a storm (rather than one per orbit) and can allow researchers to calculate the energy moving through the atmosphere. There are no science satellites flying right now that provide such a view, though astronauts regularly photograph and film auroras from the International Space Station. NASA Earth Observatory image by Jesse Allen and Robert Simmon, using VIIRS Day-Night Band data from the Suomi National Polar-orbiting Partnership (Suomi NPP) and the University of Wisconsin's Community Satellite Processing Package. Suomi NPP is the result of a partnership between NASA, the National Oceanic and Atmospheric Administration, and the Department of Defense. Caption by Mike Carlowicz. Instrument: Suomi NPP - VIIRS Credit: <b><a href="http://www.earthobservatory.nasa.gov/" rel="nofollow"> NASA Earth Observatory</a></b> <b><a href="http://www.nasa.gov/audience/formedia/features/MP_Photo_Guidelines.html" rel="nofollow">NASA image use policy.</a></b> <b><a href="http://www.nasa.gov/centers/goddard/home/index.html" rel="nofollow">NASA Goddard Space Flight Center</a></b> enables NASA’s mission through four scientific endeavors: Earth Science, Heliophysics, Solar System Exploration, and Astrophysics. Goddard plays a leading role in NASA’s accomplishments by contributing compelling scientific knowledge to advance the Agency’s mission. <b>Follow us on <a href="http://twitter.com/NASA_GoddardPix" rel="nofollow">Twitter</a></b> <b>Like us on <a href="http://www.facebook.com/pages/Greenbelt-MD/NASA-Goddard/395013845897?ref=tsd" rel="nofollow">Facebook</a></b> <b>Find us on <a href="http://instagrid.me/nasagoddard/?vm=grid" rel="nofollow">Instagram</a></b>