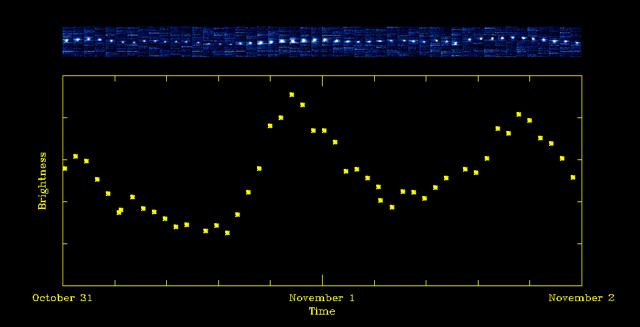
The upper panel of this figure shows small images of comet Hartley 2 taken by NASA EPOXI mission over time. The lower panel is a graph showing the variation of total brightness, and the variation of the total amount of carbon dioxide, during the time.