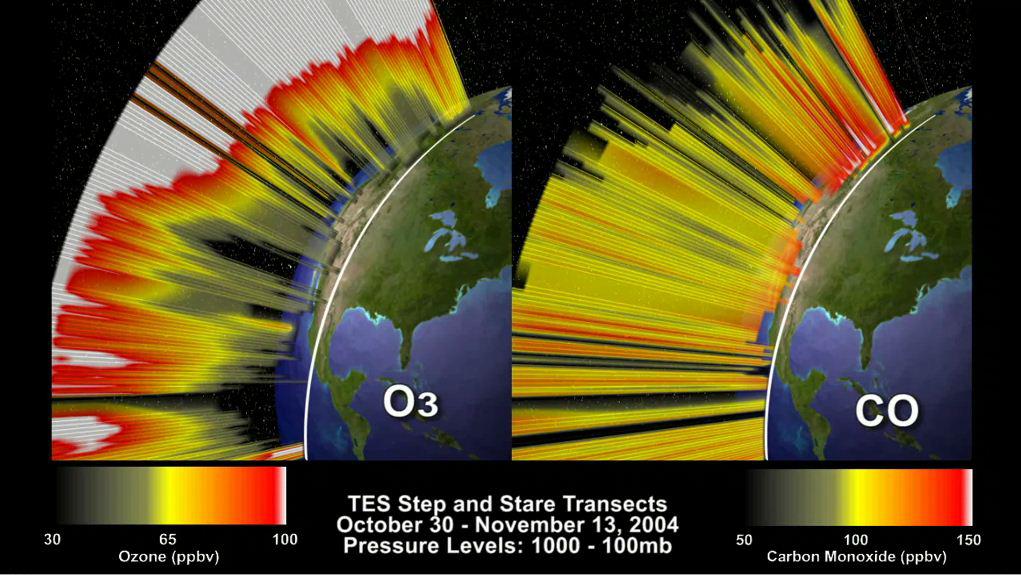
This frame from an animation depicts the distribution of O3 and CO in the atmosphere over North America. This visualization is based on data acquired by NASA Tropospheric Emission Spectrometer TES.