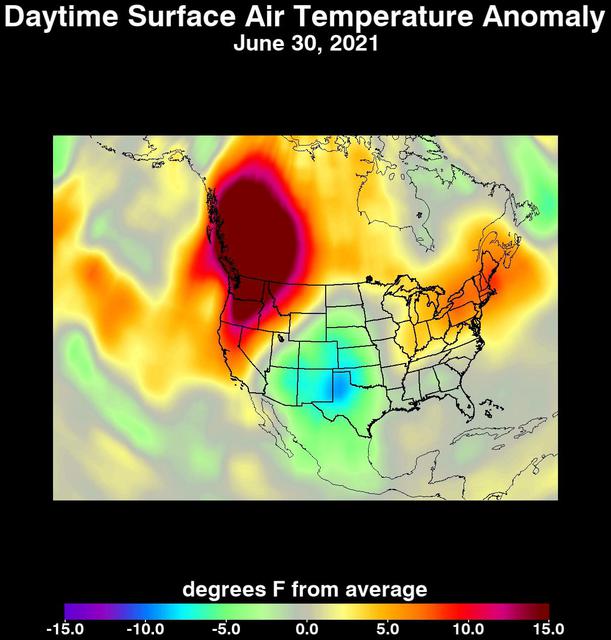
An unprecedented heat wave that started around June 26, 2021, smashed numerous all-time temperature records in the Pacific Northwest and western Canada. NASA's Atmospheric Infrared Sounder (AIRS), aboard the Aqua satellite, captured the progression of this slow-moving heat dome across the region from June 21 to 30. This animation of AIRS data shows surface air temperature anomalies, or values above or below long-term averages. Surface air temperature is something that people directly feel when they are outside. Some of the temperature anomalies were greater than 20 degrees Fahrenheit above the long-term average. On June 28, Quillayute, Washington, set an all-time high temperature record of 110 degrees Fahrenheit (43 degrees Celsius), shattering the old record of 99 degrees Fahrenheit (37 degrees Celsius). In British Columbia, the village of Lytton set a new all-time record for Canada at 119 degrees Fahrenheit (48 degrees Celsius) on June 29, only to break it the next day with a reading of 121 degrees Fahrenheit (49 degrees Celsius). The AIRS instrument recorded similar temperature anomalies at an altitude of about 10,000 feet (3,000 meters), showing that the extreme heat also affected mountainous regions. And temperature anomalies at roughly 18,000 feet (5,500 meters) demonstrated that the heat dome extended high into Earth's troposphere, creating the conditions for intense heat at the planet's surface that are normally found further south. Animation available at https://photojournal.jpl.nasa.gov/catalog/PIA24537
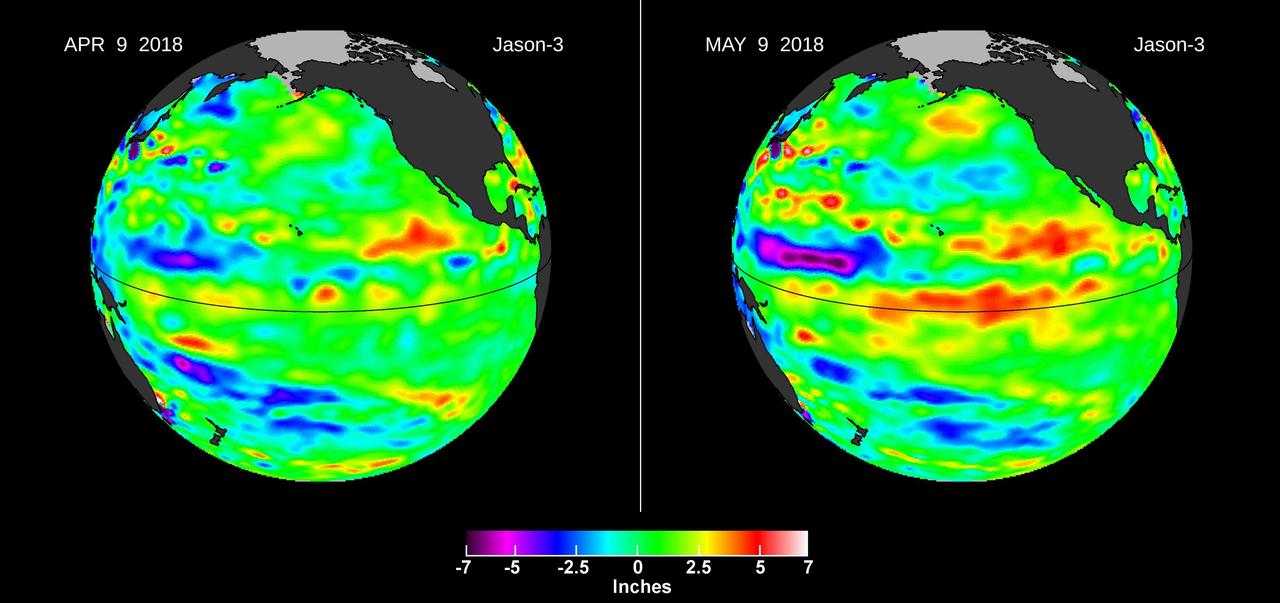
Images from the U.S./European Jason-3 satellite show sea surface height with respect to the seasonal cycle and the long-term trend. Blue/magenta colors indicate lower-than-normal sea levels, while yellow/red colors indicate higher-than-normal sea levels. The April 9, 2018 image (left panel) shows most of the ocean at neutral heights (green). A month later (right panel), a red patch is visible along the equator in the Central Pacific. The red area is a downwelling Kelvin wave, traveling eastward along the equator. https://photojournal.jpl.nasa.gov/catalog/PIA22473
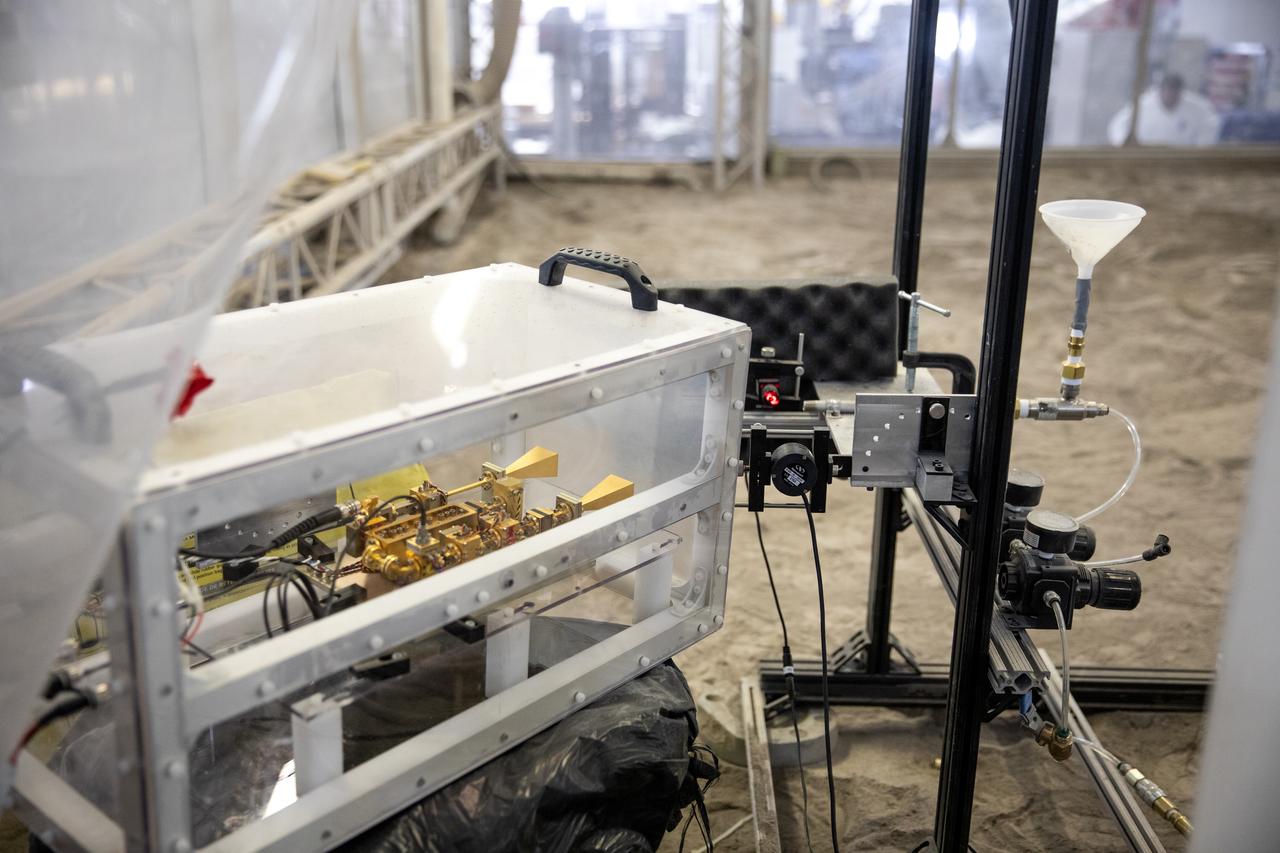
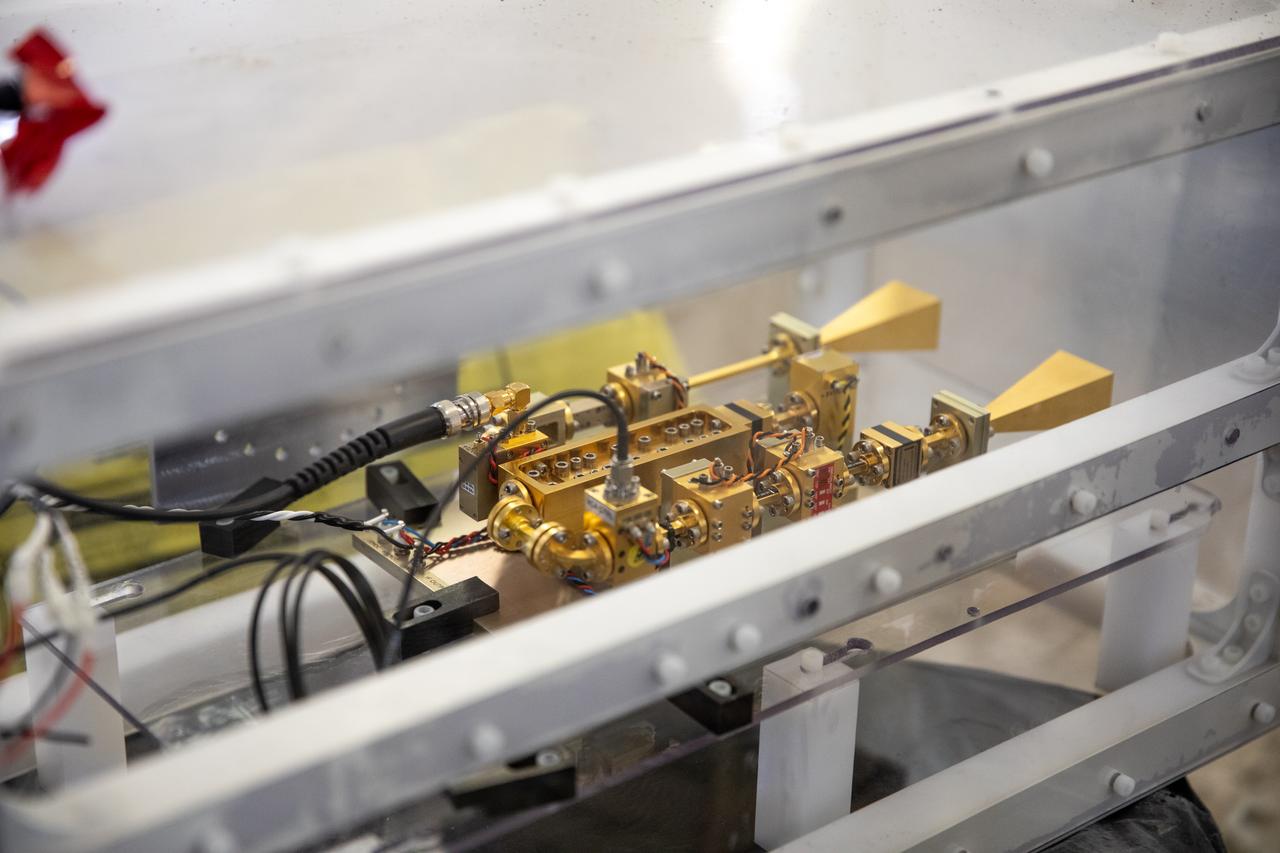
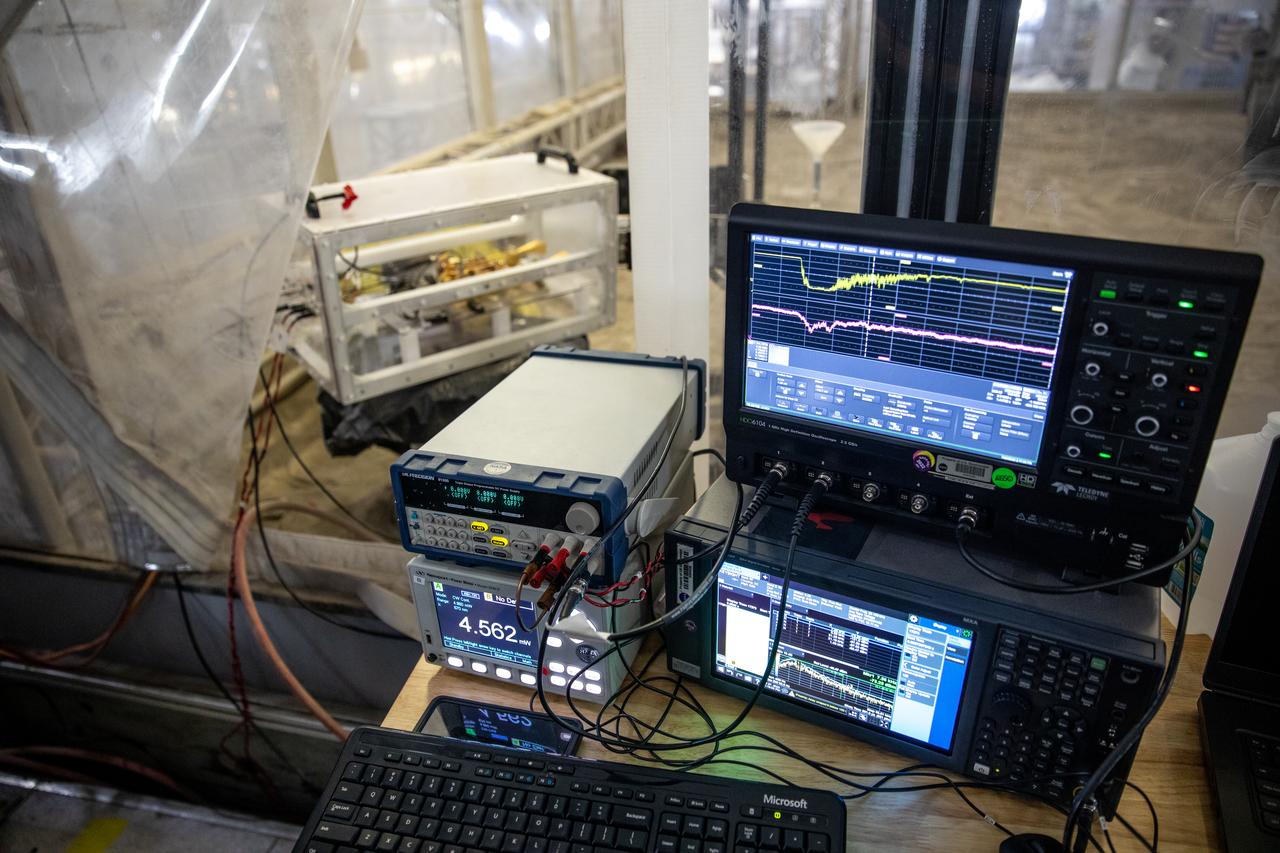
A team at NASA’s Kennedy Space Center in Florida assesses the Dust Concentration Monitor and the Millimeter Wave Doppler Radar inside a regolith bin at the Granular Mechanics and Regolith Operations (GMRO) lab at the spaceport’s Swamp Works on July 28, 2022, as part of Plume Surface Interaction (PSI) Instrumentation testing. The PSI Project is advancing both modeling and testing capabilities to understand exactly how rocket exhaust plumes affect a planetary landing site. This advanced modeling will help engineers evaluate the risks of various plumes on planetary surfaces, which will help them more accurately design landers for particular locations.
The Dust Concentration Monitor and the Millimeter Wave Doppler Radar undergo testing inside a regolith bin at the Granular Mechanics and Regolith Operations (GMRO) lab at the Kennedy Space Center’s Swamp Works on July 28, 2022, as part of Plume Surface Interaction (PSI) Instrumentation testing. The PSI Project is advancing both modeling and testing capabilities to understand exactly how rocket exhaust plumes affect a planetary landing site. This advanced modeling will help engineers evaluate the risks of various plumes on planetary surfaces, which will help them more accurately design landers for particular locations.
A team at NASA’s Kennedy Space Center in Florida assesses the Dust Concentration Monitor and the Millimeter Wave Doppler Radar inside a regolith bin at the Granular Mechanics and Regolith Operations (GMRO) lab at the spaceport’s Swamp Works on July 28, 2022, as part of Plume Surface Interaction (PSI) Instrumentation testing. The PSI Project is advancing both modeling and testing capabilities to understand exactly how rocket exhaust plumes affect a planetary landing site. This advanced modeling will help engineers evaluate the risks of various plumes on planetary surfaces, which will help them more accurately design landers for particular locations.
A team at NASA’s Kennedy Space Center in Florida assesses the Dust Concentration Monitor and the Millimeter Wave Doppler Radar inside a regolith bin at the Granular Mechanics and Regolith Operations (GMRO) lab at the spaceport’s Swamp Works on July 28, 2022, as part of Plume Surface Interaction (PSI) Instrumentation testing. The PSI Project is advancing both modeling and testing capabilities to understand exactly how rocket exhaust plumes affect a planetary landing site. This advanced modeling will help engineers evaluate the risks of various plumes on planetary surfaces, which will help them more accurately design landers for particular locations.

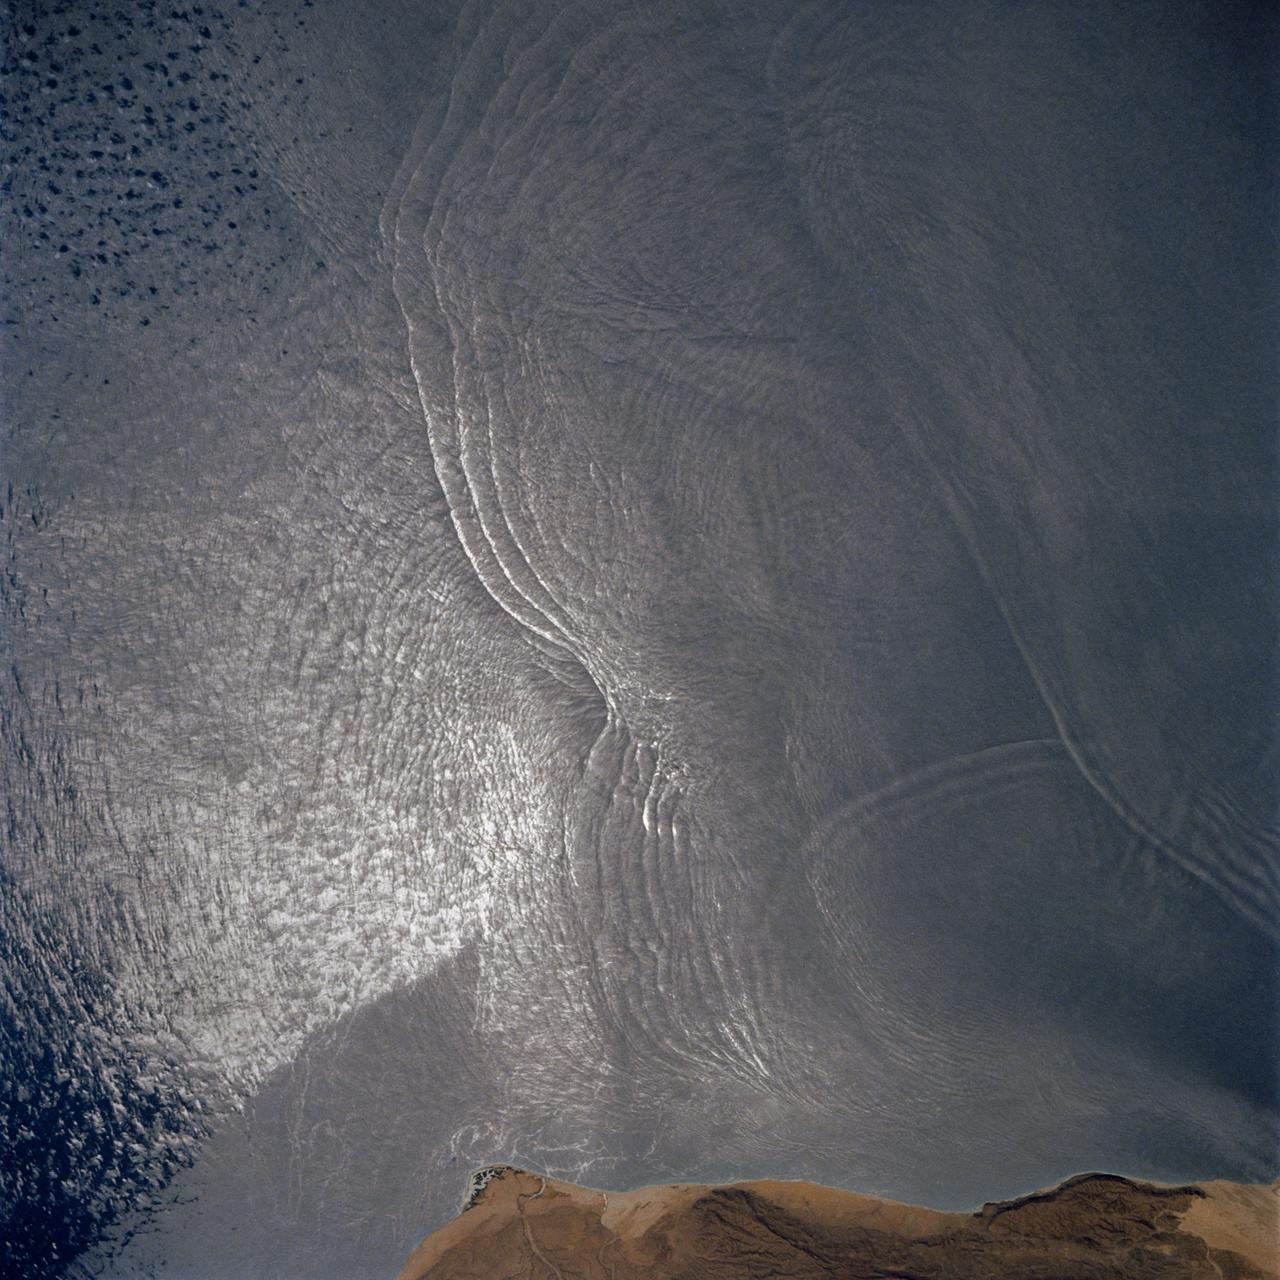
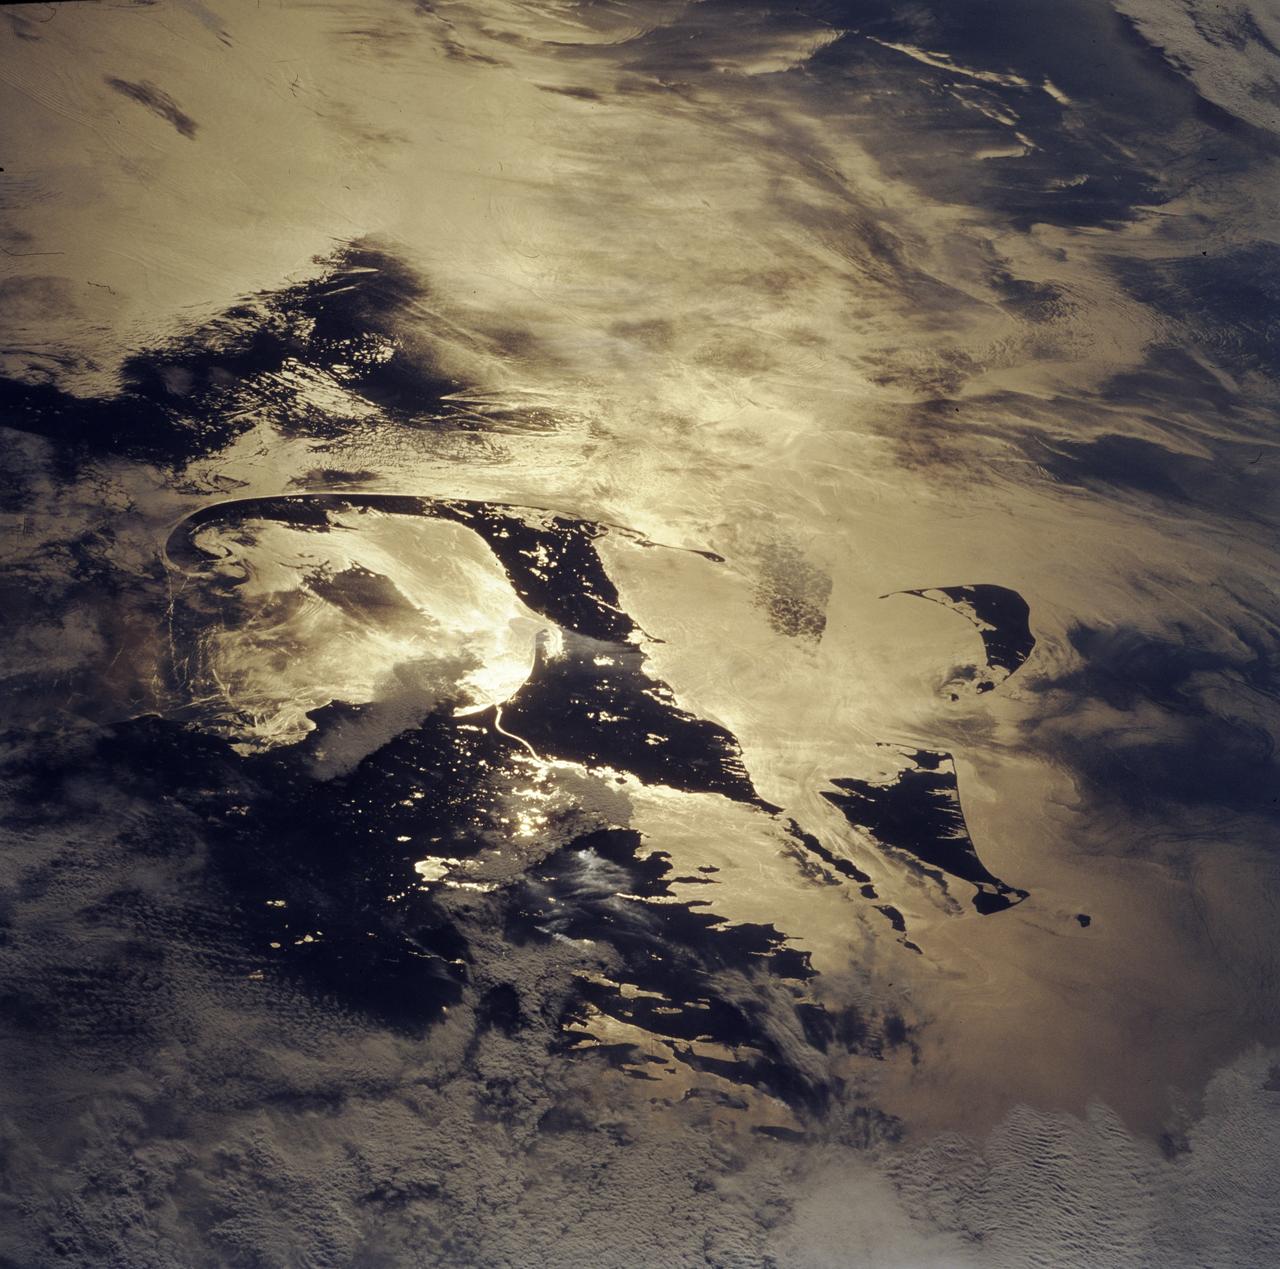
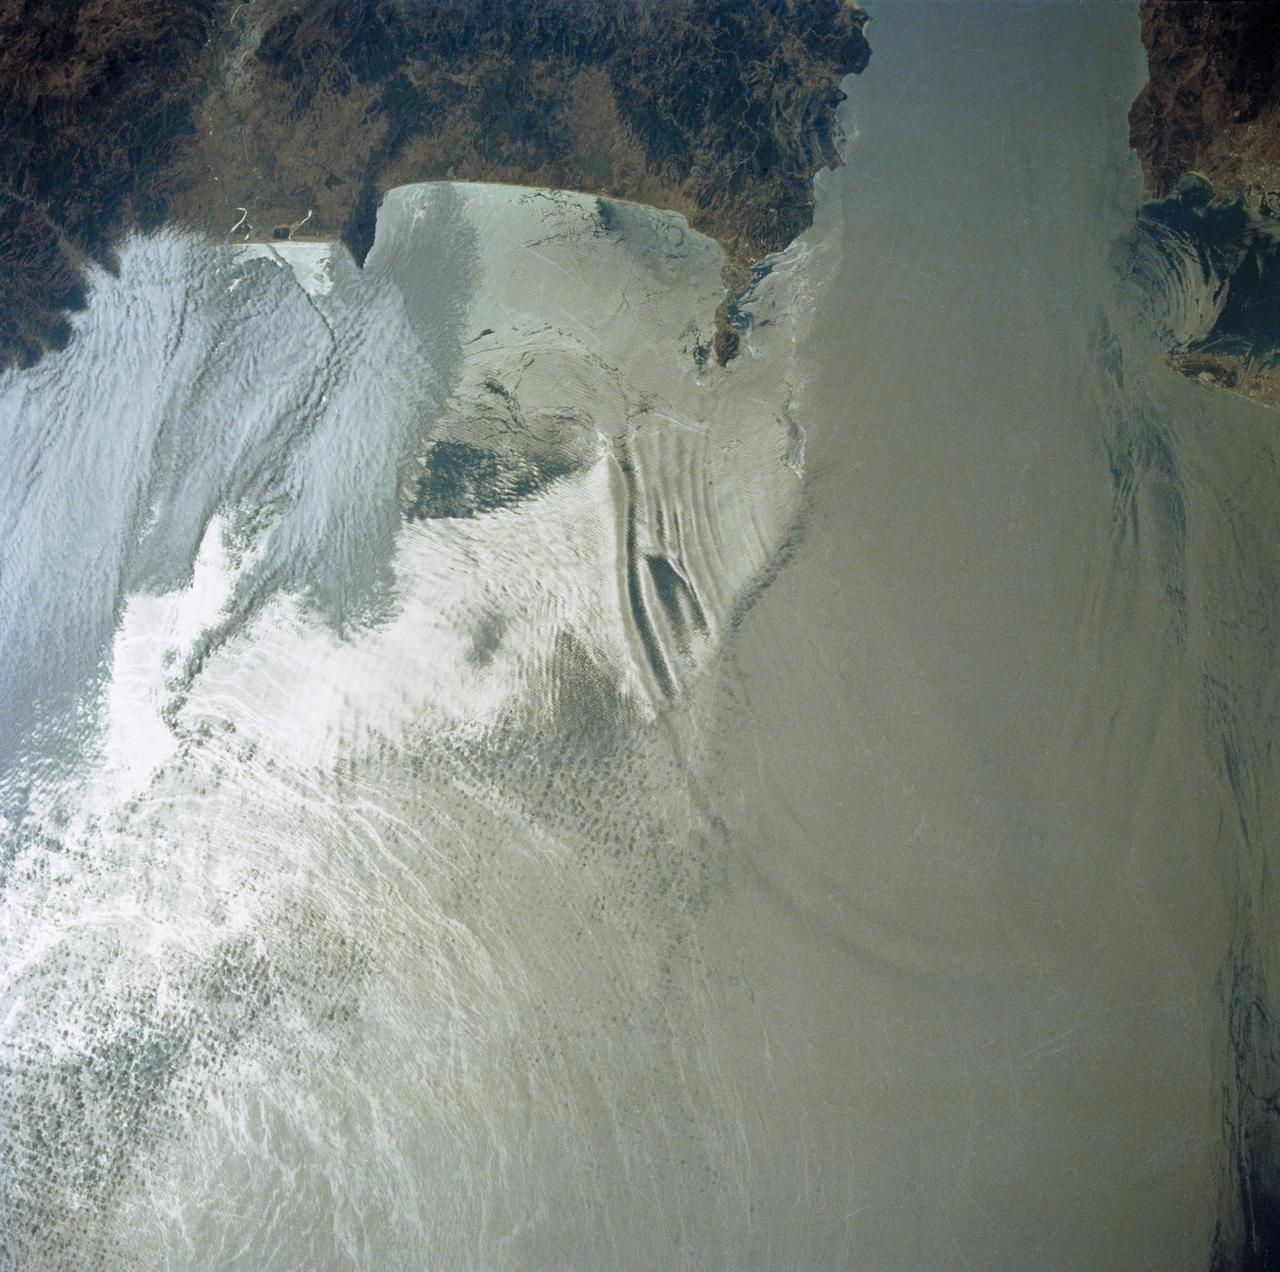
STS054-72-056 (13-19 Jan 1993) --- A ship wake in the Bay of Bengal is noticeable in this 70mm frame. The sun glint pattern on the ocean reveals many patterns of sea surface roughness related to currents, waves, wind roughening, and biology that and are not apparent when the ocean is viewed away from the Sun's reflection. In this view of the Bay of Bengal, southeast of Madras, India, sun glint highlights convergence zones between ocean currents (bright, linear features), a eddy, and the wake of a ship. In several locations where the ship has passed areas of current shear, the ship wake is distorted, indicating the relative current direction.
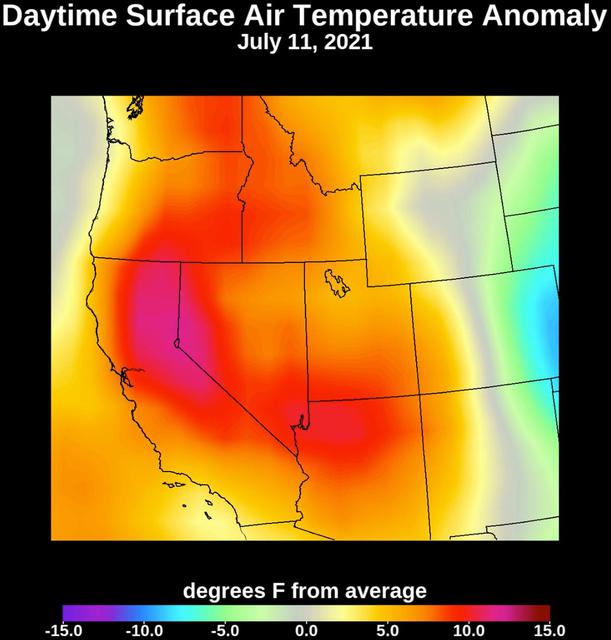
Collecting temperature readings in the atmosphere and at the surface, NASA's Atmospheric Infrared Sounder (AIRS) instrument aboard the agency's Aqua satellite captured the progression of a slow-moving heat dome across the southwestern U.S. from July 1 to July 12, 2021. The animation of the AIRS data shows surface air temperature anomalies – values above or below long-term averages. The hottest areas, shown in pink, experienced surface air temperatures more than 10 degrees Fahrenheit (5.6 degrees Celsius) above average. Surface air temperature is something that people directly feel when they are outside. Animation available at https://photojournal.jpl.nasa.gov/catalog/PIA23693
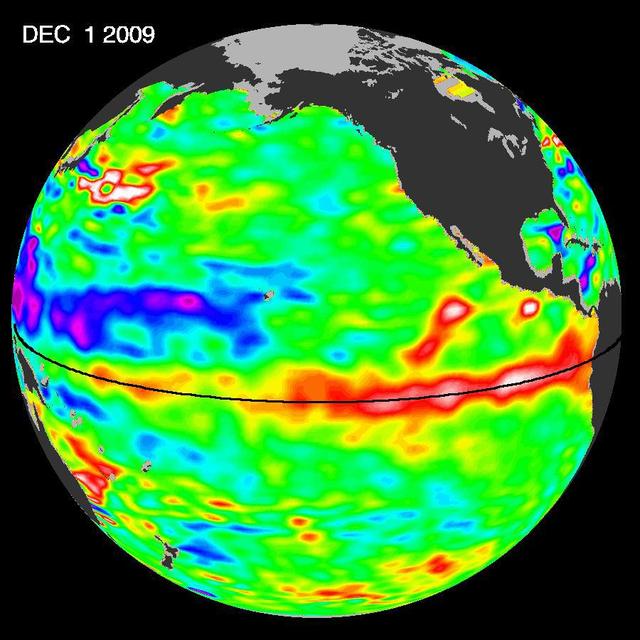
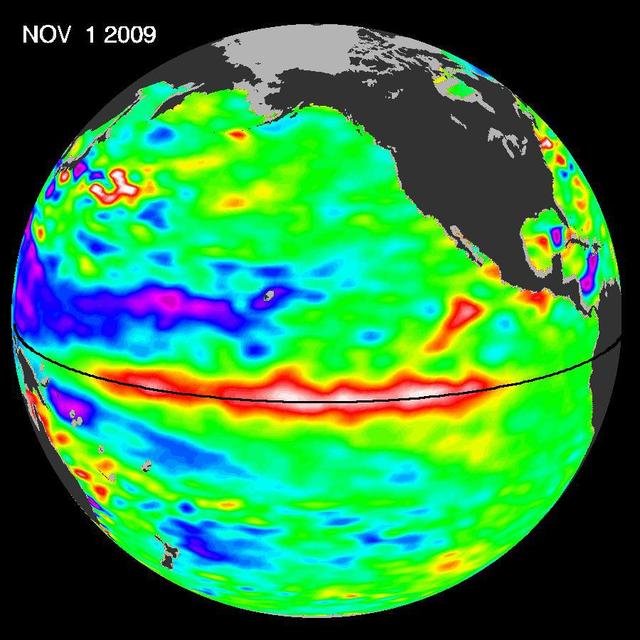
The most recent sea-level height data from the NASA/European Ocean Surface Topography Mission/Jason-2 oceanography satellite show the continued eastward progression of a strong wave of warm water, known as a Kelvin wave, now approaching South America.
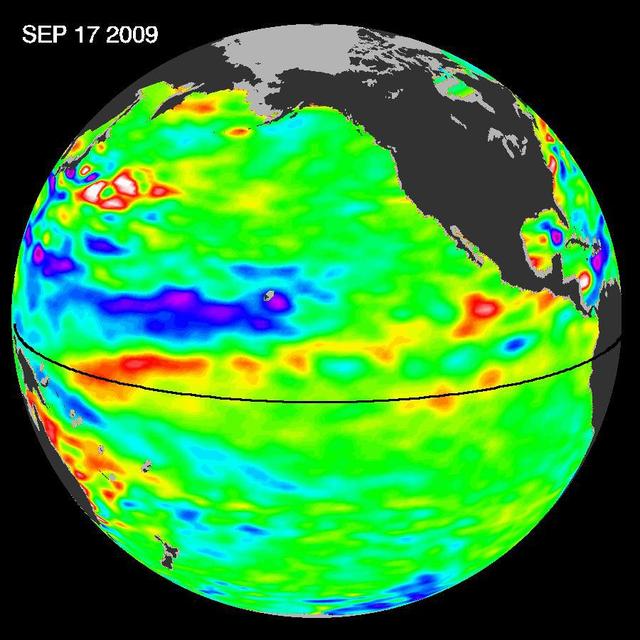
Pools of warm water known as Kelvin waves can be seen traveling eastward along the equator black line in this image from the NASA/French Space Agency Ocean Surface Topography Mission/Jason-2 satellite.
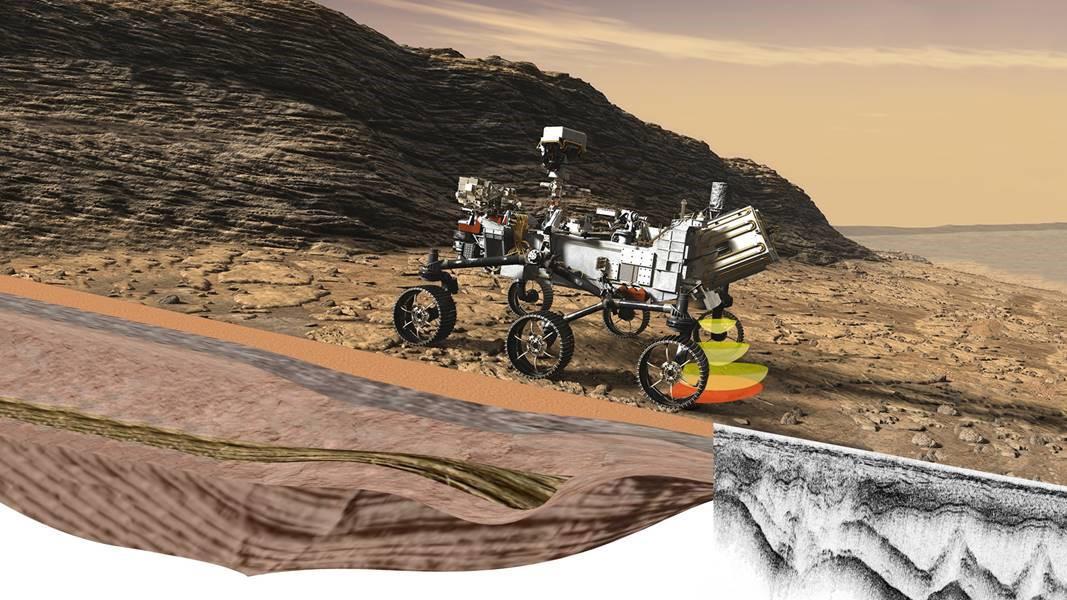
Perseverance's Radar Imager for Mars' Subsurface Experiment (RIMFAX) uses radar waves to probe the ground, revealing the unexplored world that lies beneath the Martian surface. The first ground-penetrating radar set on the surface of Mars, RIMFAX can provide a highly detailed view of subsurface structures down to at least 30 feet (10 meters) underground. In doing so, the instrument will reveal hidden layers of geology and help find clues to past environments on Mars, especially those with conditions necessary for supporting life. https://photojournal.jpl.nasa.gov/catalog/PIA24047
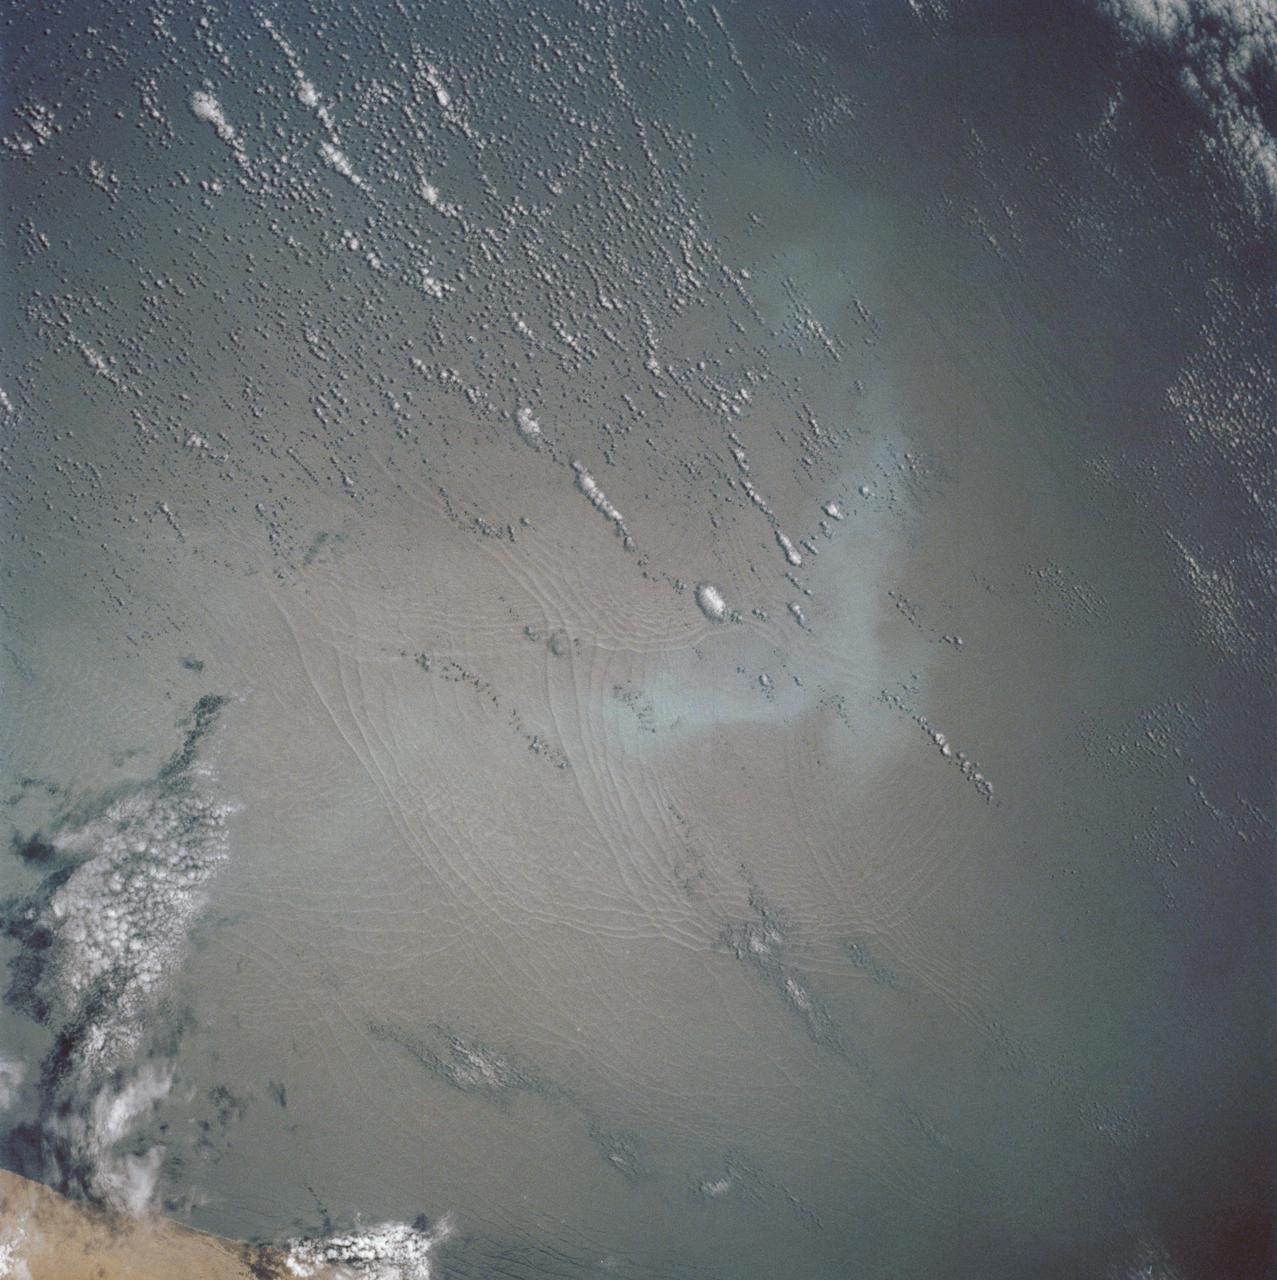
These open ocean Internal Waves were seen off the Namibia Coast, Africa (19.5S, 11.5E). The periodic and regularly spaced sets of incoming internal appear to be diffracting against the coastline and recombining to form a network of interference patterns. They seem to coincide with tidal periods about 12 hours apart and wave length (distance from crest to crest) varies between 1.5 and 5.0 miles and the crest lengths stretch beyond the image.
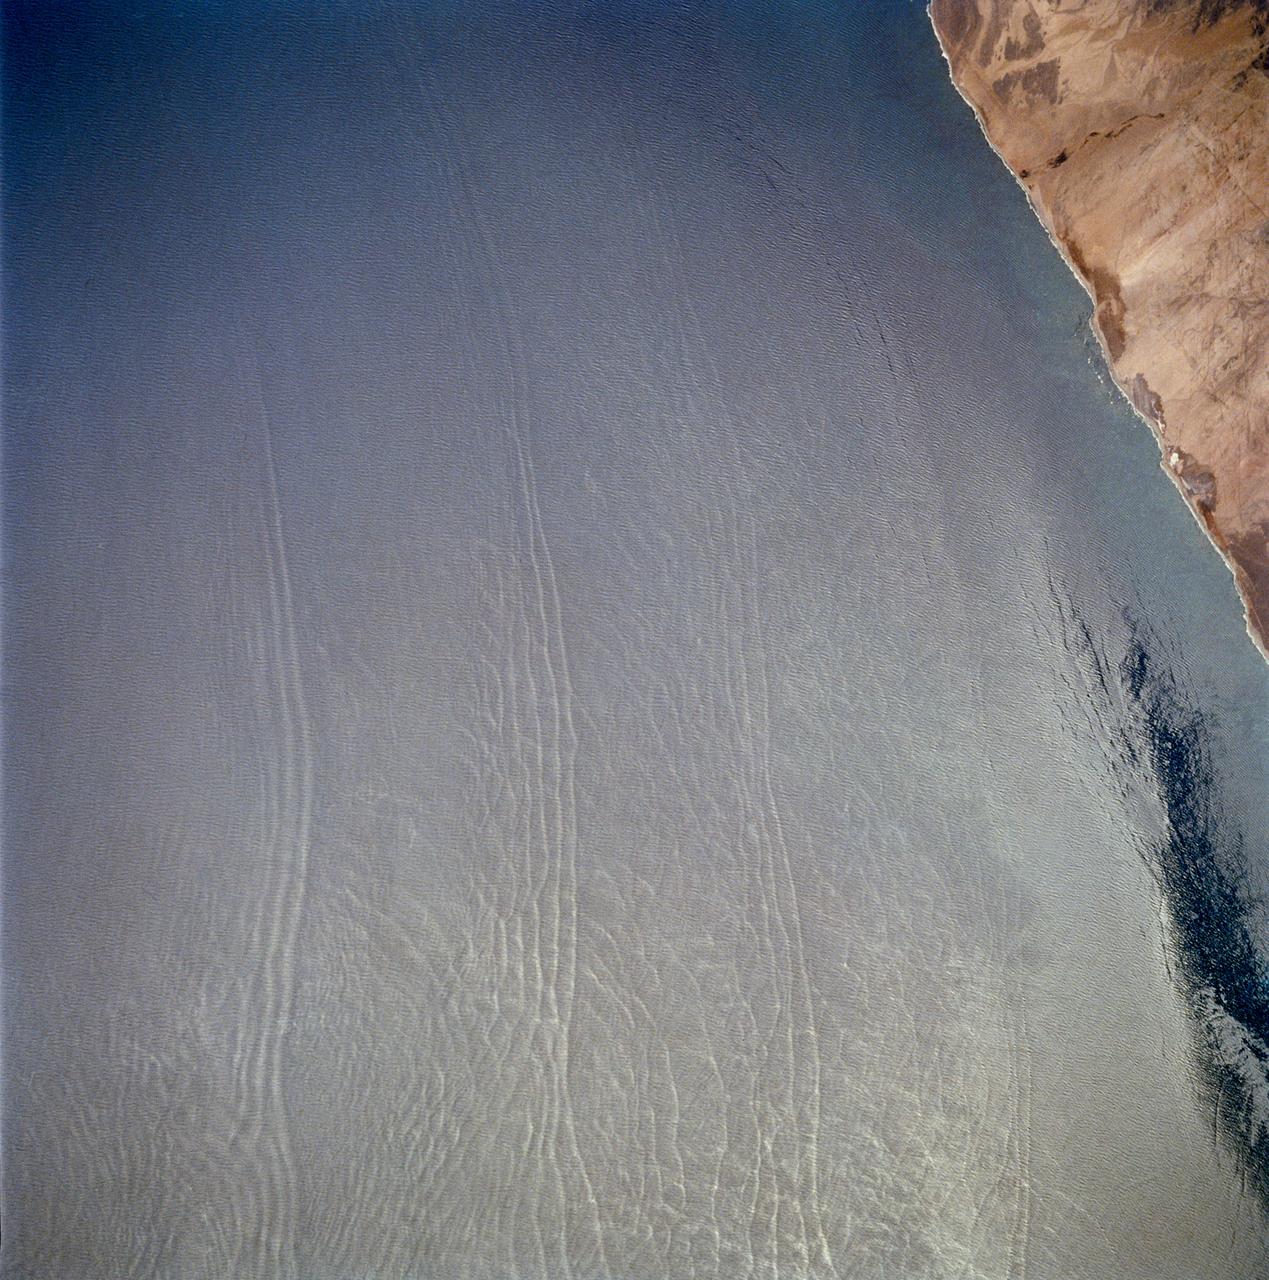
These open ocean Internal Waves were seen off the Namibia Coast, Africa (23.0S, 14.0E). The periodic and regularly spaced sets of internal waves most likely coincide with tidal periods about 12 hours apart. The wave length (distance from crest to crest) varies between 1.5 and 5.0 miles and the crest lengths stretch across and beyond the distance of the photo. The waves are intersecting the Namibia coastline at about a 30 degree angle.

The surface of this image looks wavy, like that of the sea. These wave shapes are the result of erosion: the removal of material, which has been ongoing for millions, if not billions, of years. This erosion is likely performed by the action of wind and has revealed layered rock that was deposited in this area in the ancient past. The layers were deposited very regularly one on top of another and the erosion has cut across them — sometimes shallowly, sometimes more deeply — to create these giant undulations. More resistant layers protrude further, making them the visible crests of the waves. https://photojournal.jpl.nasa.gov/catalog/PIA23287
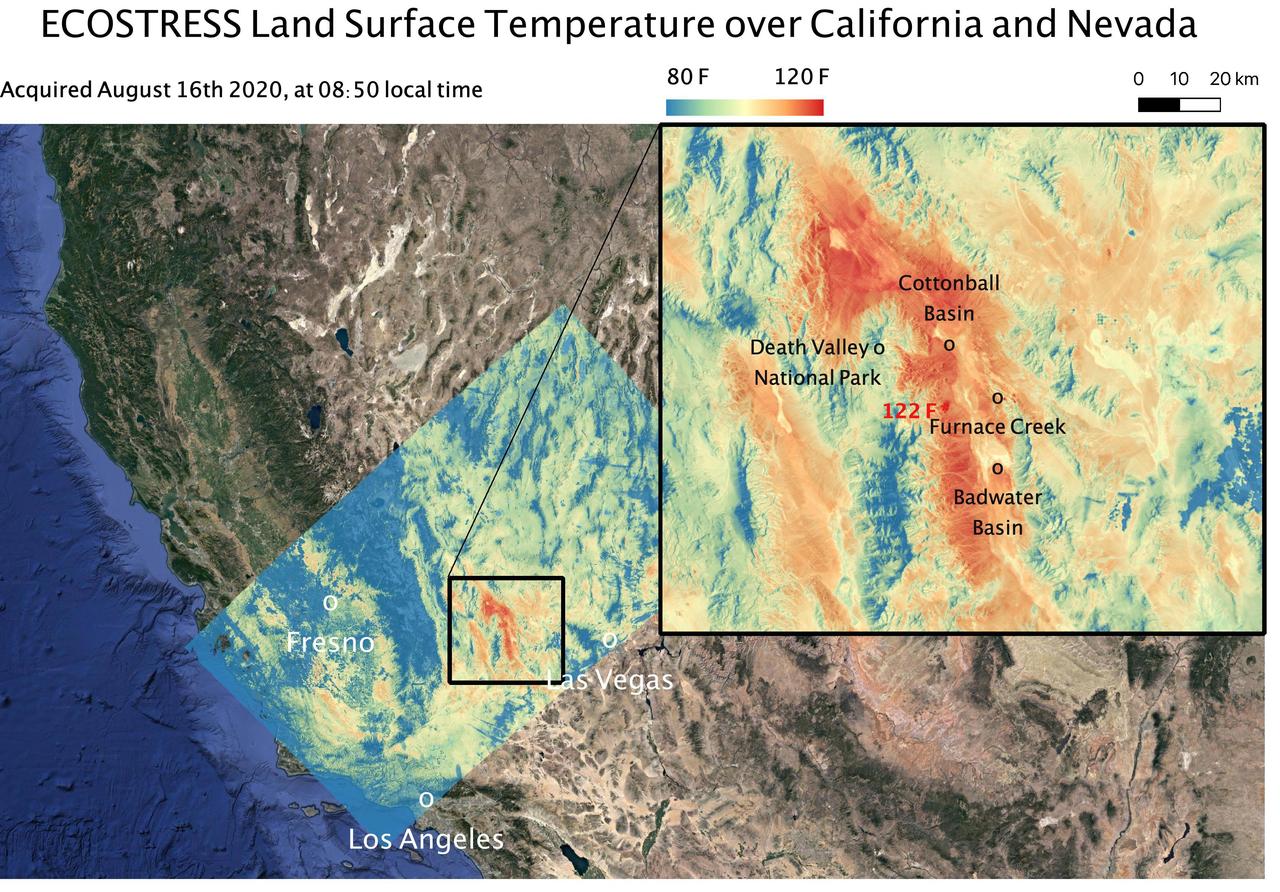
This temperature map shows the land surface temperatures around Death Valley in California's Mojave Desert on Aug. 16, 2020. The observation was made possible by NASA's Ecosystem Spaceborne Thermal Radiometer Experiment on Space Station (ECOSTRESS), which measured a peak land surface temperature of 122.52 degrees Fahrenheit (50.29 degrees Celsius) near Furnace Creek. ECOSTRESS collected this data when the space station passed over California at about 8:50 a.m. PDT (11:50 a.m. EDT) during a record-breaking heat wave that gripped the region. With a resolution of about 77 by 77 yards (70 by 70 meters), the image enables the study of surface-temperature conditions down to the size of a football field. The hottest temperatures are shown in dark red, with the coolest temperatures in blue. ECOSTRESS measures the temperature of plants as they heat up when they run out of water. But it can also measure and track heat-related phenomena like heat waves, fires, and volcanoes. https://photojournal.jpl.nasa.gov/catalog/PIA23787
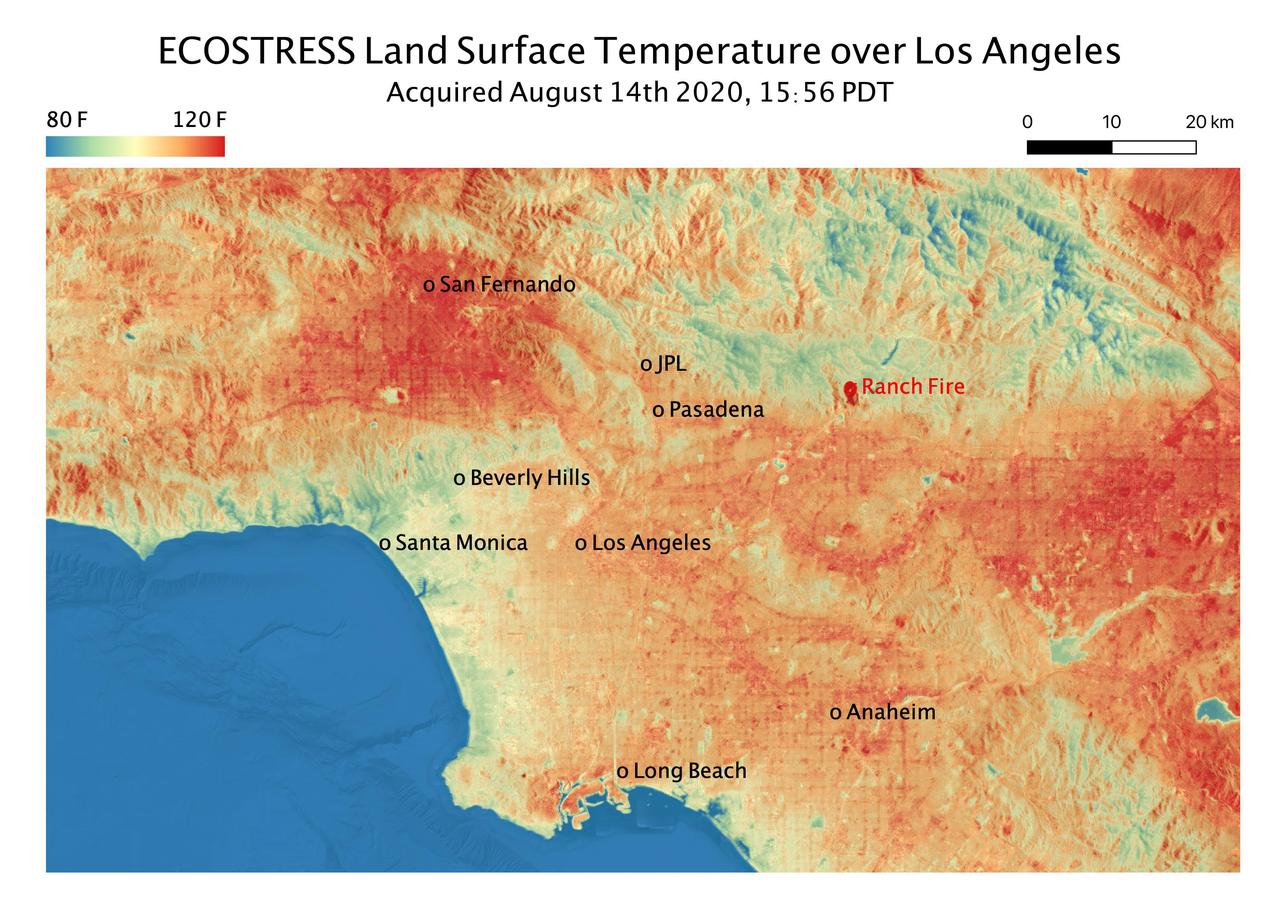
This temperature map shows the land surface temperatures throughout Los Angeles County on Aug. 14, 2020. The observation was made possible by NASA's Ecosystem Spaceborne Thermal Radiometer Experiment on Space Station (ECOSTRESS), which measured a peak land surface temperature in the San Fernando Valley, northwest of downtown Los Angeles, of 128.3 degrees Fahrenheit (53.5 degrees Celsius). ECOSTRESS collected this data as the space station passed over California at about 3:56 p.m. PDT (6:56 p.m. EDT) during a record-breaking heat wave that gripped the region. The Ranch fire, that burned near the city of Azuza was also detected by ECOSTRESS. With a resolution of about 77 by 77 yards (70 by 70 meters), the image enables the study of surface-temperature conditions down to the size of a football field. The hottest temperatures are shown in dark red, with the coolest temperatures in blue. ECOSTRESS measures the temperature of plants as they heat up when they run out of water. But it can also measure and track heat-related phenomena like heat waves, fires, and volcanoes. https://photojournal.jpl.nasa.gov/catalog/PIA23786
The arculate fronts of these apparently converging internal waves off the northeast coast of Somalia (11.5N, 51.5E) probably were produced by interaction with two parallel submarine canyons off the Horn of Africa. Internal waves are packets of tidally generated waves traveling within the ocean at varying depths and are not detectable by any surface disturbance.
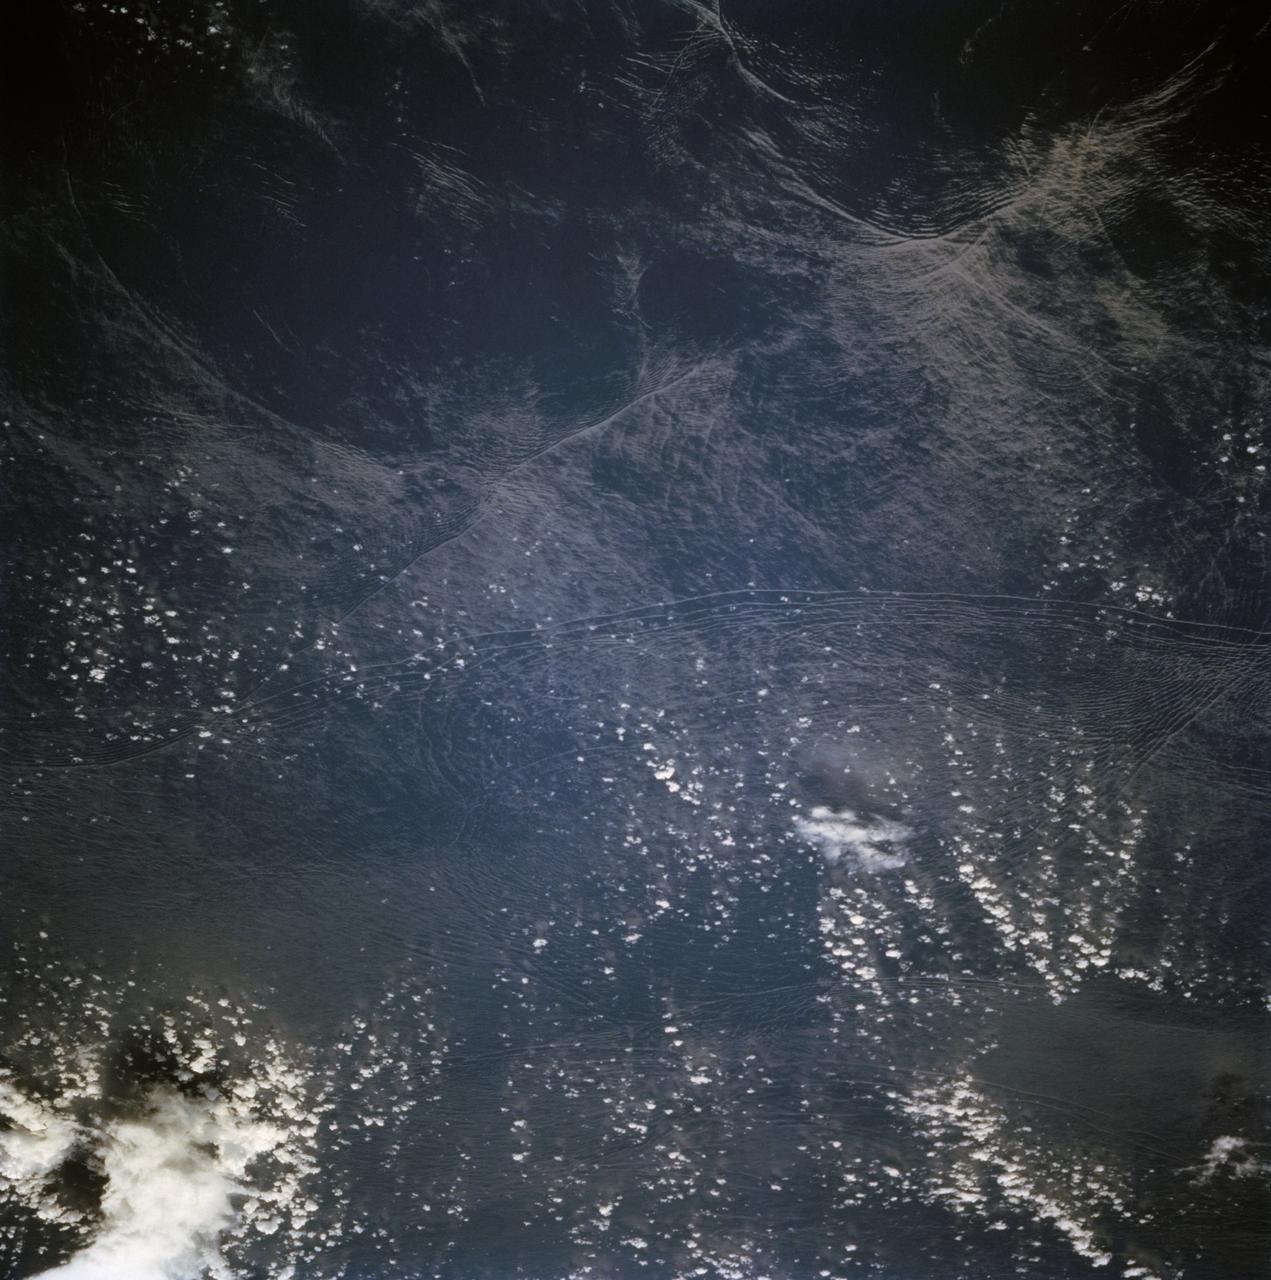
STS068-236-044 (30 September-11 October 1994) --- These internal waves in the Andaman Sea, west of Burma, were photographed from 115 nautical miles above Earth by the crew of the Space Shuttle Endeavour during the Space Radar Laboratory 2 (SRL-2) mission. The internal waves smooth out some of the capillary waves at the surface in bands and travel along the density discontinuity at the bottom of the mixed layer depth. There is little evidence of the internal waves at the surface. They are visible in the Space Shuttle photography because of sunglint, which reflects off the water.
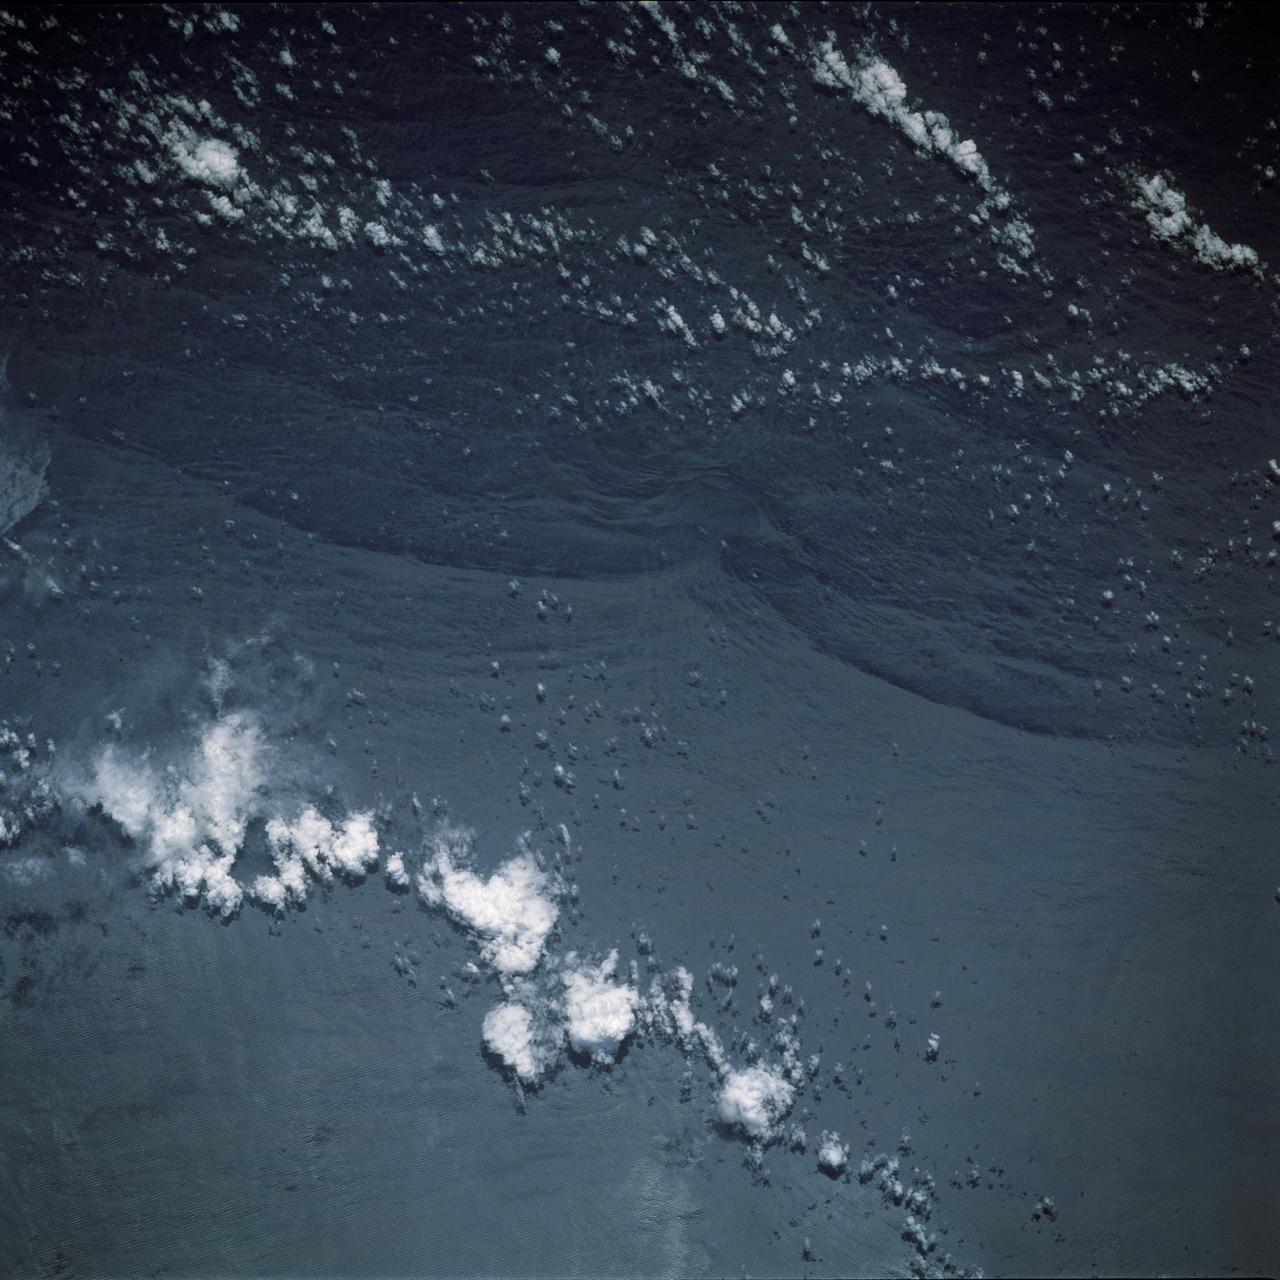
STS044-79-077 (24 Nov.-1 Dec. 1991) --- This photograph, captured from the Earth-orbiting Space Shuttle Atlantis, shows sunglint pattern in the western tropical Indian Ocean. Several large internal waves reflect around a shallow area on the sea floor. NASA scientists studying the STS-44 photography believe the shallow area to be a sediment (a submerged mountain) on top of the Mascarene Plateau, located northeast of Madagascar at approximately 5.6 degrees south latitude and 55.7 degrees east longitude. Internal waves are similar to surface ocean waves, except that they travel inside the water column along the boundary between water layers of different density. At the surface, their passage is marked on the sea surface by bands of smooth and rough water. These bands appear in the sunglint pattern as areas of brighter or darker water. NASA scientists point out that, when the waves encounter an obstacle, such as a near-surface seamount, they bend or refract around the obstacle in the same manner as surface waves bend around an island or headland.
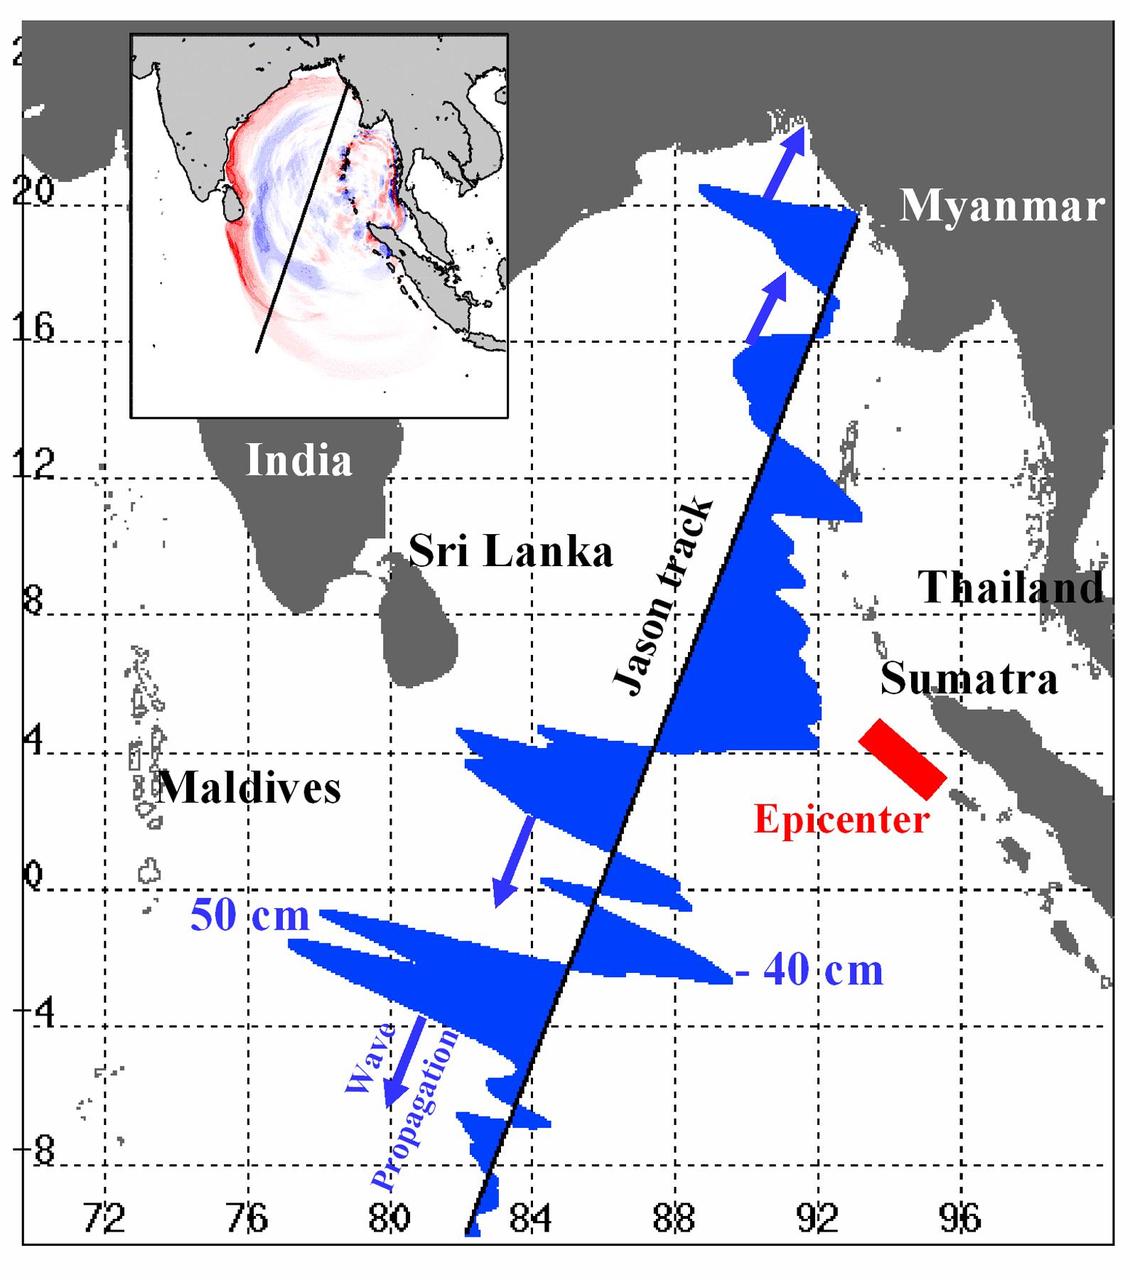
Displayed in blue color is the height of sea surface (shown in blue) measured by the Jason satellite two hours after the initial magnitude 9 earthquake hit the region (shown in red) southwest of Sumatra on December 26, 2004. The data were taken by a radar altimeter onboard the satellite along a track traversing the Indian Ocean when the tsunami waves had just filled the entire Bay of Bengal (see the model simulation inset image). The data shown are the changes of sea surface height from previous observations made along the same track 20-30 days before the earthquake, reflecting the signals of the tsunami waves. The maximum height of the leading wave crest was about 50 cm (or 1.6 ft), followed by a trough of sea surface depression of 40 cm. The directions of wave propagation along the satellite track are shown by the blue arrows. http://photojournal.jpl.nasa.gov/catalog/PIA07219

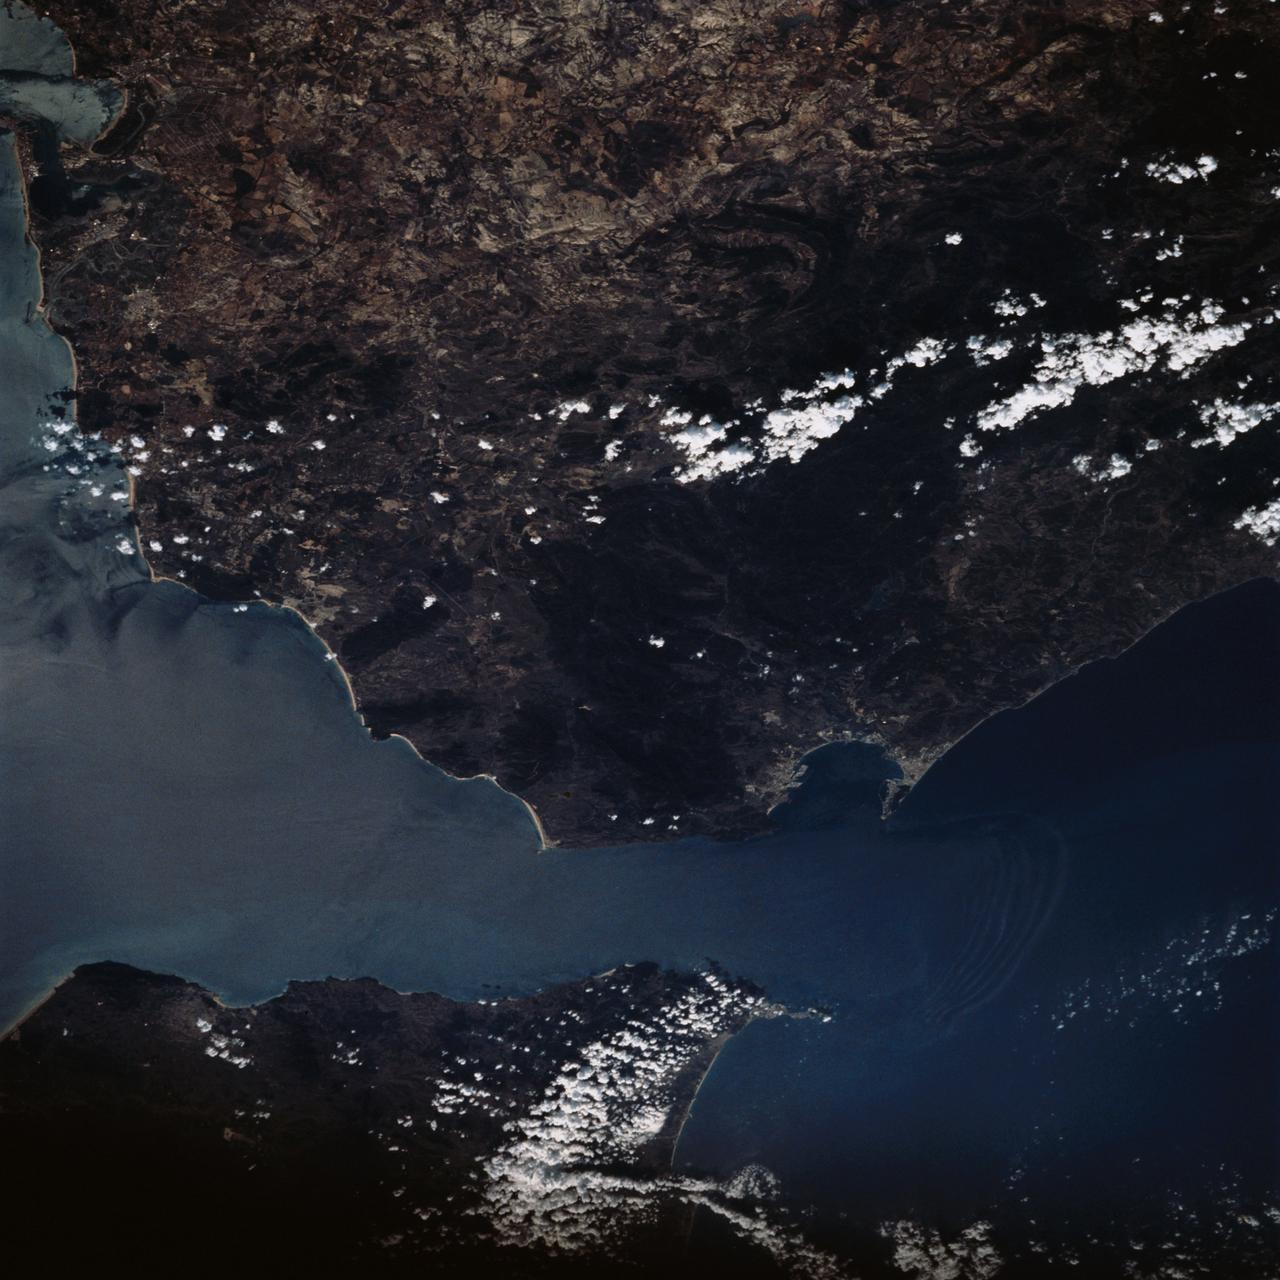
STS060-88-070 (3-11 Feb 1994) --- This view shows sunglint in the Strait of Gibralter. In this photograph a high pressure atmospheric system over the Iberian Peninsula has set the conditions for seeing a plankton bloom along the Moroccan coast in the Alboran Sea (Western Mediterranean) coastal counter current as well as illumining the influence of winds in the sunglint pattern near the Strait of Gibraltar. Where the water is ruffled from a wind gust, such as off Cadiz, Spain, the surface is less reflective and thus appears dark. A combination of the effects of the tide and the surface winds through the Strait of Gibraltar have created a unique sunglint pattern at the entrance of the Mediterranean. The Atlantic Ocean waters are flowing with the tide through the Strait of Gibraltar into the Mediterranean Sea and are probably smoothing out some of the smaller waves at the surface. The incoming tide generates internal waves as can be faintly seen in this photograph. The incoming relatively cooler, less dense Atlantic water flows over the warm, more saline Mediterranean water. As the tide moves into the Strait of Gibraltar it encounters the Camarinal Sill, which is like a cliff under the water, south of Camarinal Point, Spain. Internal waves are generated at this sill and they travel along the density boundary between the Atlantic water and the Mediterranean water masses. There is little evidence of the internal waves at the surface of the ocean. We can see them in spacecraft photography because of the sunglint which reflects off the different water layers in differential patterns. The internal waves also smooth out some of the bands of capillary waves at the surface. That is, the sun reflects more brightly from these smooth areas, showing the pattern of the underwater waves more prominently than do the surface waves. The Bay of Cadiz on the southwest coast of Spain, the Rock of Gibraltar, and the Moroccan coast are also beautifully illustrated in this photography. The focus for scientists, however, remains the high clarity and spatial resolution given by sunglint studies to physical phenomena in the ocean.
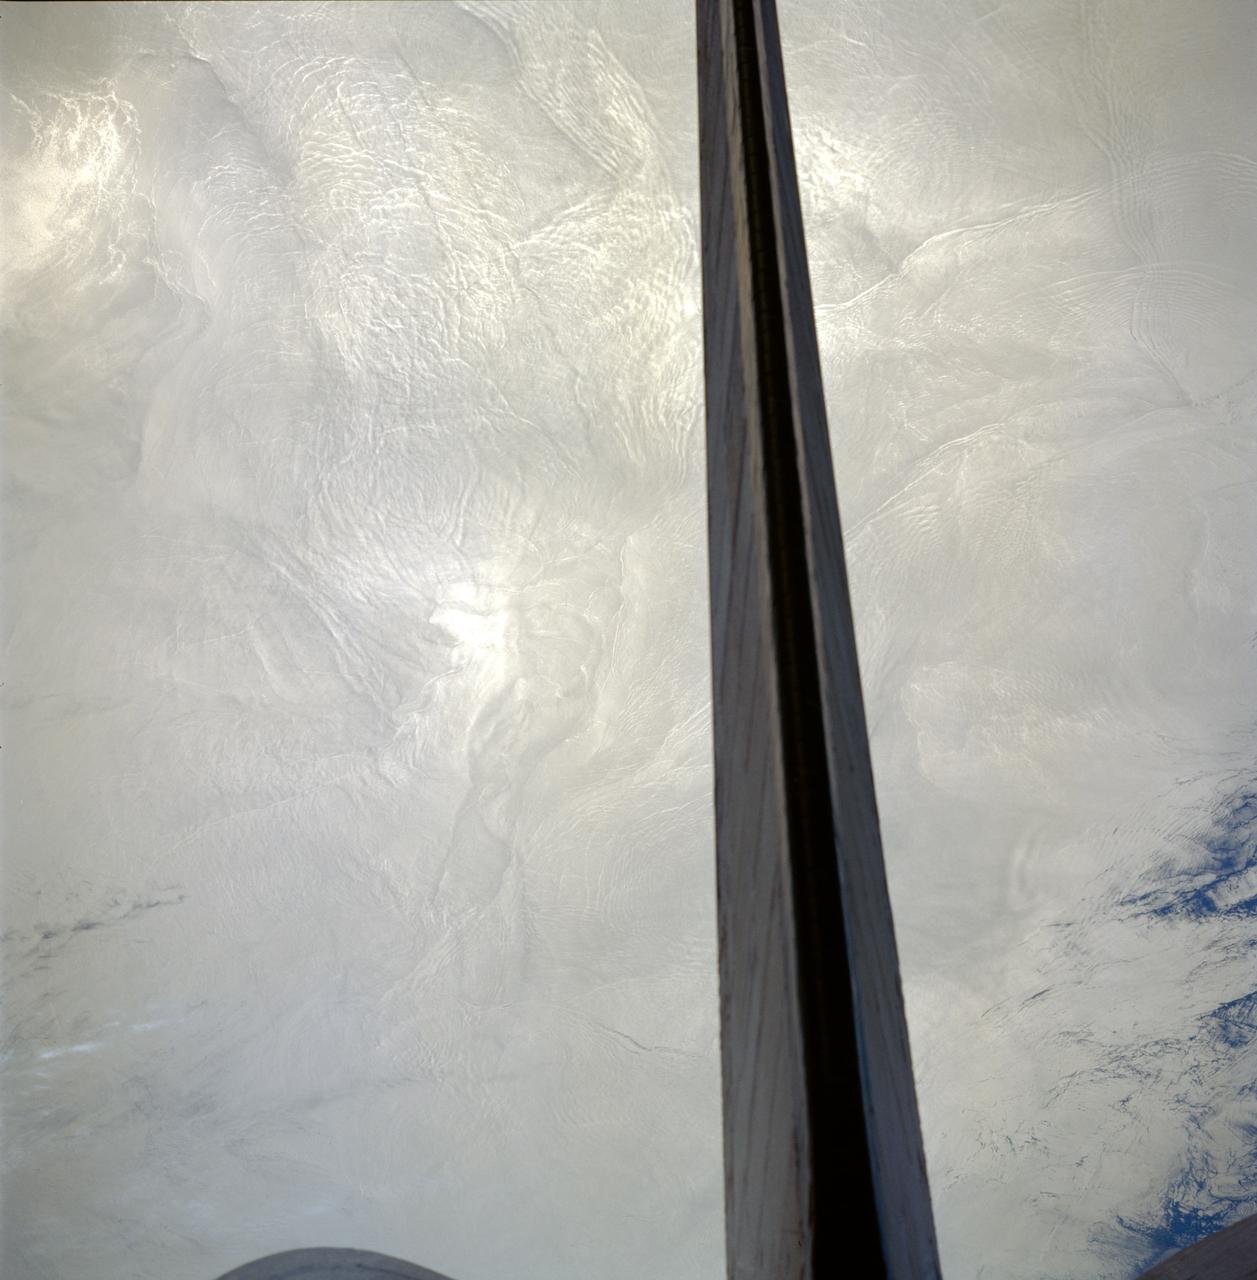
STS091-713-061 (2-12 June 1998) --- The vertical stabilizer of the Space Shuttle Discovery runs through this Atlantic Ocean image made from its crew cabin. Many sets of internal waves are seen in the 70mm frame traveling through an area off the Atlantic coast of Nova Scotia, Canada. There are seven sets that run perpendicular to each other. Internal waves are tidally induced and travel below the surface of the ocean along a density change which occurs often around 150 feet deep. According to NASA scientists studying the STS-91 collection, the waves are visible because, as the wave action smoothes out the smaller waves on the surface, the manner in which the sun is reflected is changed.
ElNi?o is experiencing a late-fall resurgence. Sea-level height data from the NASA/European Ocean Surface Topography Mission/Jason-2 oceanography satellite show the equatorial Pacific has triggered a wave of warm water, known as a Kelvin wave.
STS085-743-000D (7 - 19 August 1997) --- Cape Cod almost looks like an elf's slipper with this orientation in the sunglint. The sunglint also reveals other features such as shipwakes, calmer sea surfaces (the darker areas) and internal waves which are waves traveling along a layer of denser water many tens of feet below the surface.

The pattern on the right half of this image of the Bay of Bengal is the result of two opposing wave trains colliding. This ASTER sub-scene, acquired on March 29, 2000, covers an area 18 kilometers (13 miles) wide and 15 kilometers (9 miles) long in three bands of the reflected visible and infrared wavelength region. The visible and near-infrared bands highlight surface waves due to specular reflection of sunlight off of the wave faces. http://photojournal.jpl.nasa.gov/catalog/PIA02662
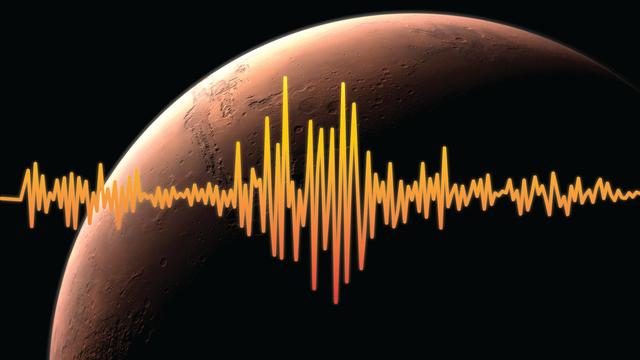
An artist's rendition of Mars, highlighting one of InSight's goals -- to figure out just how tectonically active Mars is today and how often meteorites impact it. Interior Exploration using Seismic Investigations, Geodesy and Heat Transport, or InSight, is scheduled to launch from Vandenberg Air Force Base on the California coast between May 5 through June 8, 2018, and land on Mars six months later. InSight will give the Red Planet its first thorough check up since it formed, 4.5 billion years ago. The InSight lander carries a seismometer, SEIS, that listens to the pulse of Mars. The seismometer records the waves traveling through the interior structure of a planet. Studying seismic waves tells us what might be creating the waves. On Mars, scientists suspect that the waves may be caused by marsquakes, meteorites striking the surface, or hot, molten magma moving at great depths underneath the surface. https://photojournal.jpl.nasa.gov/catalog/PIA22230
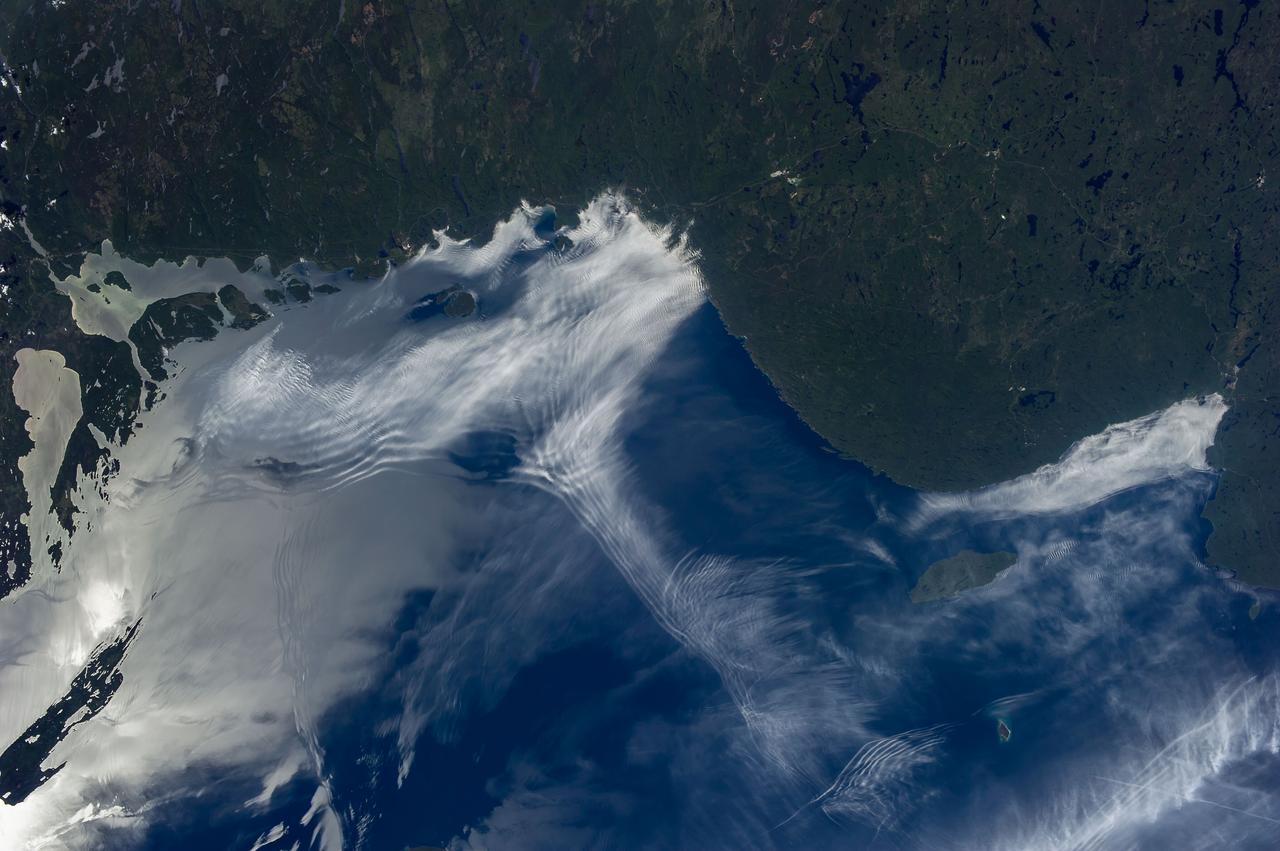
ISS036-E-011843 (24 June 2013) --- Gravity waves and sunglint on Lake Superior are featured in this image photographed by an Expedition 36 crew member on the International Space Station. From the vantage point of the space station, crew members frequently observe Earth atmospheric and surface phenomena in ways impossible to view from the ground. Two such phenomena?gravity waves and sunglint?are illustrated in this photograph of northeastern Lake Superior. The Canadian Shield of southern Ontario (bottom) is covered with extensive green forest canopy typical of early summer. Offshore, and to the west and southwest of Pukaskwa National Park several distinct sets of parallel cloud bands are visible. Gravity waves are produced when moisture-laden air encounters imbalances in air density, such as might be expected when cool air flows over warmer air; this can cause the flowing air to oscillate up and down as it moves, causing clouds to condense as the air rises (cools) and evaporate away as the air sinks (warms). This produces parallel bands of clouds oriented perpendicular to the wind direction. The orientation of the cloud bands visible in this image, parallel to the coastlines, suggests that air flowing off of the land surfaces to the north is interacting with moist, stable air over the lake surface, creating gravity waves. The second phenomenon?sunglint?effects the water surface around and to the northeast of Isle Royale (upper right). Sunglint is caused by light reflection off a water surface; some of the reflected light travels directly back towards the observer, resulting in a bright mirror-like appearance over large expanses of water. Water currents and changes in surface tension (typically caused by presence of oils or surfactants) alter the reflective properties of the water, and can be highlighted by sunglint. For example, surface water currents are visible to the east of Isle Royale that are oriented similarly to the gravity waves ? suggesting that they too are the product of winds moving off of the land surface.
STS058-73-009 (18 Oct-1 Nov 1993) --- Atlantic water flowing with the tide through the Strait of Gibraltar into the Mediterranean generates internal waves as depicted in this photo. The incoming cool, less dense Atlantic water flows over the warm, more saline Mediterranean water. As the tide moves into the Strait of Gibraltar it encounters the Camarinal Sill, which is like a cliff under water, south of Camarinal Point, Spain. Internal waves are generated at the Sill and travel along the density boundary between the Atlantic water and the Mediterranean water. Internal waves have very little effect on the sea surface, except for gentle slopes and slight differences in roughness. We can see them in the Space Shuttle photos because of sunglint which reflects off the water. Internal waves smooth out some of the capillary waves at the surface in bands. The sun reflects more brightly from these smooth areas showing us the pattern of the underwater waves. The Bay of Cadiz on the southwest coast of Spain, the Rock of Gibraltar, and the Moroccan coast are also visible in this photo.
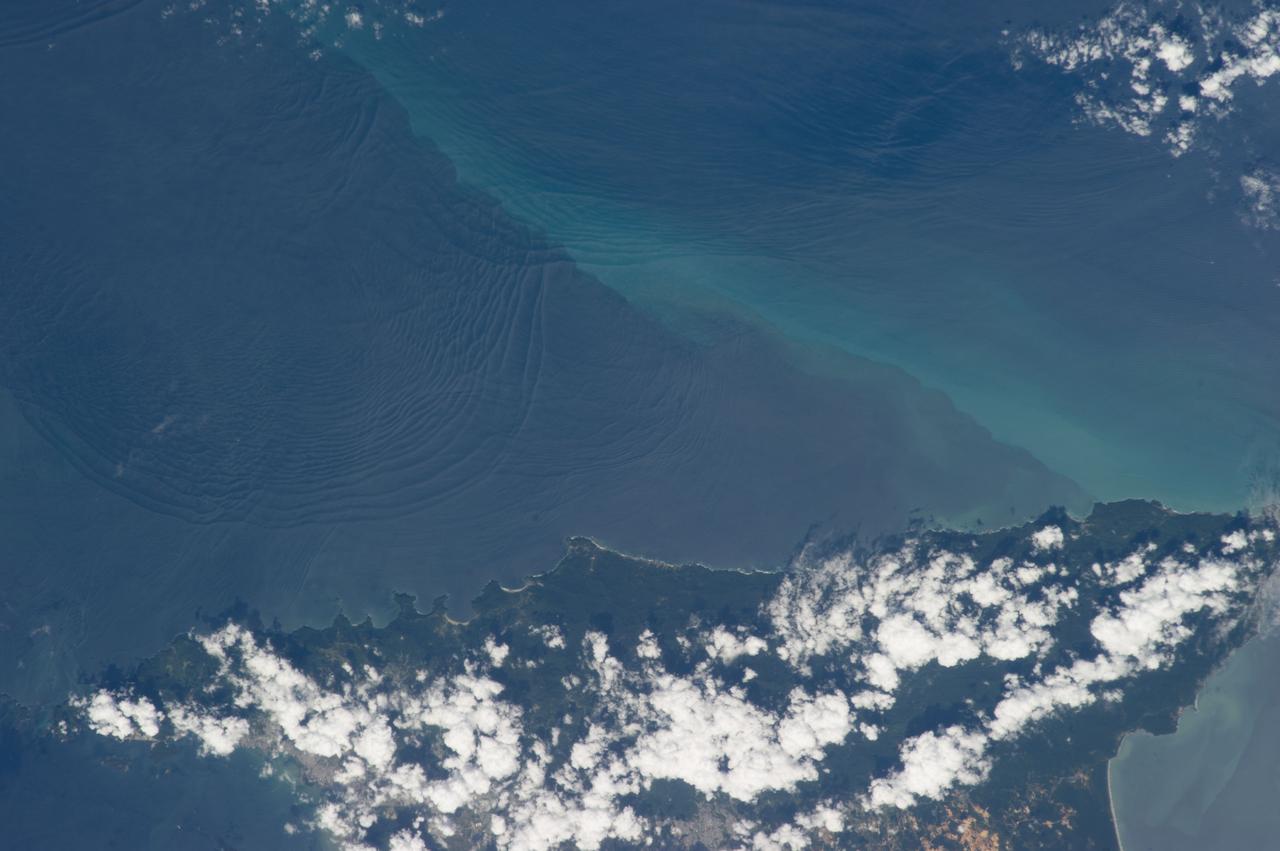
ISS034-E-032377 (18 Jan. 2013) --- Internal waves off Northern Trinidad are featured in this image photographed by an Expedition 34 crew member on the International Space Station. This photograph shows the north coast of the island of Trinidad in the southeastern Caribbean Sea, where heating of the land is setting off the growth of cumulus clouds. The light blue northwest-southeast trending plume at center is sediment from one of the rivers that flows into the sea here. Adjacent to, and appearing to cross the sediment plume, a series of subtle interacting arcs can be seen in the sea. These are known as internal waves which are the surface manifestation of slow waves moving tens of meters beneath the sea surface. These produce enough of an effect on the sea surface to be seen from space, but only where they are enhanced due to reflection of sunlight, or sunglint, back towards the space station. The image shows at least three sets of internal waves interacting. The most prominent set (top left) shows a “packet” of several waves moving from the northwest due to the tidal flow towards the north coast of Trinidad. Two less prominent, younger sets can be seen further out to sea. A very broad set enters the view from the north and northeast, and interacts at top center with the first set. All the internal waves are probably caused by the shelf break near Tobago (outside the image to top right). The shelf break is the step between shallow seas (around continents and islands) and the deep ocean. It is the line at which tides usually start to generate internal waves. The sediment plume at center is embedded in the Equatorial Current (also known as the Guyana Current) and is transporting material to the northwest—in almost the opposite direction to the movement of the internal waves. The current flows strongly from east to west around Trinidad, all the way from equatorial Africa, driven by year-round easterly winds. Seafarers in the vicinity of Trinidad are warned that the current, and its local reverse eddies, make navigation of smaller craft in these waters complicated and sometimes dangerous.
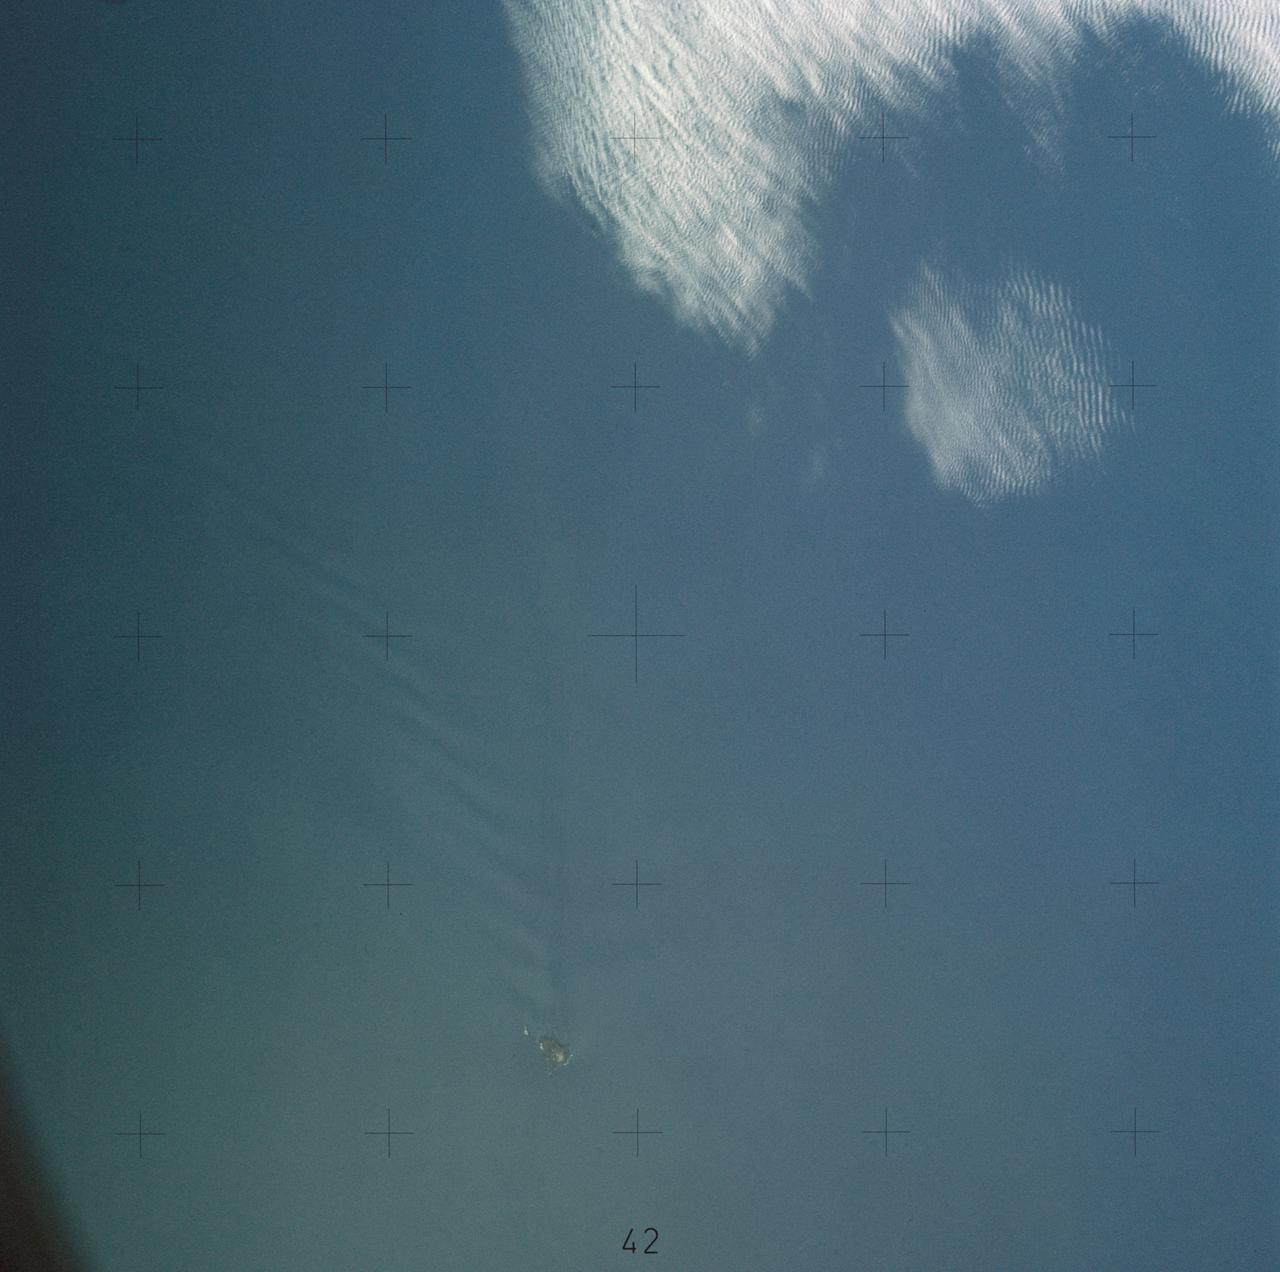
SL4-137-3655 (16 Dec. 1973) --- An island wake produced by the Antipodes Islands in the ocean current south of New Zealand is seen in this photograph taken from the Skylab space station in Earth orbit. A Skylab 4 crewmen took the picture with a hand-held 70mm Hasselblad camera. The bow wave pattern is quite evident and can be used to determine the current speed from the angle of the bow wave if the propagation speed of the surface wave is known. Also, evident is the darker band extending downstream from the island tens of miles. This is the actual wake of the island. The existence of water color differences from within to outside a turbulent island wake may indicate a temperature difference, with cooler water being stirred to the surface in the wake. This temperature difference could be used to drive a thermo-electric type generator to reduce small islands' dependence on imported oil for power generation. Photo credit: NASA
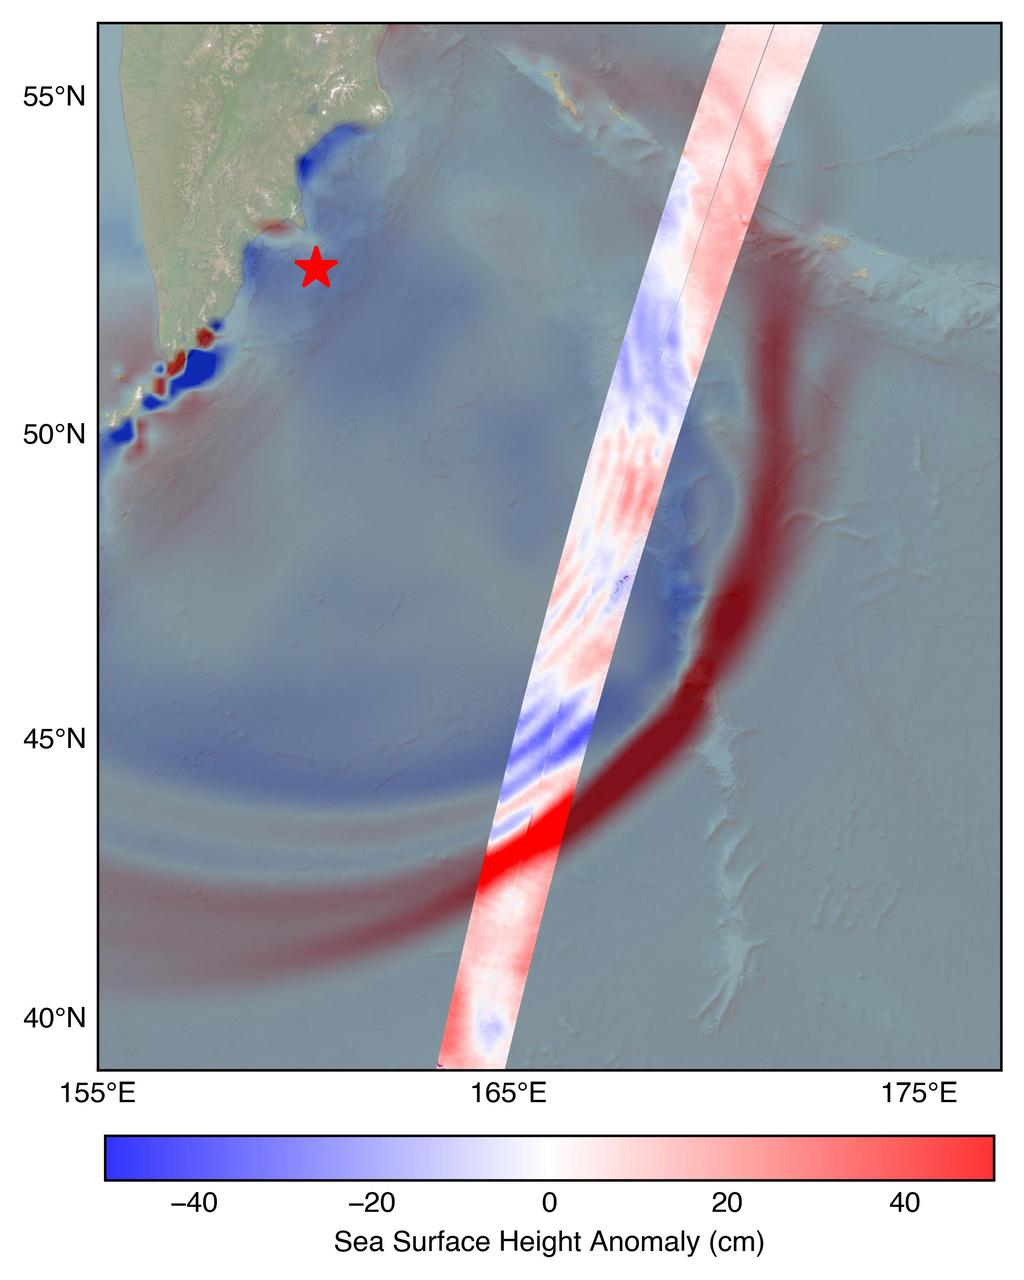
The U.S.-French SWOT (Surface Water and Ocean Topography) satellite captured the leading edge of a tsunami wave that rolled through the Pacific Ocean on July 30, 2025 (11:25 a.m. local time), in the wake of a magnitude 8.8 earthquake that struck Russia's Kamchatka Peninsula. The satellite captured the data about 70 minutes after the earthquake struck. The SWOT sea level measurements, shown in the highlighted swath from the satellite's ground track, is plotted against a tsunami forecast model from the National Oceanic and Atmospheric Administration (NOAA) Center for Tsunami Research in the background. A red star marks the location of the earthquake. The measurements show a wave height exceeding 1.5 feet (45 centimeters) as well as a look at the shape and direction of travel of the leading edge of the wave (indicated in red). Researchers noted that while the wave height might seem small, tsunamis extend from the seafloor to the ocean surface. A seemingly small wave in the open ocean can become much larger in shallower coastal waters. https://photojournal.jpl.nasa.gov/catalog/PIA26652
41G-34-098 (5-13 Oct 1984) --- Strait of Gibraltar and western Mediterranean photographed sunglint. Sun reflection on water delineates surface texture, which corresponds to the ocean's dynamics. The large group of waves connecting Gibraltar with the Moroccan coast is the response of the ocean to a tidal pulse moving into the Mediterranean. The low level wing shear line extending out from the Moroccan coastline into the Mediterranean for approximately 40 miles is the southern extremity of the wind funneling through the strait. This is the first high resolution photograph ever taken of this phenomenon permitting detailed delineation of individual waves which comprise the wave packet.
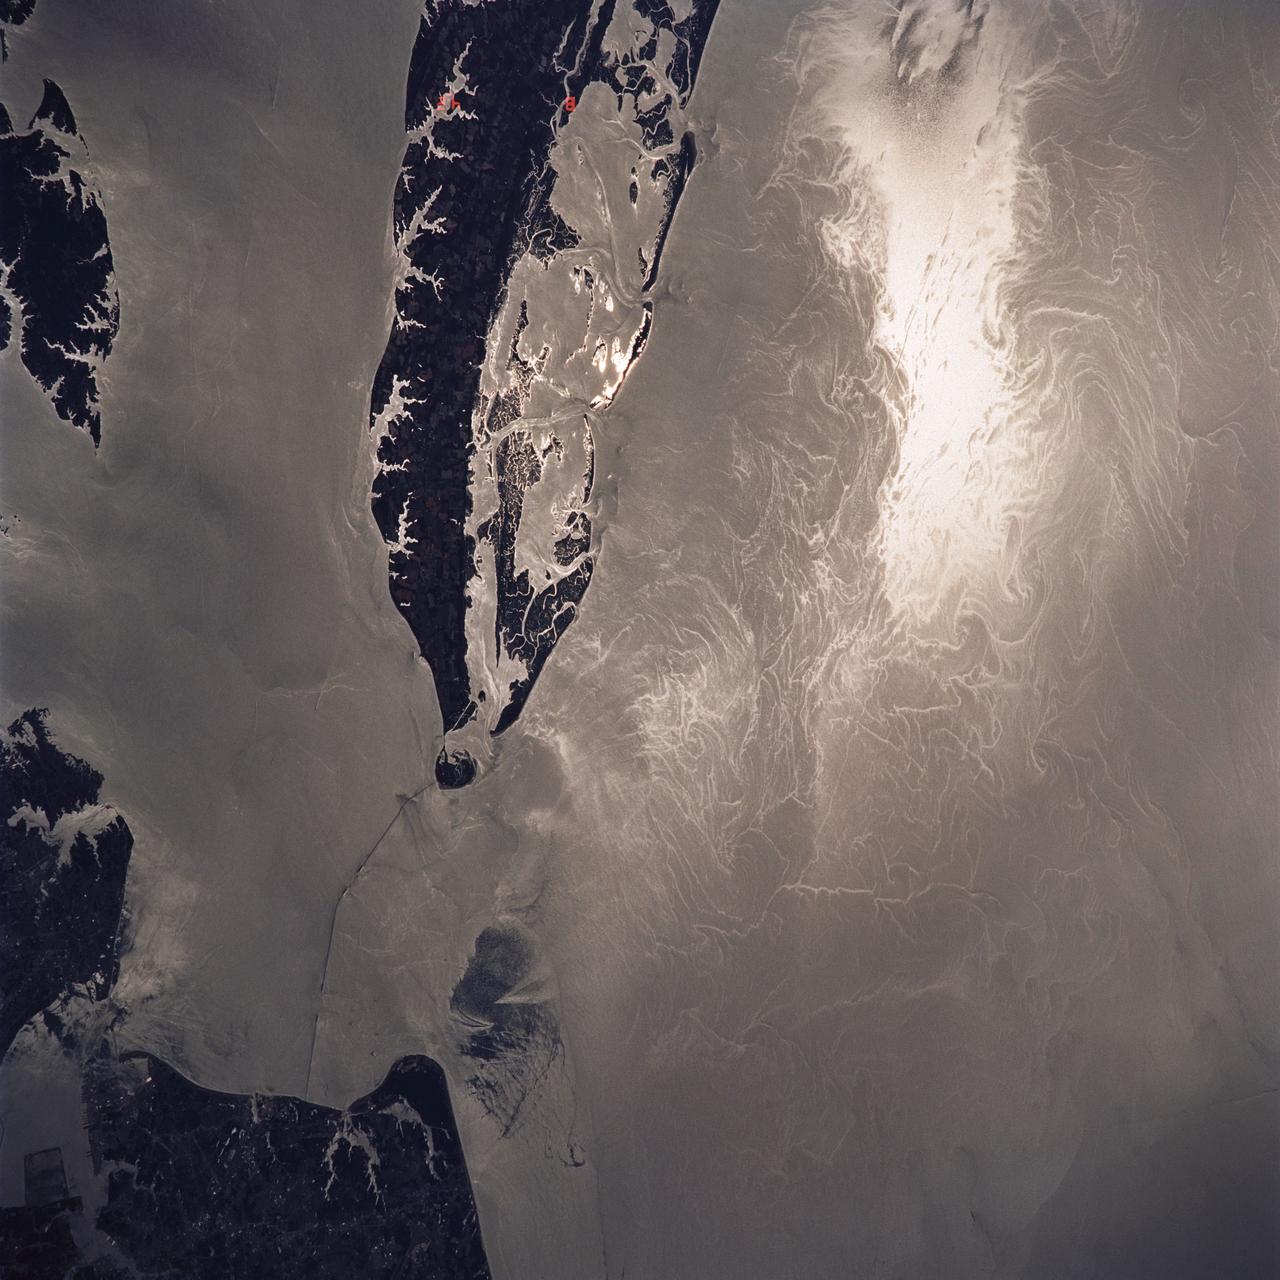
STS040-614-047 (5-14 June 1991) --- This image is of the Norfolk, Virginia -- Southern Delmarva Peninsula Southern Chesapeake Bay Area as seen in sunlight. The exposure is adjusted to emphasize the water patterns present. The outgoing tide generates considerable turbulence as it passes through the mouth of the bay. This is displayed by differences in reflective properties of the water surface due to differences in slope and turbidity. Ship wakes and the wakes of subsurface structures are seen clearly. The bridge tunnel system linking Norfolk with the peninsula and its effect on the system is quite apparent. Sunglint images over land areas were also acquired which emphasize land-water boundaries as demonstrated here in the small Delmarva inlets as a tool for wetland mapping, and river, lake and even pond description. During the first few days of the STS-40 mission the Eastern Seaboard of the United States was free of clouds and haze providing excellent photography of many of the major cities and the countryside of that area as well as the Gulf Stream.
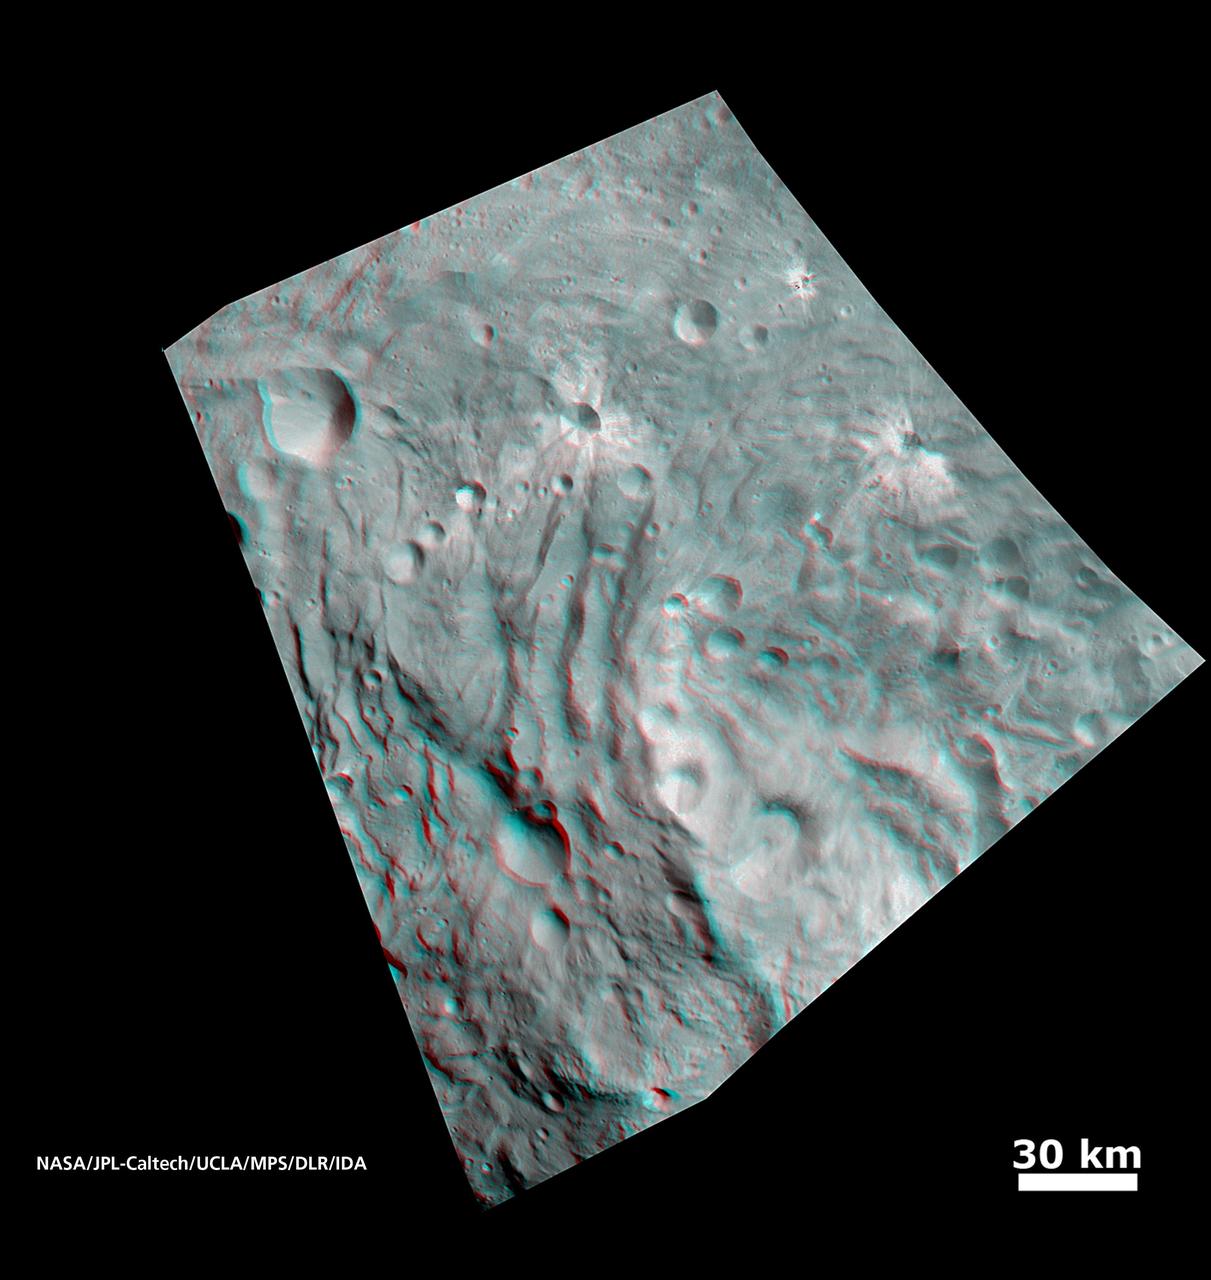
In this image, obtained by NASA Dawn spacecraft from above the surface of the giant asteroid Vesta, topography in the area surrounding the south pole area shows impact craters, ridges and grooves. You need 3D glasses to view this image.
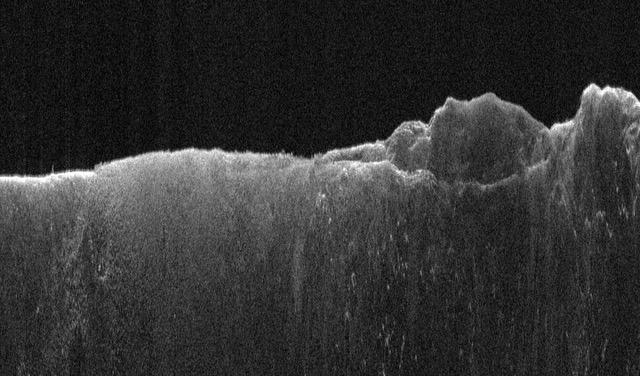
This radargram shows data collected by the Shallow Radar, or SHARAD, on NASA's Mars Reconnaissance Orbiter (MRO) on May 2, 2023, as it performed a 120-degree roll maneuver called a "very large roll" over a formation named Medusae Fossae. Scientists used SHARAD to look for ice beneath the surface of this region. Designed to peer from about a half-mile to a little over a mile (1 to 2 kilometers) below ground, SHARAD emits radio waves that are reflected off materials in the subsurface, measuring how long it takes for those waves to bounce back to the instrument. The longer it takes, the deeper the subsurface layer is. Because different materials reflect radio waves differently, SHARAD allows scientists to distinguish between rock, sand, and ice. While MRO often performs a standard 28-degree roll to give SHARAD's antenna a more direct view of Martian terrain, the 120-degree very large roll rotates the antenna even farther, providing its radio waves an unobstructed path to the surface. This boosts the radar's signals by 10 times or more, giving SHARAD a clearer, deeper view of the Martian underground than ever before. Scientists hope the very large rolls will help them look for frozen and liquid water, among other things. https://photojournal.jpl.nasa.gov/catalog/PIA26555
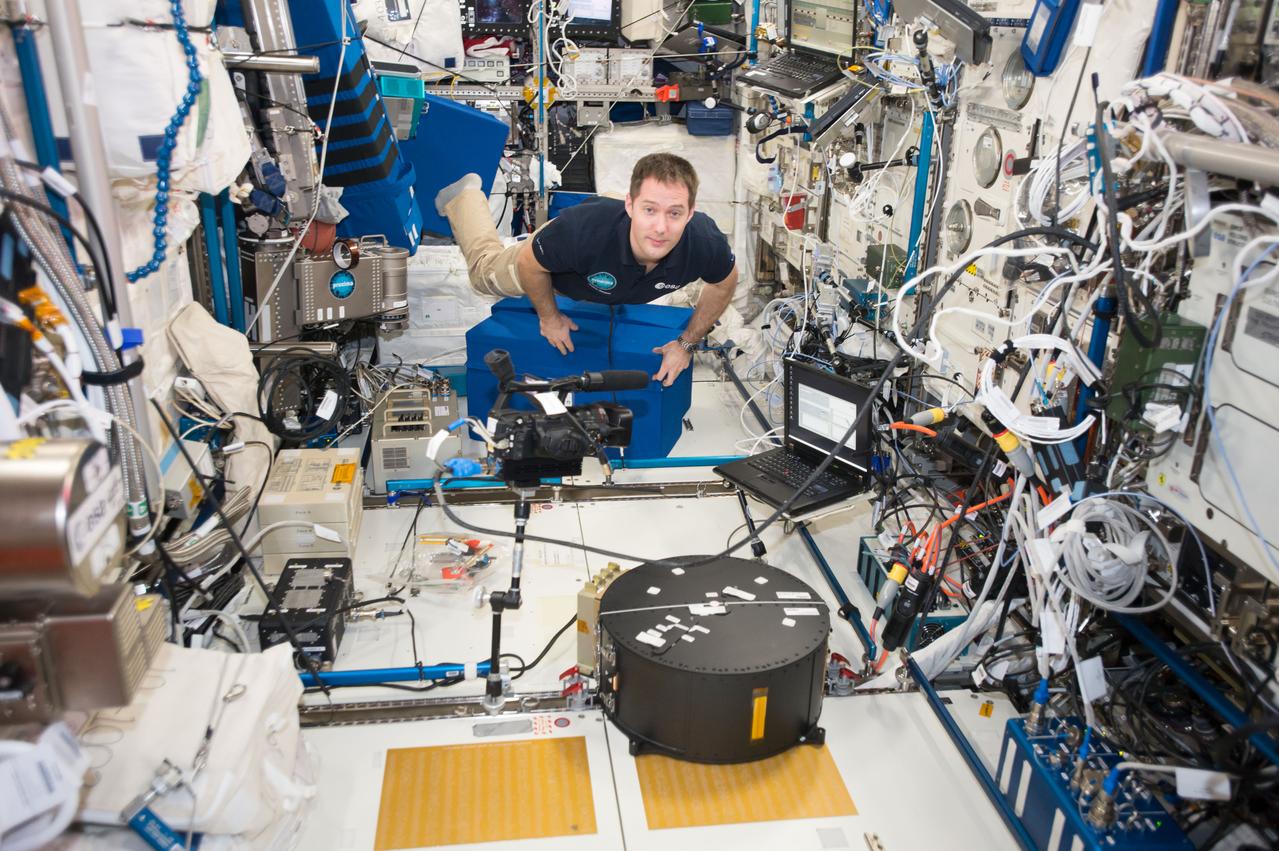
iss051e034021 (May 2, 2017) --- Astronaut Thomas Pesquet, of the European Space Agency (ESA), participates in the Fluidics experiment inside the Columbus laboratory module developed by ESA. Fluidics is exploring how liquids behave in spacecraft tanks and wave turbulence phenomena that occurs at the surface of liquids.
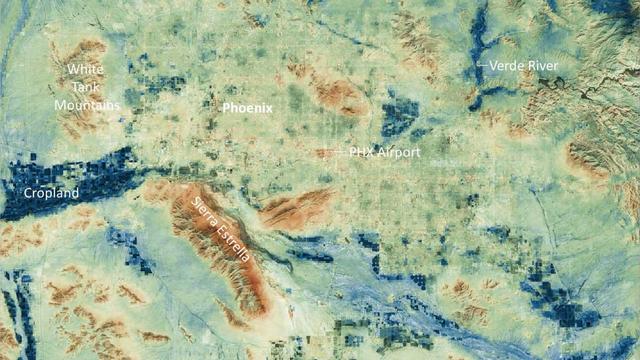
Researchers at NASA's Jet Propulsion Laboratory have created a series of maps showing land-surface temperatures in the Phoenix area in July 2023, when the city experienced a record-breaking run of hot weather. The images reveal the cumulative effect – overnight and across the month – of relentless daytime heating. The data was captured during overnight hours (around 2 a.m.) on several days in July by an instrument called the Visible Infrared Imaging Radiometer Suite (VIIRS) aboard the NOAA-NASA Suomi National Polar-orbiting Partnership (Suomi NPP) satellite managed by the National Oceanic and Atmospheric Administration and NASA. The images show how built surfaces – roads, buildings, airport runways, and the like – retain heat, sometimes hovering around 100 degrees Fahrenheit (38 degrees Celsius) for hours after sunset. From July 1 to July 19, the built surfaces in the maps grew progressively hotter, likely the combined effect of the heat wave intensifying and the cumulative heating of those human-made structures. Due to their high heat capacity, these surfaces didn't fully cool overnight before the onset of the next day's heat. At the center of the images is Phoenix's Sky Harbor International Airport, where VIIRS measured the hottest land-surface temperature within the city. The airport is also where Phoenix takes its official air temperature. By those measurements, the city experienced the hottest month on record in July, including a record 31 consecutive days in which the temperature exceeded 110 degrees Fahrenheit (43.3 degrees Celsius). The previous record was 18 days. Land-surface temperatures in cities are usually warmer than in rural and undeveloped areas because of human activities and the materials used for building. Streets – seen in these maps as a grid pattern – are often the hottest part of the built environment due to dark asphalt paving that absorbs more sunlight than lighter-colored surfaces; asphalt absorbs up to 95% of solar radiation. In the images, the mountains near Phoenix are also notably hot due to their angle to the Sun and greater soil exposure from lack of vegetation. The hot surfaces in and around the city stand in contrast to nearby irrigated surfaces such as agricultural fields, golf courses, and parks, which fell as low as 68 degrees Fahrenheit (18.9 degrees Celsius) during the night. The Verde River and other nearby waterways also were significantly cooler. VIIRS is one of five instruments aboard the NOAA-NASA Suomi NPP satellite. Short for Suomi National Polar-orbiting Partnership, the spacecraft is one of several in the Joint Polar Satellite System. The images were produced from the VNP21IMG Land Surface Temperature product, which is available at NASA's Land, Atmosphere Near-real-time Capability for EOS (LANCE). Animation available at https://photojournal.jpl.nasa.gov/catalog/PIA25868
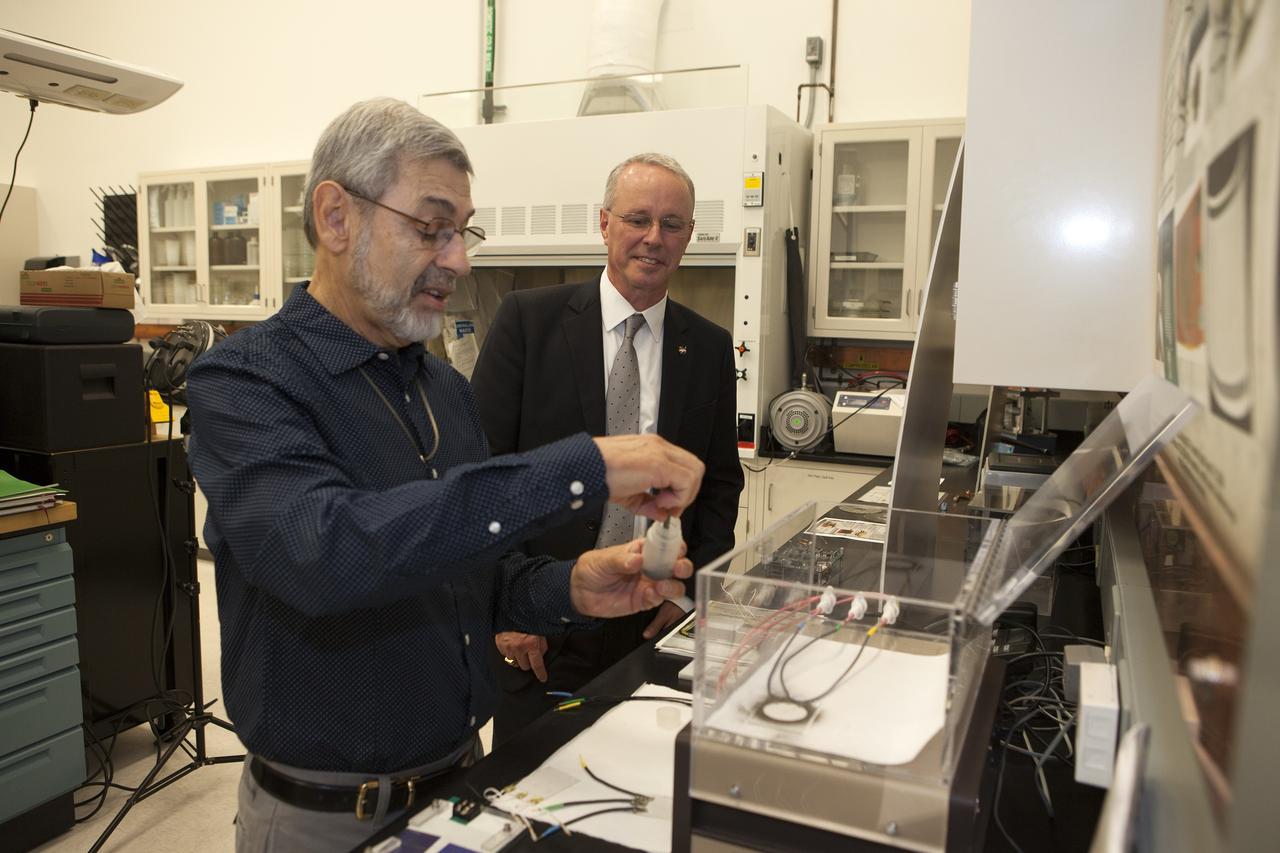
CAPE CANAVERAL, Fla. -- During a visit to NASA's Kennedy Space Center in Florida, NASA Chief Technologist David Miller, right, tours laboratories inside the Swamp Works facility. At left, Dr. Carlos Calle, lead in the Electrostatics and Surface Physics Laboratory, demonstrates a system that uses an electric field wave to move simulated moon dust away from surfaces. Photo credit: NASA/Kim Shiflett
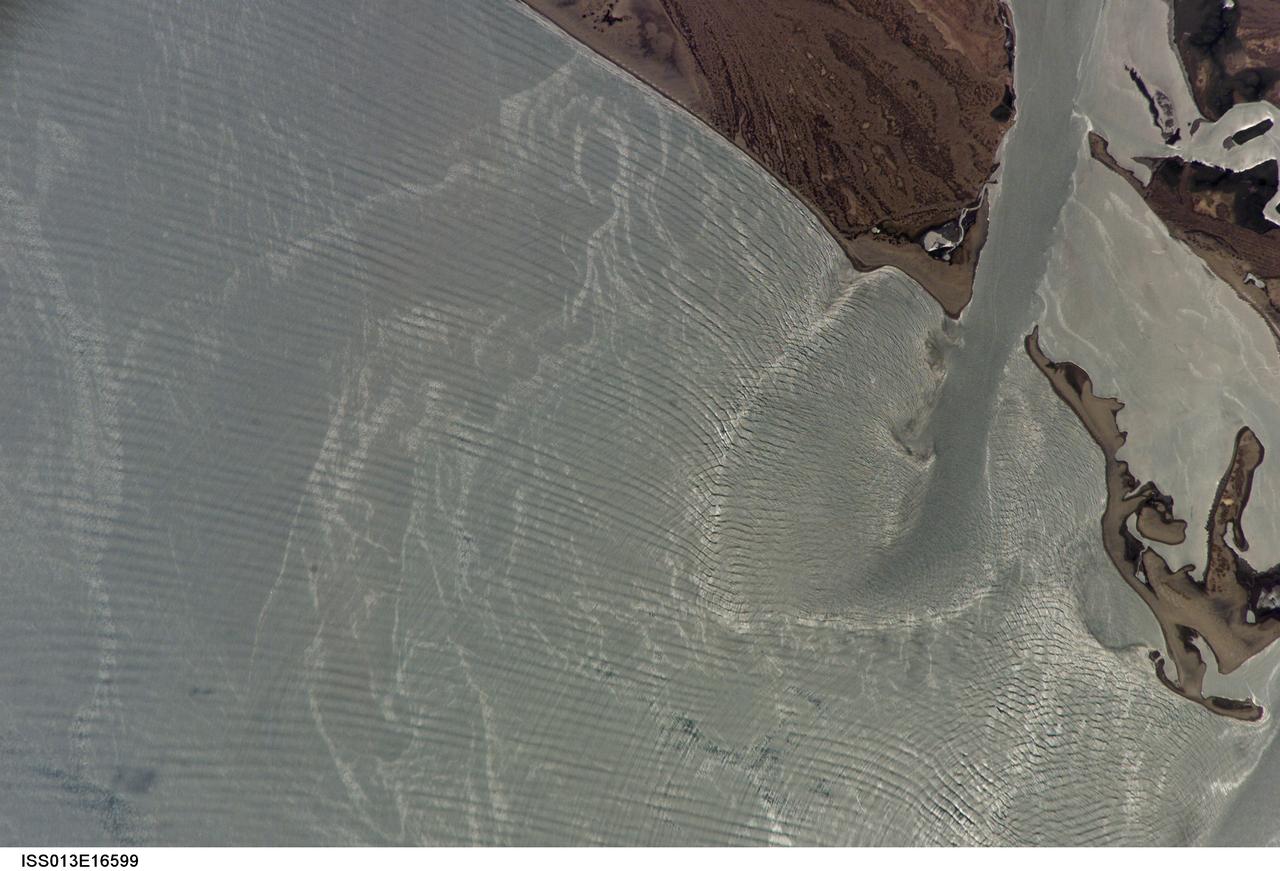
ISS013-E-16599 (9 May 2006) --- Wave sets and tidal currents in the Gulf of California are featured in this image photographed by an Expedition 13 crewmember on the International Space Station. In this image, sunglint off the Gulf of California gives the water a silver-gray appearance rather than the usual azure blue color. The sunglint allows us to see several active features which would not be visible otherwise. In this view of Punta Perihuete, Mexico we can see three major features: biological or man-made oils floating on the surface; the out-going tidal current; and complex wave patterns. The oils on the surface are recognizable as light grey, curved and variable-width streamers shaped by the local winds and currents. Plankton, fish, natural oil seeps and boats dumping bilges are all potential sources for these oils.
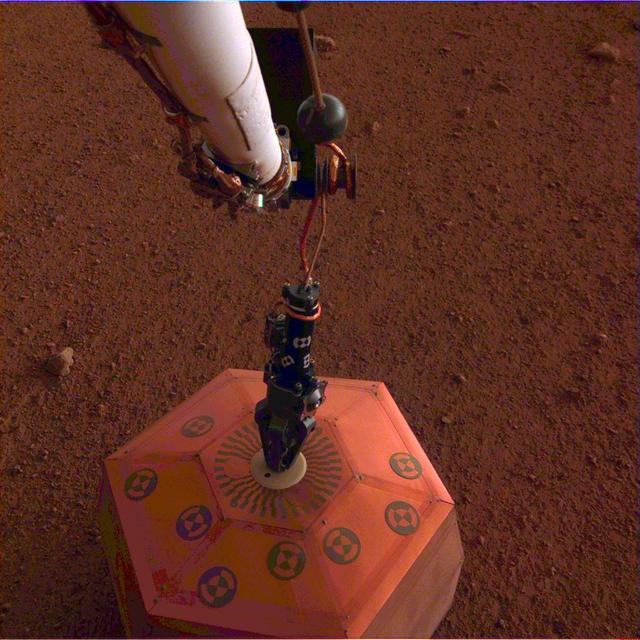
NASA's InSight lander placed its seismometer onto Mars on Dec. 19, 2018. This was the first time a seismometer had ever been placed onto the surface of another planet. The seismometer is the copper-colored object in this image, which was taken around Martian dusk. The seismometer, called Seismic Explorations for Interior Structure (SEIS), will measure seismic waves caused by marsquakes, meteorite strikes and other phenomena. Watching how these waves travel through Mars' interior will let scientists study how the planet's crust, mantle and core are layered. It will also reveal more about how all rocky bodies are formed, including Earth and its Moon. https://photojournal.jpl.nasa.gov/catalog/PIA22956
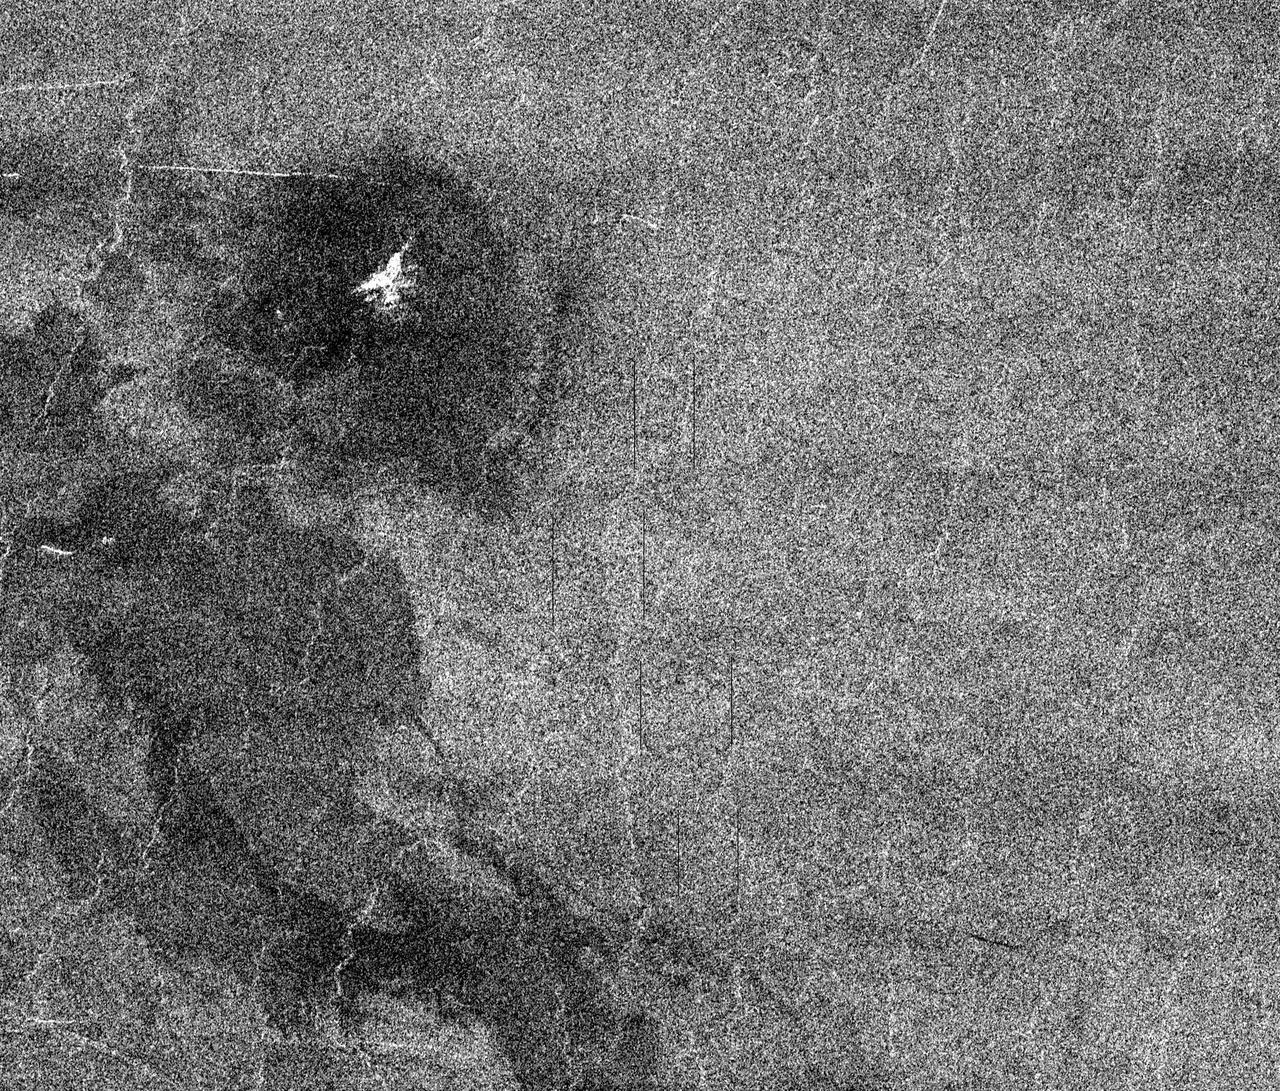
This full resolution mosaiced image covers an area of approximately 100 kilometers by 120 kilometers (62 by 74 miles) and is located in the Lakshmi region of Venus at 47 degrees north latitude and 334 east longitude. Due to the dense Venusian atmosphere, primary impact craters of less than a 3 kilometer (2 mile) diameter are nonexistent. The dark circular region and associated central bright feature in this image are thought to be the remnants of a meteoroid smaller than the size necessary to create an impact crater entering the atmosphere at a low velocity (approximately 350 meters/second.) The central bright feature appears to be a cluster of small secondary impacts, ejecta and debris from the original meteor that broke up in the atmosphere. Even though most of the meteorite did not hit the surface, the atmospheric shock wave could be great enough to modify the surrounding region. One explanation for this radar dark circular formation, called dark margins, could be that the shock wave was energetic enough to pulverize the surface (smooth surfaces generally appear radar dark.) Another explanation is that the surface could be blanketed by a fine material that was formed by the original meteor's breakup through the atmosphere. More than half of the impact craters on Venus have associated dark margins, and most of these are prominently located left of center of the crater. This is another effect which could be caused by the dense atmosphere of Venus. http://photojournal.jpl.nasa.gov/catalog/PIA00477
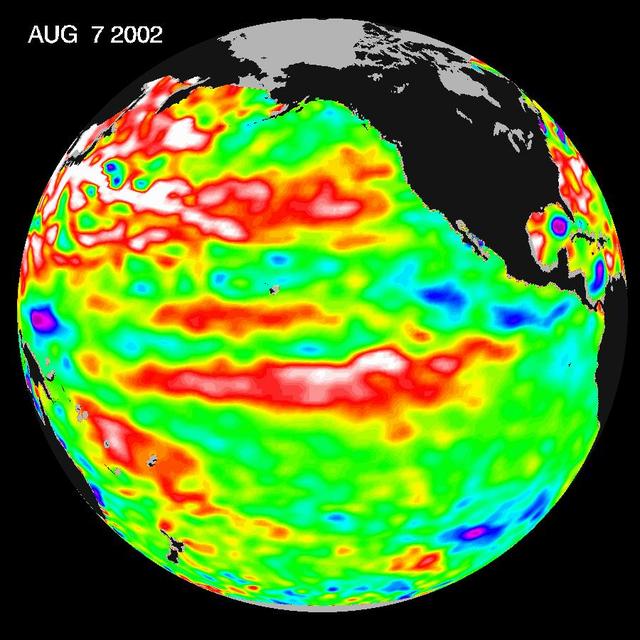
This Topex/Poseidon image of sea-surface heights was taken during a 10-day collection cycle ending August 7, 2002. Sea-surface heights are a measure of how much heat is stored in the ocean below to influence future planetary climate events. Since May 2001, there have been a series of warm Kelvin waves--eastward-moving ocean waves that cross the equatorial Pacific in about two months. A sizable one arrived at the South American coast last February, raising the ocean temperature by 2 degrees Celsius (3.6 degrees Fahrenheit) and triggering the National Oceanic and Atmospheric Administration's forecast for a mild El Niño in 2002. There was another wave in June, followed by the current large pool of warm water in the tropical Pacific that is now moving toward the coast of South America at a speed of 215 kilometers (134 miles) a day and will arrive there in three to four weeks, raising ocean temperatures. Scientists will continue to monitor the Pacific closely for further signs of El Niño formation and intensity. http://photojournal.jpl.nasa.gov/catalog/PIA03855
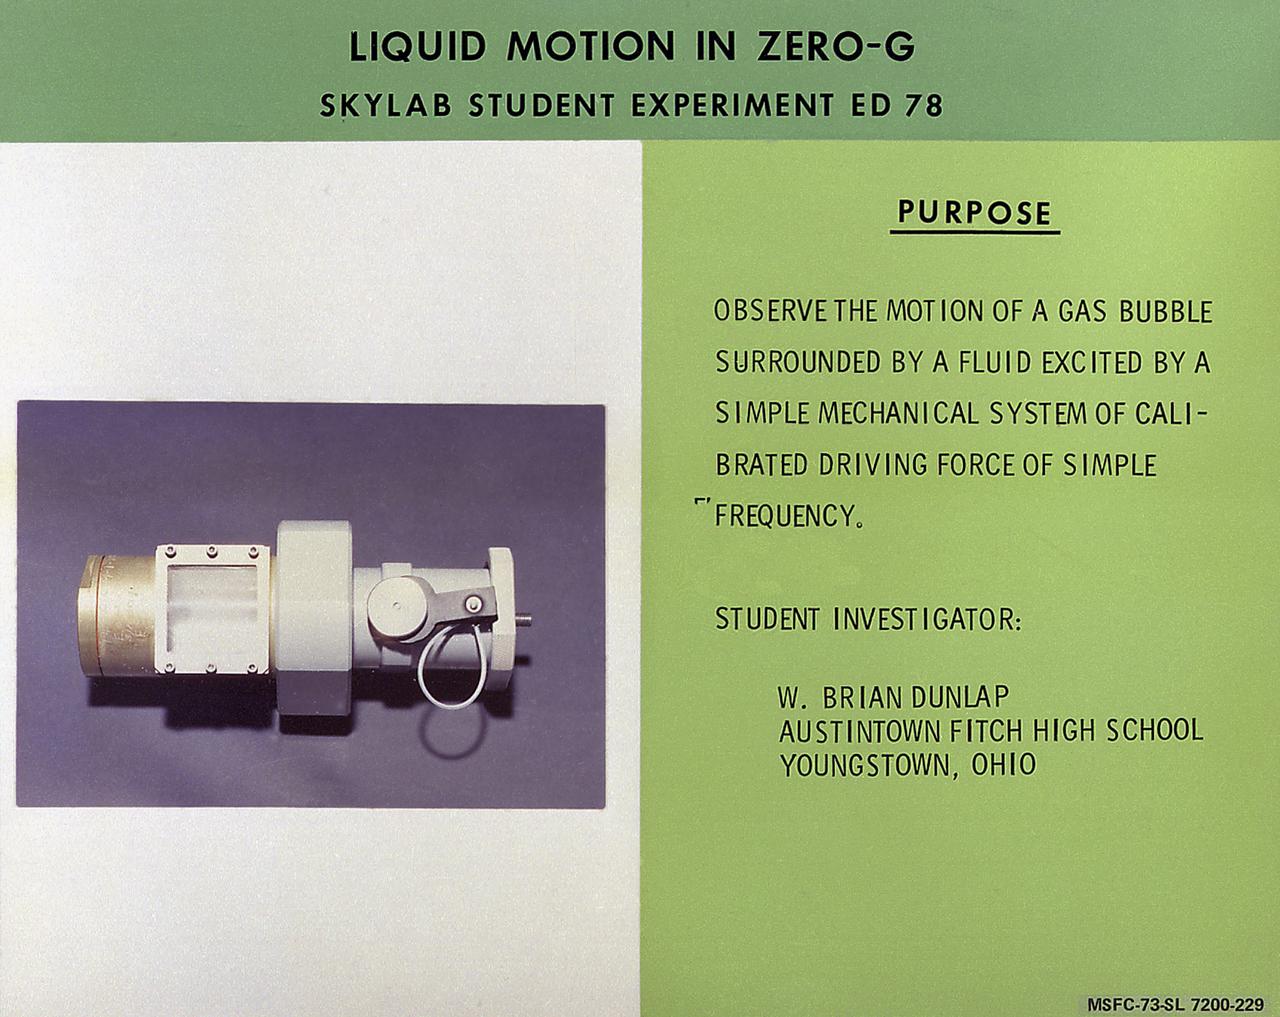
W. Brian Dunlap of Youngstown, Ohio, proposed Skylab student experiment ED-78, Liquid Motion in Zero-G, a study of wave motion in a liquid. He was particularly interested in comparing surface waves over a liquid in zero-gravity with those occurring on Earth. In space, with the absence of gravity, a liquid does not necessarily take the shape of its container as it does on Earth. Adhesion forces may hold the liquid in contact with its container, but the liquid can also assume a free-floating condition. It was in this latter state that Dunlap wished to examine the behavior of surface waves. Data were recorded on videotape and subsequently converted to 16-mm film. Dunlap analyzed these data to determine periods of oscillation of free-floating globules and found agreement with the theory to be much better than expected. In March 1972, NASA and the National Science Teachers Association selected 25 experiment proposals for flight on Skylab. Science advisors from the Marshall Space Flight Center aided and assisted the students in developing the proposals for flight on Skylab.

ISS038-E-036501 (28 Jan. 2014) --- This wide field-of-view image photographed by an Expedition 38 crew member on the International Space Station shows an east-west swath of the southwestern Indian Ocean. Two remote islands, part of the French Southern and Antarctic Lands, appear in the center of the image. Possession Island (right center) and East Island (center) are both only 18 kilometers long. A smaller island, Ile aux Cochons (Pigs Island), lies 100 kilometers to the west. Each island has set up V-shaped trains of waves, like bow waves, as the air flows over the islands from the west (right to left). The bow-wave patterns are overlaid on the low regional stratus (blanket) cloud that is so common in the southern Indian Ocean at 50 degrees south latitude. This view was taken from more than 400 kilometers above the sea surface and reveals relationships that could not be readily understood by someone standing on one of the islands. For example, larger and higher islands produce larger waves. So the largest are being generated by Possession Island (934 meters above sea level at the highest point), and East Island, versus much smaller waves developed downwind of the tiny Ile de Pingouins (340 meters above sea level high, invisible below the cloud deck). Other patterns also can be detected. Waves in an upper layer can be seen casting shadows onto a lower layer (lower left). In the top half of the image the waves are making thicker and thinner zones in the clouds of the lower layer. Wave trains from Possession Island and Ile aux Cochons are interacting in a cross-hatch pattern (center).
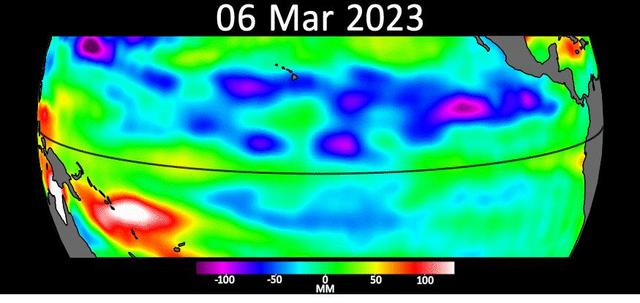
Sea level data from the U.S.-European satellite Sentinel-6 Michael Freilich shows early signs of a developing El Niño along the equatorial Pacific Ocean. The measurements show Kelvin waves, low waves that can be tens of miles (hundreds of kilometers) wide, moving from west to east at the equator towards the west coast of Ecuador. When they form at the equator, Kelvin waves can move warm water – associated with higher sea levels – from the western Pacific to the eastern Pacific. El Niño is a periodic climate phenomenon that can affect weather patterns around the world. The condition can bring cooler, wetter conditions to the U.S. Southwest and drought to countries in the western Pacific such as Indonesia and Australia. El Niño is characterized by higher sea levels and warmer-than-average ocean temperatures along the western coasts of North and South America. Water expands as it warms, so sea levels tend to be higher in places with warmer water. The climate phenomenon is also associated with a weakening of the trade winds. The Sentinel-6 Michael Freilich satellite data shown here covers a seven-week period between the beginning of March and the end of April 2023. By April 24, Figure A, Kelvin waves had piled up warmer water and higher sea levels (shown in red and white) off the coasts of Peru, Ecuador, and Columbia. A series of Kelvin waves starting in spring is a well-known precursor to an El Niño. The waves seen during March and April 2023 are similar to the ones that preceded the 1997-1998 El Niño, one of the most powerful in recorded history. Satellites like Sentinel-6 Michael Freilich can detect Kelvin waves with an instrument called an altimeter that uses radar signals to measure the height of the ocean's surface. Warmer areas show up as higher sea levels. The satellite, named after former NASA Earth Science Division Director Michael Freilich, is one of two that compose the Copernicus Sentinel-6/Jason-CS (Continuity of Service) mission. Animation available at https://photojournal.jpl.nasa.gov/catalog/PIA25776
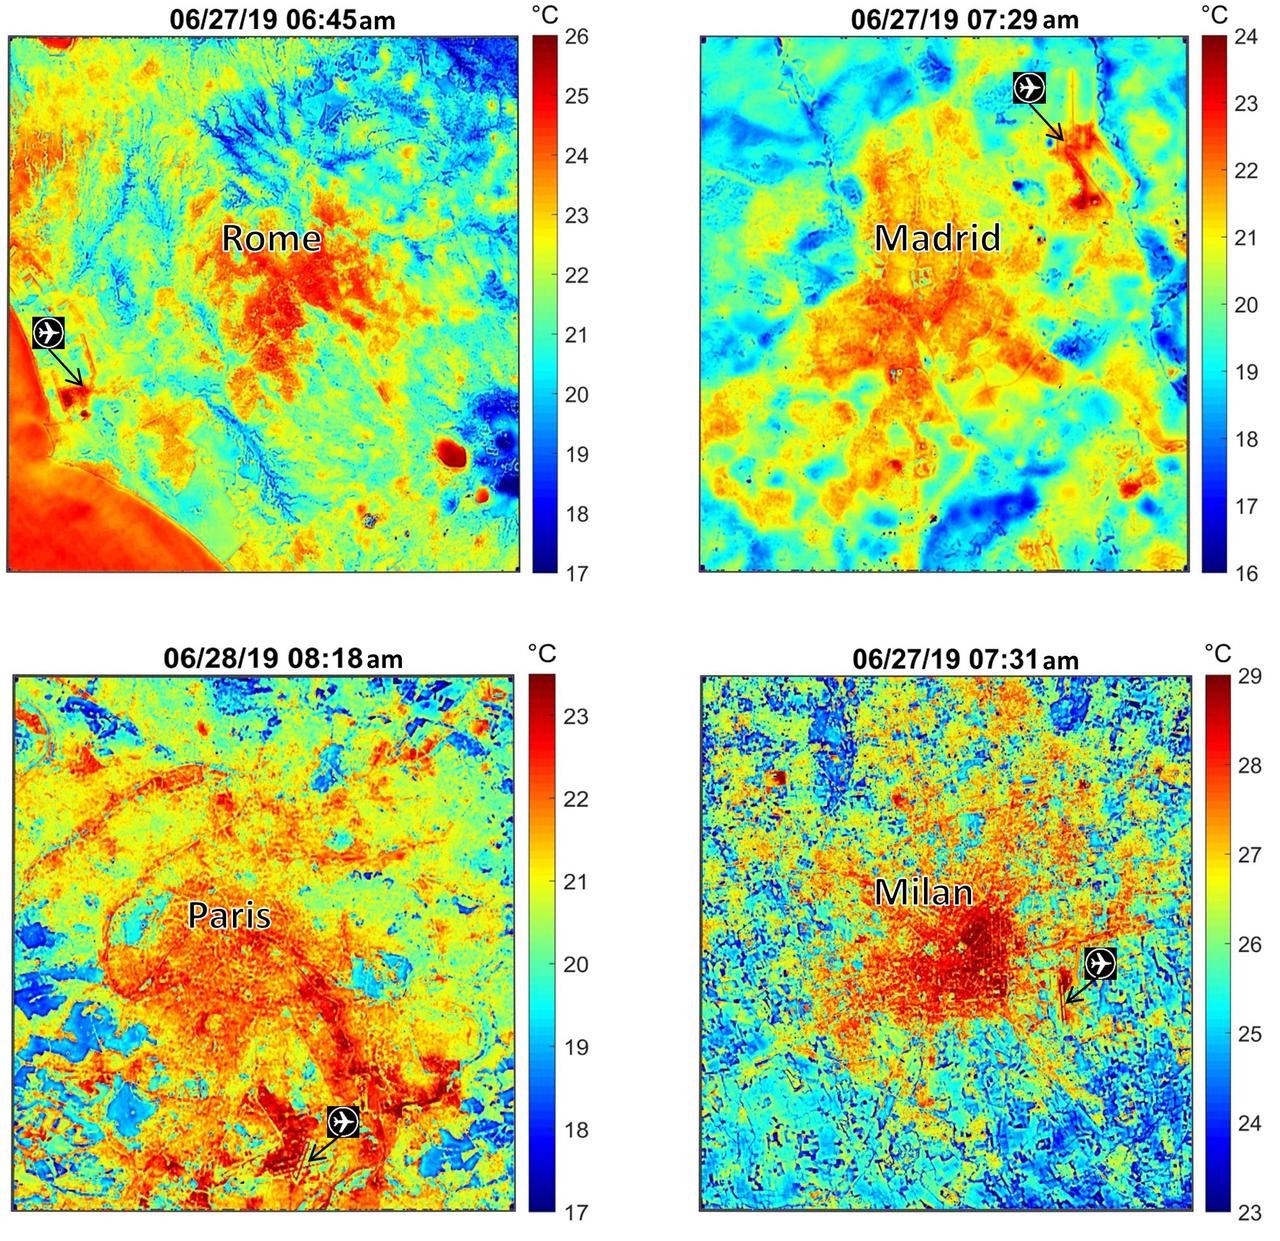
These maps of four European cities show ECOSTRESS surface temperature images acquired in the early mornings of June 27 and 28, 2019, during a heatwave. The images have been sharpened to delineate key features such as airports. Airports and city centers are hotter than surrounding regions because they have more surfaces that retain heat (asphalt, concrete, etc.). ECOSTRESS launched on June 29, 2018, as part of a SpaceX commercial resupply mission to the International Space Station. Its primary mission is to detect plant health by monitoring Earth's surface temperature. However, surface temperature data are also useful in detecting other heat-related phenomena — like heat waves, volcanoes and fires. https://photojournal.jpl.nasa.gov/catalog/PIA23148

Swift currents flow through the Strait of Gibraltar, producing complicated patterns in the surface waters. Some of those patterns are highlighted in the sunglint in this photograph. The Mediterranian Sea is on the upper right, the Atlantic Ocean in in the lower left. Few features can be seen on the Mediterranian side, but current shears (straight lines coming off Spain), several sets of internal waves (impinging on the Spanish continental shelf) and ship wakes can be seen on the Atlantic side, west of Cadiz. Both Tangier and Cadiz show up in the sunglint as well.
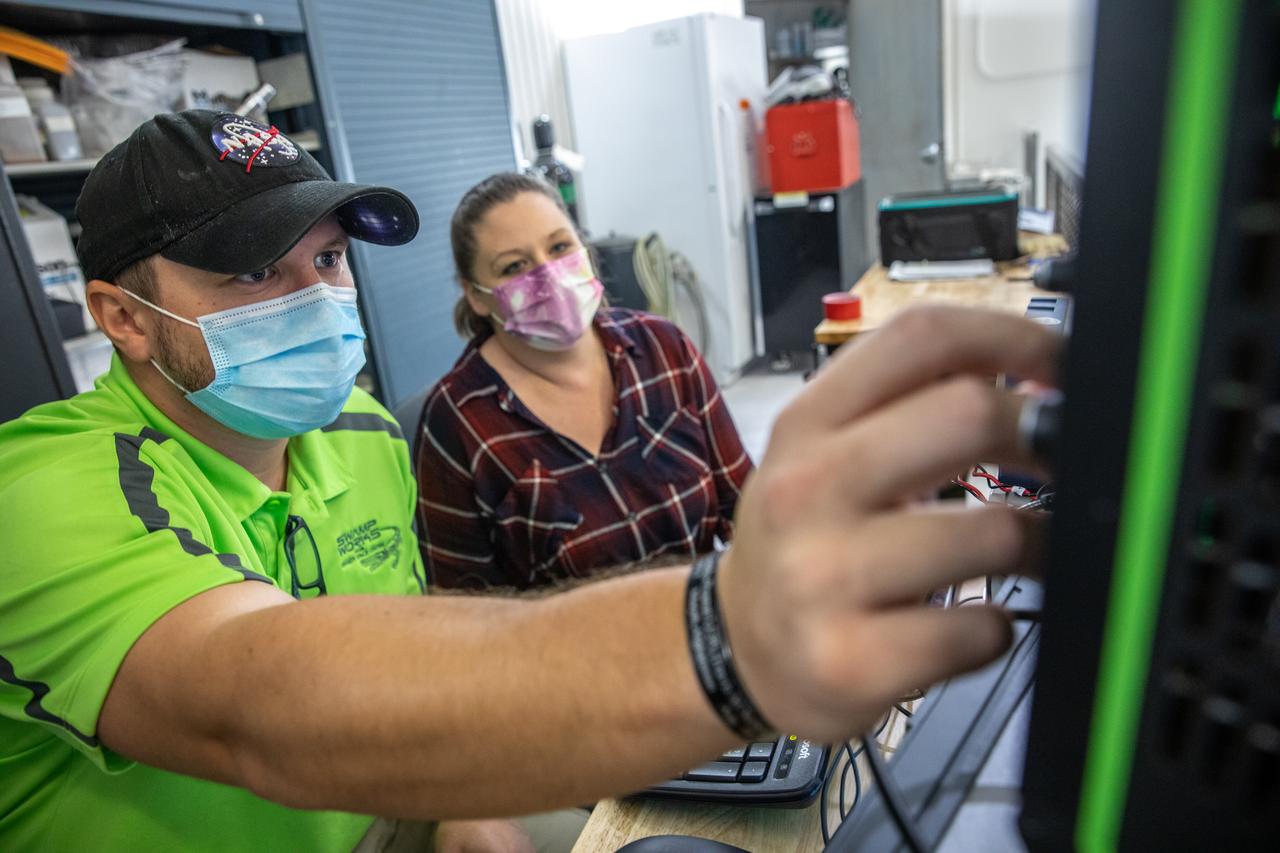
Beverly Kemmerer and Austin Adkins, right, and Austin Langton, perform testing with a Millimeter Wave Doppler Radar at NASA’s Kennedy Space Center’s Granular Mechanics and Regolith Operations Lab on July 16, 2021. The testing at the Florida spaceport is part of a project to identify a suite of instrumentation capable of acquiring a comprehensive set of flight data from a lunar lander. Researchers at NASA will use that data to validate computational models being developed to predict plume surface interaction effects on the Moon.

iss071e045508 (April 25, 2024) --- Cosmonauts Nikolai Chub (waving) and Oleg Kononenko are pictured outside of the International Space Station wearing their Orlan spacesuits during a four-hour and 36-minute spacewalk. During their excursion they worked on the Russian segment of the complex completing the deployment of one panel on a synthetic radar communications system. The duo also installed equipment and experiments to analyze the level of corrosion on station surfaces and modules.
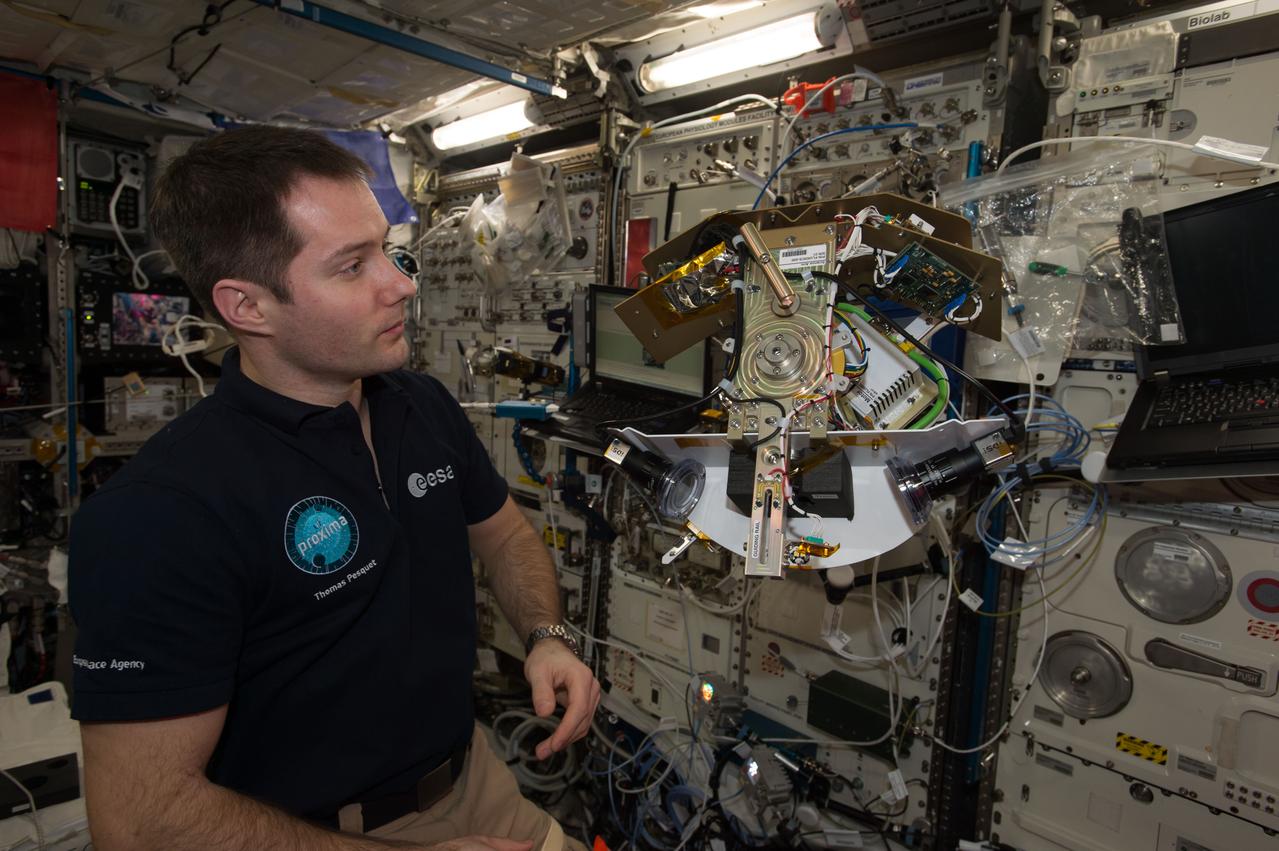
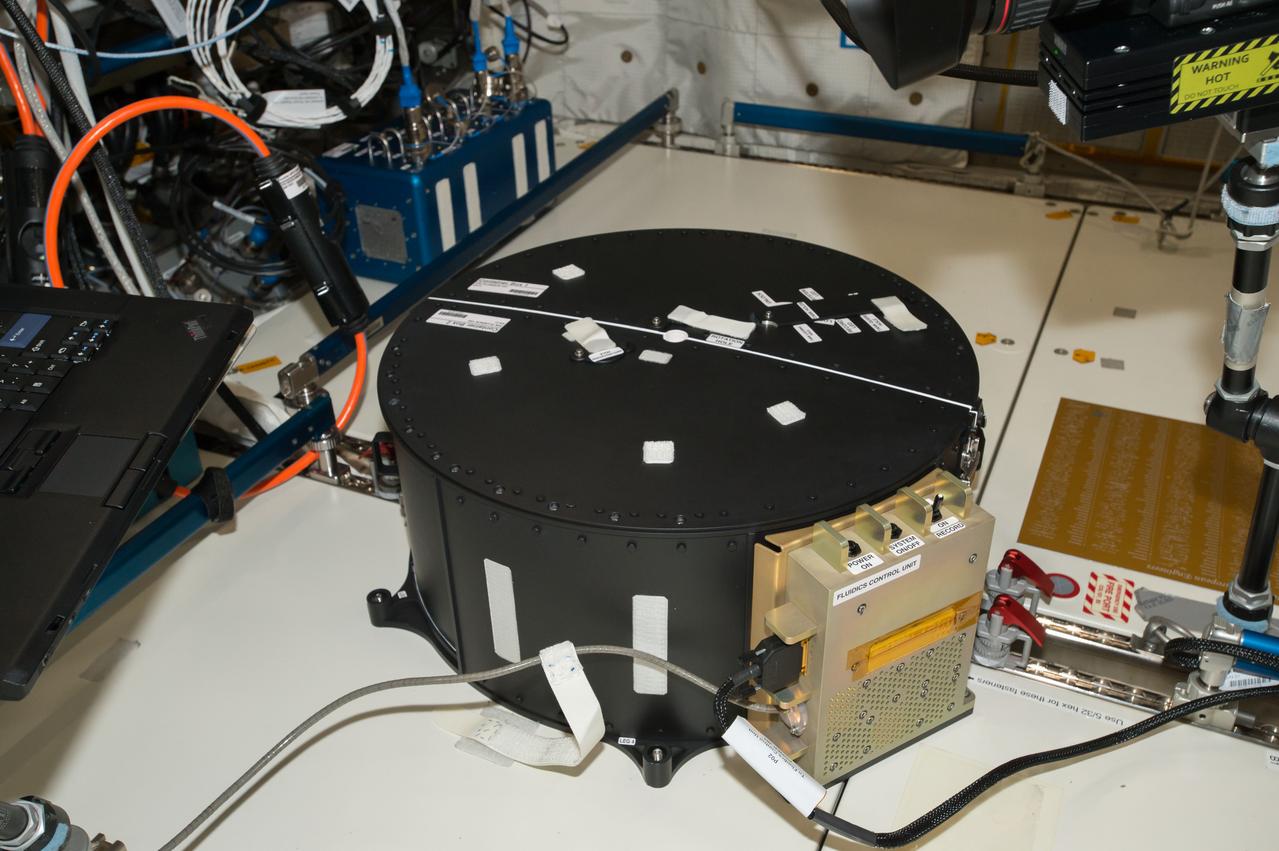
iss051e033986 (5/2/2016) --- European Space Agency (ESA) astronaut Thomas Pesquet is photographed with the assembled Science Arm and Motor for the Fluid Dynamics in Space (FLUIDICS) experiment. Image was taken in the Columbus European Laboratory during preparations for the first run of the experiment. The FLUIDICS investigation evaluates the Center of Mass (CoM) position regarding a temperature gradient on a representation of a fuel tank. The observation of capillary wave turbulence on the surface of a fluid layer in a low-gravity environment can provide insights into measuring the existing volume in a sphere.
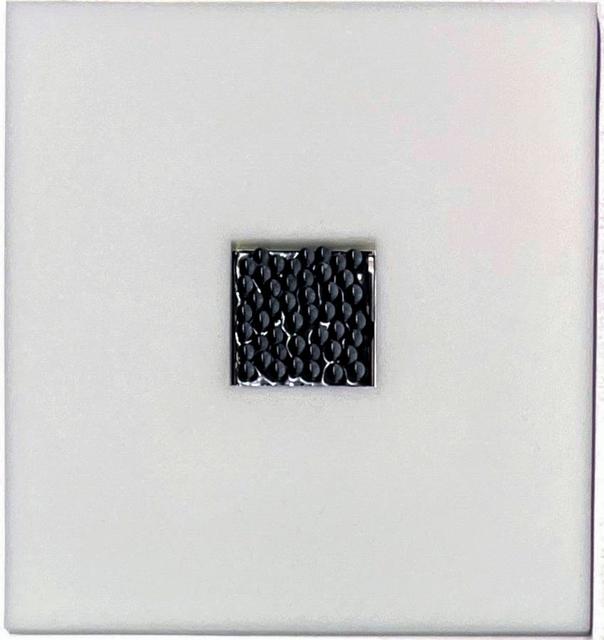
jsc2023e053548 (3/3/2023) --- Granular Sound: inside surface of a sample cell wall, covered with foam for acoustic decoupling, with a shear-piezo mounted at its center. The shear-piezo is covered with glued-on glass beads to facilitate transmission of tangential forces. Two such shear-piezos are installed opposite of eachother – one for emission, one for reception of shear waves. Image courtesy of DLR-MP.
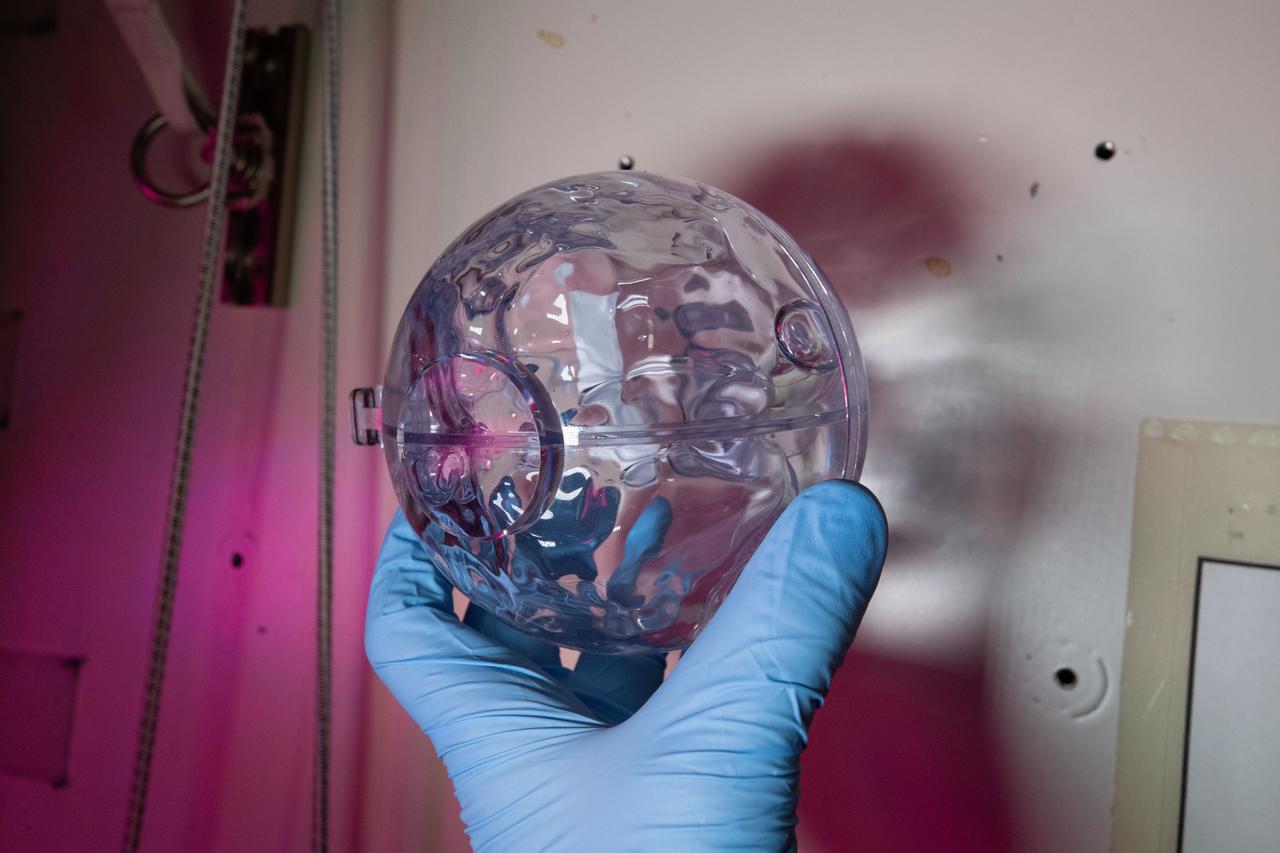
iss066e146847 (2/22/2022) --- A view of a transparent FLUIDICS sphere aboard the International Space Station (ISS). The FLUIDICS investigation evaluates the Center of Mass (CoM) position regarding a temperature gradient on a representation of a fuel tank. The observation of capillary wave turbulence on the surface of a fluid layer in a low-gravity environment can provide insights into measuring the existing volume in a sphere.
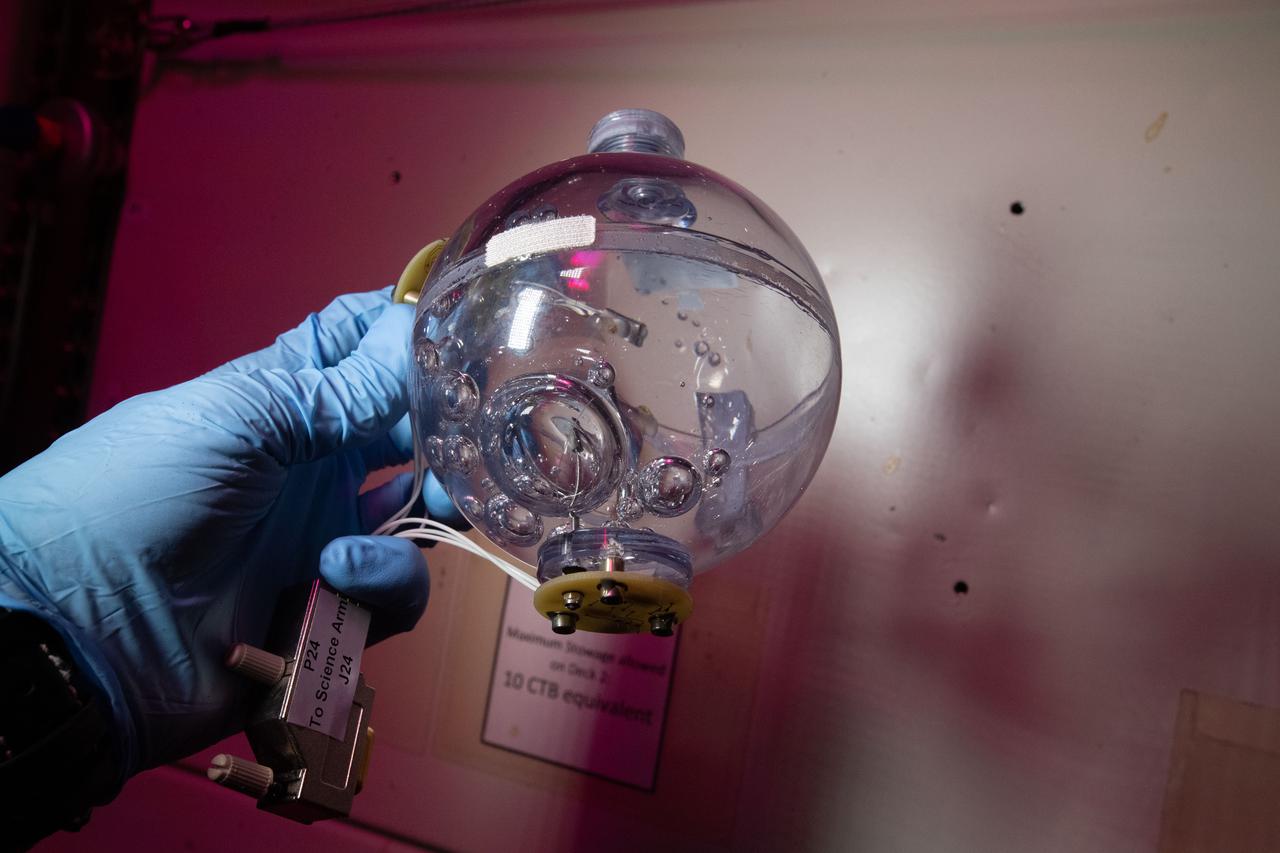
iss066e146884 (2/22/2022) --- A view of a transparent FLUIDICS sphere aboard the International Space Station (ISS). The FLUIDICS investigation evaluates the Center of Mass (CoM) position regarding a temperature gradient on a representation of a fuel tank. The observation of capillary wave turbulence on the surface of a fluid layer in a low-gravity environment can provide insights into measuring the existing volume in a sphere.
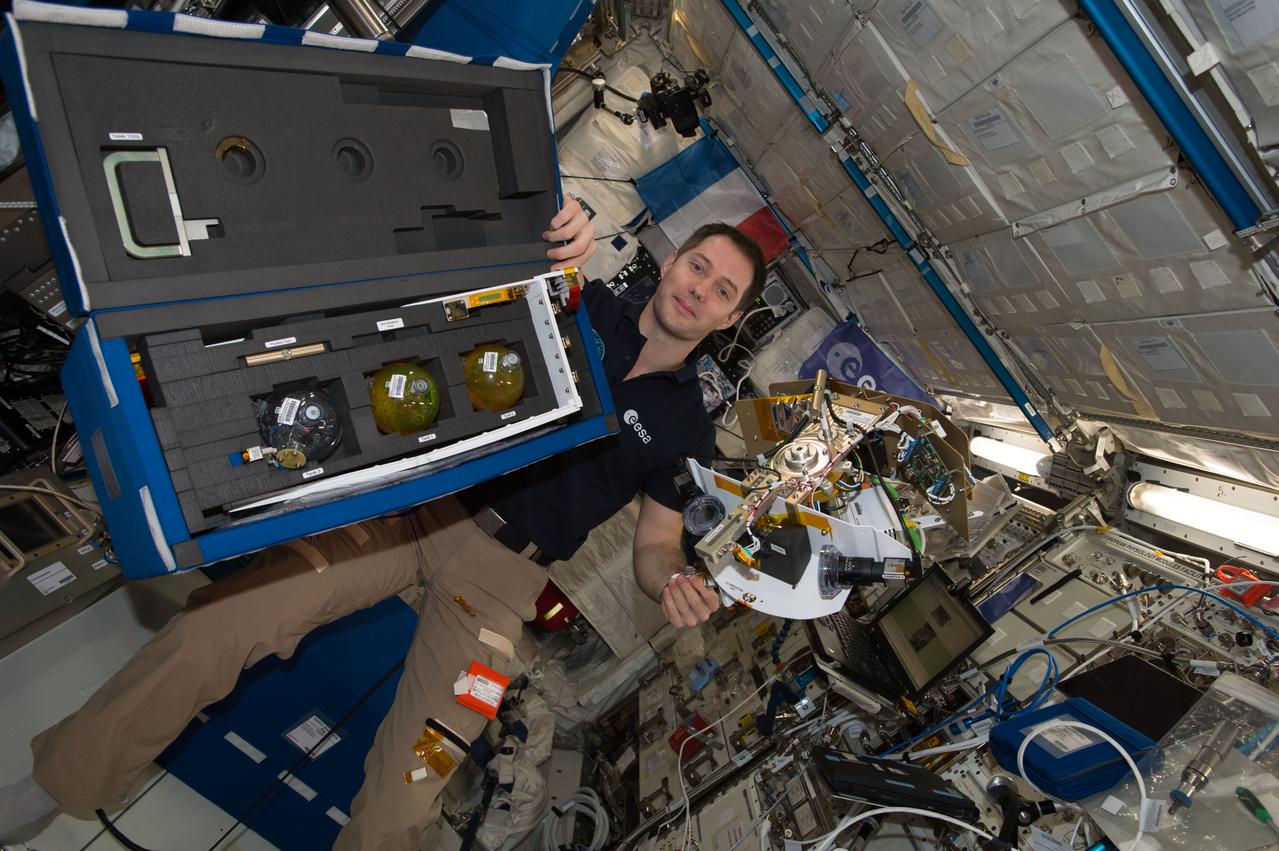
iss051e033988 (5/2/2017) --- European Space Agency (ESA) astronaut Thomas Pesquet is photographed with the Tanks Bag and Science Arm for the Fluid Dynamics in Space (FLUIDICS) experiment. Image was taken in the Columbus European Laboratory during preparations for the first run of the experiment. The FLUIDICS investigation evaluates the Center of Mass (CoM) position regarding a temperature gradient on a representation of a fuel tank. The observation of capillary wave turbulence on the surface of a fluid layer in a low-gravity environment can provide insights into measuring the existing volume in a sphere.
iss051e034001 (5/2/2017) --- Documentation of the Container Box attached to the COL1D1-D2 Seat Track during the first run of the Fluid Dynamics in Space (FLUIDICS) experiment. Image was taken in the Columbus European Laboratory. The FLUIDICS investigation evaluates the Center of Mass (CoM) position regarding a temperature gradient on a representation of a fuel tank. The observation of capillary wave turbulence on the surface of a fluid layer in a low-gravity environment can provide insights into measuring the existing volume in a sphere.
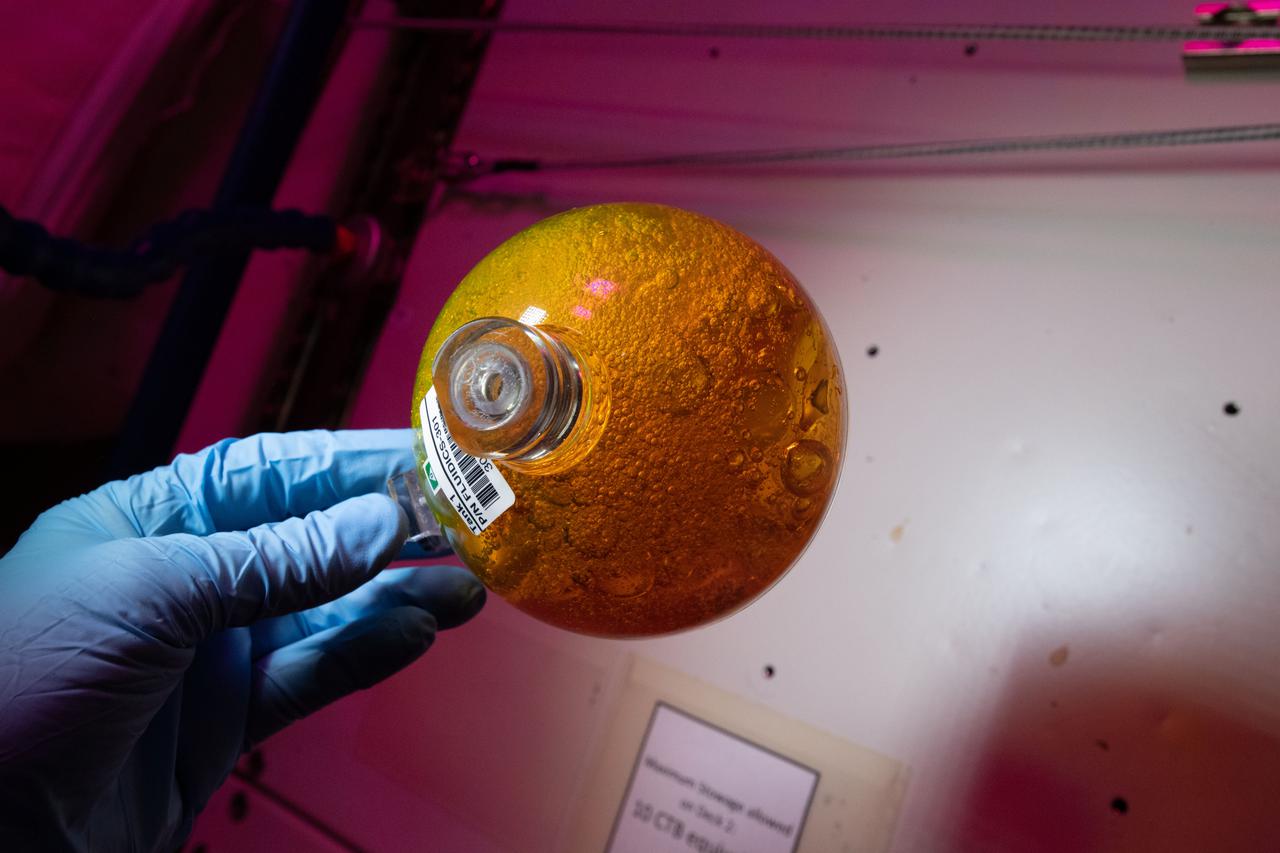
iss066e146914 (2/22/2022) --- A view of a transparent FLUIDICS sphere aboard the International Space Station (ISS). The FLUIDICS investigation evaluates the Center of Mass (CoM) position regarding a temperature gradient on a representation of a fuel tank. The observation of capillary wave turbulence on the surface of a fluid layer in a low-gravity environment can provide insights into measuring the existing volume in a sphere.
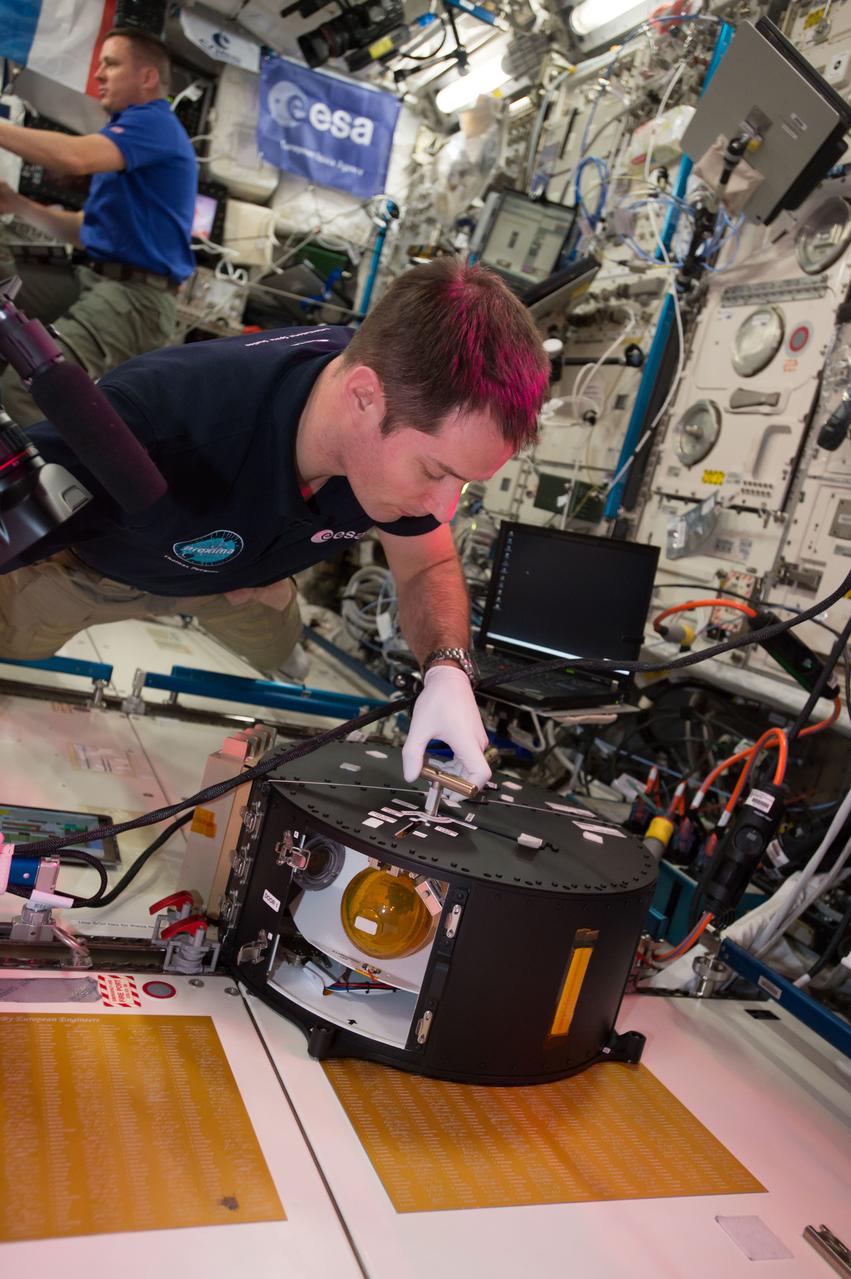
iss051e036148 (5/3/2016) --- European Space Agency (ESA) astronaut Thomas Pesquet works with Fluid Dynamics in Space (FLUIDICS) hardware during the completion of experiment runs. FE Jack Fischer is visible in the background. Image was taken in the Columbus European Laboratory. The FLUIDICS investigation evaluates the Center of Mass (CoM) position regarding a temperature gradient on a representation of a fuel tank. The observation of capillary wave turbulence on the surface of a fluid layer in a low-gravity environment can provide insights into measuring the existing volume in a sphere.
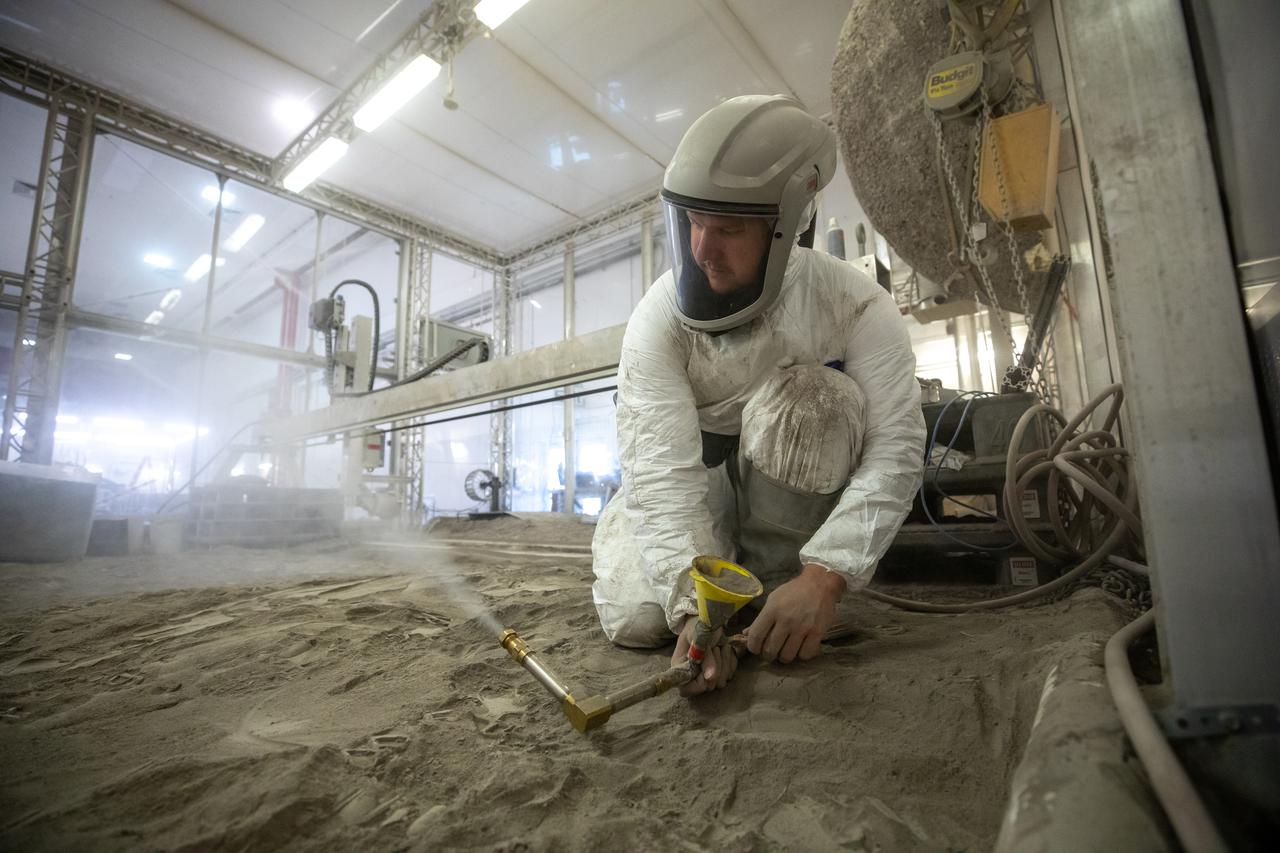
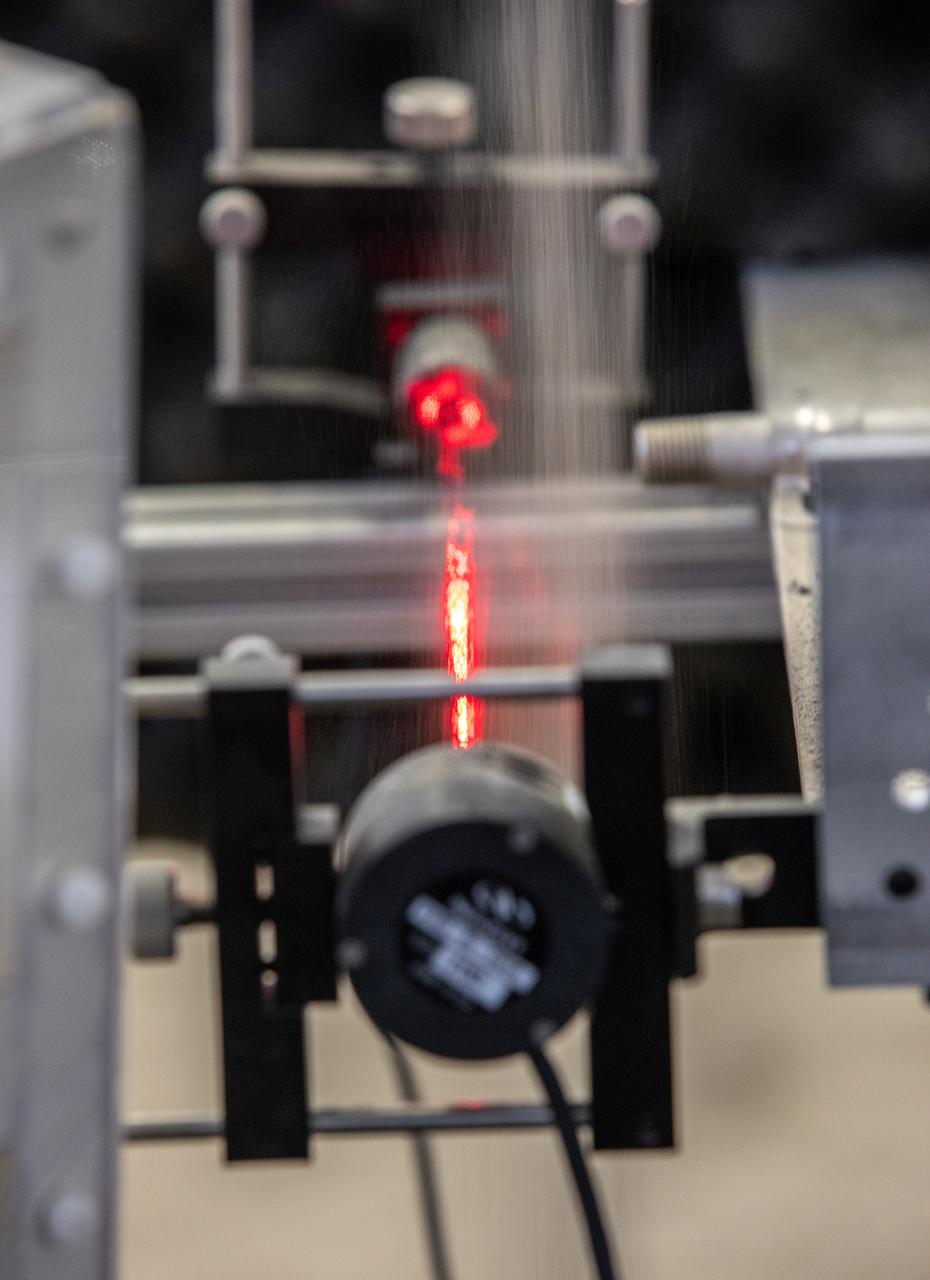
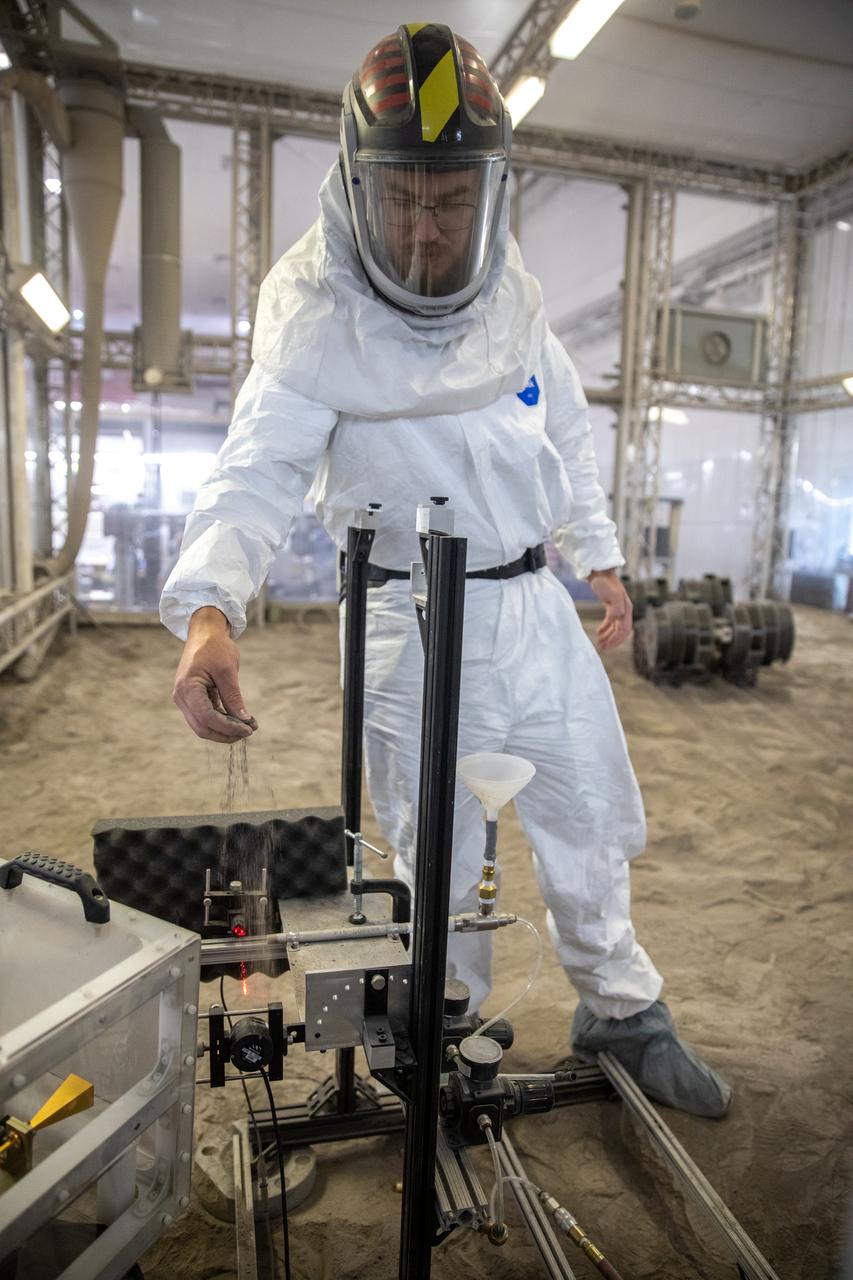
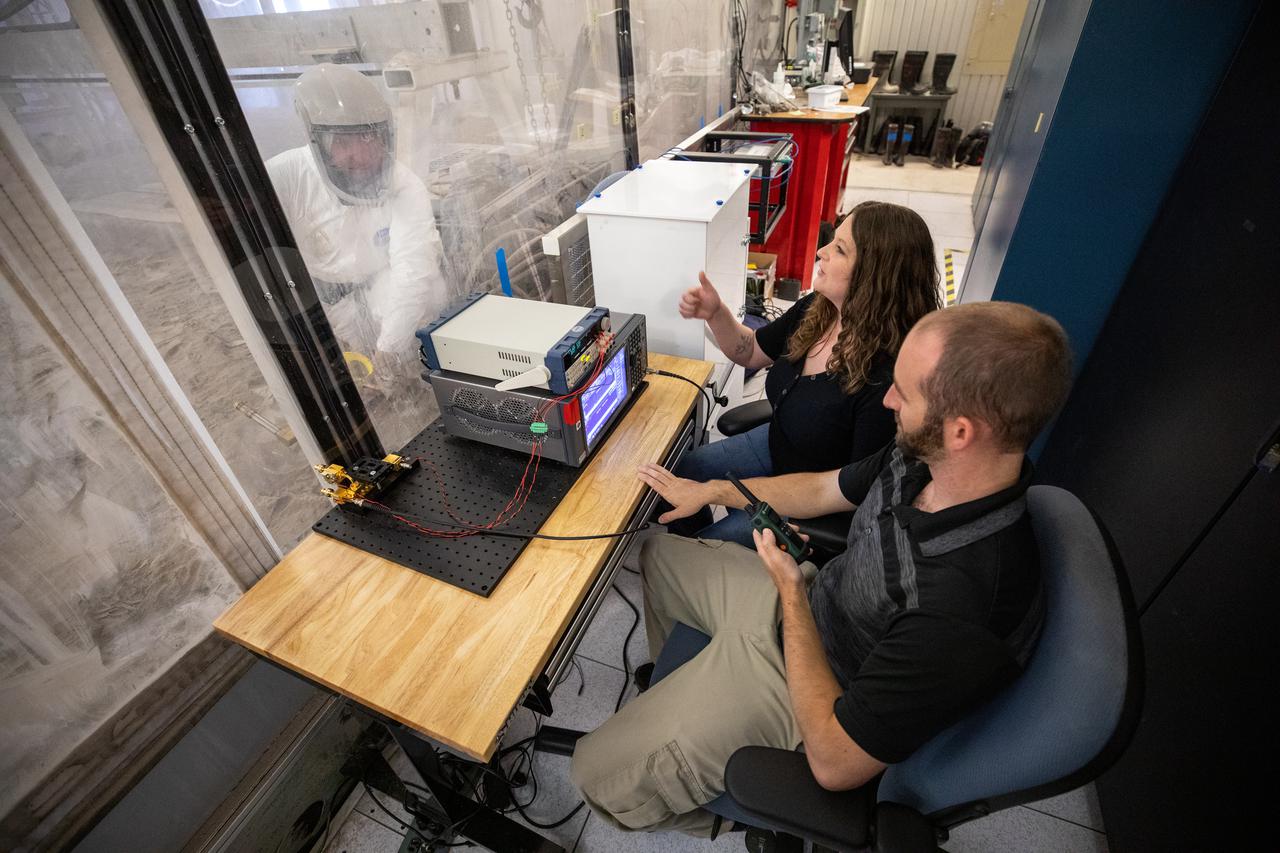
Austin Langton, a researcher at NASA's Kennedy Space Center in Florida, creates a fine spray of the regolith simulant BP-1, to perform testing with a Millimeter Wave Doppler Radar at the Granular Mechanics and Regolith Operations Lab on July 16, 2021. The testing occurred inside the "Big Bin," an enclosure at Swamp Works that holds 120 tons of regolith simulant. The testing at the Florida spaceport is part of a project to predict plume surface interaction effects on the Moon, with testing happening at Kennedy, and NASA's Marshal Space Flight Center and Glenn Research Center.
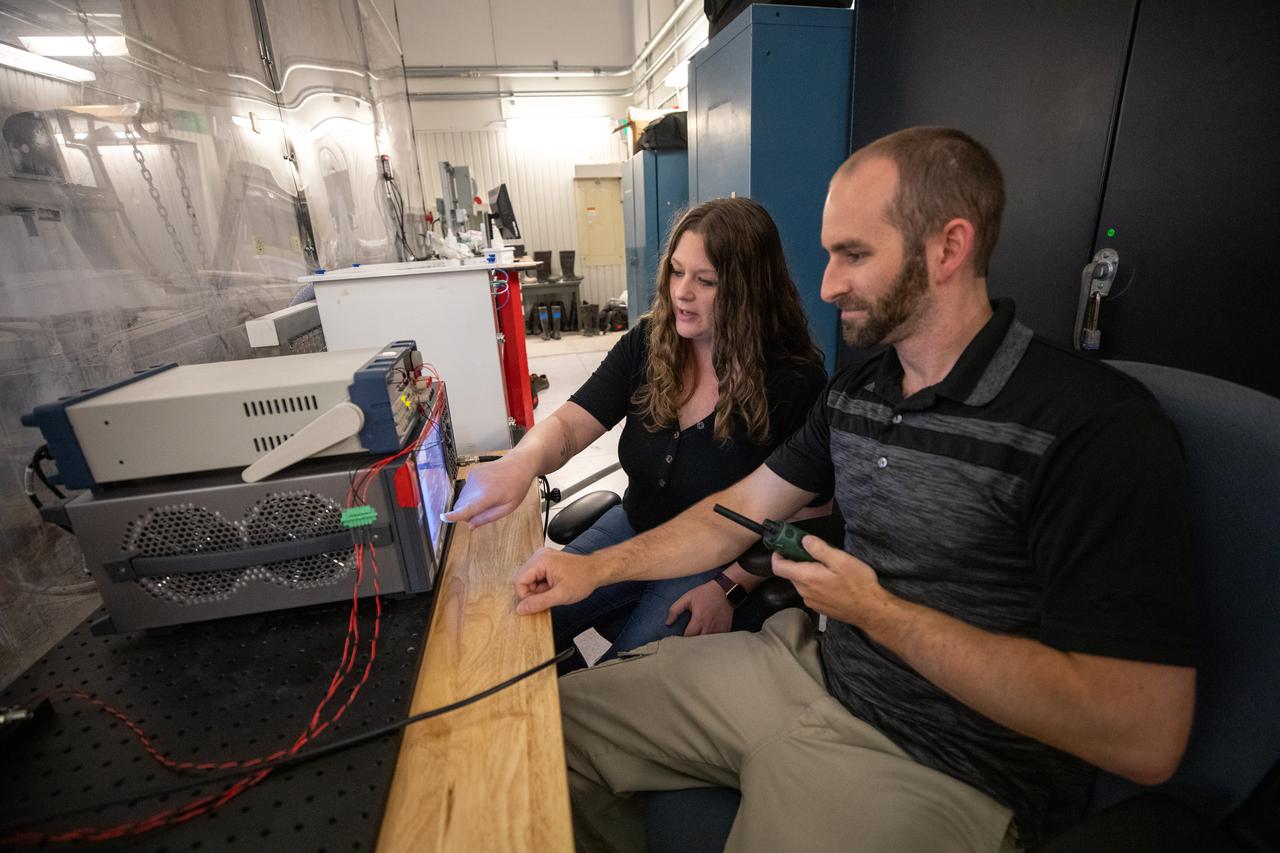
Beverly Kemmerer and Austin Adkins perform testing with a Millimeter Wave Doppler Radar at NASA’s Kennedy Space Center’s Granular Mechanics and Regolith Operations Lab on July 16, 2021. The testing at the Florida spaceport is part of a project to identify a suite of instrumentation capable of acquiring a comprehensive set of flight data from a lunar lander. Researchers at NASA will use that data to validate computational models being developed to predict plume surface interaction effects on the Moon.

This VIS image shows a double impact - two meteors hitting simultaneously. The two meteors would have started as a single object, at some point prior to impact the object separated into parts. The two parts followed the same path to the surface, hitting at the same time in close proximity. The linear feature at the center is where the shock waves intersect, its straightness showing the impacts were simultaneous (and nearly equal in size). The ejecta created from the impact tends to be focused to the sides of the doublet, often forming a butterfly-like ejecta blanket. The butterfly pattern is most common at oblique angle impacts, but can also form by the interaction of the impact shock waves. These craters are located in Utopia Planitia. Orbit Number: 72448 Latitude: 27.1977 Longitude: 95.4916 Instrument: VIS Captured: 2018-04-14 13:36 https://photojournal.jpl.nasa.gov/catalog/PIA22606
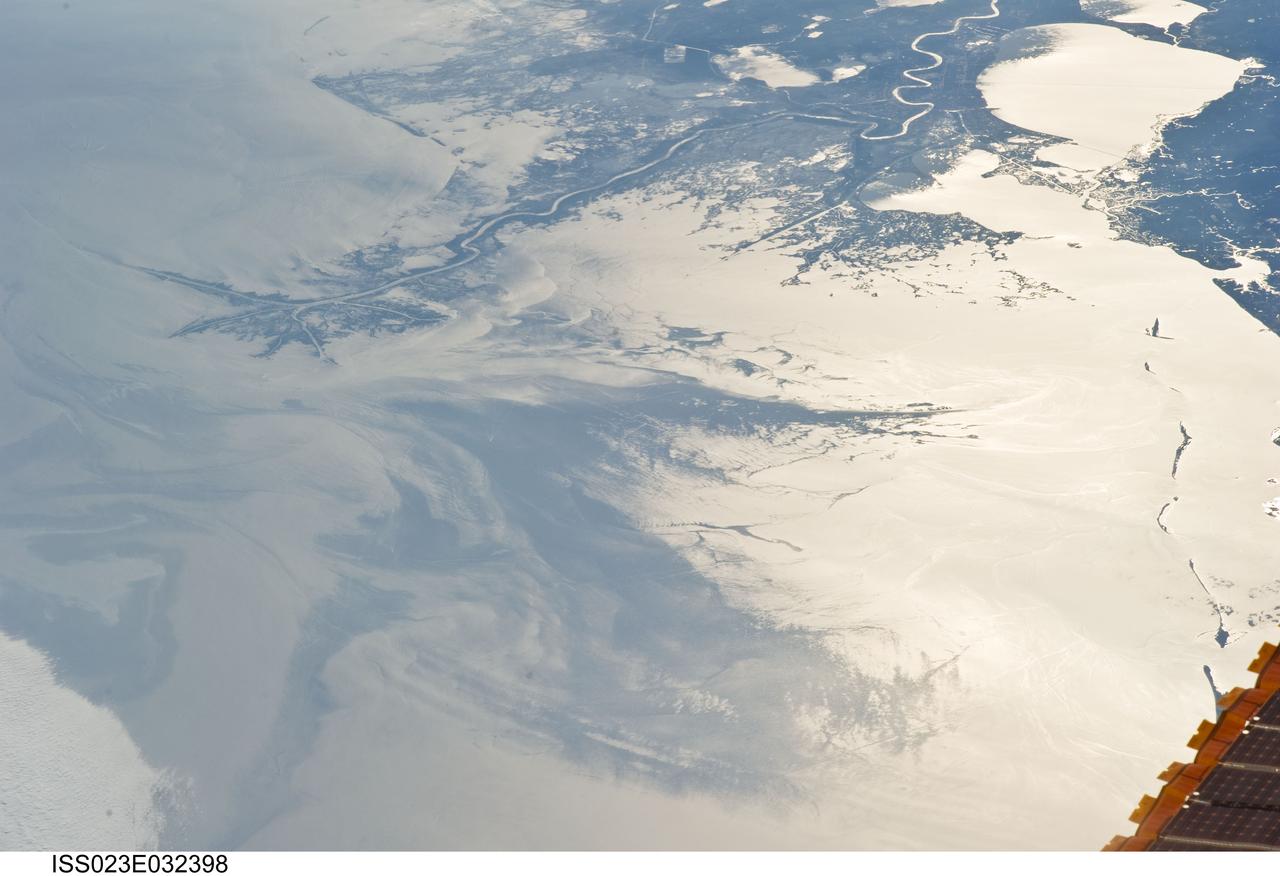
ISS023-E-032398 (4 May 2010) --- Japan Aerospace Exploration Agency (JAXA) astronaut Soichi Noguchi, Expedition 23 flight engineer, photographed the Mississippi Delta showing the oil slick in the Gulf of Mexico on May 4, 2010. Part of the river delta and nearby Louisiana coast appear dark in the sunglint. This phenomenon is caused by sunlight reflecting off the water surface, in a mirror-like manner, directly back towards the astronaut observer onboard the International Space Station (ISS). The sunglint improves the identification of the oil spill which is creating a different water texture (and therefore a contrast) between the smooth and rougher water of the reflective ocean surface. Other features which cause a change in surface roughness that can be seen in sunglint are wind gusts, naturally occurring oils that will be gathered by and take the form of water currents or wave patterns, and less windy areas behind islands.

ISS023-E-032396 (4 May 2010) --- Japan Aerospace Exploration Agency (JAXA) astronaut Soichi Noguchi, Expedition 23 flight engineer, photographed the tail end of the Mississippi Delta showing the oil slick in the Gulf of Mexico on May 4, 2010. Part of the river delta and nearby Louisiana coast appear dark in the sunglint. This phenomenon is caused by sunlight reflecting off the water surface, in a mirror-like manner, directly back towards the astronaut observer onboard the International Space Station (ISS). The sunglint improves the identification of the oil spill which is creating a different water texture (and therefore a contrast) between the smooth and rougher water of the reflective ocean surface. Other features which cause a change in surface roughness that can be seen in sunglint are wind gusts, naturally occurring oils that will be gathered by and take the form of water currents or wave patterns, and less windy areas behind islands.
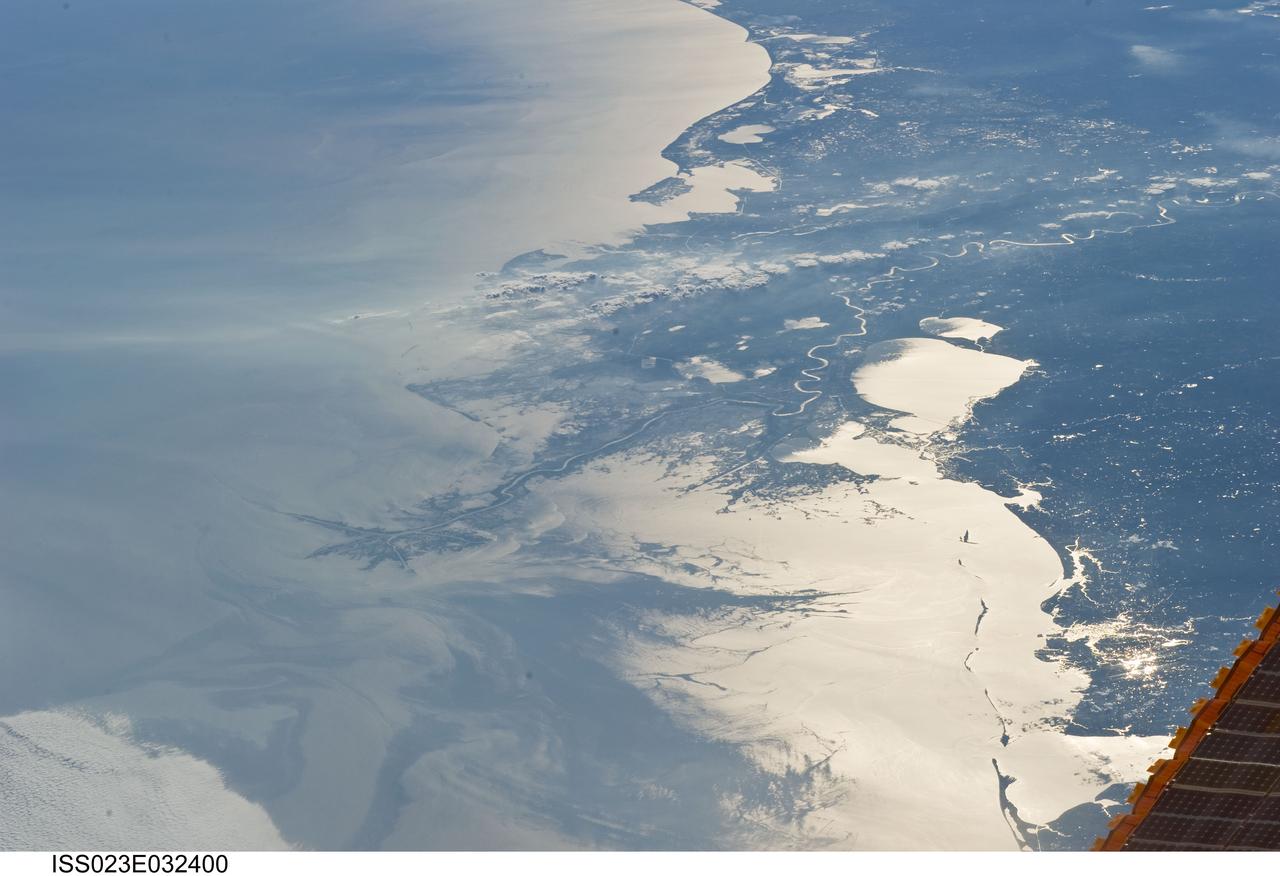
ISS023-E-032400 (4 May 2010) --- Japan Aerospace Exploration Agency (JAXA) astronaut Soichi Noguchi, Expedition 23 flight engineer, photographed the Mississippi Delta showing the oil slick in the Gulf of Mexico on May 4, 2010. Part of the river delta and nearby Louisiana coast appear dark in the sunglint. This phenomenon is caused by sunlight reflecting off the water surface, in a mirror-like manner, directly back towards the astronaut observer onboard the International Space Station (ISS). The sunglint improves the identification of the oil spill which is creating a different water texture (and therefore a contrast) between the smooth and rougher water of the reflective ocean surface. Other features which cause a change in surface roughness that can be seen in sunglint are wind gusts, naturally occurring oils that will be gathered by and take the form of water currents or wave patterns, and less windy areas behind islands.

NASA release July 27, 2011 These jets, known as spicules, were captured in an SDO image on April 25, 2010. Combined with the energy from ripples in the magnetic field, they may contain enough energy to power the solar wind that streams from the sun toward Earth at 1.5 million miles per hour. Credit: NASA/SDO/AIA Like giant strands of seaweed some 32,000 miles high, material shooting up from the sun sways back and forth with the atmosphere. In the ocean, it's moving water that pulls the seaweed along for a ride; in the sun's corona, magnetic field ripples called Alfvén waves cause the swaying. For years these waves were too difficult to detect directly, but NASA's Solar Dynamics Observatory (SDO) is now able to track the movements of this solar "seaweed" and measure how much energy is carried by the Alfvén waves. The research shows that the waves carry more energy than previously thought, and possibly enough to drive two solar phenomena whose causes remain points of debate: the intense heating of the corona to some 20 times hotter than the sun's surface and solar winds that blast up to 1.5 million miles per hour. "SDO has amazing resolution so you can actually see individual waves," says Scott McIntosh at the National Center for Atmospheric Research in Boulder, Colo. "Now we can see that instead of these waves having about 1000th the energy needed as we previously thought, it has the equivalent of about 1100W light bulb for every 11 square feet of the sun's surface, which is enough to heat the sun's atmosphere and drive the solar wind." To read more go to: <a href="http://www.nasa.gov/mission_pages/sdo/news/alfven-waves.html" rel="nofollow">www.nasa.gov/mission_pages/sdo/news/alfven-waves.html</a> <b><a href="http://www.nasa.gov/centers/goddard/home/index.html" rel="nofollow">NASA Goddard Space Flight Center</a></b> enables NASA’s mission through four scientific endeavors: Earth Science, Heliophysics, Solar System Exploration, and Astrophysics. Goddard plays a leading role in NASA’s accomplishments by contributing compelling scientific knowledge to advance the Agency’s mission. <b>Follow us on <a href="http://twitter.com/NASA_GoddardPix" rel="nofollow">Twitter</a></b> <b>Like us on <a href="http://www.facebook.com/pages/Greenbelt-MD/NASA-Goddard/395013845897?ref=tsd" rel="nofollow">Facebook</a></b> <b>Find us on <a href="http://web.stagram.com/n/nasagoddard/?vm=grid" rel="nofollow">Instagram</a></b>

Paris was one of many European cities hit by a record-breaking heat wave at the end of June and early July 2025. NASA's Ecosystem Spaceborne Thermal Radiometer Experiment on Space Station (ECOSTRESS) instrument recorded surface temperatures of 82 degrees Fahrenheit (23 degrees Celsius) at 6:57 a.m. local time on July 1. Extreme daytime air temperatures – of over 100 degrees F (38 degrees C) – prompted officials to close the summit of the Eiffel Tower on July 1 and 2. In this visualization of ECOSTRESS data, dark red indicates higher temperatures while green and blue are cooler. The city is peppered with areas of several blocks where surface temperatures reached more than 80 F (27 C), including around the Eiffel Tower, before 7 a.m. The ECOSTRESS instrument measures thermal infrared emissions from Earth's surface. This enables researchers to monitor plant health, the progress of wildfires, land surface temperatures, and the burn risk to people from hot surfaces such as asphalt. Land surface temperatures are hotter than air temperatures during the day. Air temperatures, which are measured out of direct sunlight, are usually what meteorologists report in a weather forecast. https://photojournal.jpl.nasa.gov/catalog/PIA26190
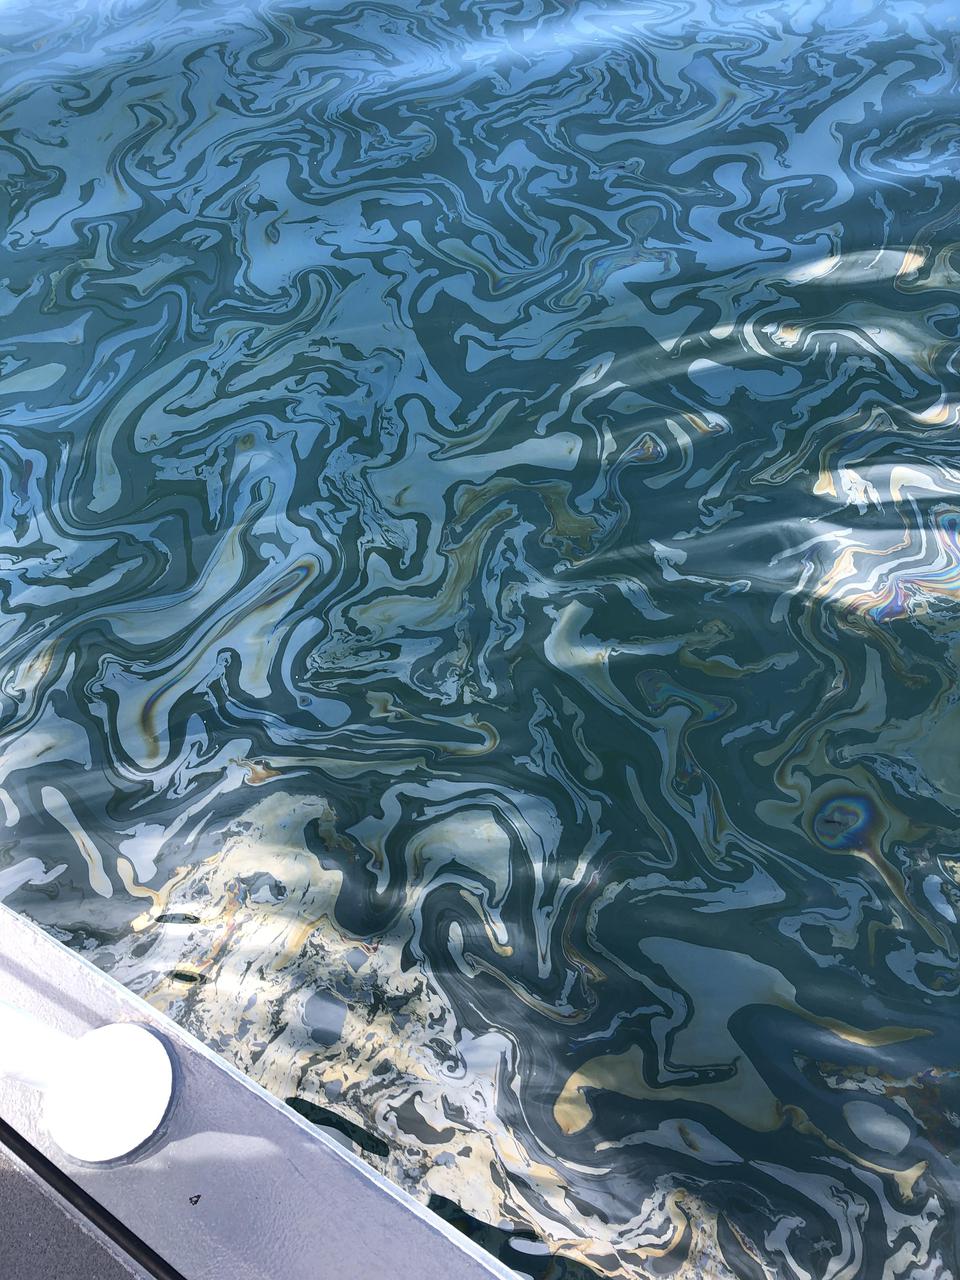
An oil slick from naturally occurring oil seeps off the coast of Santa Barbara, California. The NASA-NOAA Marine Oil Spill Thickness (MOST) project is using the area to test the ability of a radar instrument called UAVSAR to detect the thickness of oil in oil slicks – important information for first responders to oil spills. Having concluded their second field campaign in Santa Barbara at the end of October, 2021, the MOST team is working to develop a way for NOAA – the lead federal agency for detecting and tracking coastal oil spills – to use remote sensing data to determine not just where oil is, but where the thickest parts of it are. NASA's UAVSAR, or Uninhabited Aerial Vehicle Synthetic Aperture Radar, attaches to the fuselage of an airplane that collects a roughly 12-mile-wide (19-kilometer-wide) image of the area. The instrument sends radar pulses down to the surface of the ocean, and the signals that bounce back are used to detect roughness, caused by waves, at the ocean's surface. Oil dampens the waves, creating areas of smoother water that appear darker than the surrounding clean water in the SAR imagery – the thicker the oil, the darker the area appears. When the project concludes, likely in 2023, scientists hope to have a prototype system for detecting oil spill thickness that can be deployed in emergencies. https://photojournal.jpl.nasa.gov/catalog/PIA23699
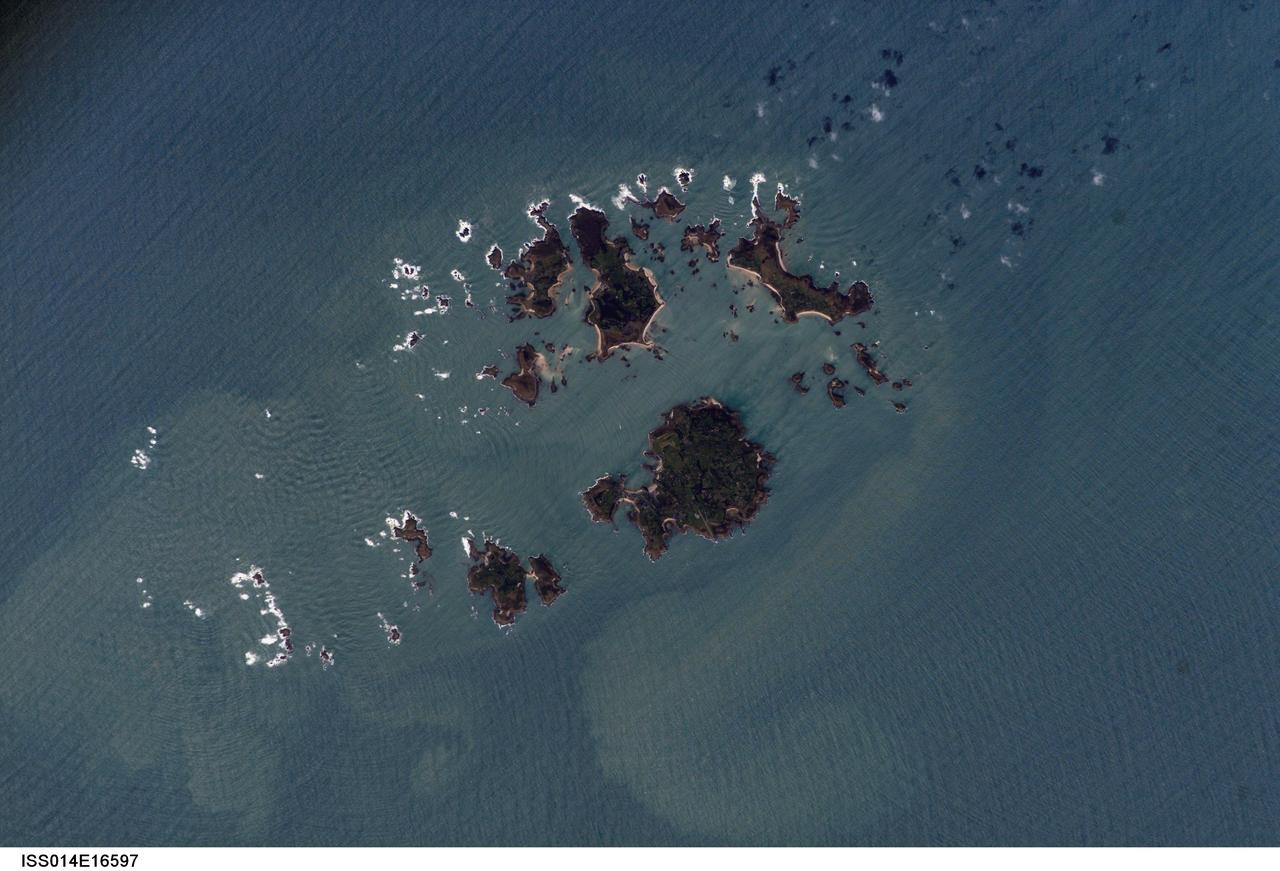
ISS014-E-16597 (10 March 2007) --- Isles of Scilly, United Kingdom is featured in this image photographed by an Expedition 14 crewmember on the International Space Station. The Isles of Scilly, an archipelago of approximately 150 islands, is located some 44 kilometers southwest of the westernmost point of England (Land's End). According to scientists, the islands are an erosional remnant of an ancient granite intrusion, and are notable because they have been inhabited for over 4000 years. Historical and geological evidence cited by NASA scientists on the Isles indicates that many of the islands were larger and/or connected in the recent past--this could be due to local subsidence, rising sea levels, or a combination of both factors. Even today, it is possible to walk between certain islands during low tides. The Isles have been designated a United Kingdom Area of Outstanding Natural Beauty due to their unique landscape, ecology, and historical significance. The potential effect of rising sea level on the Isles is a primary concern for both long-term ecosystem health and human habitability. This image illustrates the geographic configuration of the archipelago, and its effect on ocean wave patterns. Long linear swells oriented northeast-southwest and moving to the southeast (from upper left to lower right) are diffracted (bent) as they approach the coastlines and small shoals of the Isles. The wave diffraction forms complex interacting surface patterns--this is most clearly visible southwest of St. Mary's island (left). The dominant ocean wave pattern resumes to the southeast of St. Mary's, but with an additional northwest-southeast oriented pattern superimposed, possibly due to winds originating in the English channel to the east (not shown). Suspended, tan-colored sediments visible within and around the archipelago are locally derived from continuing wave erosion of the granite forming the islands and remobilization of beach sands. Bright white areas in the photograph are waves breaking on shoals.
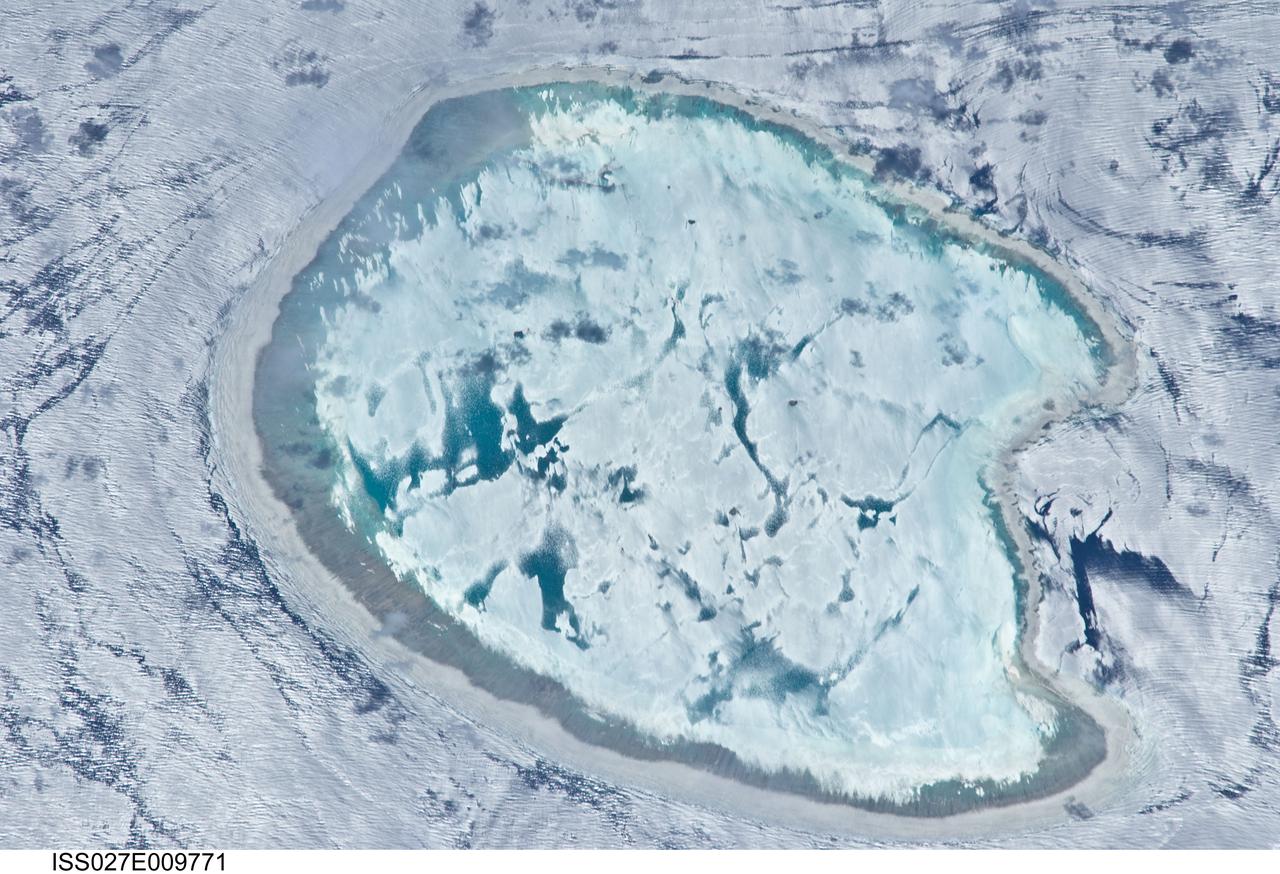
ISS027-E-009771 (2 April 2011) --- Bassas da India is featured in this image photographed by an Expedition 27 crew member on the International Space Station. The vantage point of crew members onboard the space station provides many dramatic views of Earth?s surface. This detailed photograph of the Bassas da India, an uninhabited atoll in the Indian Ocean (between the Mozambique coast of Africa and the island of Madagascar) has an almost surreal quality due to varying degrees of sunglint. Sunglint is an optical phenomena caused by light reflecting off of a water surface directly back towards the observer. Variations in the roughness of the water surface?presence or absence of waves due to wind and water currents?will cause differences in the intensity of the sunglint. The presence of other materials, such as oils or surfactants, can also change the properties of the water surface. Here the presence of currents is highlighted as darker patches or streaks (left and upper right). In contrast, shallow water in the lagoon (center) presents a more uniform, mirror-like appearance in sunglint suggesting that there are no subsurface currents present. Wave crests visible around the atoll are likely the result of both surface winds and subsurface currents. The Bassas da India atoll is part of the French Southern and Antarctic Lands. It is uninhabited due to its complete submergence during high tide ? there is no vegetation established on the atoll for the same reason. The atoll is approximately 10 kilometers in diameter, and covers an area (including the lagoon) of approximately 80 square kilometers.
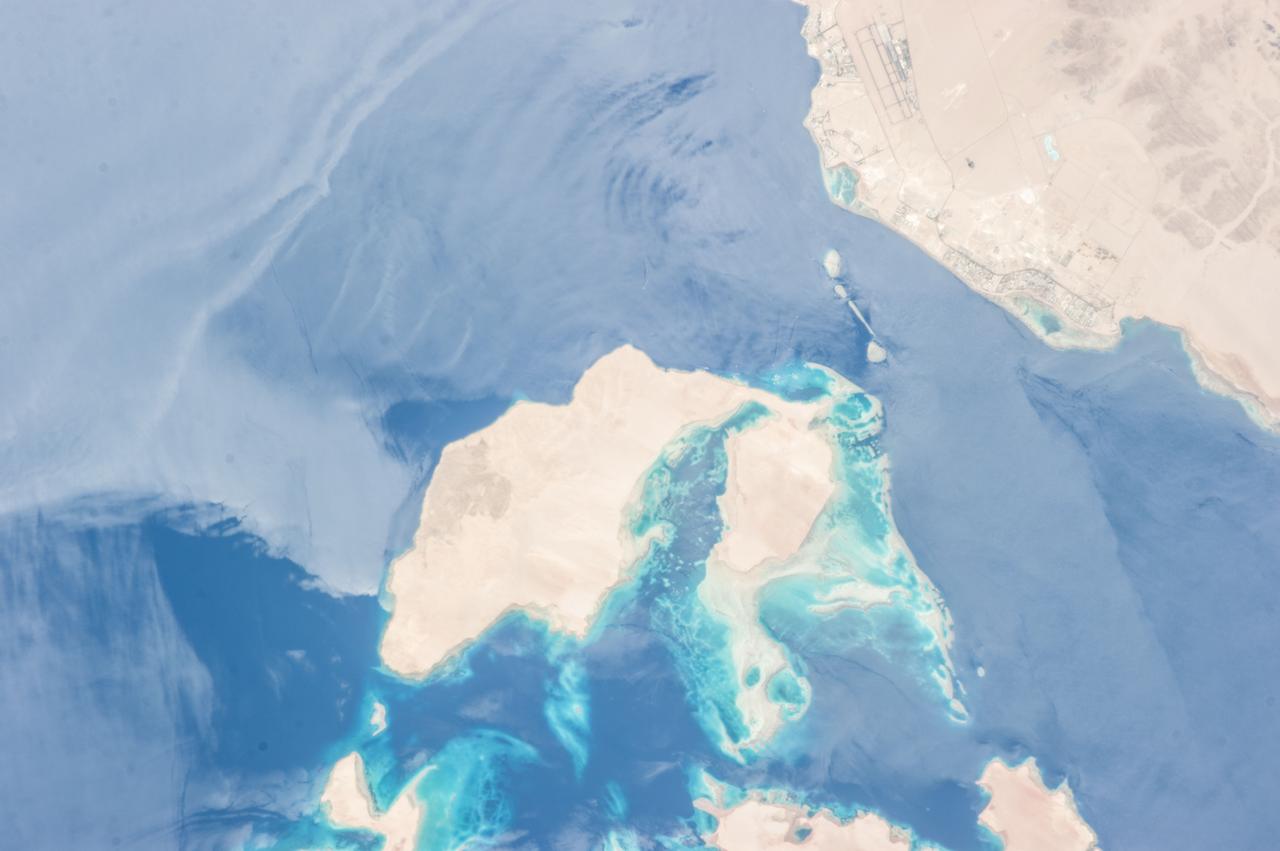
ISS036-E-010628 (24 June 2013) --- Strait of Tiran, Red Sea and Gulf of Aqaba are featured in this image photographed by an Expedition 36 crew member on the International Space Station. The approximately six-kilometer wide Strait of Tiran (also known as the Straits of Tiran) between the Egyptian mainland and Tiran Island separates the Gulf of Aqaba from the Red Sea, and provides two channels (290 meters and 73 meters deep, respectively) navigable by large ships bound for ports in Jordan and Israel. A smaller passage also exists between the east side of Tiran Island and Saudi Arabia, but this a single channel that is 16 meters deep. Due to its strategic position, control of the Strait has been an important factor in historical conflicts of the region, such as the Suez Crisis in 1956 and the Six-Day War in 1967. This photograph illustrates the morphology of the Strait. The relatively clear, deep-water passages of the western Strait of Tiran are visible at right, while the more sinuous shallow-water passage on the Saudi Arabia side can be seen at bottom center. Light blue to turquoise areas around Tiran Island indicate shallow water, while the island itself is arid and largely free of vegetation. Coral reefs are also found in the Straits of Tiran and are a popular diving destination. The silvery sheen on the water surface within the Strait and the south of Tiran Island is sunglint – light reflecting off the water surface back towards the observer on the space station. Disturbance to the water surface, as well as presence of substances such as oils and surfactants, can change the reflective properties of the water surface and highlight both surface waves and subsurface currents. For example, a large wave set is highlighted by sunglint at upper left.
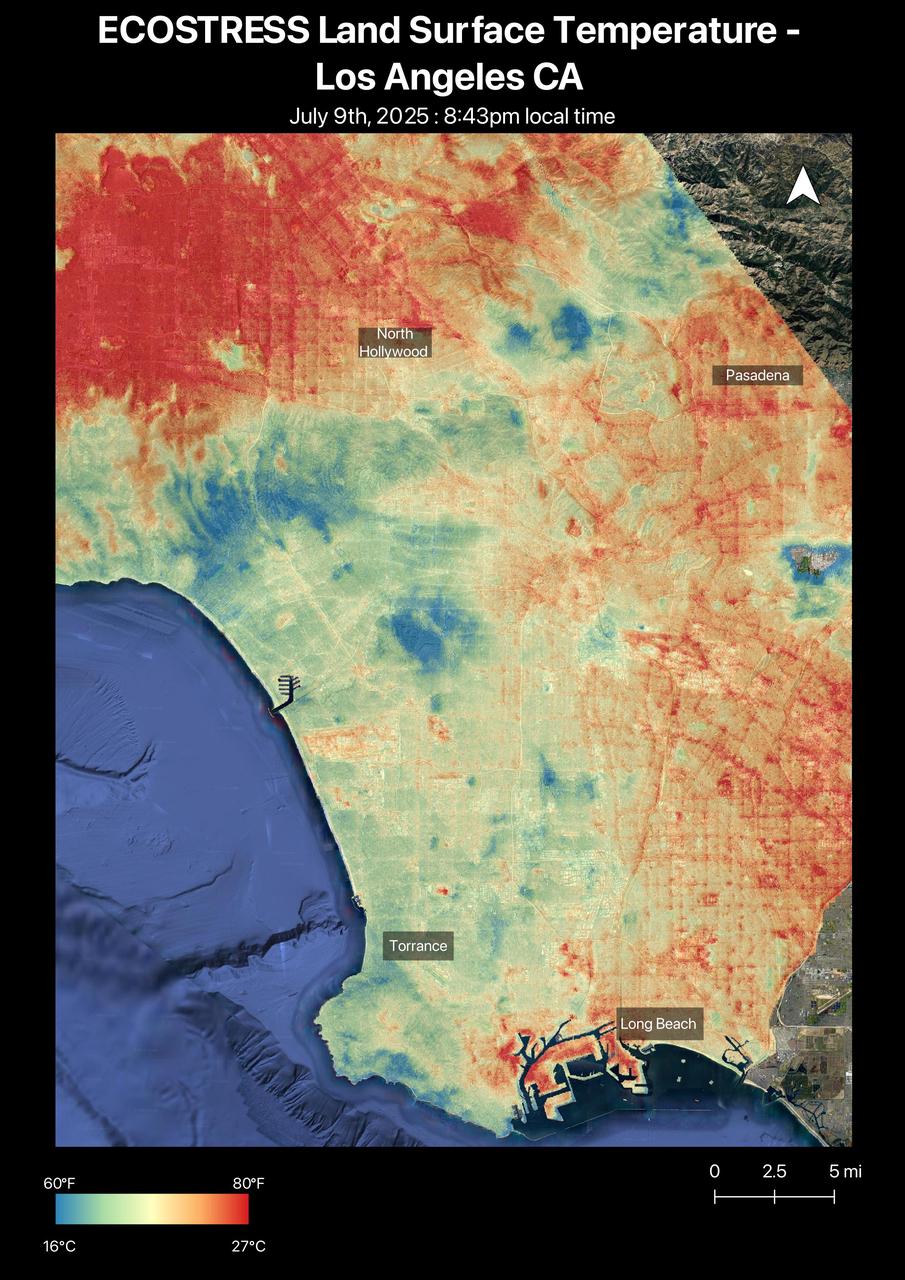
A short-lived heat wave that hit the Los Angeles area the week of July 7, 2025, was the first of summer. The heat lingered into the evening hours, as captured by NASA's Ecosystem Spaceborne Thermal Radiometer Experiment on Space Station (ECOSTRESS) instrument. By nearly 8:45 p.m. local time July 9, surface temperatures in the San Fernando Valley were still over 80 degrees Fahrenheit (27 degrees Celsius). The ECOSTRESS sensor recorded similar temperatures for downtown Pasadena (Figure A) and parts of Altadena, east of NASA's Jet Propulsion Laboratory, which manages the mission. In these data visualizations, dark red indicates higher temperatures, while areas in blue and green are cooler. Coastal regions remained significantly cooler than inland areas. The ECOSTRESS instrument measures thermal infrared emissions from Earth's surface. This enables researchers to monitor plant health, the progress of wildfires, land surface temperatures, and the burn risk to people from hot surfaces such as asphalt. Land surface temperatures are hotter than air temperatures during the day. Air temperatures, which are measured out of direct sunlight, are usually what meteorologists report in a weather forecast. https://photojournal.jpl.nasa.gov/catalog/PIA26651
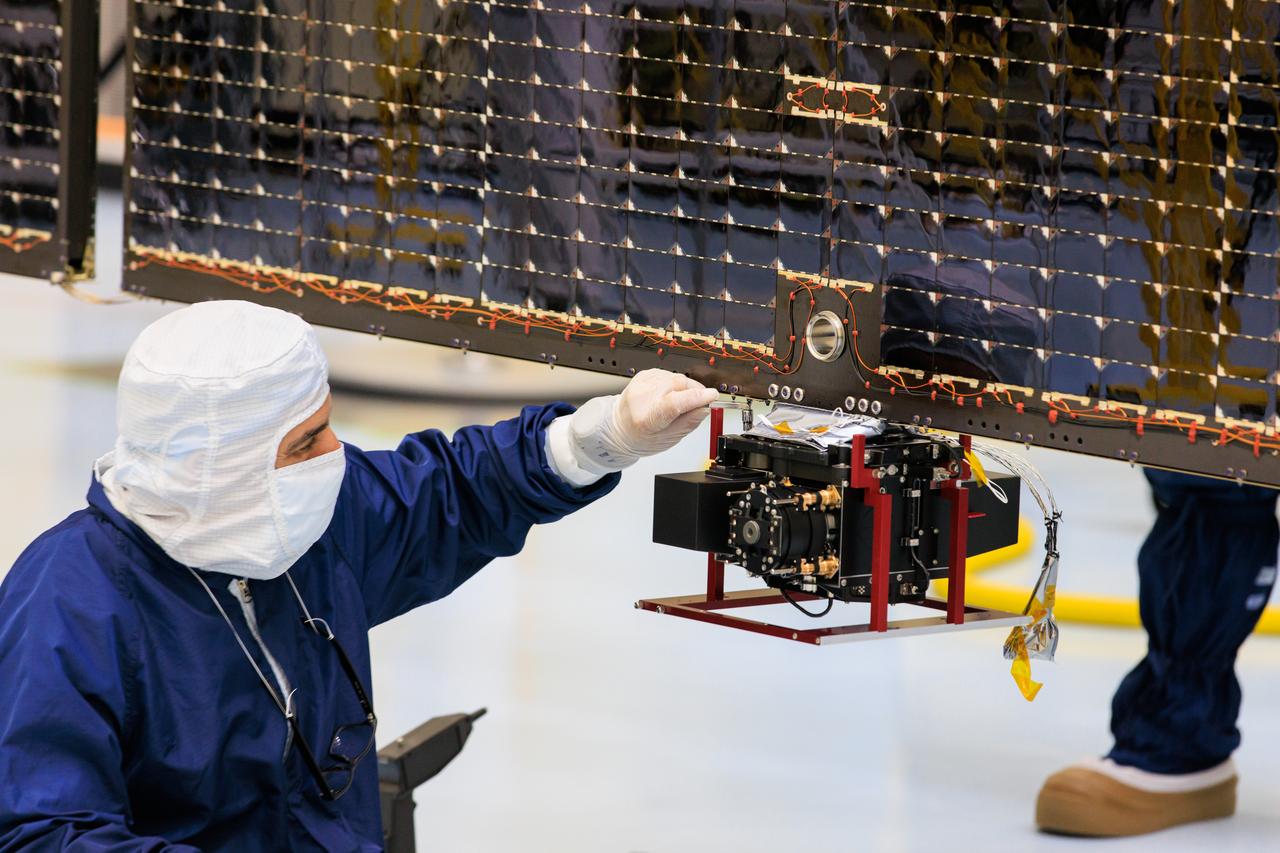
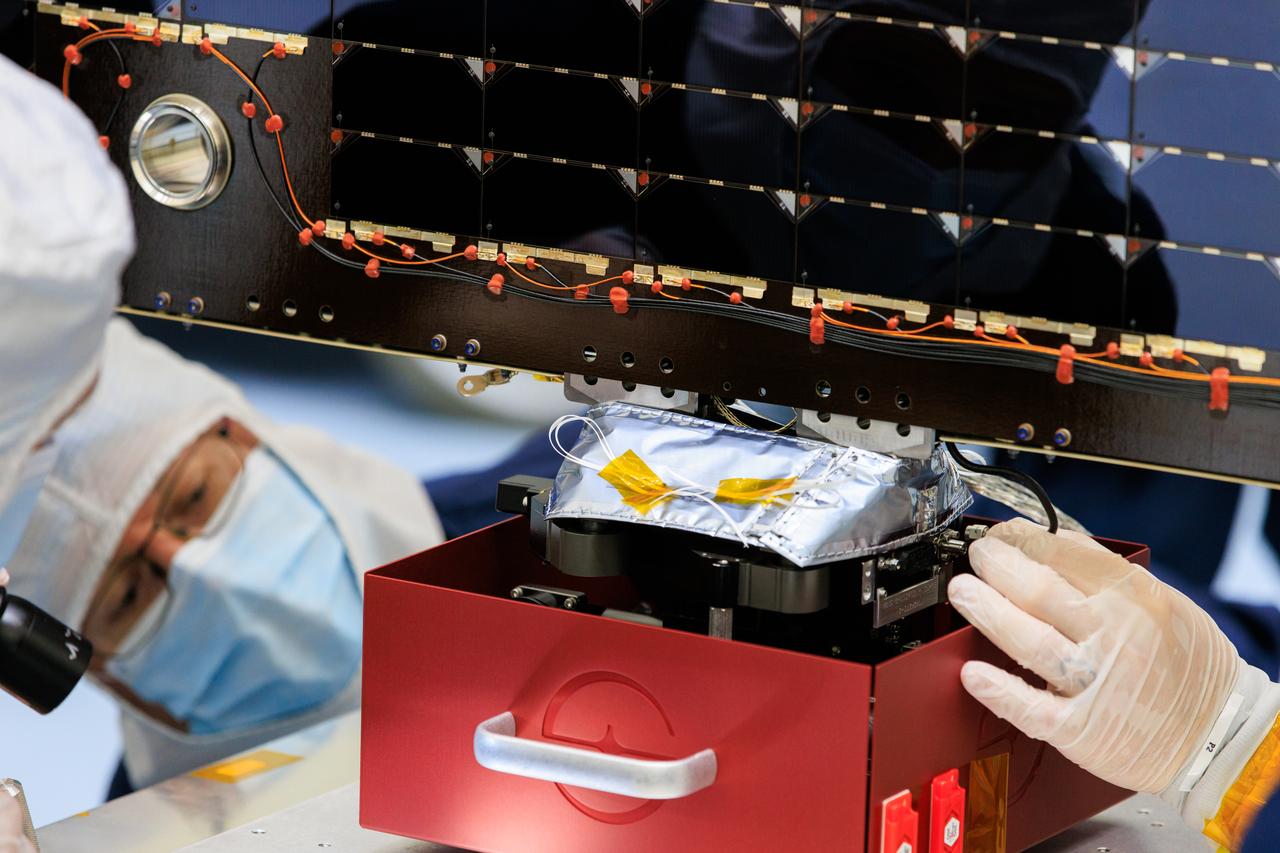
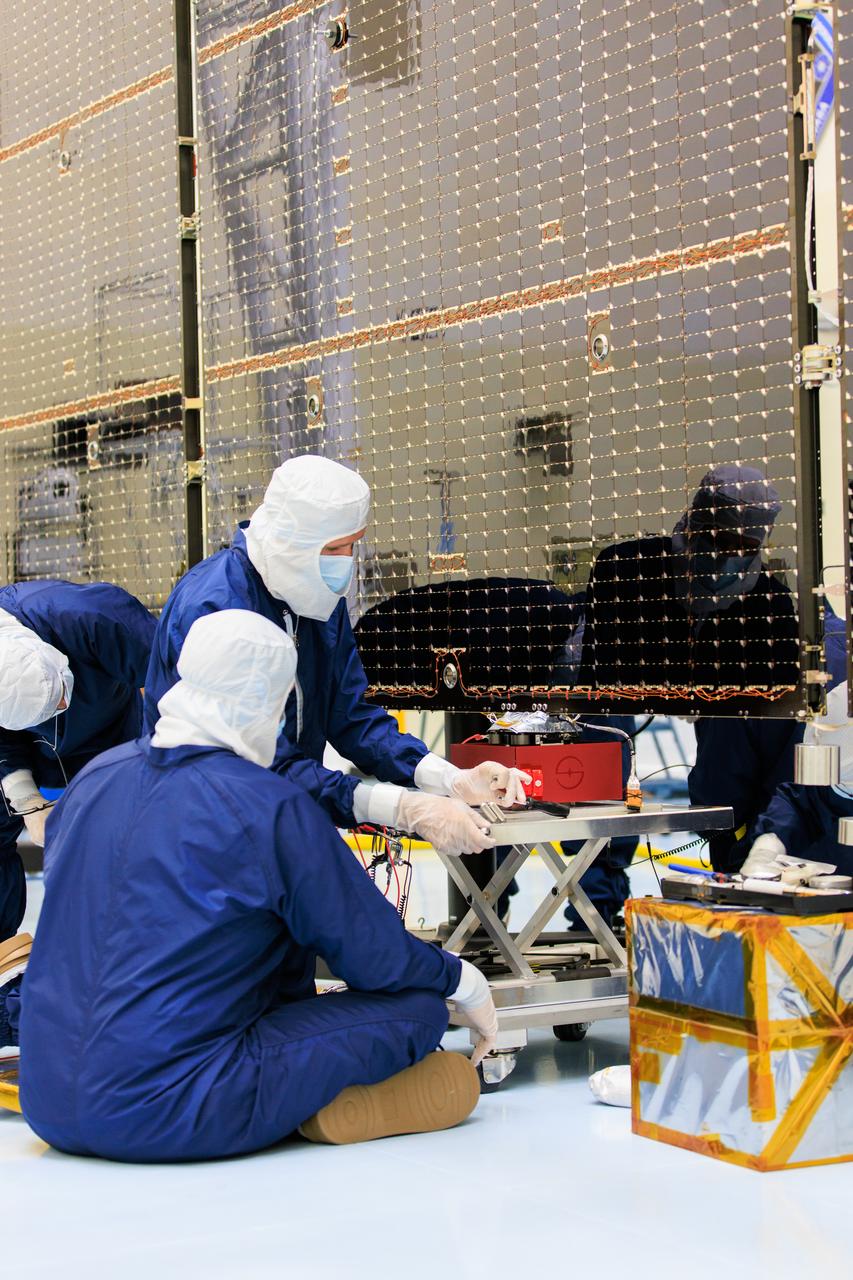
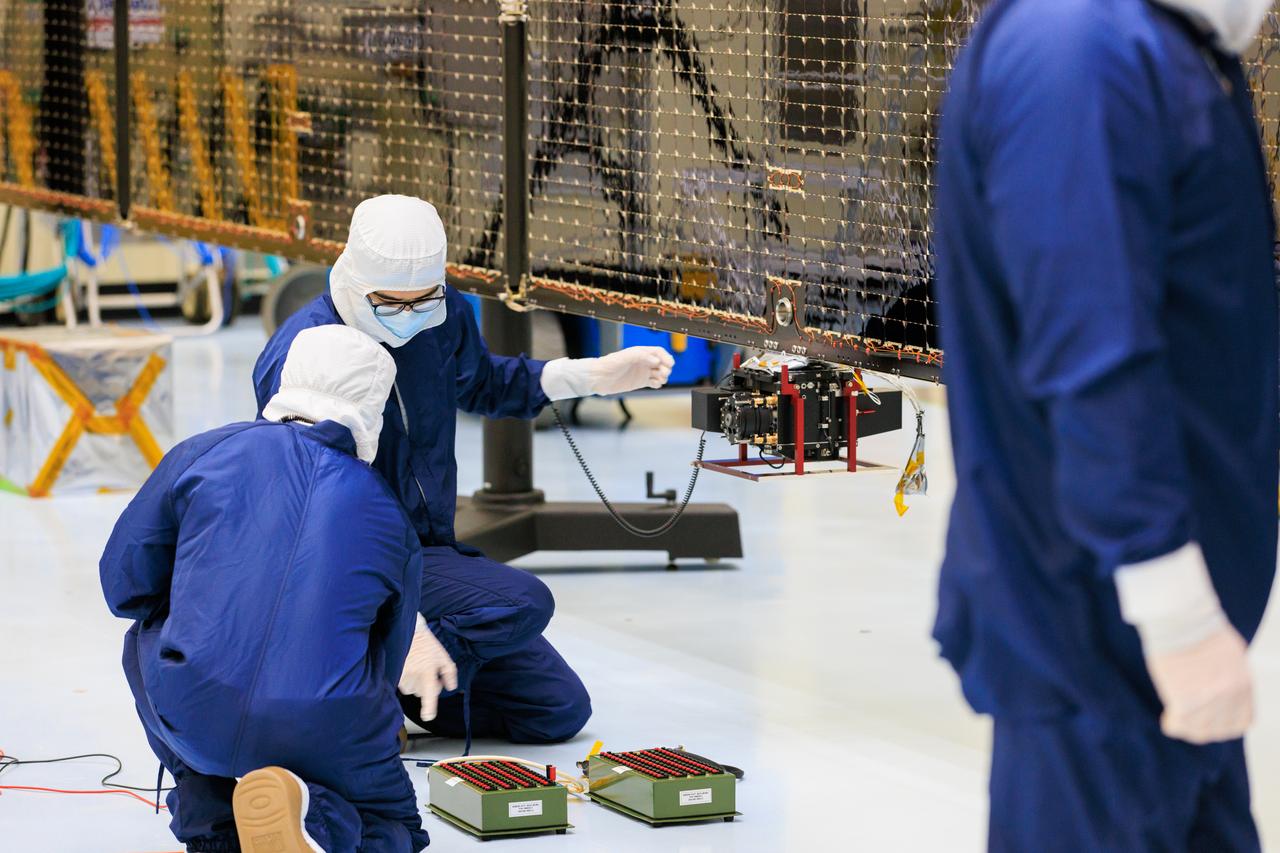
Technicians inside the Payload Hazardous Servicing Facility at NASA’s Kennedy Space Center in Florida install and test antennas on a solar array on Wednesday, March 20, 2024, for the agency’s Europa Clipper spacecraft which will study Jupiter’s icy moon Europa to determine if the planet has conditions that could support life. The REASON, (Radar for Europa Assessment and Sounding: Ocean to Near-surface) instrument will use the antennas to send both High Frequency (HF) and Very High Frequency (VHF) radio waves to penetrate up to 18 miles (30 kilometers) deep and search the ocean, measure ice thickness, and study the topography, composition, and roughness of Europa’s surface. The Europa Clipper spacecraft will ship to Florida later this year from NASA’s Jet Propulsion Lab in Southern California in preparation for launch aboard a SpaceX Falcon Heavy rocket from Kennedy’s Launch Complex 39A targeting October.
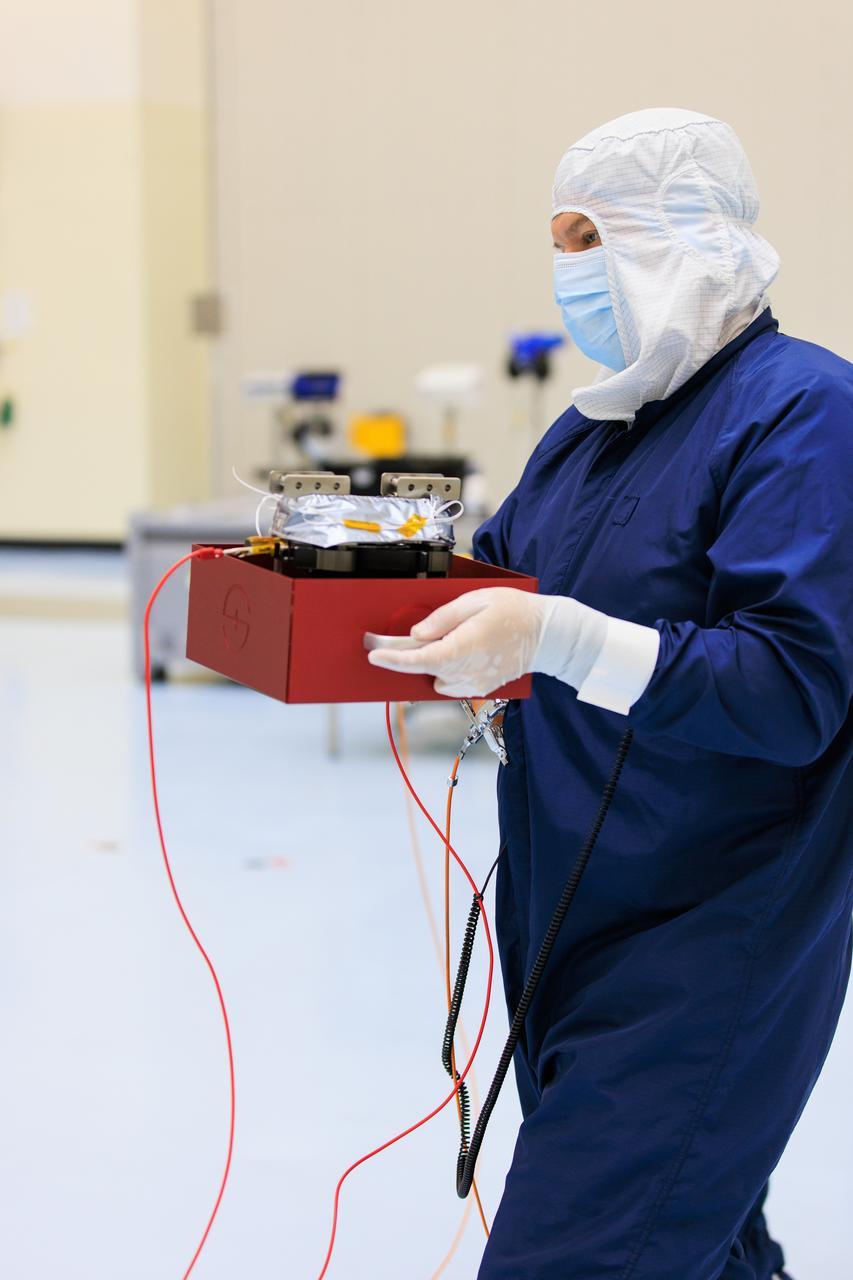
On Wednesday, March 20, 2024, a technician inside the Payload Hazardous Servicing Facility at NASA’s Kennedy Space Center in Florida carries an antenna that will attach to a solar array for the agency’s Europa Clipper spacecraft, which will study Jupiter’s icy moon Europa to determine if the planet has conditions that could support life. The REASON, (Radar for Europa Assessment and Sounding: Ocean to Near-surface) instrument will use the antennas to send both High Frequency (HF) and Very High Frequency (VHF) radio waves to penetrate up to 18 miles (30 kilometers) deep and search the ocean, measure ice thickness, and study the topography, composition, and roughness of Europa’s surface. The Europa Clipper spacecraft will ship to Florida later this year from NASA’s Jet Propulsion Lab in Southern California in preparation for launch aboard a SpaceX Falcon Heavy rocket from Kennedy’s Launch Complex 39A targeting October 2024.
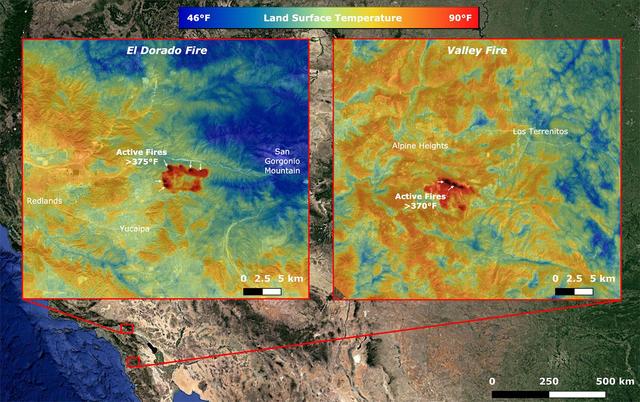
On Sept. 6, NASA's ECOsystem Spaceborne Thermal Radiometer Experiment on Space Station (ECOSTRESS) imaged active fires across California, including the El Dorado fire near Yucaipa and the Valley fire in Japatul Valley in the southern part of the state. As of Sept. 8, there were 25 major wildfires burning in California. Both images, taken at 12:13 a.m. PDT (3:13 a.m. EDT), show multiple concentrated areas of surface temperatures (in red) higher than 375 degrees Fahrenheit (191 degrees Celsius). These high temperature regions were likely where the active fires were occurring. The surrounding areas show abnormally warm middle-of-the-night background surface temperatures (orange) due to the ongoing heat wave. https://photojournal.jpl.nasa.gov/catalog/PIA23788
Technicians inside the Payload Hazardous Servicing Facility at NASA’s Kennedy Space Center in Florida install and test one of several antennas on a solar array Wednesday, March 20, 2024, for the agency’s Europa Clipper spacecraft which will study Jupiter’s icy moon, Europa, to determine if the planet can support life. REASON, (Radar for Europa Assessment and Sounding: Ocean to Near-surface) instrument will use the antennas to send both very high frequency radio waves and high frequency to penetrate up to 18 miles (30 kilometers) deep to search the ocean, measure ice thickness, and study the topography, composition, and roughness of Europa’s surface. The Europa Clipper spacecraft will ship to Florida later this year from NASA’s Jet Propulsion Lab in Southern California in preparation for launch aboard a SpaceX Falcon Heavy rocket from Kennedy’s Launch Complex 39A targeting October 2024.
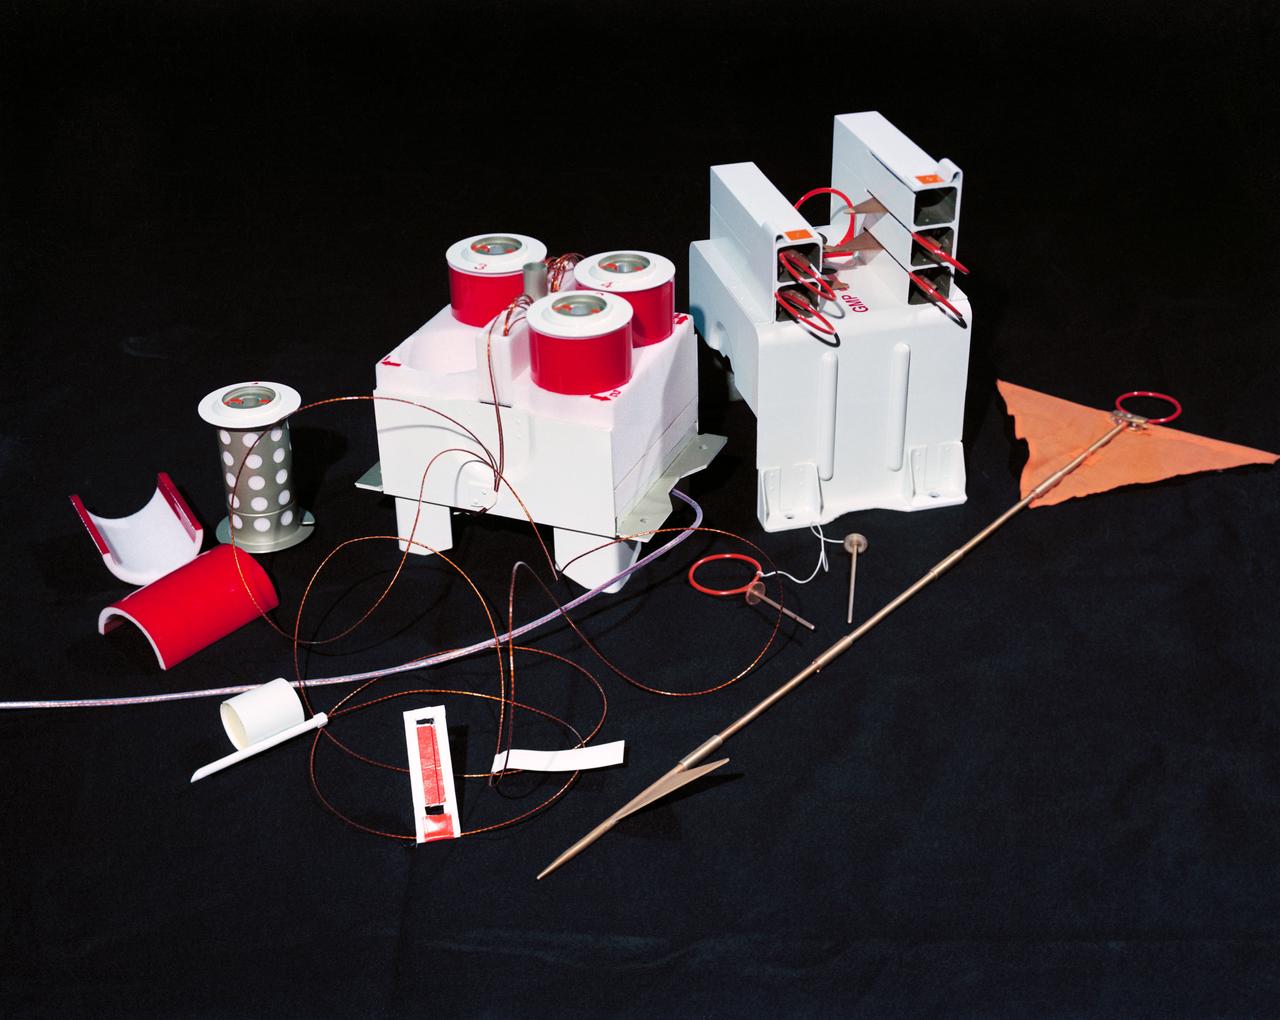
S72-37259 (November 1972) --- The Geophone Module and Cable Reels of the Lunar Seismic Profiling Experiment (S-203), a component of the Apollo Lunar Surface Experiments Package which will be carried on the Apollo 17 lunar landing mission. LSPE components are four geophones similar to those used in an earlier active seismic experiment, an electronics package in the ALSEP central station, and eight explosive packages which will be deployed during the geology traverse. The four geophones will be placed one in the center and one at each corner of a 90-meter equilateral triangle. Explosive charges placed on the surface will generate seismic waves of varying strengths to provide data on the structural profile of the landing site. After the charges have been fired by ground command, the experiment will settle down into a passive listening mode, detecting moonquakes, meteorite impacts and the thump caused by the Lunar Module ascent stage impact.
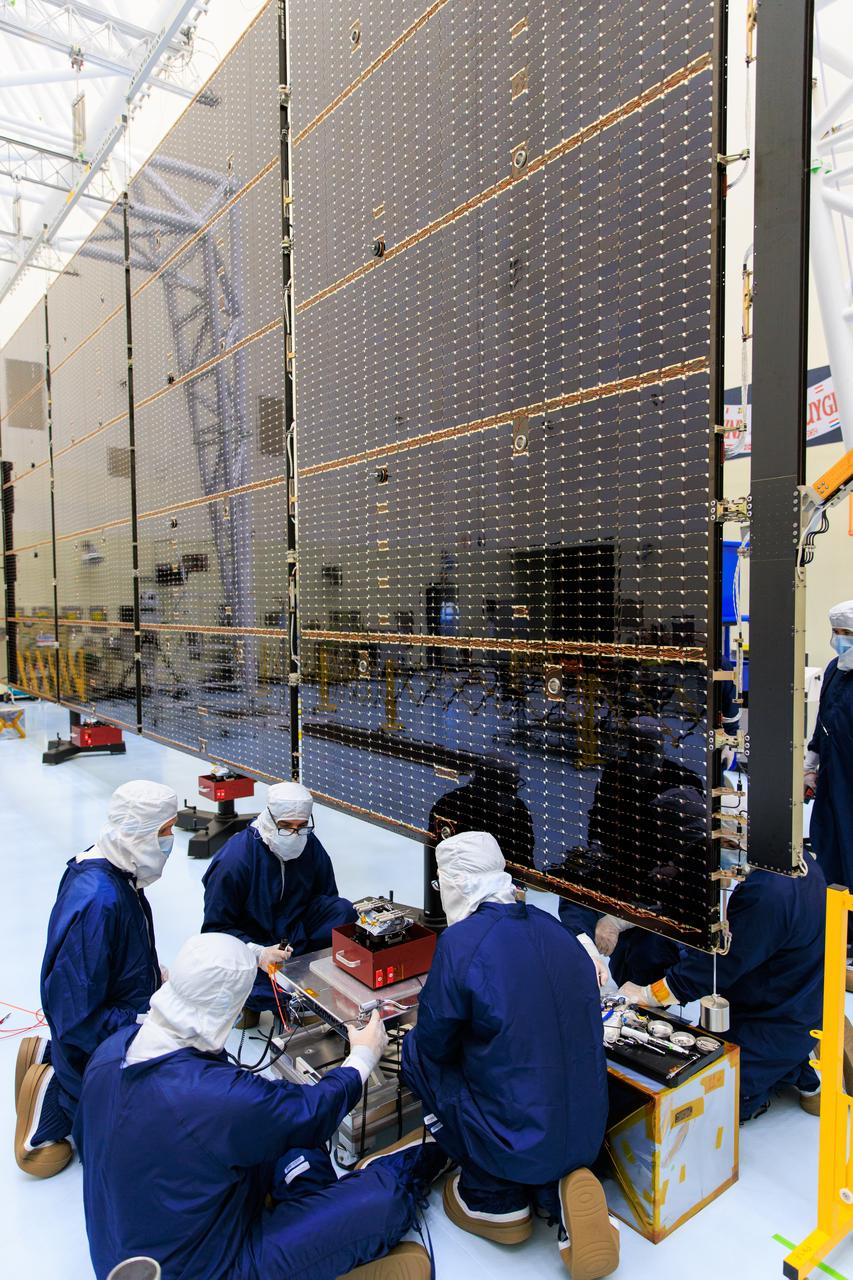
Technicians inside the Payload Hazardous Servicing Facility at NASA’s Kennedy Space Center in Florida install and test one of several antennas on a solar array Wednesday, March 20, 2024, for the agency’s Europa Clipper spacecraft which will study Jupiter’s icy moon Europa to determine if the planet has conditions that could support life. REASON, (Radar for Europa Assessment and Sounding: Ocean to Near-surface) instrument will use the antennas to send both High Frequency (HF) and Very High Frequency (VHF) radio waves to penetrate up to 18 miles (30 kilometers) deep and search the ocean, measure ice thickness, and study the topography, composition, and roughness of Europa’s surface. The Europa Clipper spacecraft will ship to Florida later this year from NASA’s Jet Propulsion Lab in Southern California in preparation for launch aboard a SpaceX Falcon Heavy rocket from Kennedy’s Launch Complex 39A targeting October 2024.
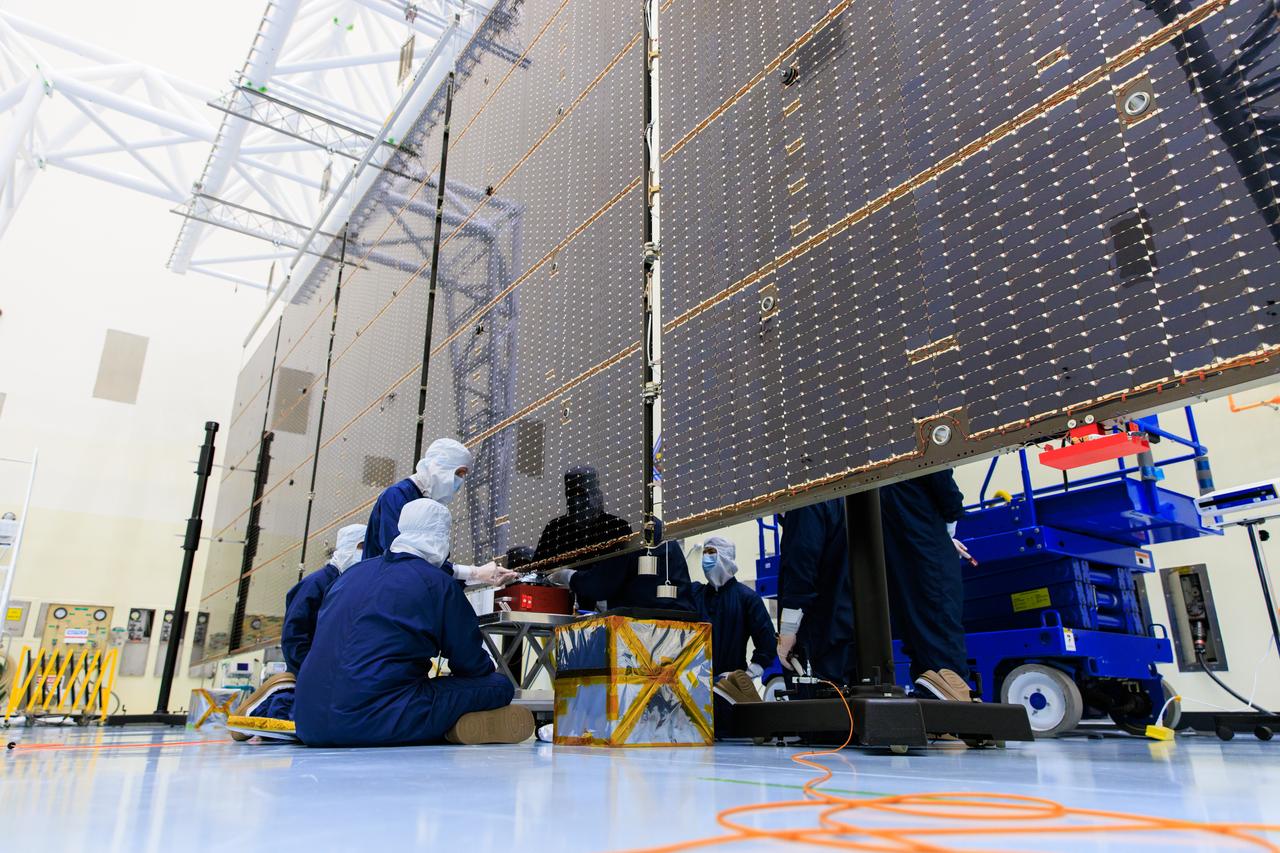
Technicians inside the Payload Hazardous Servicing Facility at NASA’s Kennedy Space Center in Florida install and test one of several antennas on a solar array Wednesday, March 20, 2024, for the agency’s Europa Clipper spacecraft which will study Jupiter’s icy moon Europa to determine if the planet has conditions that could support life. REASON, (Radar for Europa Assessment and Sounding: Ocean to Near-surface) instrument will use the antennas to send both High Frequency (HF) and Very High Frequency (VHF) radio waves to penetrate up to 18 miles (30 kilometers) deep and search the ocean, measure ice thickness, and study the topography, composition, and roughness of Europa’s surface. The Europa Clipper spacecraft will ship to Florida later this year from NASA’s Jet Propulsion Lab in Southern California in preparation for launch aboard a SpaceX Falcon Heavy rocket from Kennedy’s Launch Complex 39A targeting October 2024.
Technicians inside the Payload Hazardous Servicing Facility at NASA’s Kennedy Space Center in Florida install and test one of several antennas on a solar array Wednesday, March 20, 2024, for the agency’s Europa Clipper spacecraft which will study Jupiter’s icy moon Europa to determine if the planet has conditions that could support life. REASON, (Radar for Europa Assessment and Sounding: Ocean to Near-surface) instrument will use the antennas to send both High Frequency (HF) and Very High Frequency (VHF) radio waves to penetrate up to 18 miles (30 kilometers) deep and search the ocean, measure ice thickness, and study the topography, composition, and roughness of Europa’s surface. The Europa Clipper spacecraft will ship to Florida later this year from NASA’s Jet Propulsion Lab in Southern California in preparation for launch aboard a SpaceX Falcon Heavy rocket from Kennedy’s Launch Complex 39A targeting October 2024.
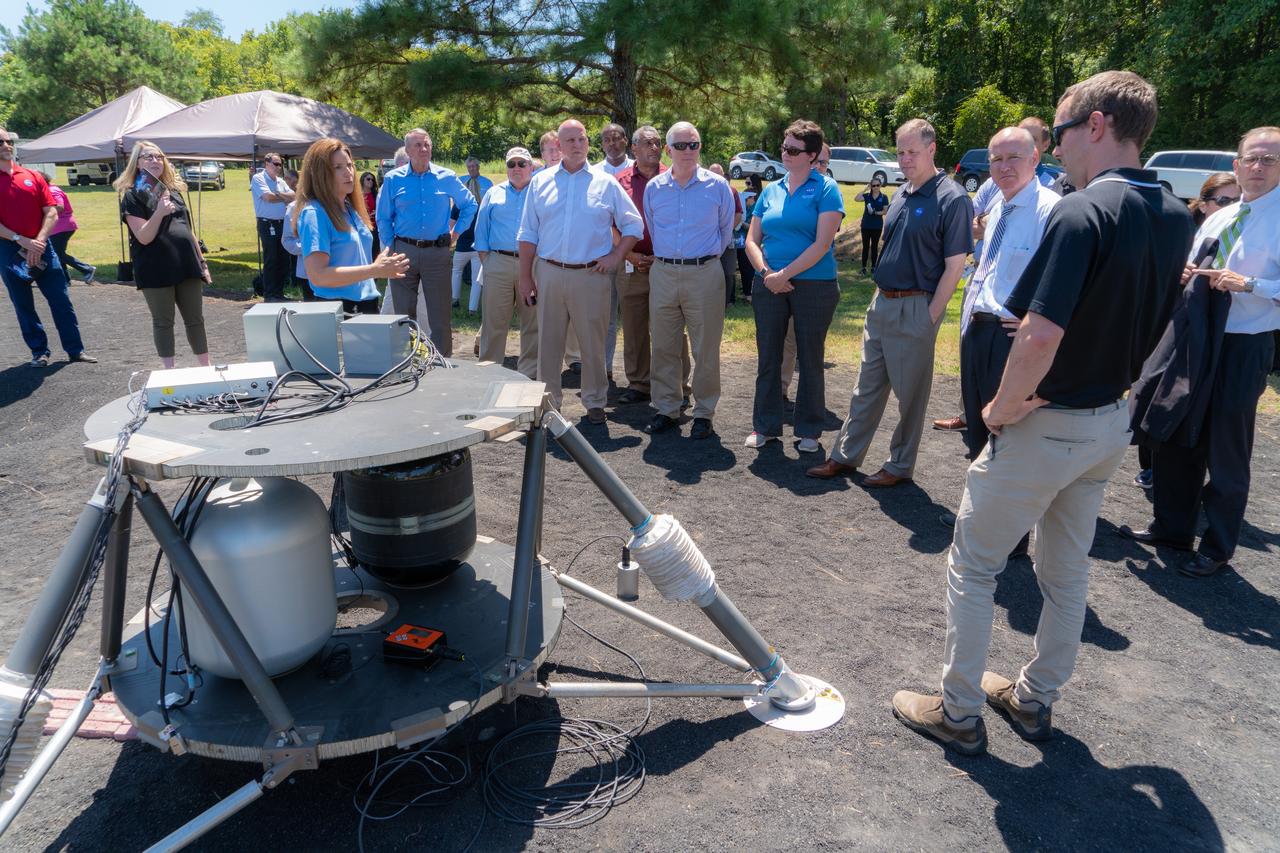
Lisa Watson-Morgan, center left, program manager of NASA’s Human Landing System Program at NASA’s Marshall Space Flight Center in Huntsville, Alabama, shows NASA Administrator Jim Bridenstine equipment used to test seismic sensors on a lunar lander platform on a simulated lunar surface at the center Aug. 16, 2019. Bridenstine was joined by Representatives Mo Brooks and Robert Aderholt of Alabama and Representative Scott DesJarlais of Tennessee. Planetary scientists performed the experiment to learn how these waves travel through simulated regolith, which is material similar to the Moon’s surface. The experiment will help guide instrument deployment scenarios for NASA’s Commercial Lunar Payload Service (CLPS) Program, delivering small science and technology payloads for Artemis. That same day, Bridenstine announced Marshall will lead the agency’s Human Landing System Program. (NASA/Fred Deaton) For more information: https://www.nasa.gov/artemis-1
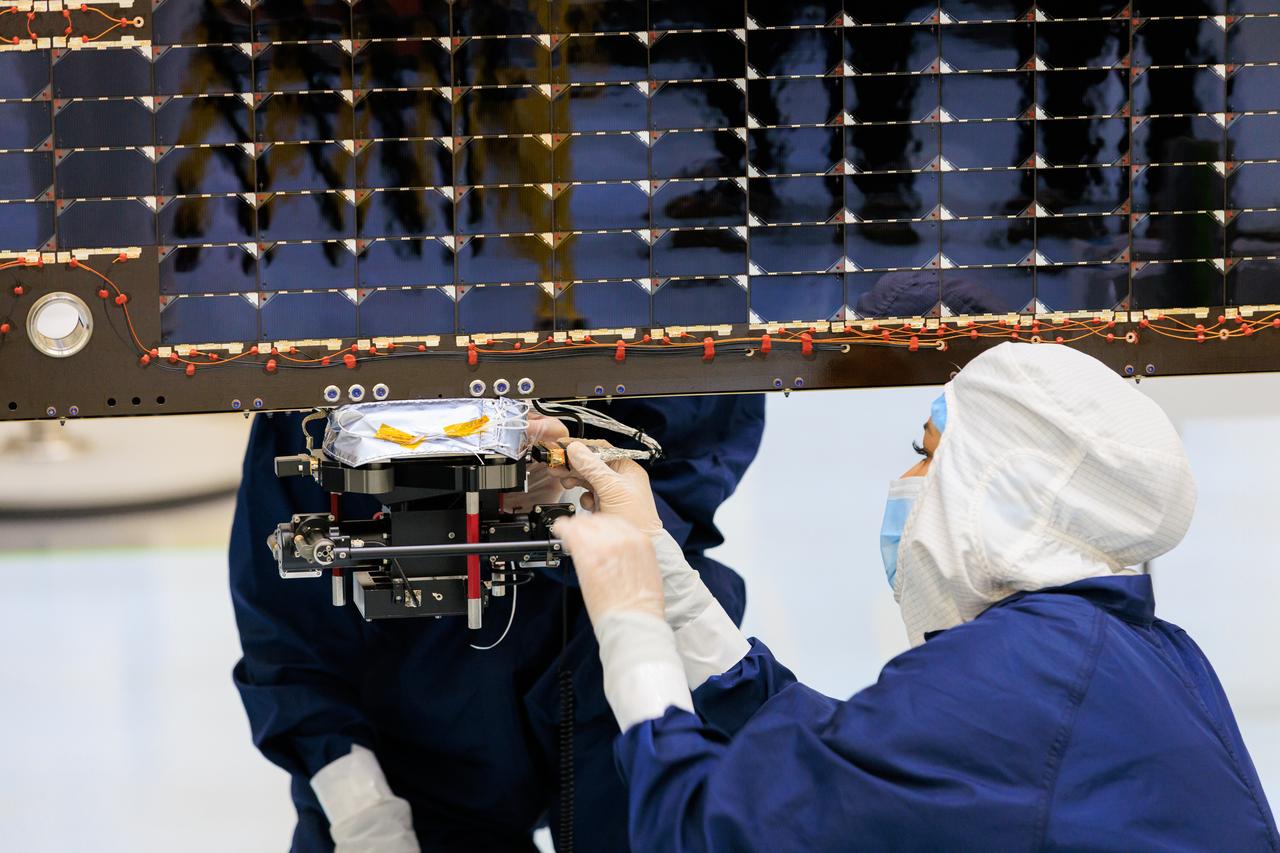
Technicians inside the Payload Hazardous Servicing Facility at NASA’s Kennedy Space Center in Florida install and test antennas on a solar array on Wednesday, March 20, 2024, for the agency’s Europa Clipper spacecraft which will study Jupiter’s icy moon Europa to determine if the planet has conditions that could support life. The REASON, (Radar for Europa Assessment and Sounding: Ocean to Near-surface) instrument will use the antennas to send both both High Frequency (HF) and Very High Frequency (VHF) radio waves to penetrate up to 18 miles (30 kilometers) deep and search the ocean, measure ice thickness, and study the topography, composition, and roughness of Europa’s surface. The Europa Clipper spacecraft will ship to Florida later this year from NASA’s Jet Propulsion Lab in Southern California in preparation for launch aboard a SpaceX Falcon Heavy rocket from Kennedy’s Launch Complex 39A targeting October.
Technicians inside the Payload Hazardous Servicing Facility at NASA’s Kennedy Space Center in Florida install and test antennas on a solar array on Wednesday, March 20, 2024, for the agency’s Europa Clipper spacecraft which will study Jupiter’s icy moon Europa to determine if the planet has conditions that could support life. The REASON, (Radar for Europa Assessment and Sounding: Ocean to Near-surface) instrument will use the antennas to send both High Frequency (HF) and Very High Frequency (VHF) radio waves to penetrate up to 18 miles (30 kilometers) deep and search the ocean, measure ice thickness, and study the topography, composition, and roughness of Europa’s surface. The Europa Clipper spacecraft will ship to Florida later this year from NASA’s Jet Propulsion Lab in Southern California in preparation for launch aboard a SpaceX Falcon Heavy rocket from Kennedy’s Launch Complex 39A targeting October.
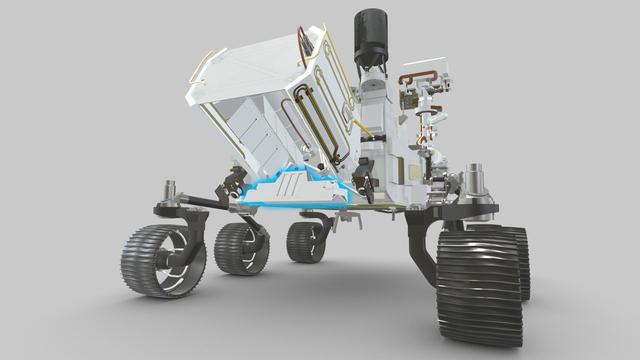
Perseverance's Radar Imager for Mars' Subsurface Experiment (RIMFAX) uses radar waves to probe the ground, revealing the unexplored world that lies beneath the Martian surface. Highlighted in blue in this visualization from the interactive tool Learn About Perseverance, the instrument's antenna is externally mounted underneath the Multi-Mission Radioisotope Thermoelectric Generator (MMRTG — the rover's nuclear battery) on the back of the Perseverance. The first ground-penetrating radar set on the surface of Mars, RIMFAX can provide a highly detailed view of subsurface structures down to at least 30 feet (10 meters) underground. In doing so, the instrument will reveal hidden layers of geology and help find clues to past environments on Mars, especially those with conditions necessary for supporting life. https://photojournal.jpl.nasa.gov/catalog/PIA24049
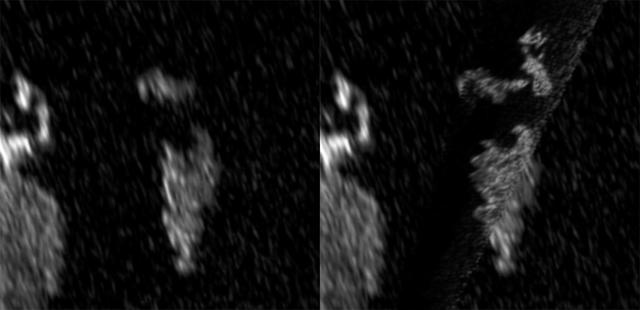
Two Synthetic Aperture Radar (SAR) images from the radar experiment on NASA's Cassini spacecraft show that, between May 2013 and August 2014, a bright feature appeared in Kraken Mare, the largest hydrocarbon sea on Saturn's moon Titan. Researchers think the bright feature is likely representative of something on the hydrocarbon sea's surface, such as waves or floating debris. A similar feature appeared in Ligea Mare, another Titan sea, and was seen to evolve in appearance between 2013 and 2014 (see PIA18430). The image at left was taken on May 23, 2013 at an incidence angle of 56 degrees; the image at right was taken on August 21, 2014 at an incidence angle of 5 degrees. Incidence angle refers to the angle at which the radar beam strikes the surface. http://photojournal.jpl.nasa.gov/catalog/PIA19047
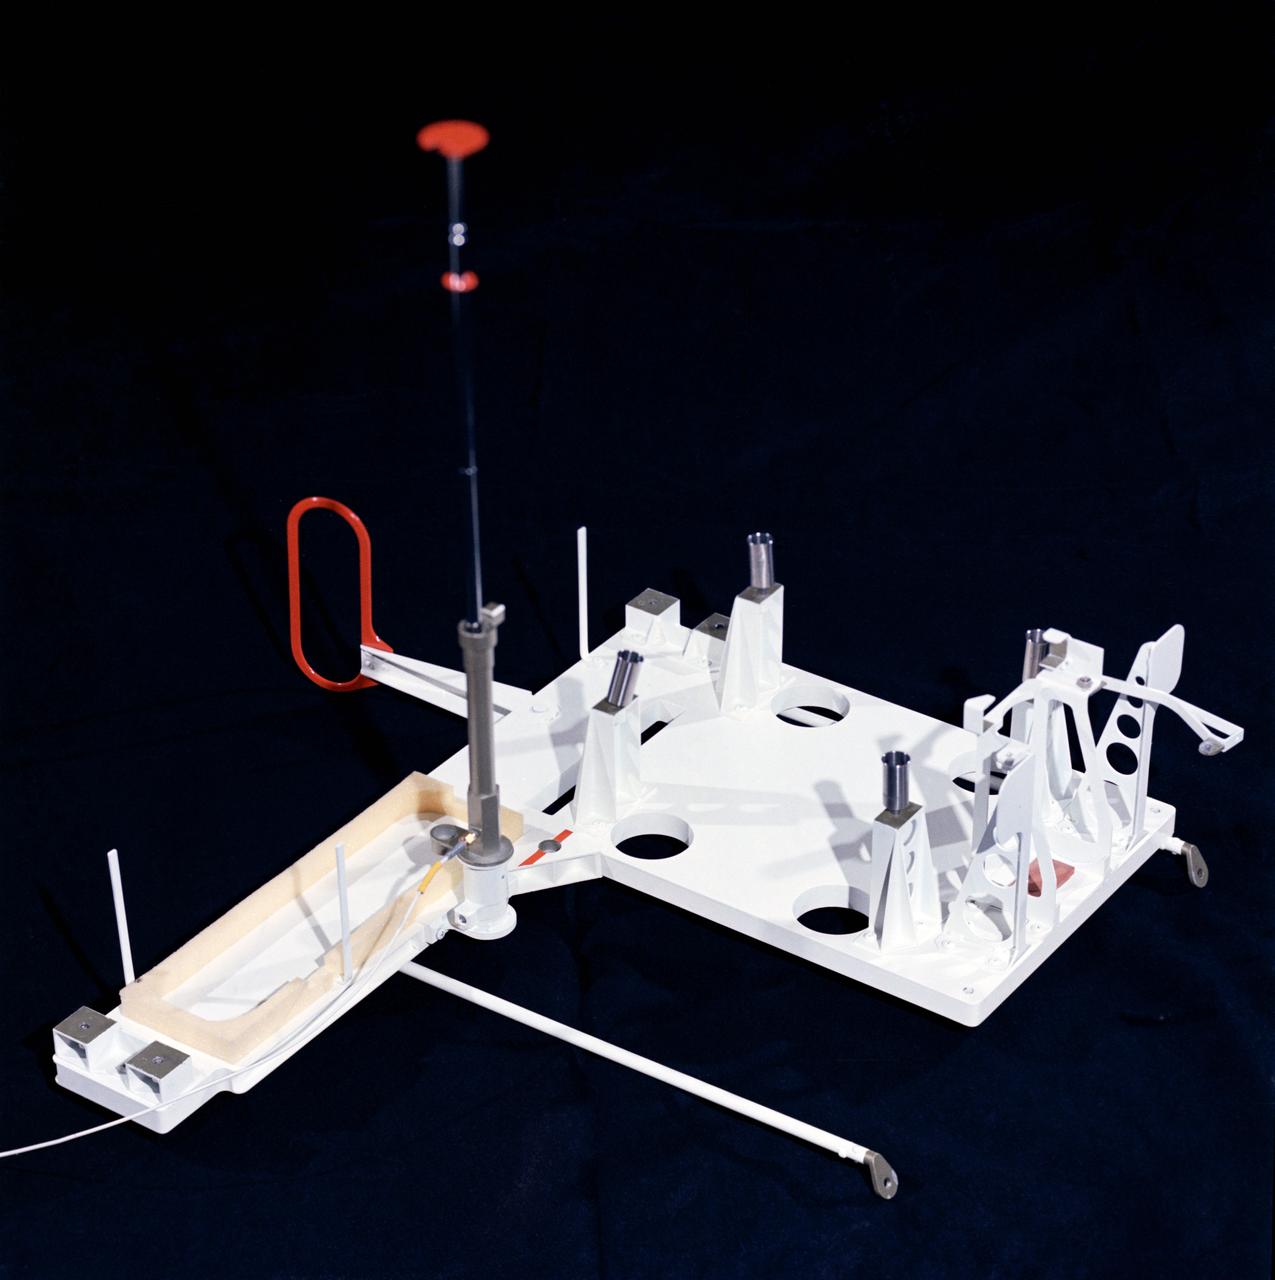
S72-37260 (November 1972) --- The remote antenna for the Lunar Seismic Profiling Experiment, Numbered S-203, a component of the Apollo Lunar Surface Experiments Package which will be carried on the Apollo 17 lunar landing mission. LSPE components are four geophones similar to those used in earlier active seismic experiments an electronics package in the ALSEP central station, and eight explosive packages which will be deployed during the geology traverse. The four geophones will be placed one in the center and at each corner of a 90-meter equilateral triangle. Explosive charges placed on the surface will generate seismic waves of varying strengths to provide data on the structural profile of the landing site. After the charges have been fired by ground command, the experiment will settle down into a passive listening mode, detecting moonquakes, meteorite impacts and the thump caused by the Lunar Module ascent stage impact. The antenna is of the telescoping type.
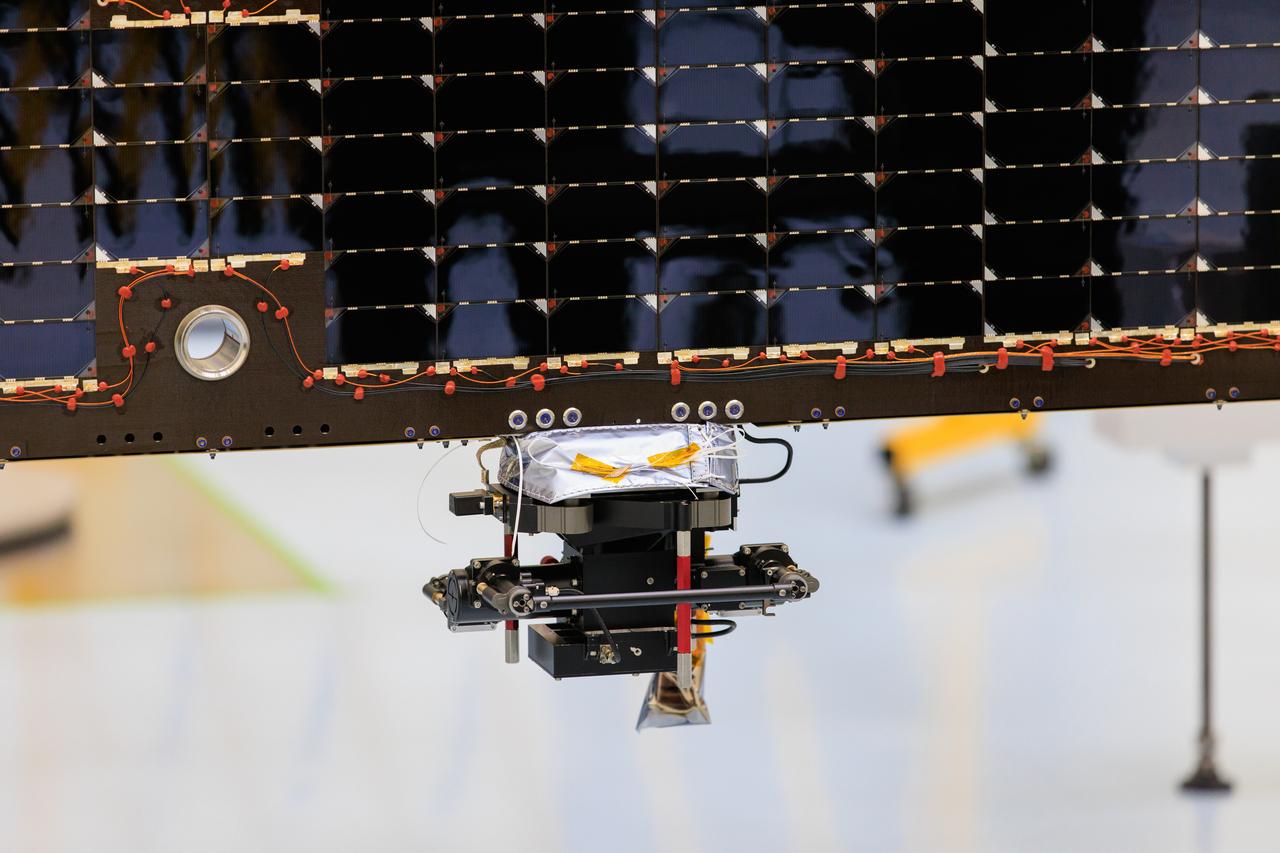
An antenna for the REASON, (Radar for Europa Assessment and Sounding: Ocean to Near-surface) instrument attaches to a solar array for NASA’s Europa Clipper spacecraft inside the Payload Hazardous Servicing Facility at the agency’s Kennedy Space Center in Florida on Wednesday, March 20, 2024. The Europa Clipper spacecraft will study Jupiter’s icy moon Europa, and the REASON instrument will use the antennas to send both both High Frequency (HF) and Very High Frequency (VHF) radio waves to penetrate up to 18 miles (30 kilometers) deep and search the ocean, measure ice thickness, and study the topography, composition, and roughness of Europa’s surface. The Europa Clipper spacecraft will ship to Florida later this year from NASA’s Jet Propulsion Lab in Southern California in preparation for launch aboard a SpaceX Falcon Heavy rocket from Kennedy’s Launch Complex 39A, targeting October.
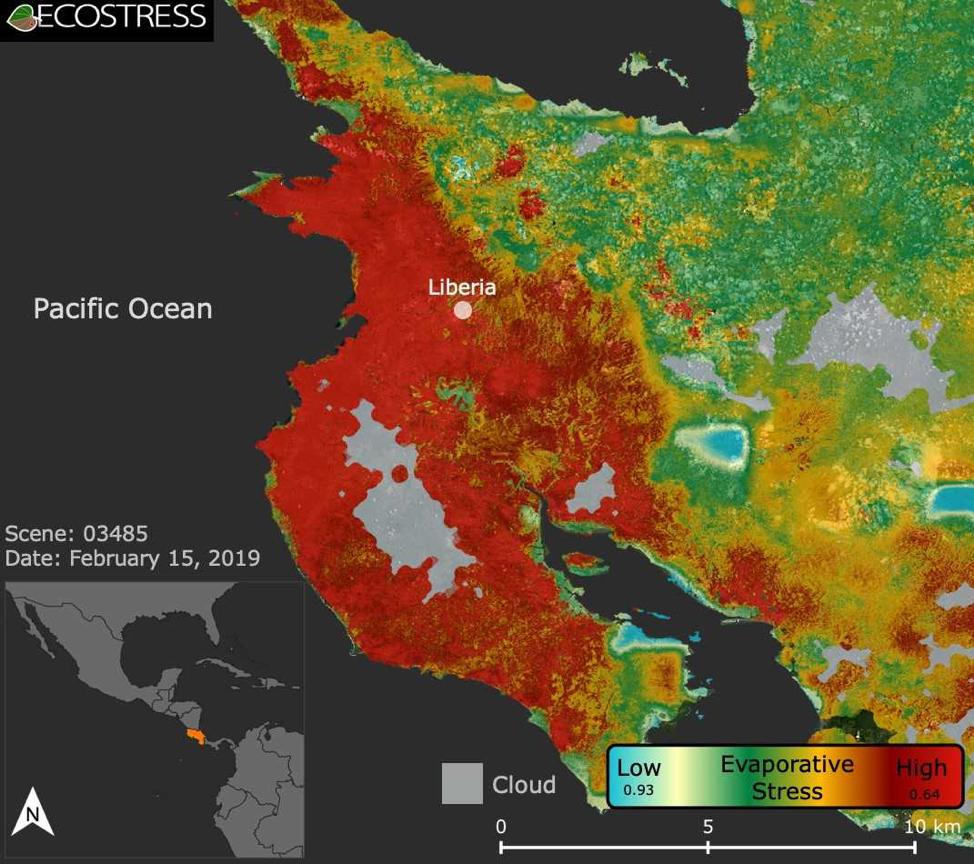
This image shows the ECOSTRESS evaporative stress index for the Guanacaste region of Costa Rica (in red on inset map, left) a few months after the onset of a major Central American drought. Red indicates high plant water stress, yellow is moderate stress and greens/blues are low stress. Light gray is cloud cover. The index measures how much water plants are using relative to how much they would use under optimal conditions; low numbers correlate with high stress. ECOSTRESS launched on June 29, 2018, as part of a SpaceX commercial resupply mission to the International Space Station. Its primary mission is to detect plant health by monitoring Earth's surface temperature. However, surface temperature data are also useful in detecting other heat-related phenomena — like heat waves, volcanoes and fires. https://photojournal.jpl.nasa.gov/catalog/PIA22839
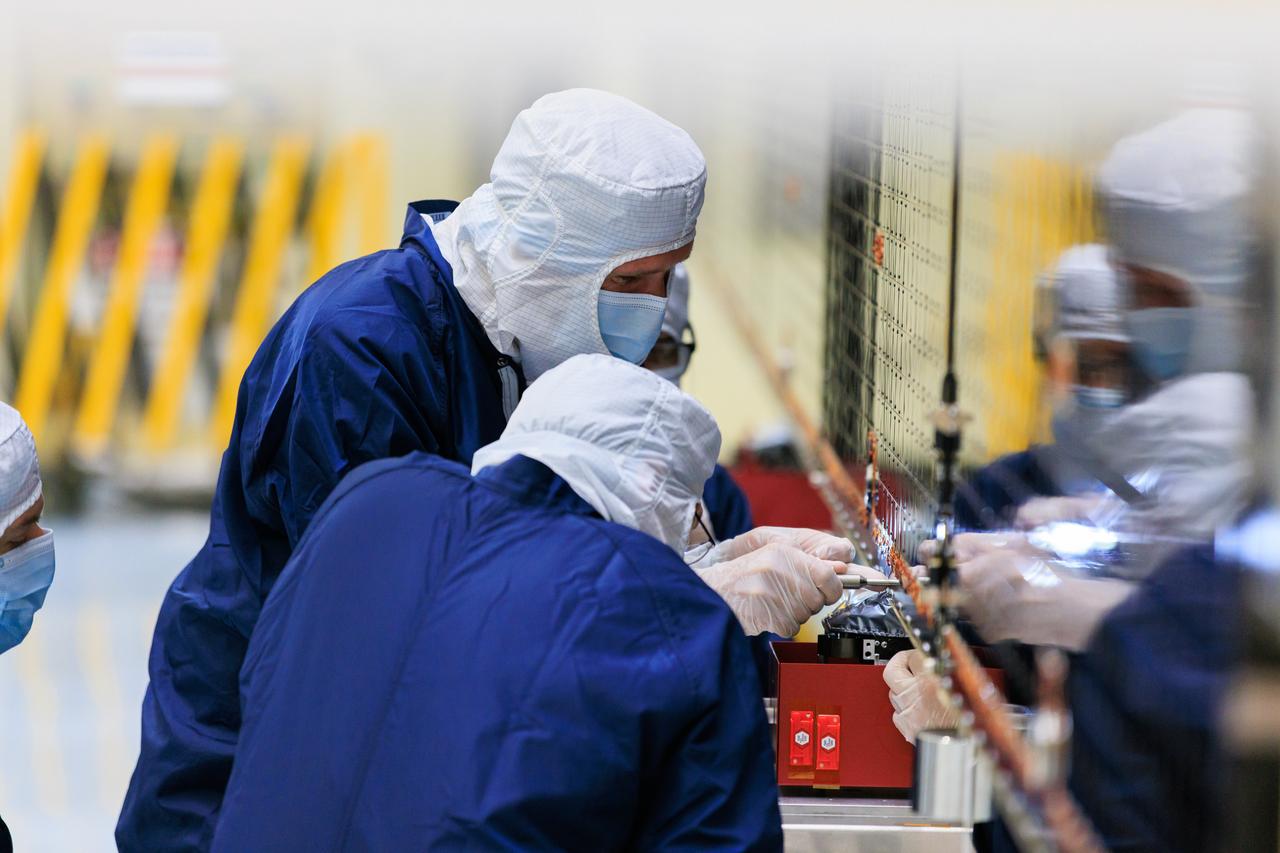
Technicians inside the Payload Hazardous Servicing Facility at NASA’s Kennedy Space Center in Florida install and test one of several antennas on a solar array Wednesday, March 20, 2024, for the agency’s Europa Clipper spacecraft which will study Jupiter’s icy moon Europa to determine if the planet has conditions that could support life. REASON, (Radar for Europa Assessment and Sounding: Ocean to Near-surface) instrument will use the antennas to send both High Frequency (HF) and Very High Frequency (VHF) radio waves to penetrate up to 18 miles (30 kilometers) deep and search the ocean, measure ice thickness, and study the topography, composition, and roughness of Europa’s surface. The Europa Clipper spacecraft will ship to Florida later this year from NASA’s Jet Propulsion Lab in Southern California in preparation for launch aboard a SpaceX Falcon Heavy rocket from Kennedy’s Launch Complex 39A targeting October 2024.
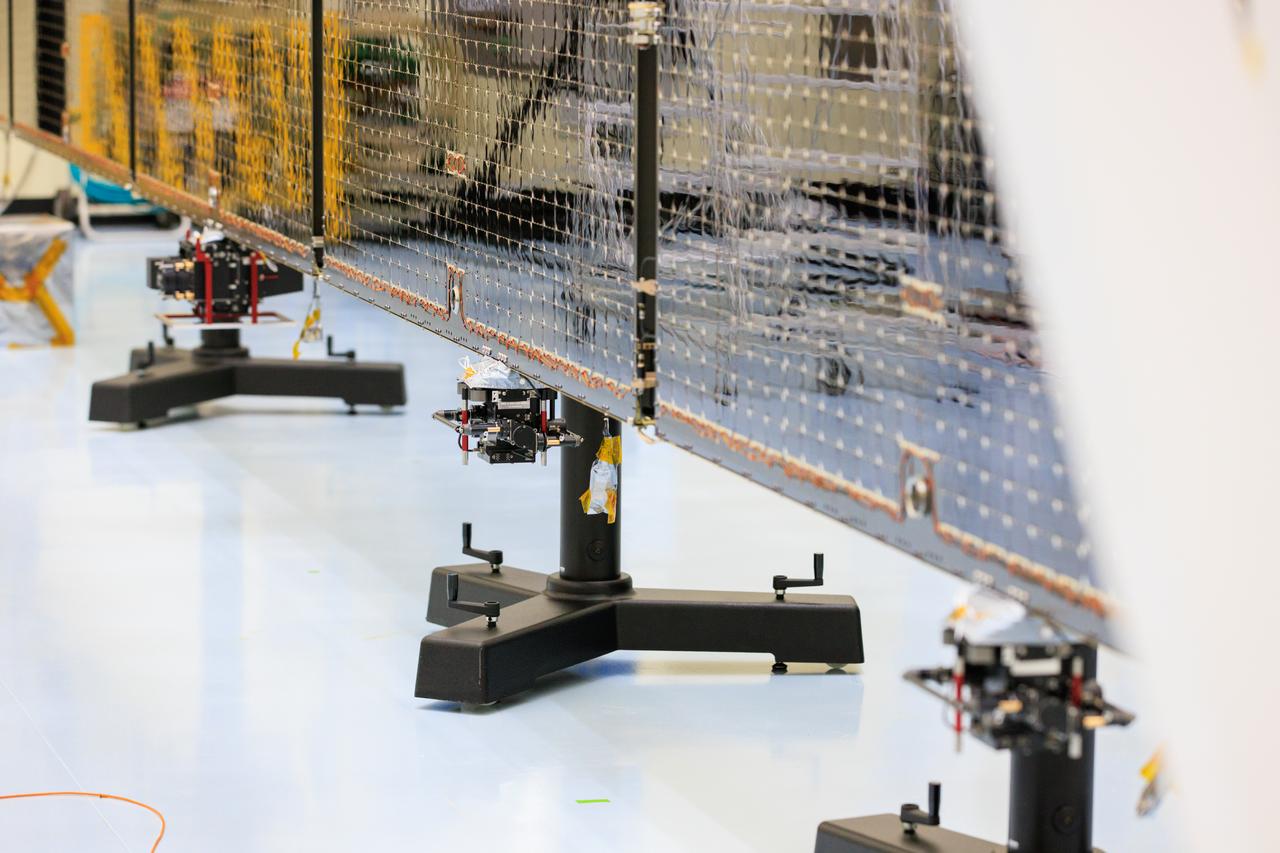
Technicians inside the Payload Hazardous Servicing Facility at NASA’s Kennedy Space Center in Florida install and test antennas on a solar array on Wednesday, March 20, 2024, for the agency’s Europa Clipper spacecraft which will study Jupiter’s icy moon Europa to determine if the planet has conditions that could support life. The REASON, (Radar for Europa Assessment and Sounding: Ocean to Near-surface) instrument will use the antennas to send both High Frequency (HF) and Very High Frequency (VHF) radio waves to penetrate up to 18 miles (30 kilometers) deep and search the ocean, measure ice thickness, and study the topography, composition, and roughness of Europa’s surface. The Europa Clipper spacecraft will ship to Florida later this year from NASA’s Jet Propulsion Lab in Southern California in preparation for launch aboard a SpaceX Falcon Heavy rocket from Kennedy’s Launch Complex 39A targeting October.
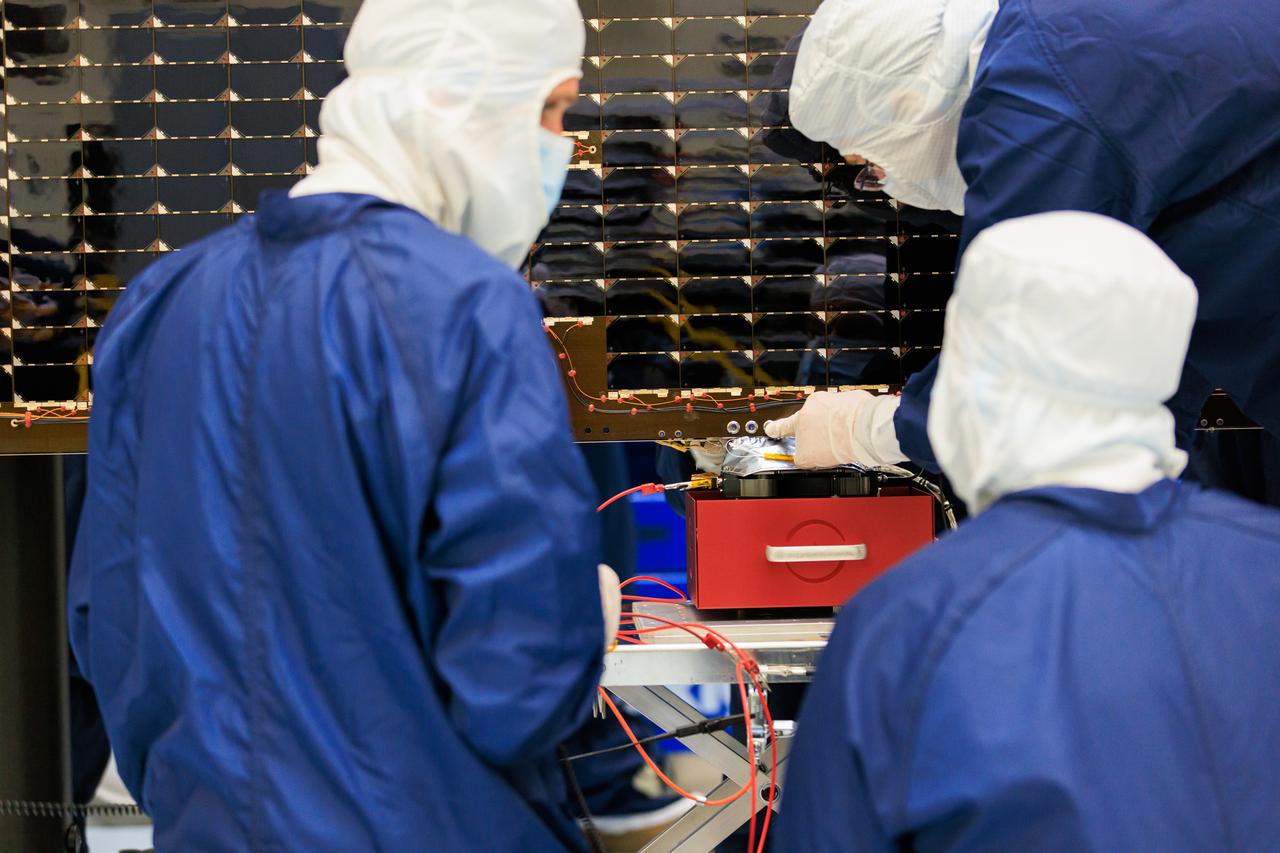
Technicians inside the Payload Hazardous Servicing Facility at NASA’s Kennedy Space Center in Florida install and test one of several antennas on a solar array Wednesday, March 20, 2024, for the agency’s Europa Clipper spacecraft which will study Jupiter’s icy moon Europa to determine if the planet has conditions that could support life. REASON, (Radar for Europa Assessment and Sounding: Ocean to Near-surface) instrument will use the antennas to send both High Frequency (HF) and Very High Frequency (VHF) radio waves to penetrate up to 18 miles (30 kilometers) deep and search the ocean, measure ice thickness, and study the topography, composition, and roughness of Europa’s surface. The Europa Clipper spacecraft will ship to Florida later this year from NASA’s Jet Propulsion Lab in Southern California in preparation for launch aboard a SpaceX Falcon Heavy rocket from Kennedy’s Launch Complex 39A targeting October 2024.
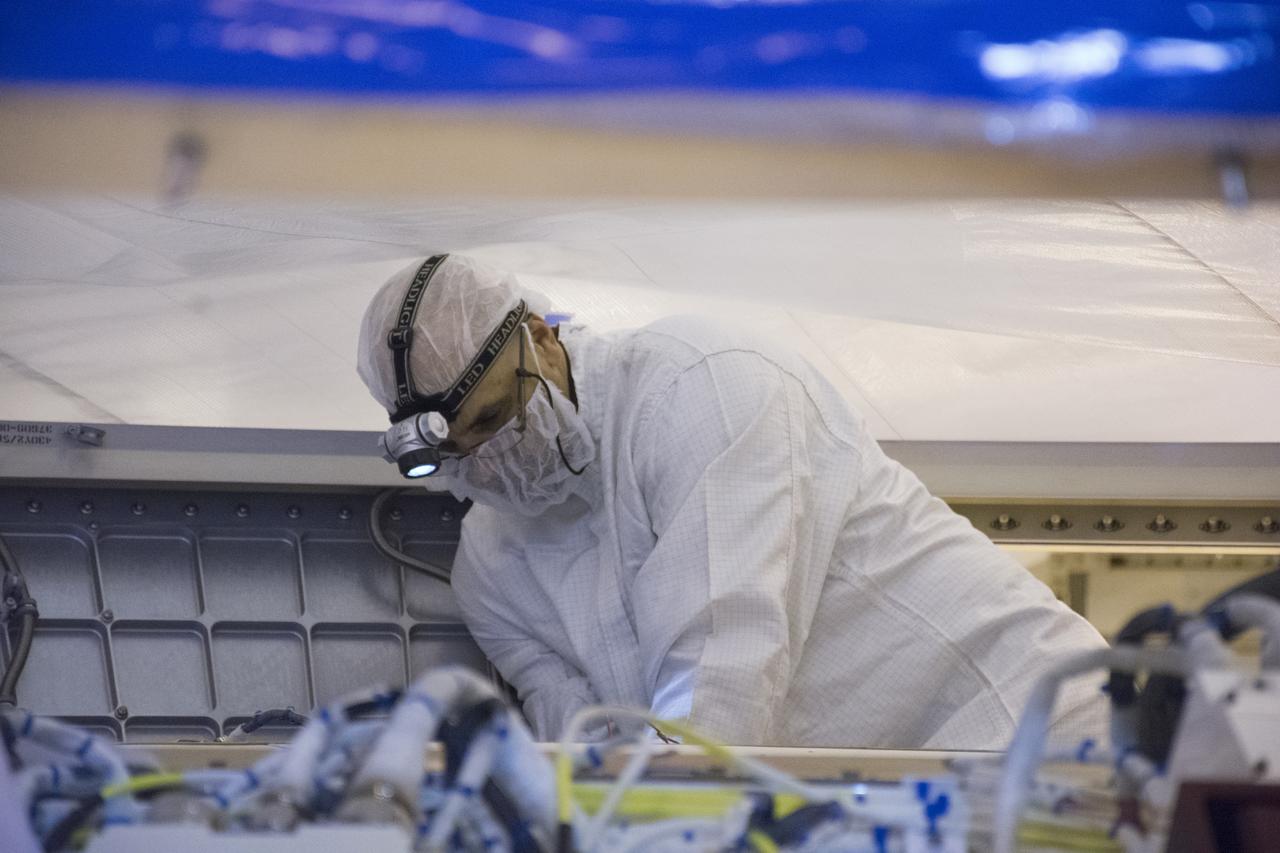
In the gantry at Space Launch Complex 3 at Vandenberg Air Force Base in California, a technician prepares batteries for installation in NASA's Interior Exploration using Seismic Investigations, Geodesy and Heat Transport, or InSight, Mars lander. InSight will be the first mission to look deep beneath the Martian surface. It will study the planet's interior by measuring its heat output and listen for marsquakes. The spacecraft will use the seismic waves generated by marsquakes to develop a map of the planet’s deep interior. The resulting insight into Mars’ formation will provide a better understanding of how other rocky planets, including Earth, were created. InSight is scheduled for liftoff May 5, 2018.
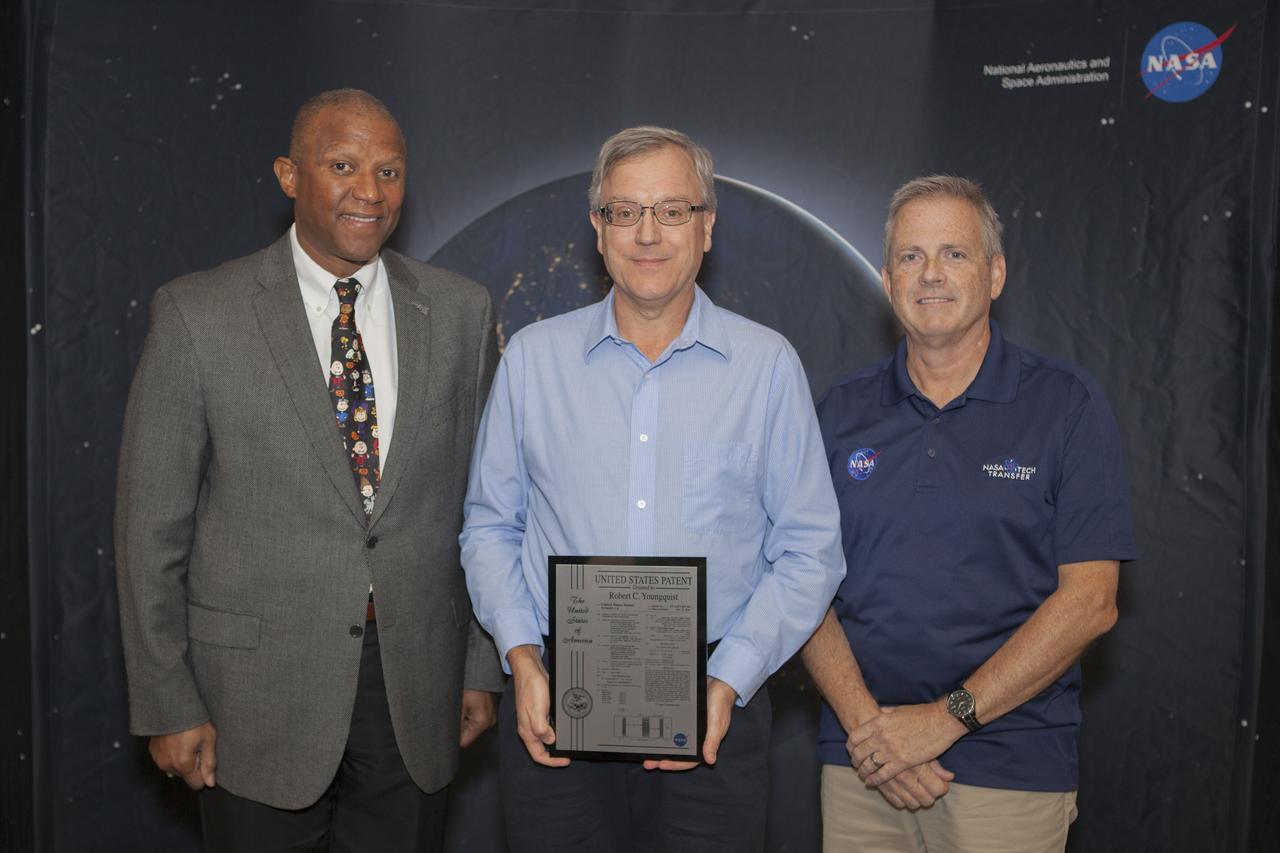
Robert Youngquist, center, Applied Physics Laboratory lead, received a U.S. Patent plaque for his invention, Surface Acoustic Wave Tag-Based Coherence Multiplexing, during the 2017 Innovation Expo at NASA's Kennedy Space Center in Florida. From left, are Kelvin Manning, Kennedy's associate director; Youngquist; and Dave Makufka, Kennedy's Technology Transfer Program manager. The purpose of the annual two-day expo is to help foster innovation and creativity among the Kennedy workforce. The event included several keynote speakers, training opportunities, an innovation showcase and the KSC Kickstart competition.
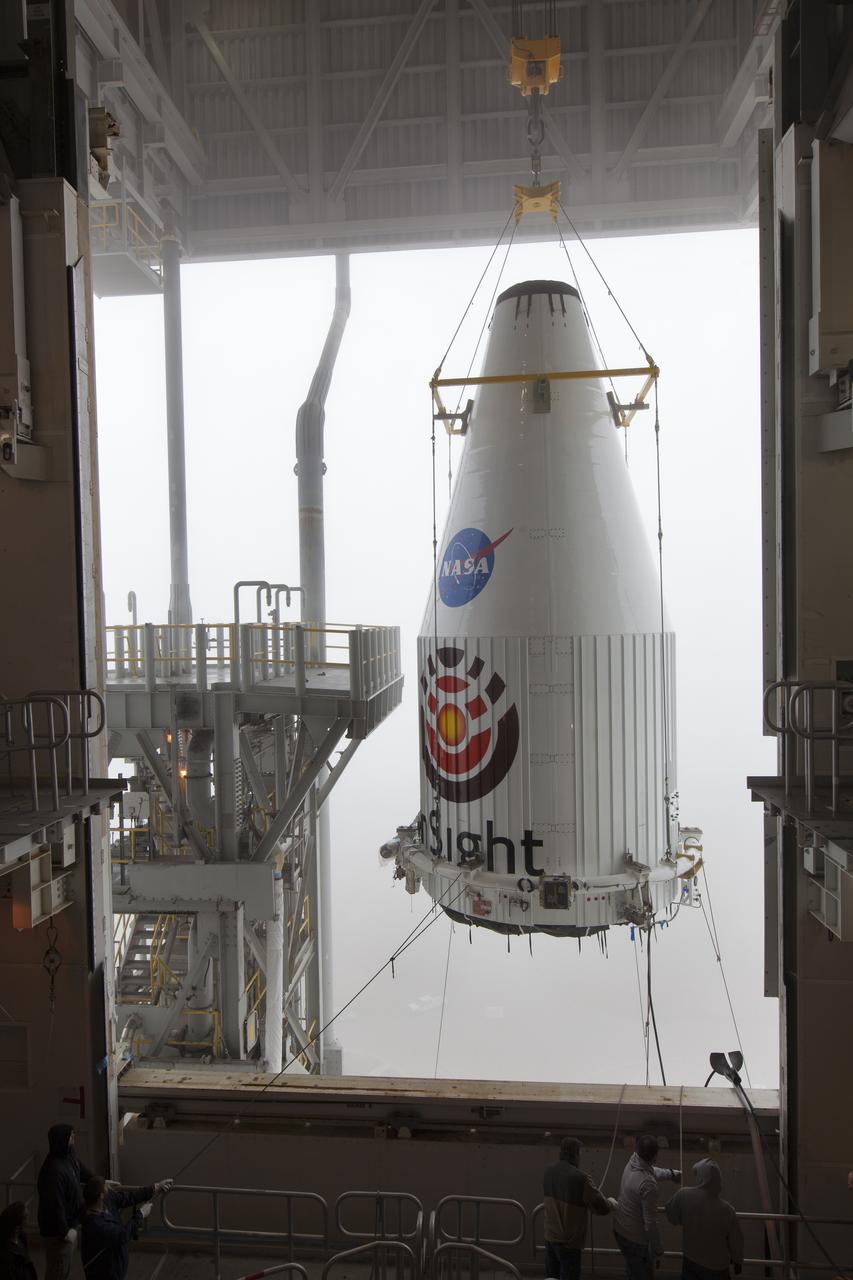
At Space l Launch Complex 3 at Vandenberg Air Force Base in California, a crane is used to lift NASA's Interior Exploration using Seismic Investigations, Geodesy and Heat Transport, or InSight, Mars lander for mating atop a United Launch Alliance Atlas V rocket. InSight will be the first mission to look deep beneath the Martian surface. It will study the planet's interior by measuring its heat output and listen for marsquakes. The spacecraft will use the seismic waves generated by marsquakes to develop a map of the planet’s deep interior. The resulting insight into Mars’ formation will provide a better understanding of how other rocky planets, including Earth, were created. InSight is scheduled for liftoff May 5, 2018.

In the Astrotech facility at Vandenberg Air Force Base in California, NASA's Interior Exploration using Seismic Investigations, Geodesy and Heat Transport, or InSight, Mars lander is encapsulated in its payload fairing. InSight will be the first mission to look deep beneath the Martian surface. It will study the planet's interior by measuring its heat output and listen for marsquakes. The spacecraft will use the seismic waves generated by marsquakes to develop a map of the planet’s deep interior. The resulting insight into Mars’ formation will provide a better understanding of how other rocky planets, including Earth, were created. InSight is scheduled for liftoff May 5, 2018.
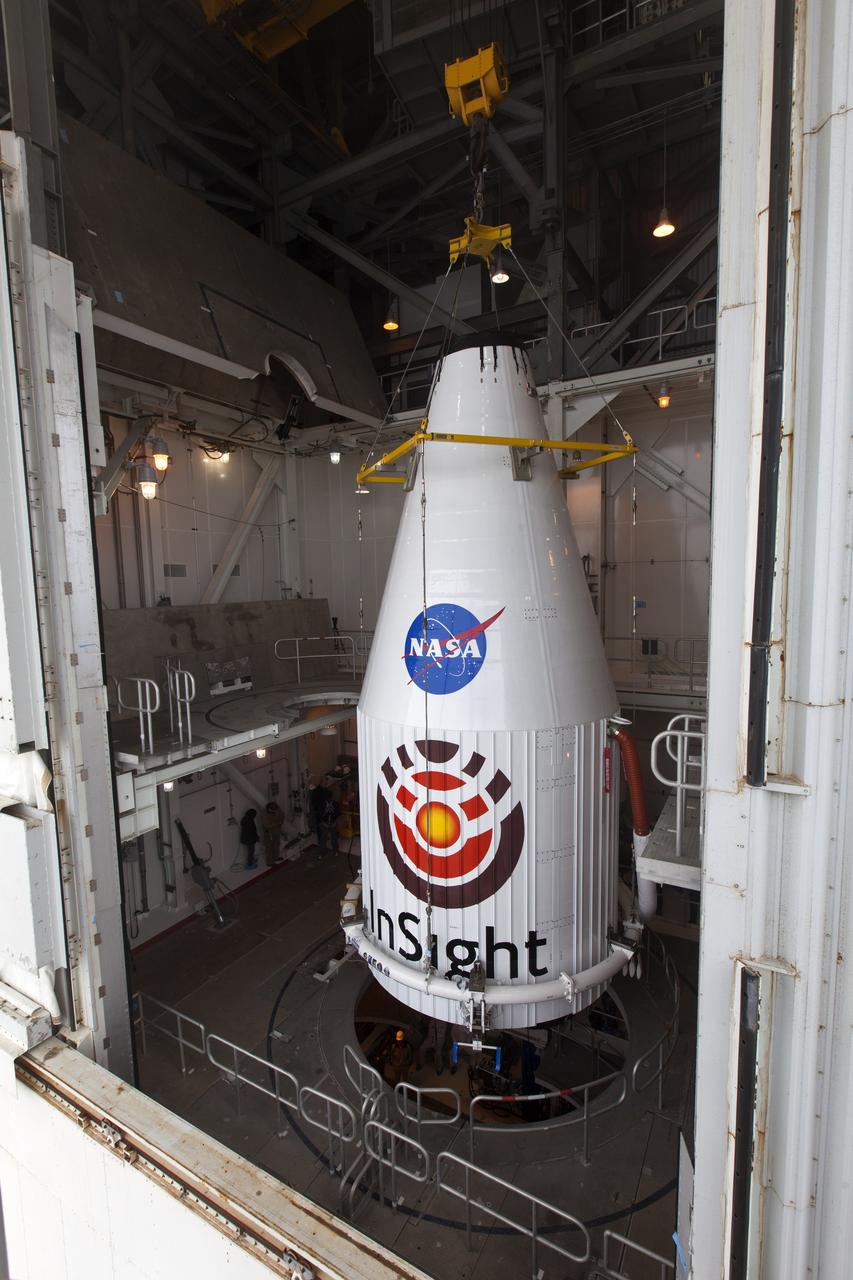
At Space Launch Complex 3 at Vandenberg Air Force Base in California, NASA's Interior Exploration using Seismic Investigations, Geodesy and Heat Transport, or InSight, Mars lander is positioned atop a United Launch Alliance Atlas V rocket. InSight will be the first mission to look deep beneath the Martian surface. It will study the planet's interior by measuring its heat output and listen for marsquakes. The spacecraft will use the seismic waves generated by marsquakes to develop a map of the planet’s deep interior. The resulting insight into Mars’ formation will provide a better understanding of how other rocky planets, including Earth, were created. InSight is scheduled for liftoff May 5, 2018.
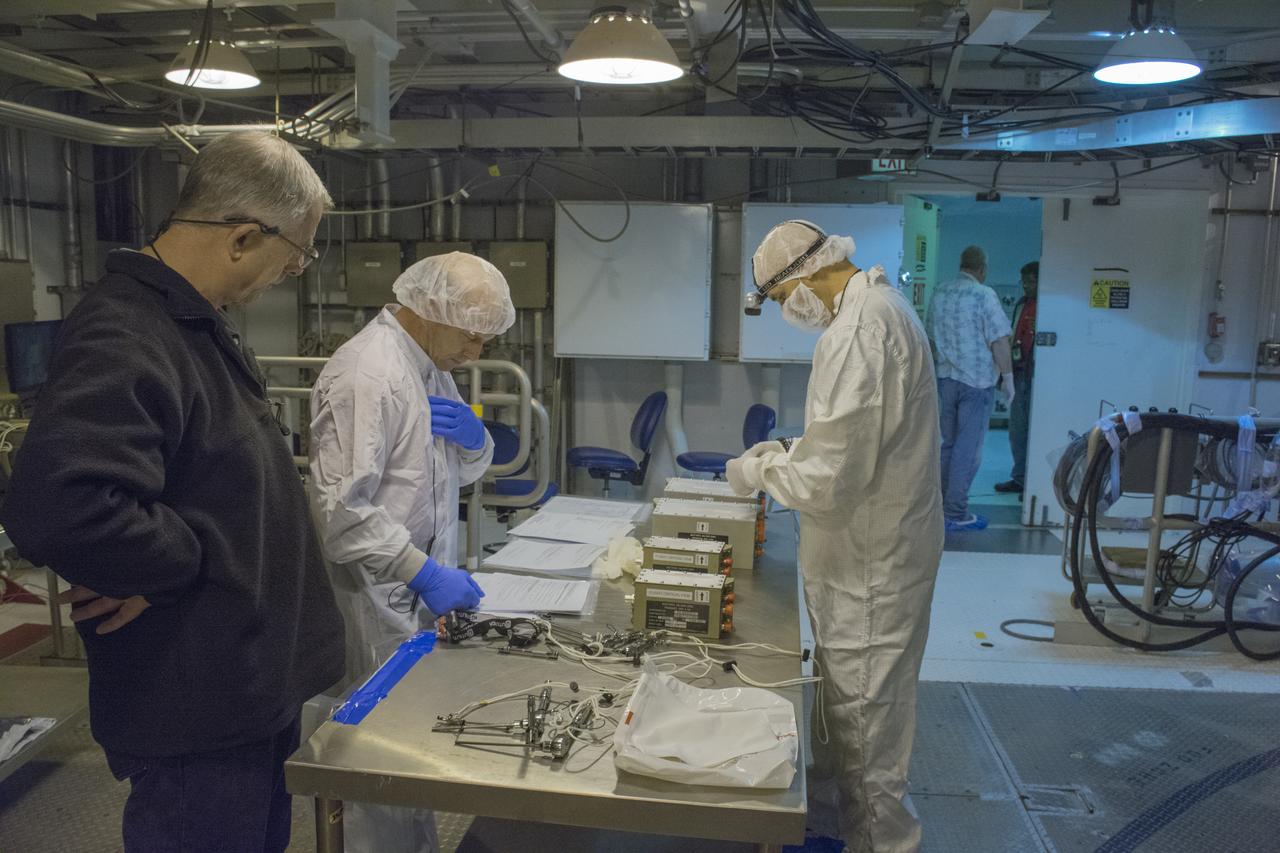
In the gantry at Space Launch Complex 3 at Vandenberg Air Force Base in California, technicians and engineers prepare batteries for installation in NASA's Interior Exploration using Seismic Investigations, Geodesy and Heat Transport, or InSight, Mars lander. InSight will be the first mission to look deep beneath the Martian surface. It will study the planet's interior by measuring its heat output and listen for marsquakes. The spacecraft will use the seismic waves generated by marsquakes to develop a map of the planet’s deep interior. The resulting insight into Mars’ formation will provide a better understanding of how other rocky planets, including Earth, were created. InSight is scheduled for liftoff May 5, 2018.
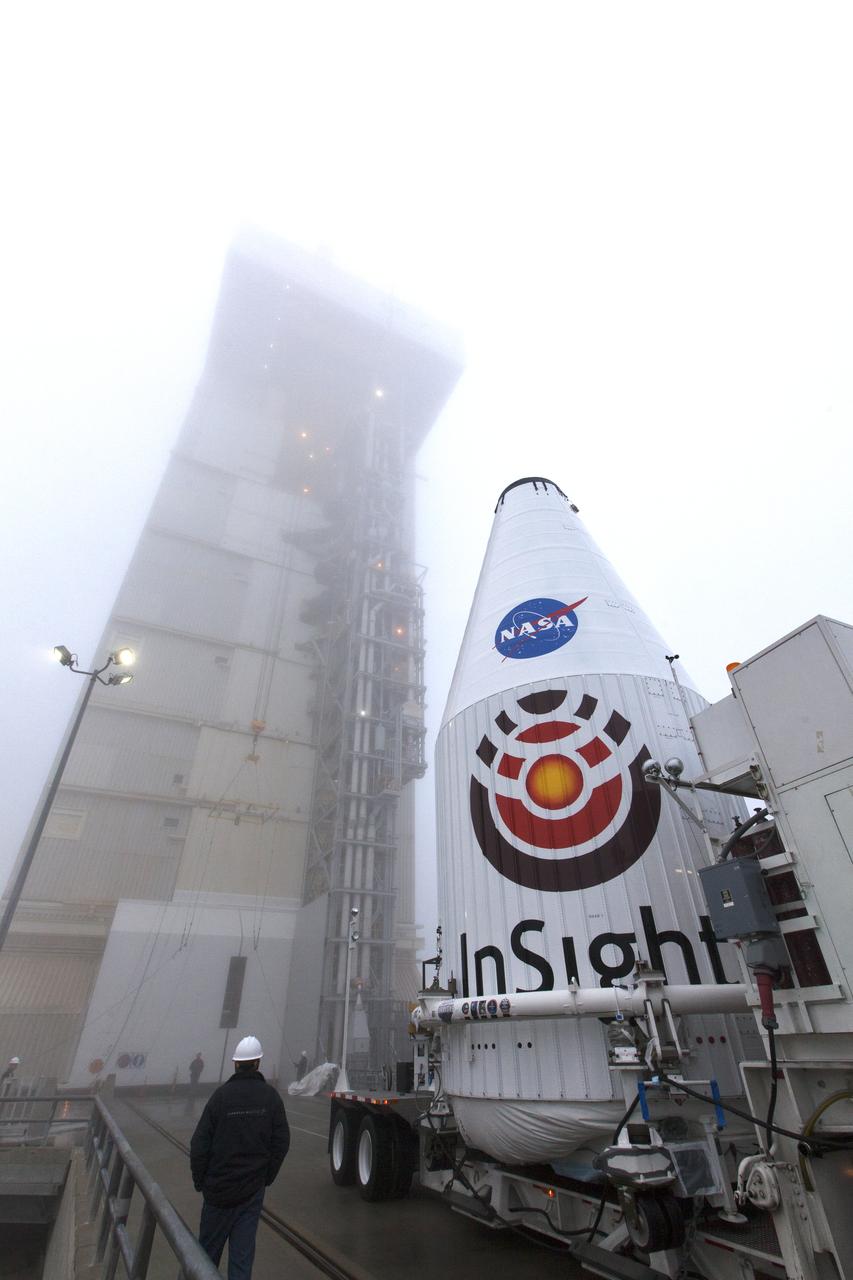
Encapsulated in its payload fairing NASA's Interior Exploration using Seismic Investigations, Geodesy and Heat Transport, or InSight, Mars lander arrives at Space Launch Complex 3 at Vandenberg Air Force Base in California. InSight will be the first mission to look deep beneath the Martian surface. It will study the planet's interior by measuring its heat output and listen for marsquakes. The spacecraft will use the seismic waves generated by marsquakes to develop a map of the planet’s deep interior. The resulting insight into Mars’ formation will provide a better understanding of how other rocky planets, including Earth, were created. InSight is scheduled for liftoff May 5, 2018.
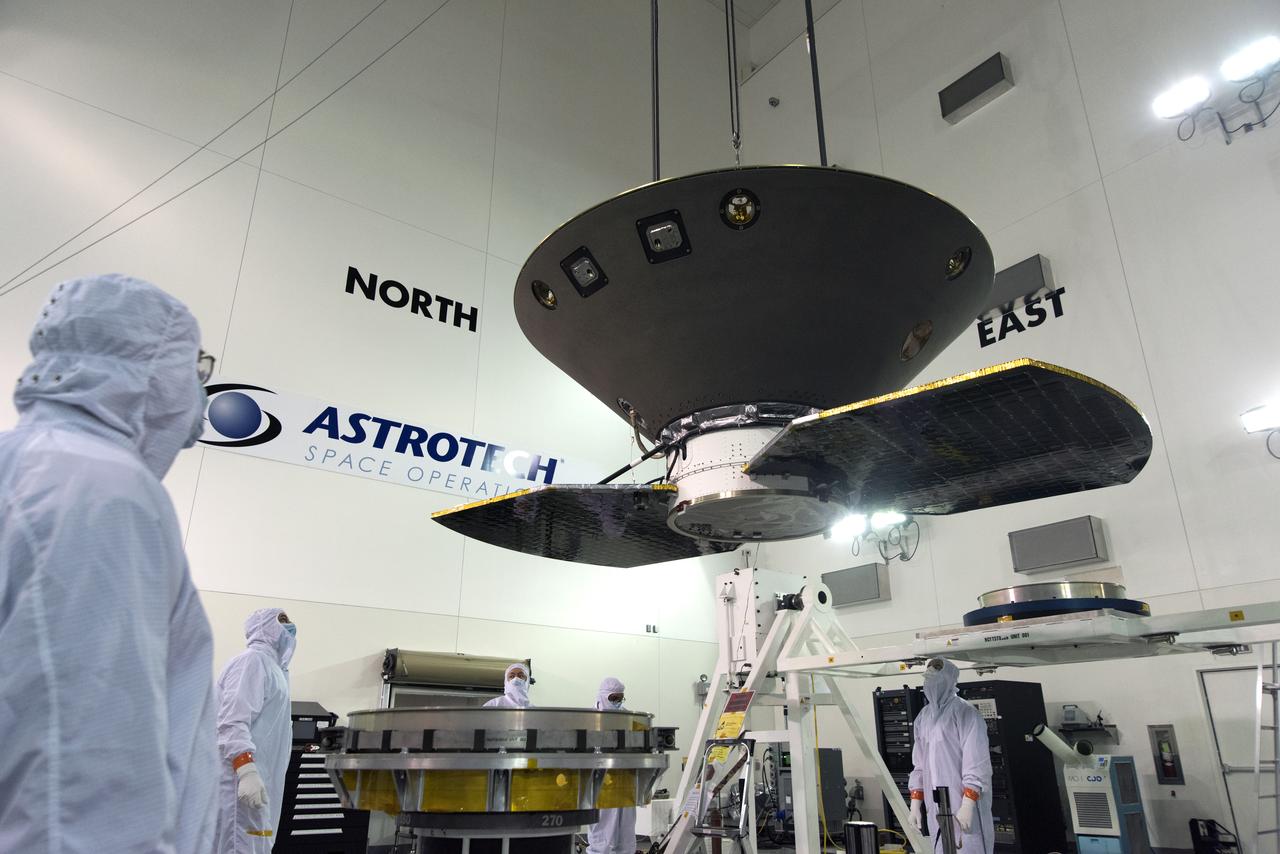
In the Astrotech facility at Vandenberg Air Force Base in California, NASA's Interior Exploration using Seismic Investigations, Geodesy and Heat Transport, or InSight, spacecraft is lifted for placement on a spin table during preflight processing. InSight will be the first mission to look deep beneath the Martian surface. It will study the planet's interior by measuring its heat output and listen for marsquakes. The spacecraft will use the seismic waves generated by marsquakes to develop a map of the planet’s deep interior. The resulting insight into Mars’ formation will provide a better understanding of how other rocky planets, including Earth, were created. InSight is scheduled for liftoff May 5, 2018.
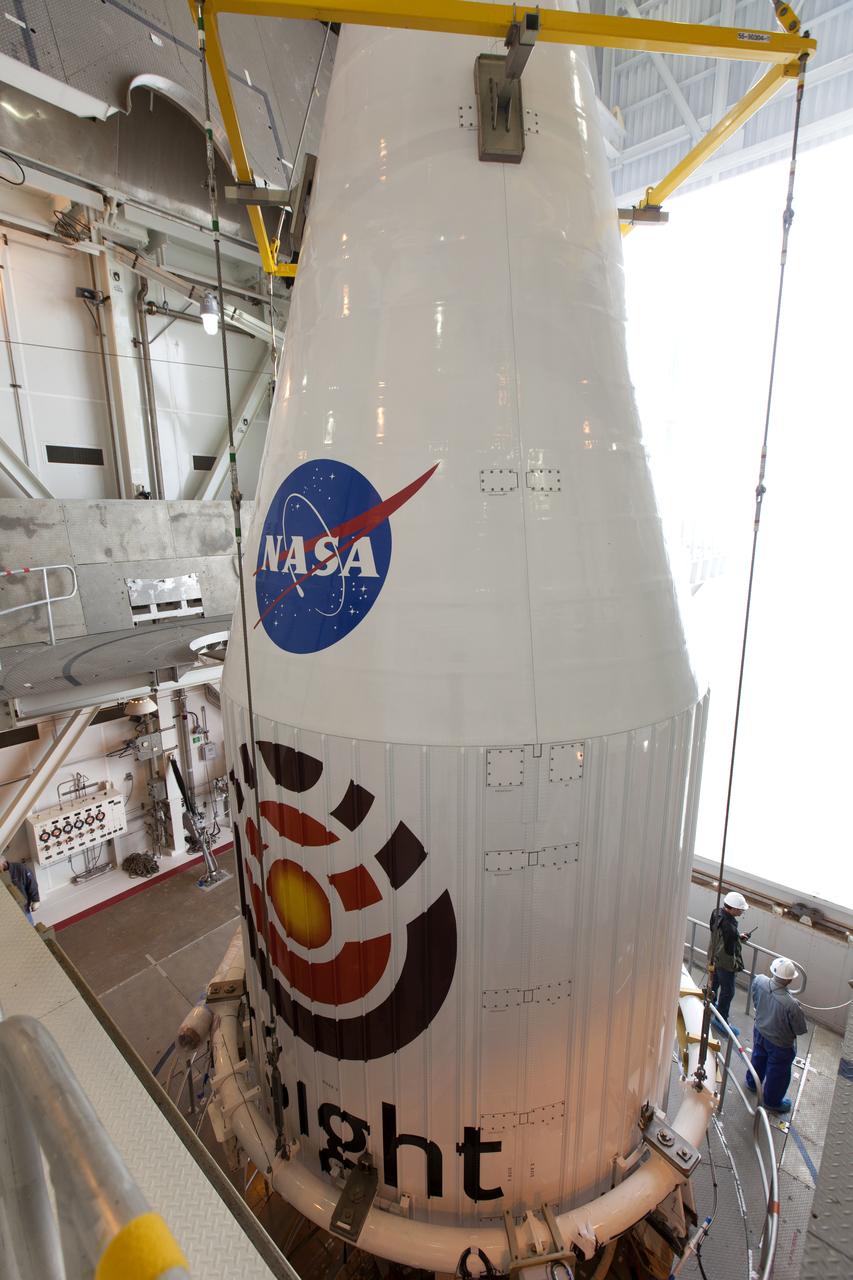
At Space Launch Complex 3 at Vandenberg Air Force Base in California, NASA's Interior Exploration using Seismic Investigations, Geodesy and Heat Transport, or InSight, Mars lander is positioned atop a United Launch Alliance Atlas V rocket. InSight will be the first mission to look deep beneath the Martian surface. It will study the planet's interior by measuring its heat output and listen for marsquakes. The spacecraft will use the seismic waves generated by marsquakes to develop a map of the planet’s deep interior. The resulting insight into Mars’ formation will provide a better understanding of how other rocky planets, including Earth, were created. InSight is scheduled for liftoff May 5, 2018.