
Global tropospheric methane for August 2005 retrieved from the Atmospheric Infrared Sounder AIRS on NASA Aqua satellite.
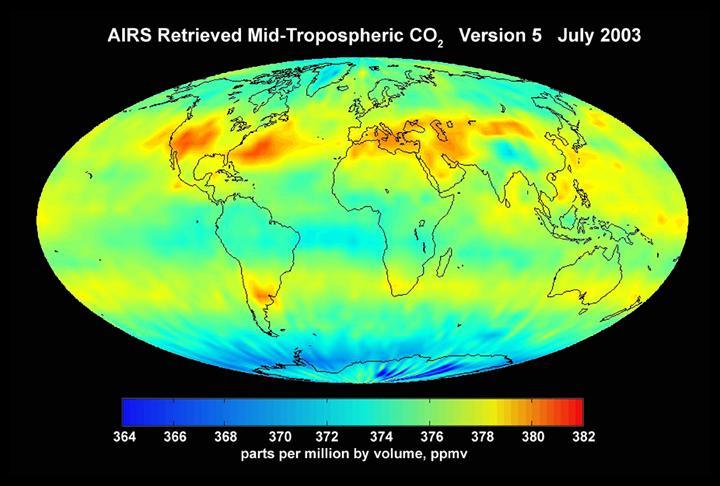
AIRS mid-tropospheric CO2, Version 5, July 2003 from the Atmospheric Infrared Sounder AIRS on NASA Aqua satellite.

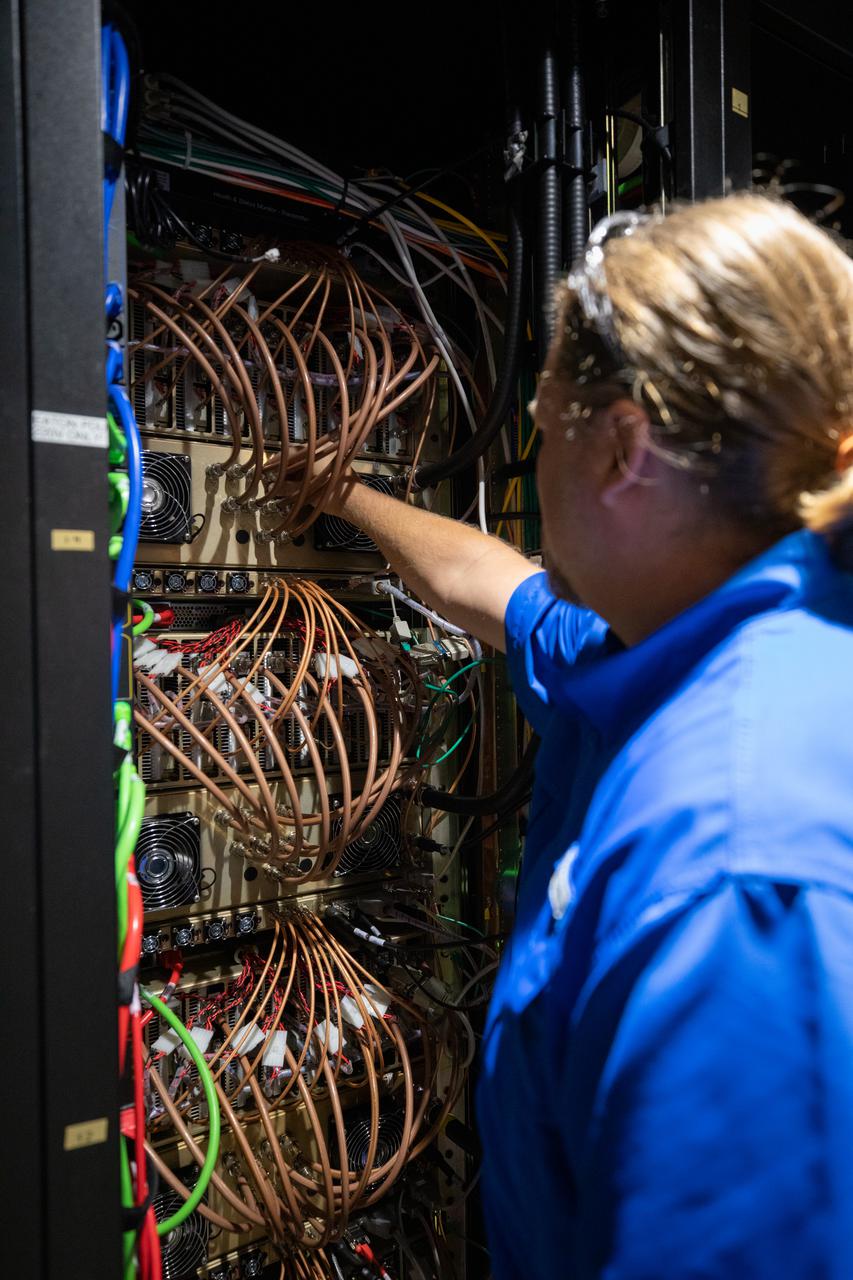
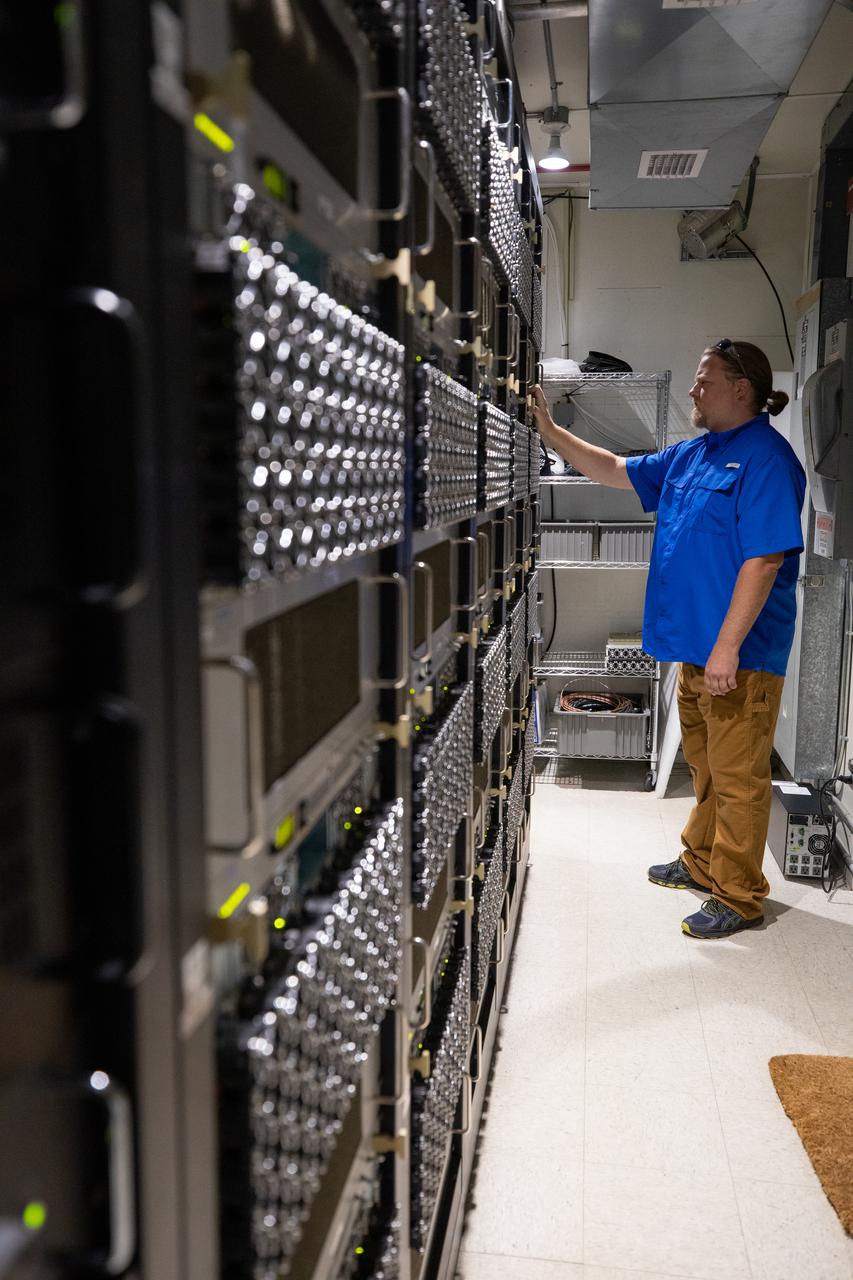
The Tropospheric Doppler Radar Wind Profiler (TDRWP), located at Kennedy Space Center, is the only instrument of its kind in operation. Consisting of 640 antennae and occupying five acres near the Launch and Landing Facility, the TDRWP operates at nearly 50 MHz. It will be used as a primary instrument to measure upper level winds for NASA’s Artemis missions, which will launch from the Florida spaceport. The instrument has the ability to provide data from 6,000 to 62,000 feet, every five minutes, far outpacing weather balloons.
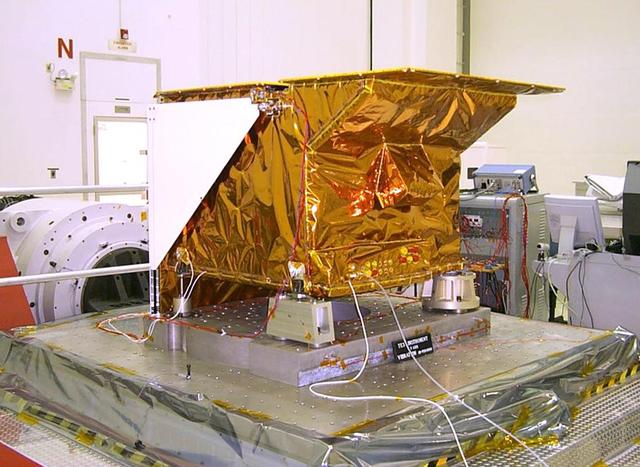
Technicians install NASA's Tropospheric Emission Spectrometer (TES) instrument on NASA's Aura spacecraft prior to launch. Launched in July 2004 and designed to fly for two years, the TES mission is currently in an extended operations phase. Mission managers at NASA's Jet Propulsion Laboratory, Pasadena, California, are evaluating an alternate way to collect and process science data from the Tropospheric Emission Spectrometer (TES) instrument on NASA's Aura spacecraft following the age-related failure of a critical instrument component. TES is an infrared sensor designed to study Earth's troposphere, the lowermost layer of Earth's atmosphere, which is where we live. The remainder of the TES instrument, and the Aura spacecraft itself, are operating as expected, and TES continues to collect science data. TES is one of four instruments on Aura, three of which are still operating. http://photojournal.jpl.nasa.gov/catalog/PIA15608

This map created with data from the AIRS on NASA Aqua satellite shows the concentration of carbon dioxide in Earth mid-troposphere, located roughly between 3 to 6 miles 5 to 9 kilometers in altitude.

This graph made with data from the AIRS instrument on NASA Aqua satellite shows the concentration of carbon dioxide in Earth mid-troposphere, located roughly between 3 to 6 miles 5 to 9 kilometers in altitude.

This plot shows the concentration of carbon dioxide in Earth mid-troposphere at various latitudes as measured by NASA Aqua satellite. The colored lines represent different latitude bands that circle Earth, called zones.
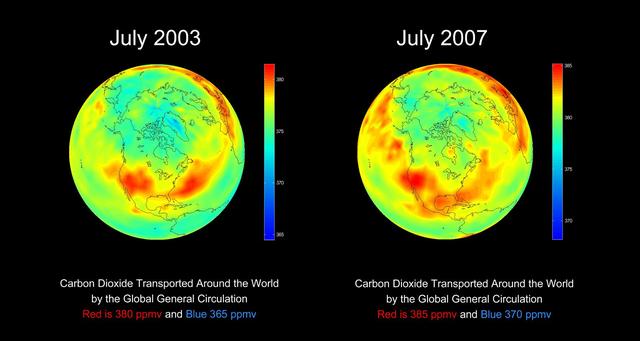
AIRS global distribution of mid-tropospheric carbon dioxide at 8-13 km altitudes between July 2003 and 2007, from the Atmospheric Infrared Sounder AIRS on NASA Aqua satellite.
This frame from a time series, from one year of Tropospheric Emission Spectrometer TES measurements, shows how powerful the TES data are for understanding emissions, chemistry, and transport in the troposphere.

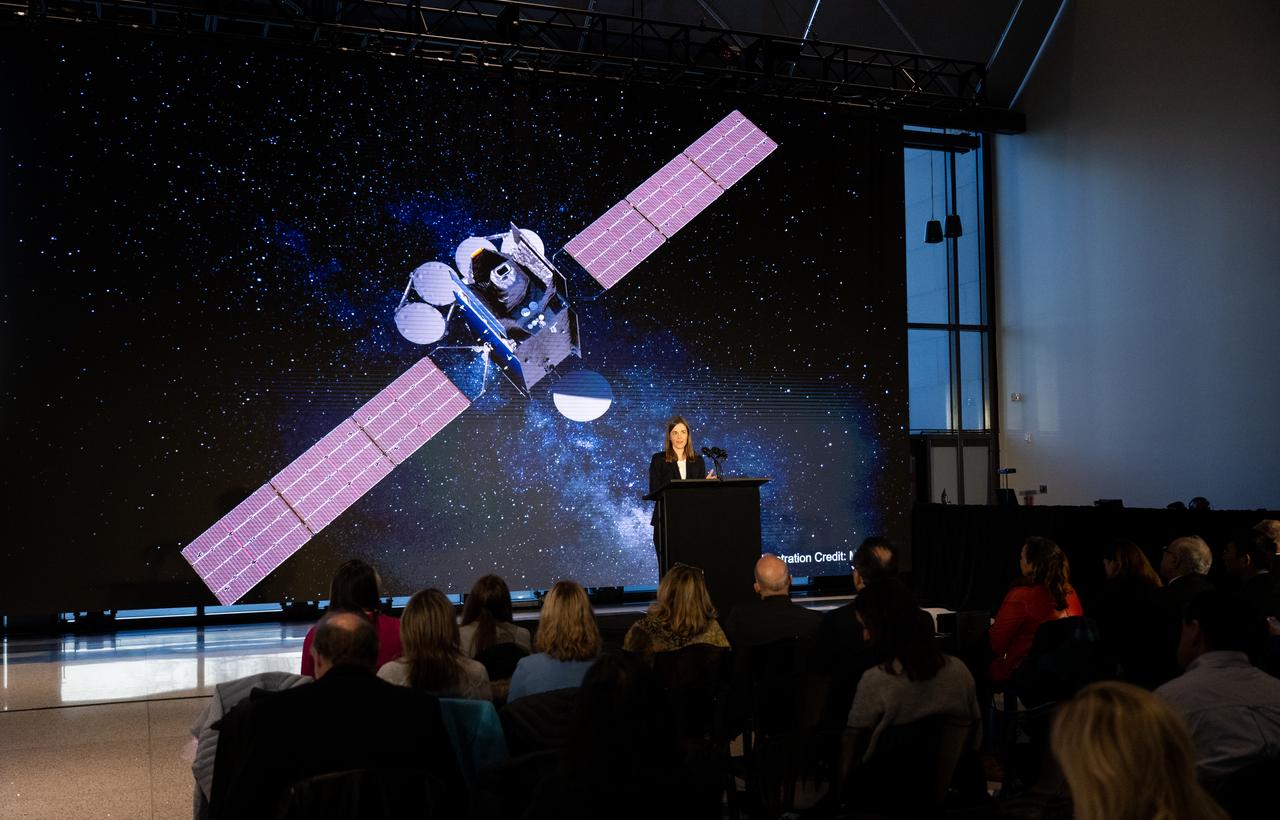
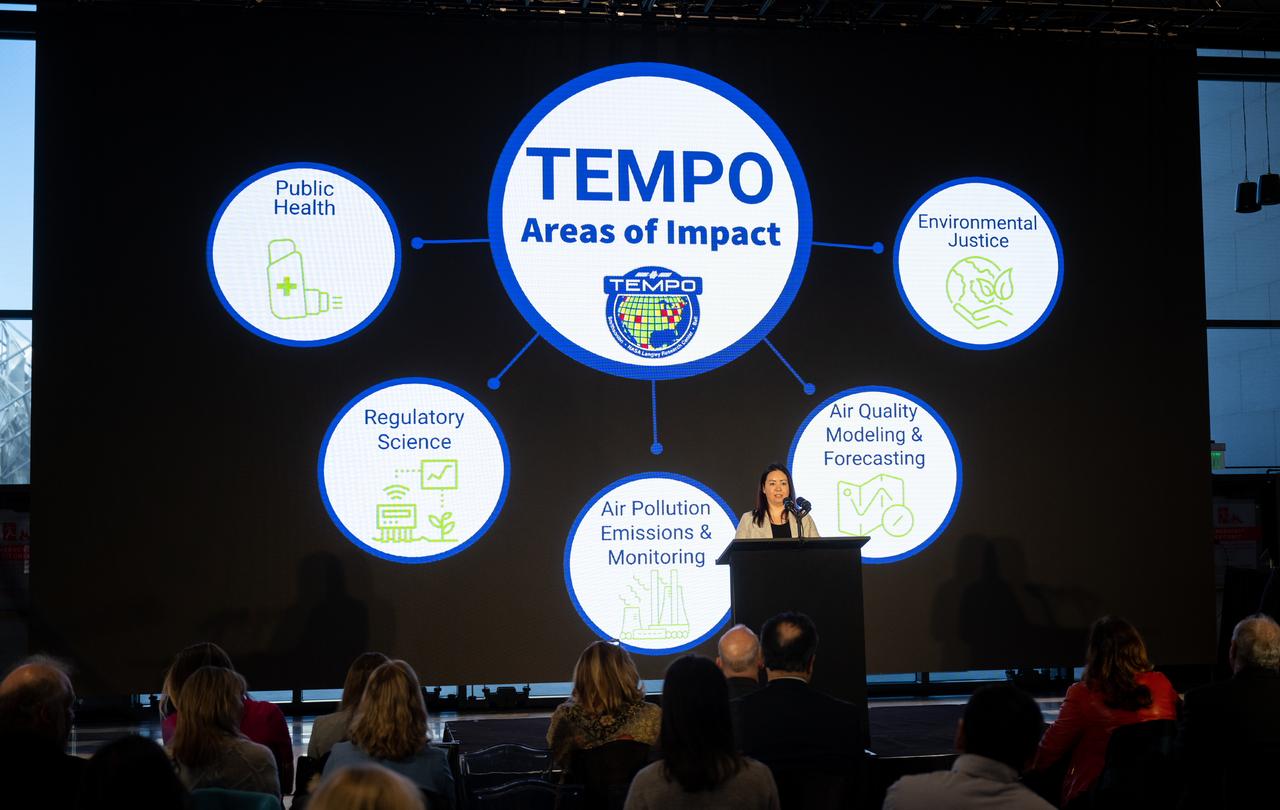
Barry Lefer, tropospheric composition program manager in the Earth Science Division of NASA’s Science Mission Directorate, speaks during a briefing on NASA’s TEMPO (Tropospheric Emissions: Monitoring of Pollution) instrument, Tuesday, March 14, 2023 at the Smithsonian’s National Air and Space Museum in Washington. NASA’s TEMPO instrument, the first Earth Venture Instrument mission, will measure air pollution across North America from Mexico City to the Canadian oil sands and from the Atlantic to the Pacific hourly and at a high spatial resolution. A partnership between NASA and the Center for Astrophysics | Harvard & Smithsonian, TEMPO will launch on a commercial satellite to geostationary orbit as early as April. Photo Credit: (NASA/Joel Kowsky)

Barry Lefer, tropospheric composition program manager in the Earth Science Division of NASA’s Science Mission Directorate, speaks during a briefing on NASA’s TEMPO (Tropospheric Emissions: Monitoring of Pollution) instrument, Tuesday, March 14, 2023 at the Smithsonian’s National Air and Space Museum in Washington. NASA’s TEMPO instrument, the first Earth Venture Instrument mission, will measure air pollution across North America from Mexico City to the Canadian oil sands and from the Atlantic to the Pacific hourly and at a high spatial resolution. A partnership between NASA and the Center for Astrophysics | Harvard & Smithsonian, TEMPO will launch on a commercial satellite to geostationary orbit as early as April. Photo Credit: (NASA/Joel Kowsky)

Barry Lefer, tropospheric composition program manager in the Earth Science Division of NASA’s Science Mission Directorate, speaks during a briefing on NASA’s TEMPO (Tropospheric Emissions: Monitoring of Pollution) instrument, Tuesday, March 14, 2023 at the Smithsonian’s National Air and Space Museum in Washington. NASA’s TEMPO instrument, the first Earth Venture Instrument mission, will measure air pollution across North America from Mexico City to the Canadian oil sands and from the Atlantic to the Pacific hourly and at a high spatial resolution. A partnership between NASA and the Center for Astrophysics | Harvard & Smithsonian, TEMPO will launch on a commercial satellite to geostationary orbit as early as April. Photo Credit: (NASA/Joel Kowsky)

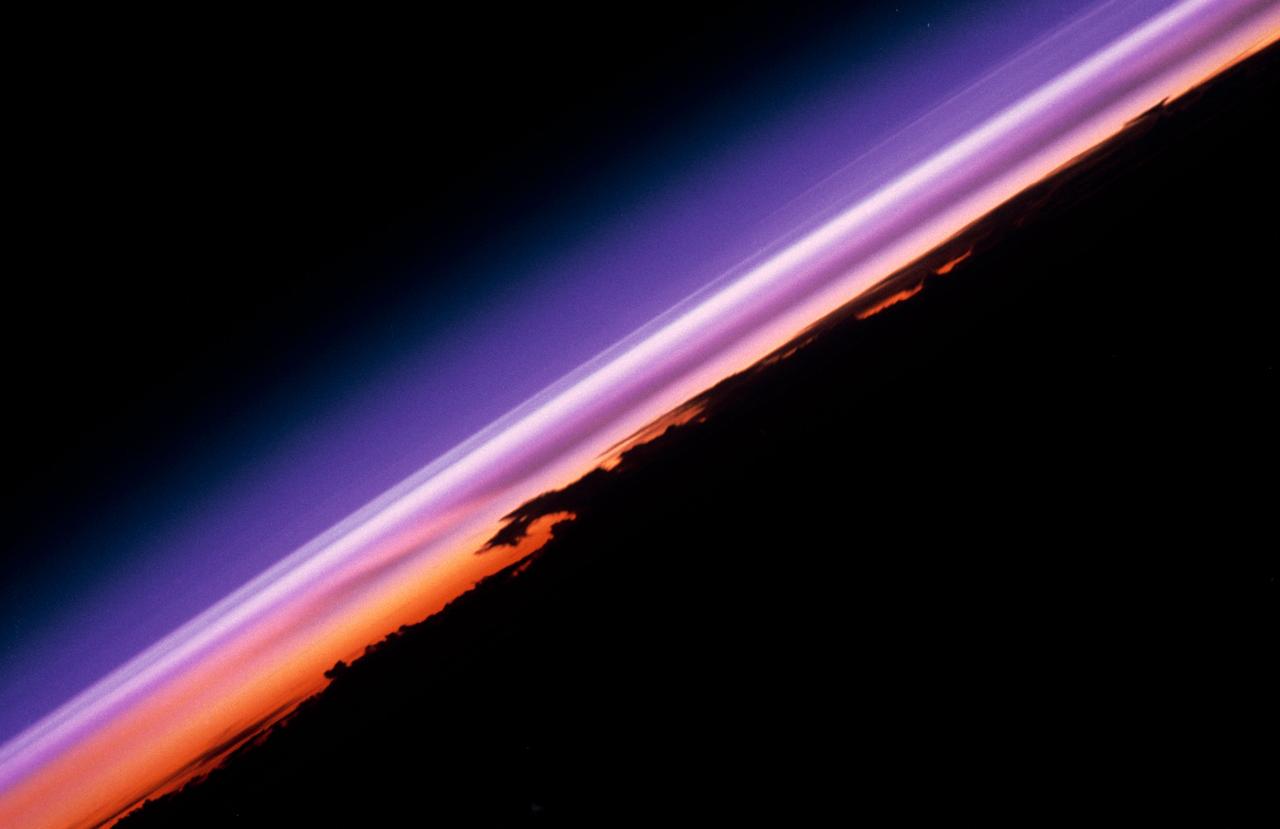
This cross section of the Earth's atmosphere at sunset and earth limb (24.5S, 43.5E) displays an unusual layering believed to be caused by temperature inversions which effectively concentrate smoke, dust and aerosols into narrow layers. the top of the stratosphere can be seen as the top of the white layer thought to contain volcanic debris. The purple layer is the troposphere containing smoke from landclearing biomass burning.
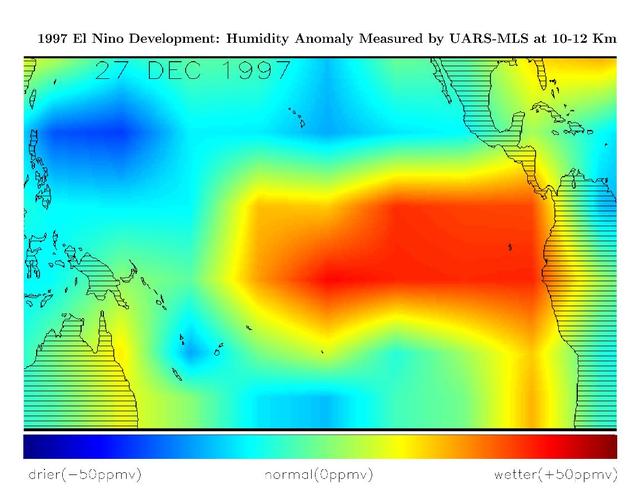
This image shows differences in atmospheric water vapor relative to a normal average year in the Earth upper troposphere about 10 kilometers 6 miles above the surface.
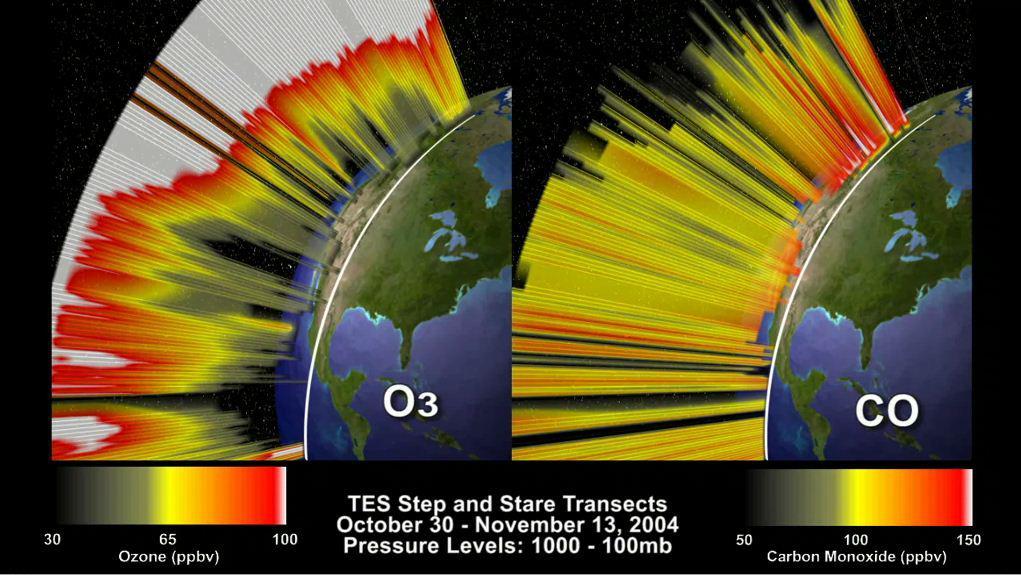
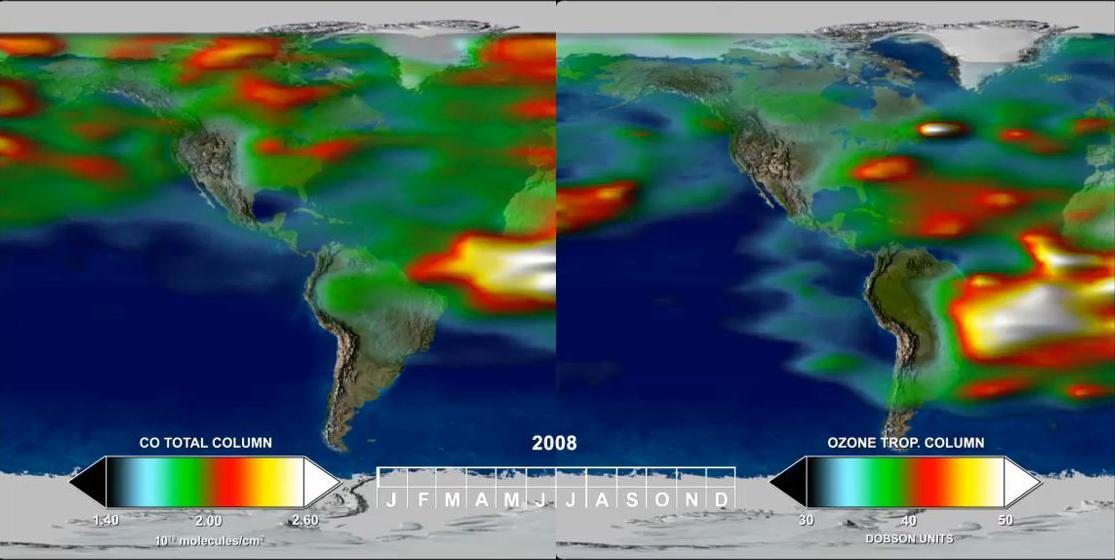
This frame from an animation depicts the distribution of O3 and CO in the atmosphere over North America. This visualization is based on data acquired by NASA Tropospheric Emission Spectrometer TES.

This image shows differences in atmospheric water vapor relative to a normal average year in the Earth upper troposphere about 10 kilometers 6 miles above the surface.
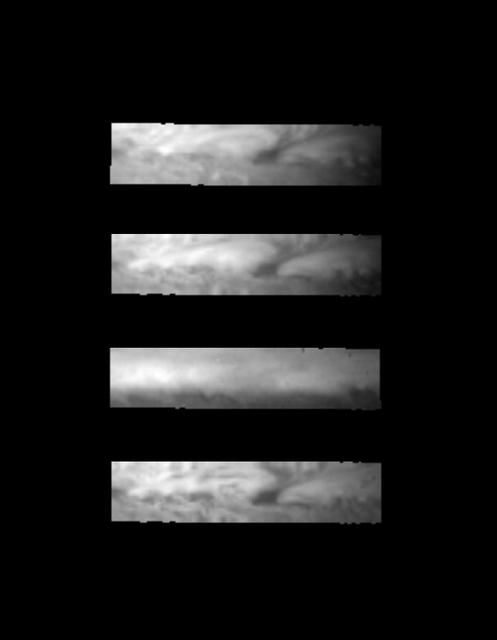
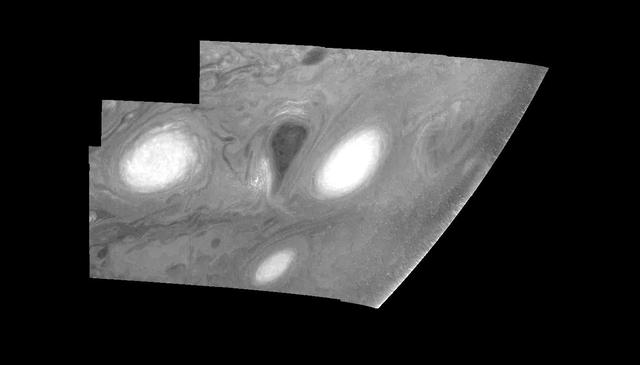
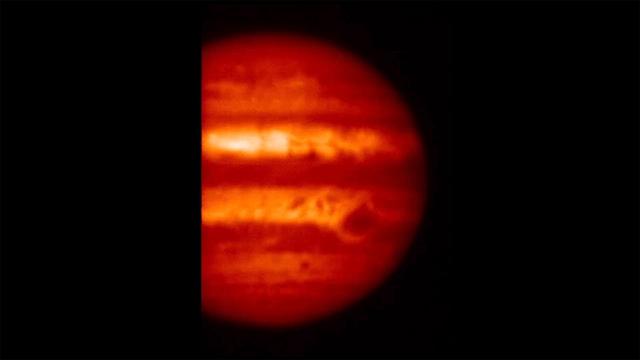
These images, acquired December 17, 1996 by NASA Galileo orbiter, show a small portion of the equatorial region of Jupiter of a dark clearing of clouds in the meteorologically-active troposphere.

This image shows the distribution and amount of carbon dioxide in Earth mid-troposphere in July 2008 as measured by NASA Atmospheric Infrared Sounder AIRS instrument.

Erika Wright, education specialist at the Center for Astrophysics | Harvard & Smithsonian, speaks during a briefing on NASA’s TEMPO (Tropospheric Emissions: Monitoring of Pollution) instrument, Tuesday, March 14, 2023 at the Smithsonian’s National Air and Space Museum in Washington. NASA’s TEMPO instrument, the first Earth Venture Instrument mission, will measure air pollution across North America from Mexico City to the Canadian oil sands and from the Atlantic to the Pacific hourly and at a high spatial resolution. A partnership between NASA and the Center for Astrophysics | Harvard & Smithsonian, TEMPO will launch on a commercial satellite to geostationary orbit as early as April. Photo Credit: (NASA/Joel Kowsky)

Caroline Nowlan, atmospheric physicist at the Center for Astrophysics | Harvard & Smithsonian, speaks during a briefing on NASA’s TEMPO (Tropospheric Emissions: Monitoring of Pollution) instrument, Tuesday, March 14, 2023 at the Smithsonian’s National Air and Space Museum in Washington. NASA’s TEMPO instrument, the first Earth Venture Instrument mission, will measure air pollution across North America from Mexico City to the Canadian oil sands and from the Atlantic to the Pacific hourly and at a high spatial resolution. A partnership between NASA and the Center for Astrophysics | Harvard & Smithsonian, TEMPO will launch on a commercial satellite to geostationary orbit as early as April. Photo Credit: (NASA/Joel Kowsky)
Weather Instrumentation Engineer Nick O’Connor works with the Tropospheric Doppler Radar Wind Profiler at Kennedy Space Center in Florida during an Artemis I weather simulation on Nov. 3, 2021. The simulation involved teams from Kennedy, Cape Canaveral Space Force Station, Johnson Space Center in Texas, and Marshall Space Flight Center in Alabama. The radar wind profiler delivers data – from 6,000 to 62,000 feet – every five minutes. It will be used as the primary upper level wind instrument for NASA’s Artemis missions, including Artemis I, the first launch of the agency’s Space Launch System rocket and the Orion spacecraft on a flight beyond the Moon.
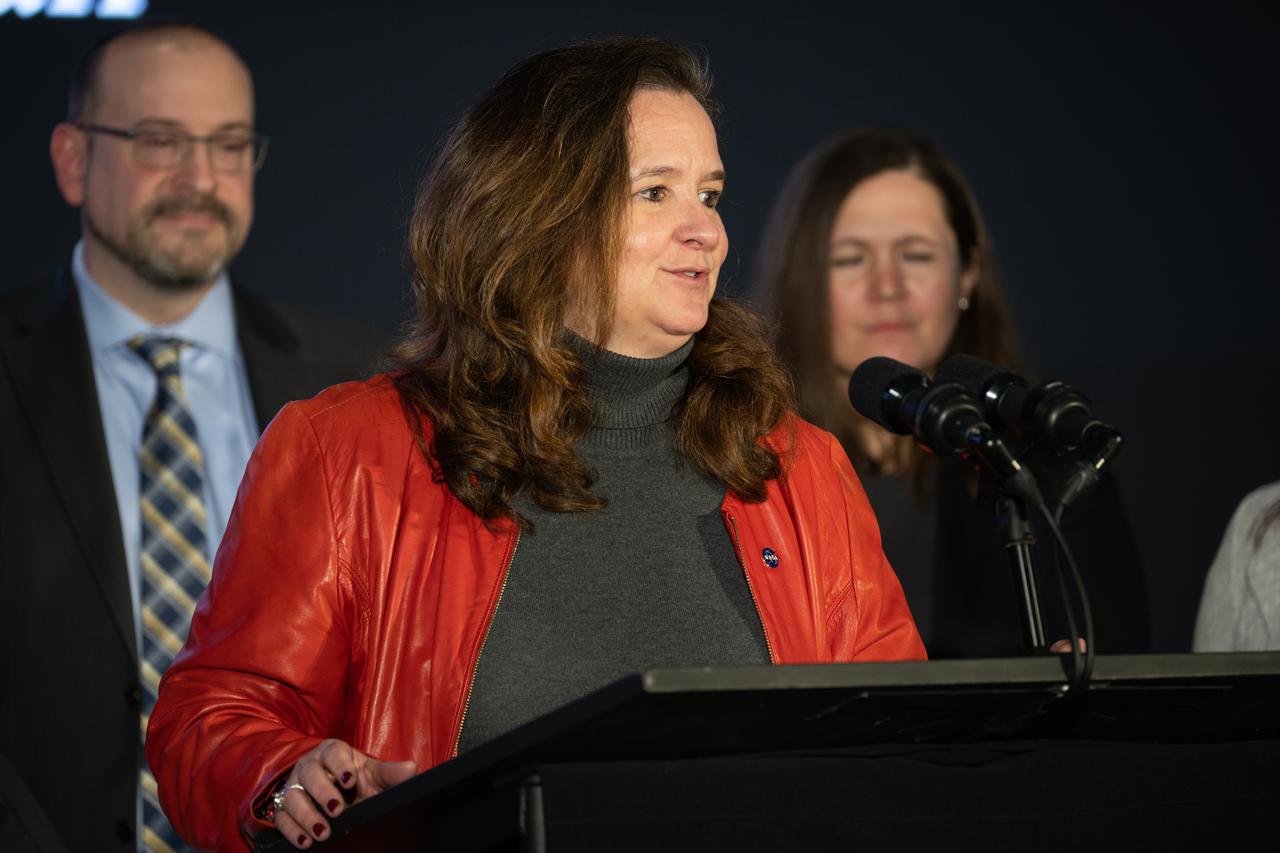
Karen St. Germain, director of the Earth Science Division of NASA’s Science Mission Directorate, answers a question during a briefing on NASA’s TEMPO (Tropospheric Emissions: Monitoring of Pollution) instrument, Tuesday, March 14, 2023 at the Smithsonian’s National Air and Space Museum in Washington. NASA’s TEMPO instrument, the first Earth Venture Instrument mission, will measure air pollution across North America from Mexico City to the Canadian oil sands and from the Atlantic to the Pacific hourly and at a high spatial resolution. A partnership between NASA and the Center for Astrophysics | Harvard & Smithsonian, TEMPO will launch on a commercial satellite to geostationary orbit as early as April. Photo Credit: (NASA/Joel Kowsky)

Ellen Stofan, under secretary for Science and Research at the Smithsonian Institution, speaks during a briefing on NASA’s TEMPO (Tropospheric Emissions: Monitoring of Pollution) instrument, Tuesday, March 14, 2023 at the Smithsonian’s National Air and Space Museum in Washington. NASA’s TEMPO instrument, the first Earth Venture Instrument mission, will measure air pollution across North America from Mexico City to the Canadian oil sands and from the Atlantic to the Pacific hourly and at a high spatial resolution. A partnership between NASA and the Center for Astrophysics | Harvard & Smithsonian, TEMPO will launch on a commercial satellite to geostationary orbit as early as April. Photo Credit: (NASA/Joel Kowsky)
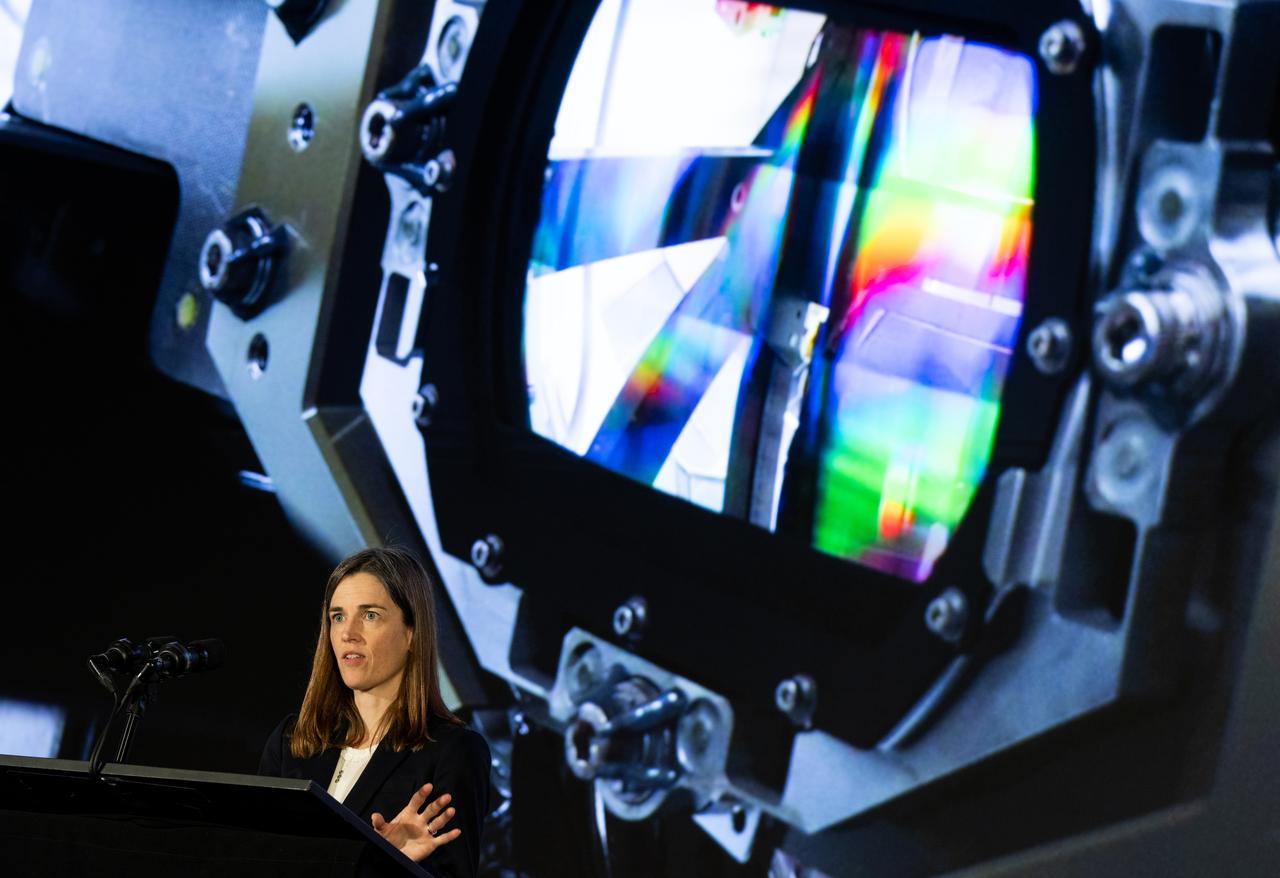
Caroline Nowlan, atmospheric physicist at the Center for Astrophysics | Harvard & Smithsonian, speaks during a briefing on NASA’s TEMPO (Tropospheric Emissions: Monitoring of Pollution) instrument, Tuesday, March 14, 2023 at the Smithsonian’s National Air and Space Museum in Washington. NASA’s TEMPO instrument, the first Earth Venture Instrument mission, will measure air pollution across North America from Mexico City to the Canadian oil sands and from the Atlantic to the Pacific hourly and at a high spatial resolution. A partnership between NASA and the Center for Astrophysics | Harvard & Smithsonian, TEMPO will launch on a commercial satellite to geostationary orbit as early as April. Photo Credit: (NASA/Joel Kowsky)

Ellen Stofan, under secretary for Science and Research at the Smithsonian Institution, speaks during a briefing on NASA’s TEMPO (Tropospheric Emissions: Monitoring of Pollution) instrument, Tuesday, March 14, 2023 at the Smithsonian’s National Air and Space Museum in Washington. NASA’s TEMPO instrument, the first Earth Venture Instrument mission, will measure air pollution across North America from Mexico City to the Canadian oil sands and from the Atlantic to the Pacific hourly and at a high spatial resolution. A partnership between NASA and the Center for Astrophysics | Harvard & Smithsonian, TEMPO will launch on a commercial satellite to geostationary orbit as early as April. Photo Credit: (NASA/Joel Kowsky)

Karen St. Germain, director of the Earth Science Division of NASA’s Science Mission Directorate, speaks during a briefing on NASA’s TEMPO (Tropospheric Emissions: Monitoring of Pollution) instrument, Tuesday, March 14, 2023 at the Smithsonian’s National Air and Space Museum in Washington. NASA’s TEMPO instrument, the first Earth Venture Instrument mission, will measure air pollution across North America from Mexico City to the Canadian oil sands and from the Atlantic to the Pacific hourly and at a high spatial resolution. A partnership between NASA and the Center for Astrophysics | Harvard & Smithsonian, TEMPO will launch on a commercial satellite to geostationary orbit as early as April. Photo Credit: (NASA/Joel Kowsky)

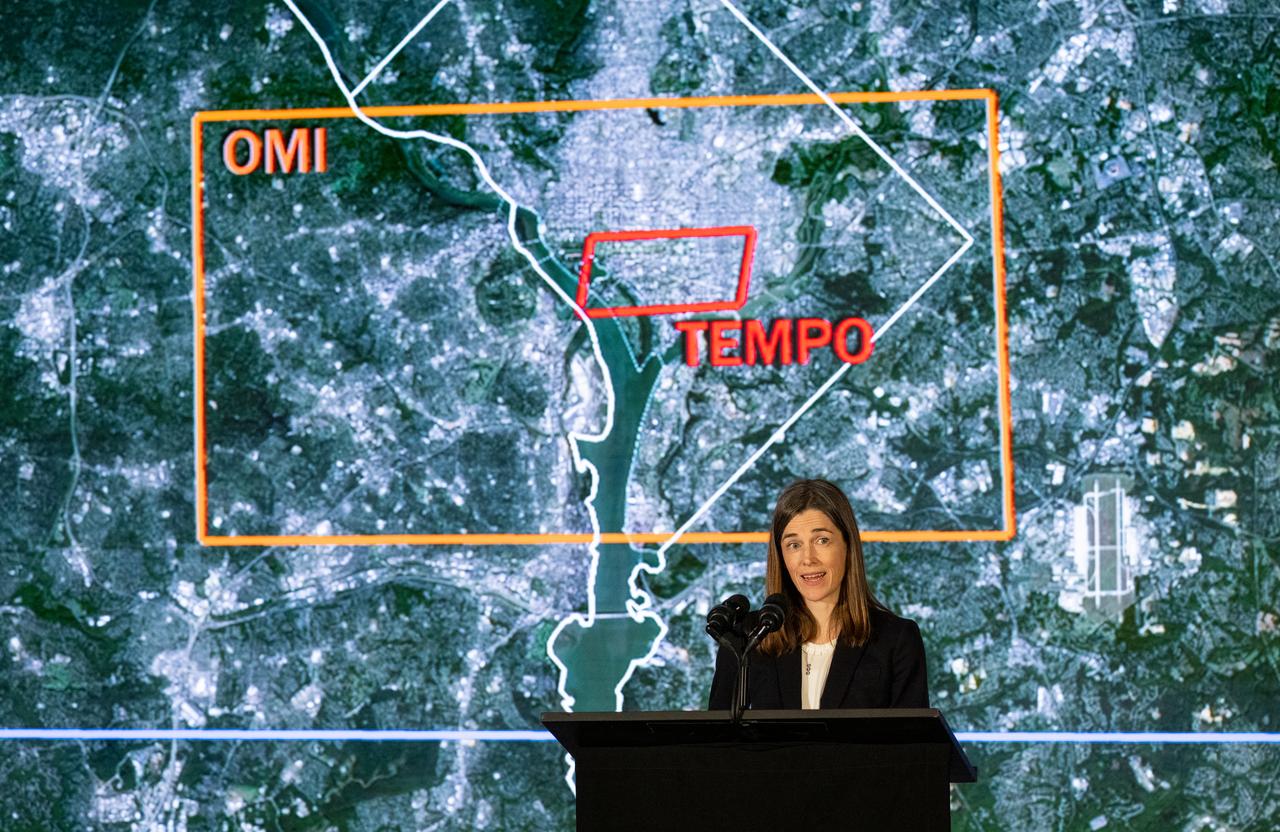
Caroline Nowlan, atmospheric physicist at the Center for Astrophysics | Harvard & Smithsonian, answers a question during a briefing on NASA’s TEMPO (Tropospheric Emissions: Monitoring of Pollution) instrument, Tuesday, March 14, 2023 at the Smithsonian’s National Air and Space Museum in Washington. NASA’s TEMPO instrument, the first Earth Venture Instrument mission, will measure air pollution across North America from Mexico City to the Canadian oil sands and from the Atlantic to the Pacific hourly and at a high spatial resolution. A partnership between NASA and the Center for Astrophysics | Harvard & Smithsonian, TEMPO will launch on a commercial satellite to geostationary orbit as early as April. Photo Credit: (NASA/Joel Kowsky)

NASA Public Affairs Officer Karen Fox moderates a briefing on NASA’s TEMPO (Tropospheric Emissions: Monitoring of Pollution) instrument, Tuesday, March 14, 2023 at the Smithsonian’s National Air and Space Museum in Washington. NASA’s TEMPO instrument, the first Earth Venture Instrument mission, will measure air pollution across North America from Mexico City to the Canadian oil sands and from the Atlantic to the Pacific hourly and at a high spatial resolution. A partnership between NASA and the Center for Astrophysics | Harvard & Smithsonian, TEMPO will launch on a commercial satellite to geostationary orbit as early as April. Photo Credit: (NASA/Joel Kowsky)
Caroline Nowlan, atmospheric physicist at the Center for Astrophysics | Harvard & Smithsonian, speaks during a briefing on NASA’s TEMPO (Tropospheric Emissions: Monitoring of Pollution) instrument, Tuesday, March 14, 2023 at the Smithsonian’s National Air and Space Museum in Washington. NASA’s TEMPO instrument, the first Earth Venture Instrument mission, will measure air pollution across North America from Mexico City to the Canadian oil sands and from the Atlantic to the Pacific hourly and at a high spatial resolution. A partnership between NASA and the Center for Astrophysics | Harvard & Smithsonian, TEMPO will launch on a commercial satellite to geostationary orbit as early as April. Photo Credit: (NASA/Joel Kowsky)
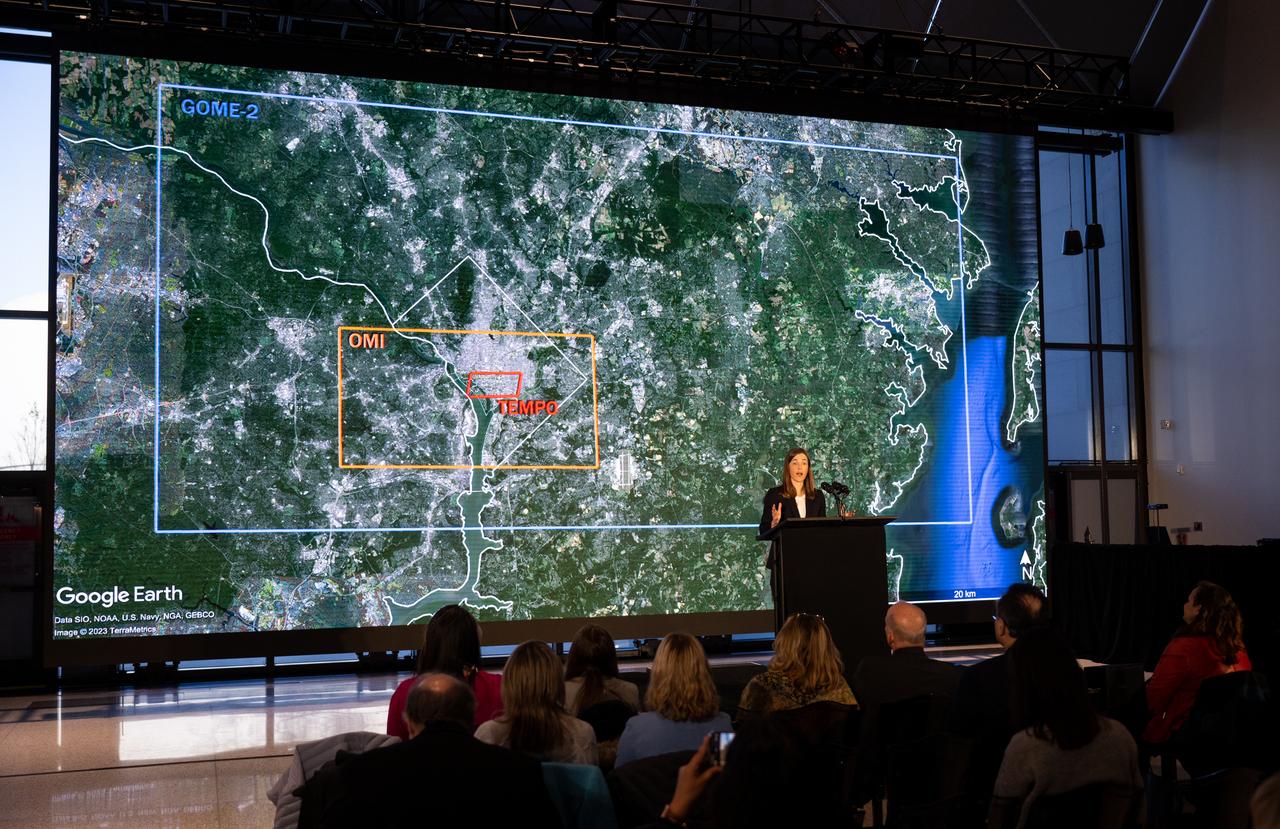
Caroline Nowlan, atmospheric physicist at the Center for Astrophysics | Harvard & Smithsonian, speaks during a briefing on NASA’s TEMPO (Tropospheric Emissions: Monitoring of Pollution) instrument, Tuesday, March 14, 2023 at the Smithsonian’s National Air and Space Museum in Washington. NASA’s TEMPO instrument, the first Earth Venture Instrument mission, will measure air pollution across North America from Mexico City to the Canadian oil sands and from the Atlantic to the Pacific hourly and at a high spatial resolution. A partnership between NASA and the Center for Astrophysics | Harvard & Smithsonian, TEMPO will launch on a commercial satellite to geostationary orbit as early as April. Photo Credit: (NASA/Joel Kowsky)
Weather Instrumentation Engineer Nick O’Connor works with the Tropospheric Doppler Radar Wind Profiler at Kennedy Space Center in Florida during an Artemis I weather simulation on Nov. 3, 2021. The simulation involved teams from Kennedy, Cape Canaveral Space Force Station, Johnson Space Center in Texas, and Marshall Space Flight Center in Alabama. The radar wind profiler delivers data – from 6,000 to 62,000 feet – every five minutes. It will be used as the primary upper level wind instrument for NASA’s Artemis missions, including Artemis I, the first launch of the agency’s Space Launch System rocket and the Orion spacecraft on a flight beyond the Moon.

Karen St. Germain, director of the Earth Science Division of NASA’s Science Mission Directorate, speaks during a briefing on NASA’s TEMPO (Tropospheric Emissions: Monitoring of Pollution) instrument, Tuesday, March 14, 2023 at the Smithsonian’s National Air and Space Museum in Washington. NASA’s TEMPO instrument, the first Earth Venture Instrument mission, will measure air pollution across North America from Mexico City to the Canadian oil sands and from the Atlantic to the Pacific hourly and at a high spatial resolution. A partnership between NASA and the Center for Astrophysics | Harvard & Smithsonian, TEMPO will launch on a commercial satellite to geostationary orbit as early as April. Photo Credit: (NASA/Joel Kowsky)

Karen St. Germain, director of the Earth Science Division of NASA’s Science Mission Directorate, speaks during a briefing on NASA’s TEMPO (Tropospheric Emissions: Monitoring of Pollution) instrument, Tuesday, March 14, 2023 at the Smithsonian’s National Air and Space Museum in Washington. NASA’s TEMPO instrument, the first Earth Venture Instrument mission, will measure air pollution across North America from Mexico City to the Canadian oil sands and from the Atlantic to the Pacific hourly and at a high spatial resolution. A partnership between NASA and the Center for Astrophysics | Harvard & Smithsonian, TEMPO will launch on a commercial satellite to geostationary orbit as early as April. Photo Credit: (NASA/Joel Kowsky)
Caroline Nowlan, atmospheric physicist at the Center for Astrophysics | Harvard & Smithsonian, speaks during a briefing on NASA’s TEMPO (Tropospheric Emissions: Monitoring of Pollution) instrument, Tuesday, March 14, 2023 at the Smithsonian’s National Air and Space Museum in Washington. NASA’s TEMPO instrument, the first Earth Venture Instrument mission, will measure air pollution across North America from Mexico City to the Canadian oil sands and from the Atlantic to the Pacific hourly and at a high spatial resolution. A partnership between NASA and the Center for Astrophysics | Harvard & Smithsonian, TEMPO will launch on a commercial satellite to geostationary orbit as early as April. Photo Credit: (NASA/Joel Kowsky)
Weather Instrumentation Engineer Nick O’Connor works with the Tropospheric Doppler Radar Wind Profiler at Kennedy Space Center in Florida during an Artemis I weather simulation on Nov. 3, 2021. The simulation involved teams from Kennedy, Cape Canaveral Space Force Station, Johnson Space Center in Texas, and Marshall Space Flight Center in Alabama. The radar wind profiler delivers data – from 6,000 to 62,000 feet – every five minutes. It will be used as the primary upper level wind instrument for NASA’s Artemis missions, including Artemis I, the first launch of the agency’s Space Launch System rocket and the Orion spacecraft on a flight beyond the Moon.

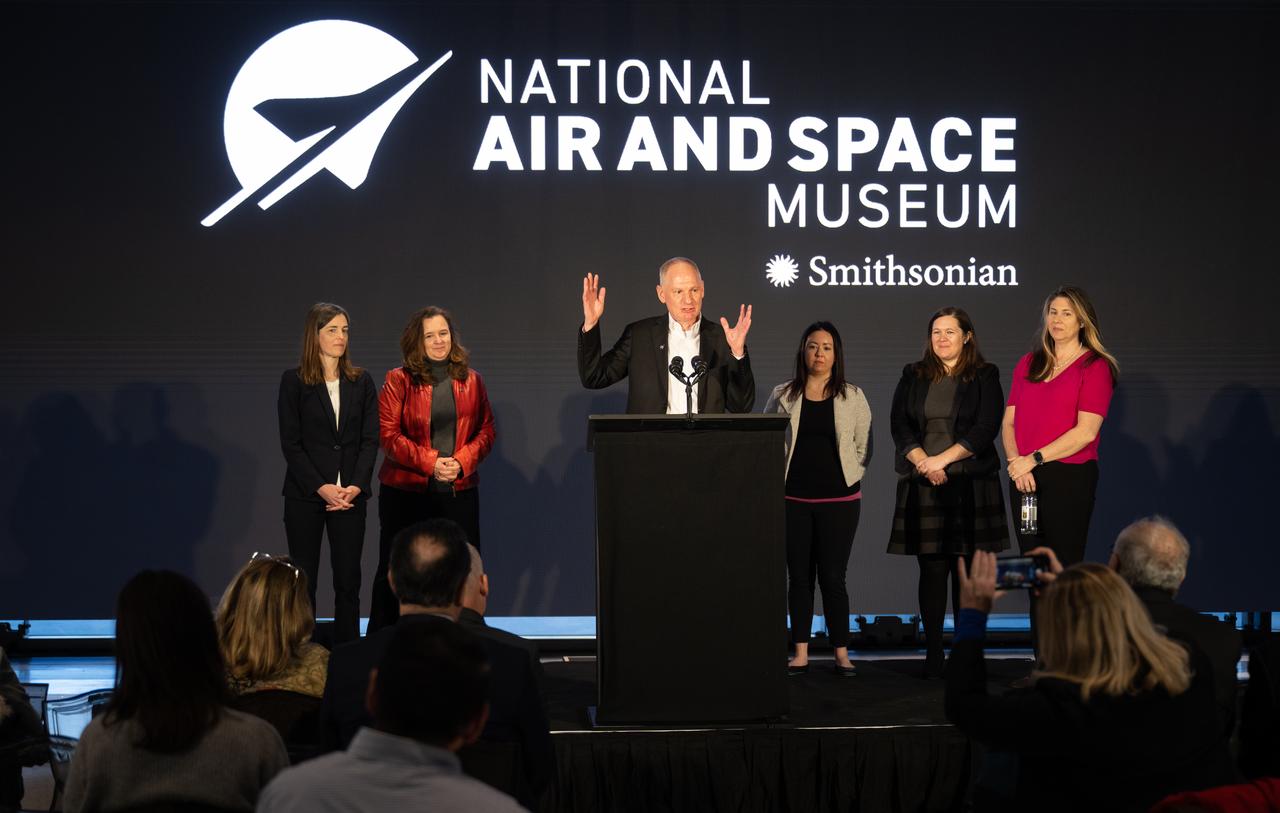
Christopher Browne, director of the Smithsonian’s National Air and Space Museum delivers remarks during a briefing on NASA’s TEMPO (Tropospheric Emissions: Monitoring of Pollution) instrument, Tuesday, March 14, 2023 at the Smithsonian’s National Air and Space Museum in Washington. NASA’s TEMPO instrument, the first Earth Venture Instrument mission, will measure air pollution across North America from Mexico City to the Canadian oil sands and from the Atlantic to the Pacific hourly and at a high spatial resolution. A partnership between NASA and the Center for Astrophysics | Harvard & Smithsonian, TEMPO will launch on a commercial satellite to geostationary orbit as early as April. Photo Credit: (NASA/Joel Kowsky)
Karen St. Germain, director of the Earth Science Division of NASA’s Science Mission Directorate, speaks during a briefing on NASA’s TEMPO (Tropospheric Emissions: Monitoring of Pollution) instrument, Tuesday, March 14, 2023 at the Smithsonian’s National Air and Space Museum in Washington. NASA’s TEMPO instrument, the first Earth Venture Instrument mission, will measure air pollution across North America from Mexico City to the Canadian oil sands and from the Atlantic to the Pacific hourly and at a high spatial resolution. A partnership between NASA and the Center for Astrophysics | Harvard & Smithsonian, TEMPO will launch on a commercial satellite to geostationary orbit as early as April. Photo Credit: (NASA/Joel Kowsky)
This mosaic shows the features of Jupiter main visible cloud deck and upper-tropospheric haze, with higher features enhanced in brightness over lower features as seen by NASA Galileo orbiter on February 19, 1997.

This vertical profile view from the Tropospheric Emission Spectrometer TES instrument on NASA Aura satellite depicts the distribution of water vapor molecules over Earth tropics across one transect of the satellite orbit on January 6, 2006.
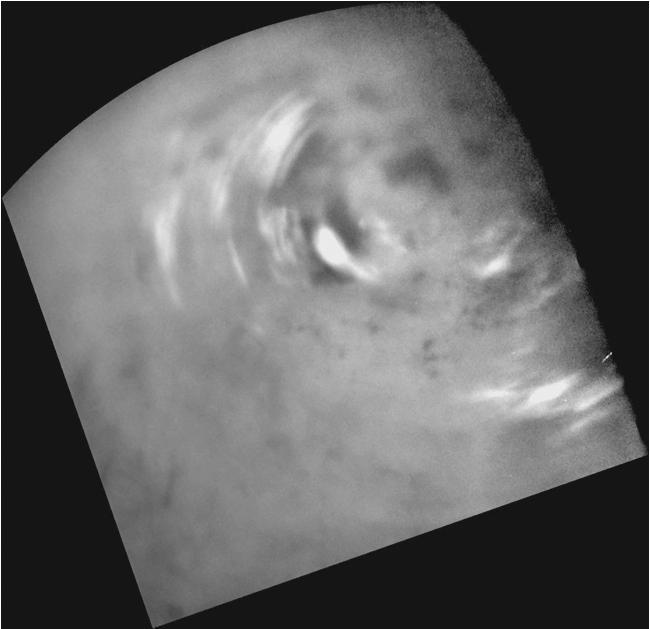
Clouds move above Titan large methane lakes and seas near the moon north pole in this image from NASA Cassini spacecraft. Methane clouds in the troposphere, the lowest part of the atmosphere, appear white here.
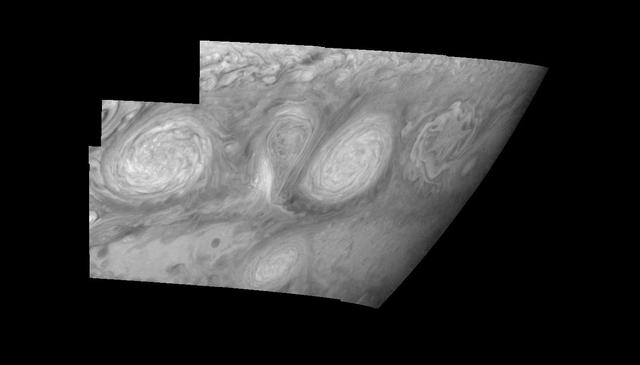
This mosaic shows the features of Jupiter main visible cloud deck and upper-tropospheric haze, with higher features enhanced in brightness over lower features as seen by NASA Galileo orbiter on February 19, 1997.
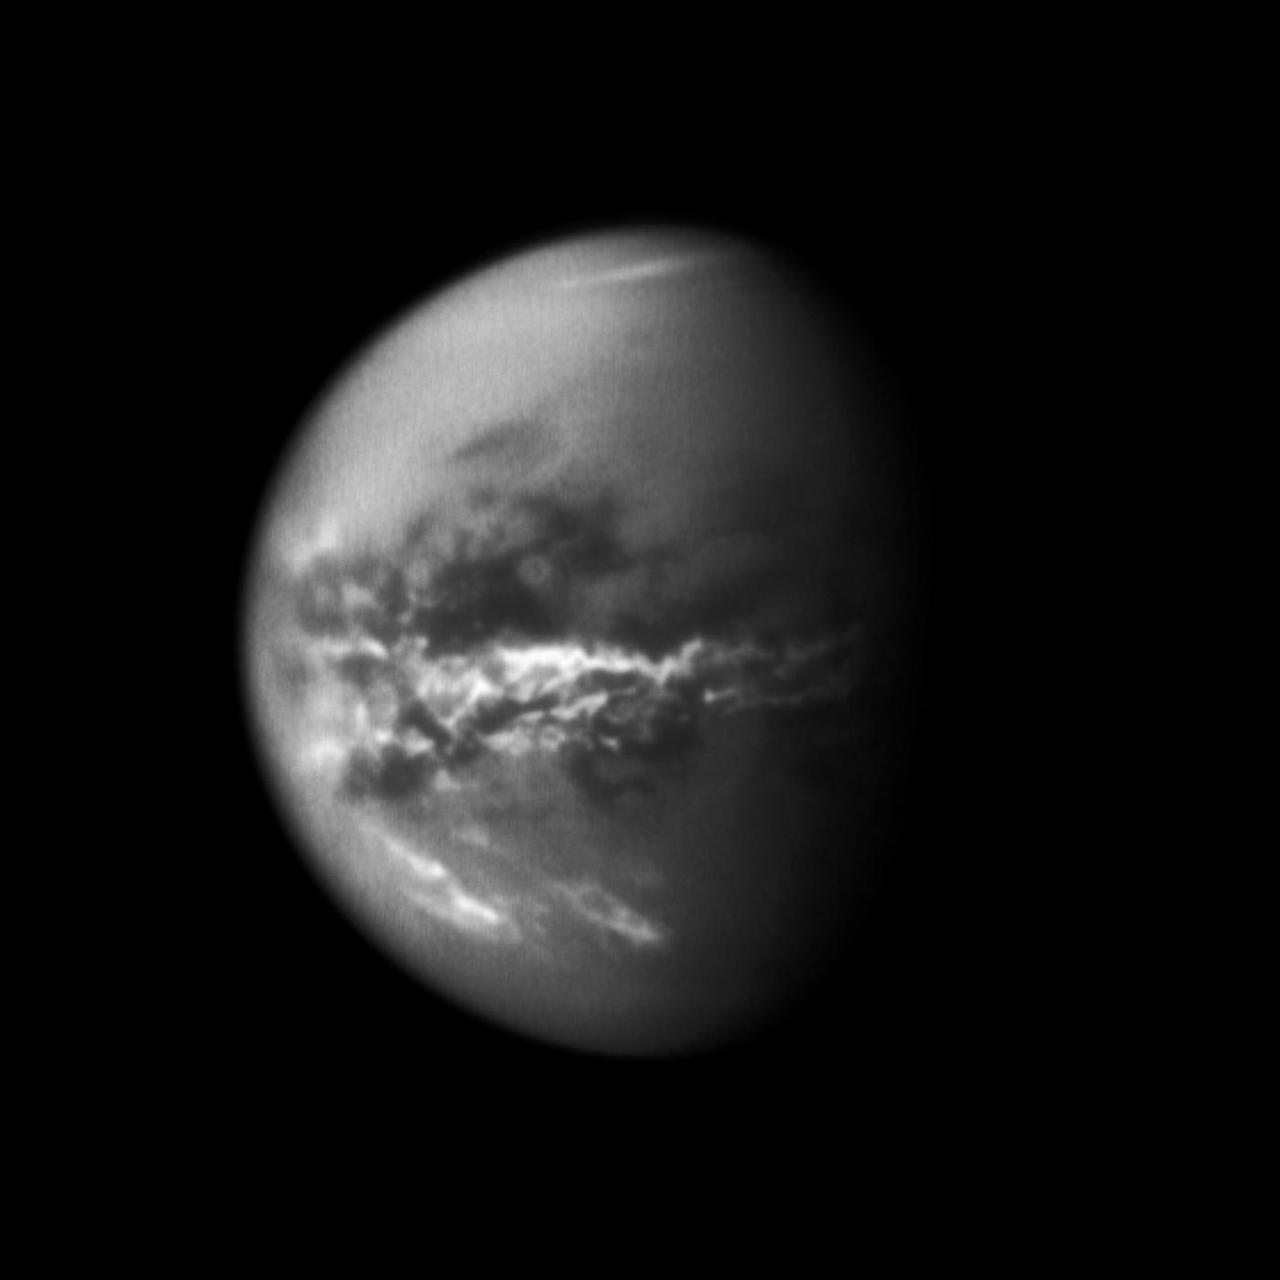
NASA Cassini spacecraft chronicles the change of seasons as it captures clouds concentrated near the equator of Saturn largest moon, Titan. Methane clouds in the troposphere, the lowest part of the atmosphere, appear white here.
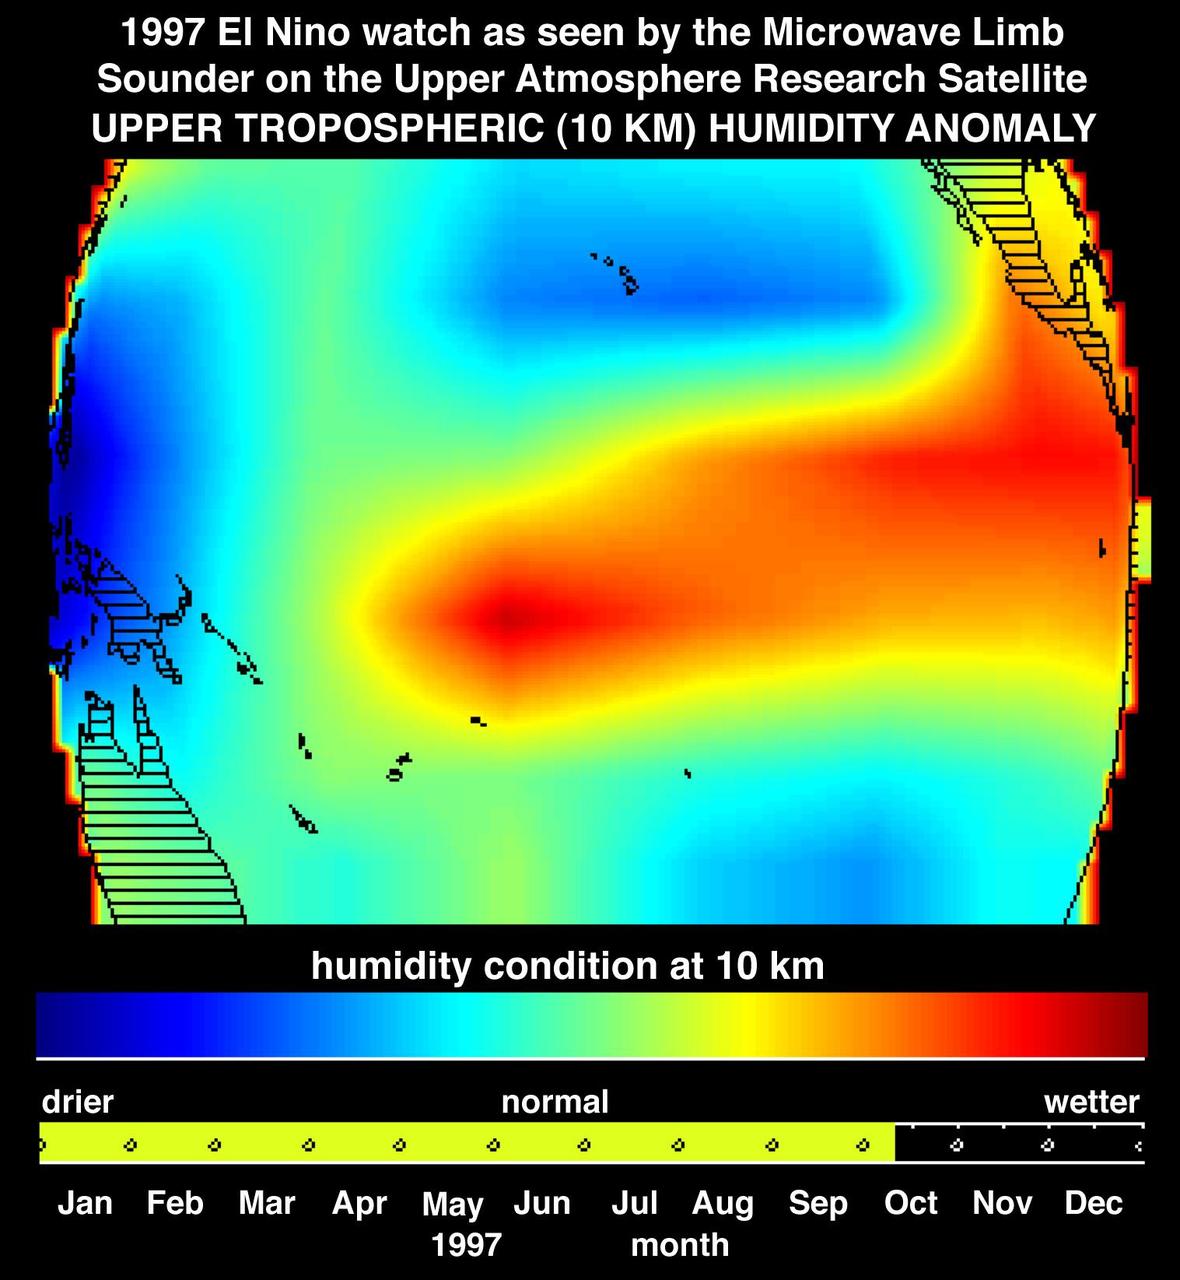
This image shows atmospheric water vapor in Earth upper troposphere, about 10 kilometers 6 miles above the surface, as measured by NASA Microwave Limb Sounder MLS instrument flying aboard the Upper Atmosphere Research Satellite.
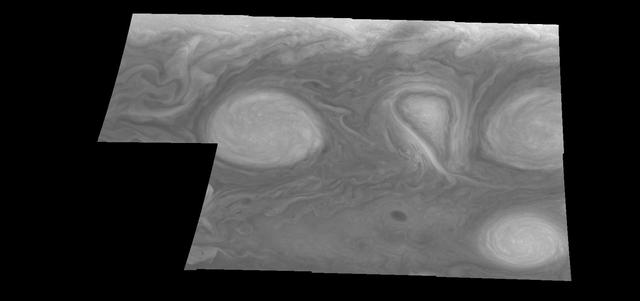
This mosaic shows the features of Jupiter main visible cloud deck and upper-tropospheric haze, with higher features enhanced in brightness over lower features as seen by NASA Galileo orbiter on February 19, 1997.
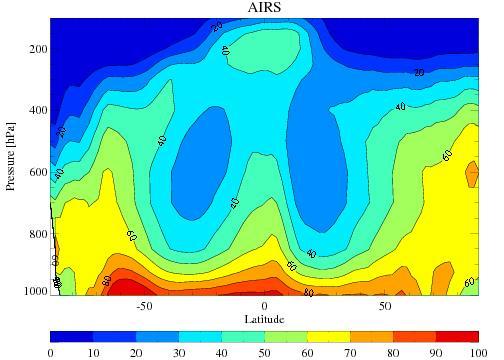
The average tropospheric relative humidity from the Atmospheric Infrared Sounder AIRS onboard NASA Aqua satellite for the four December-February periods during 2002 through 2005.

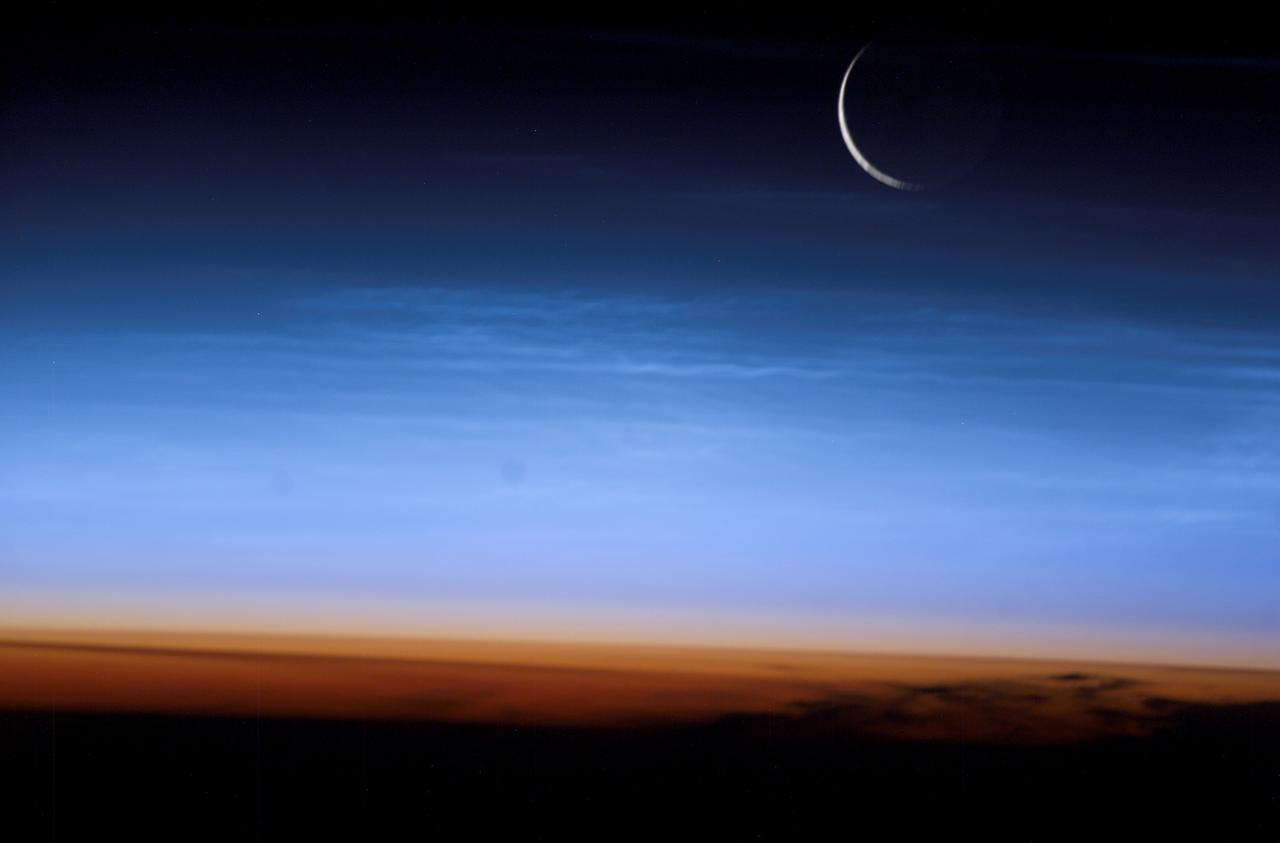
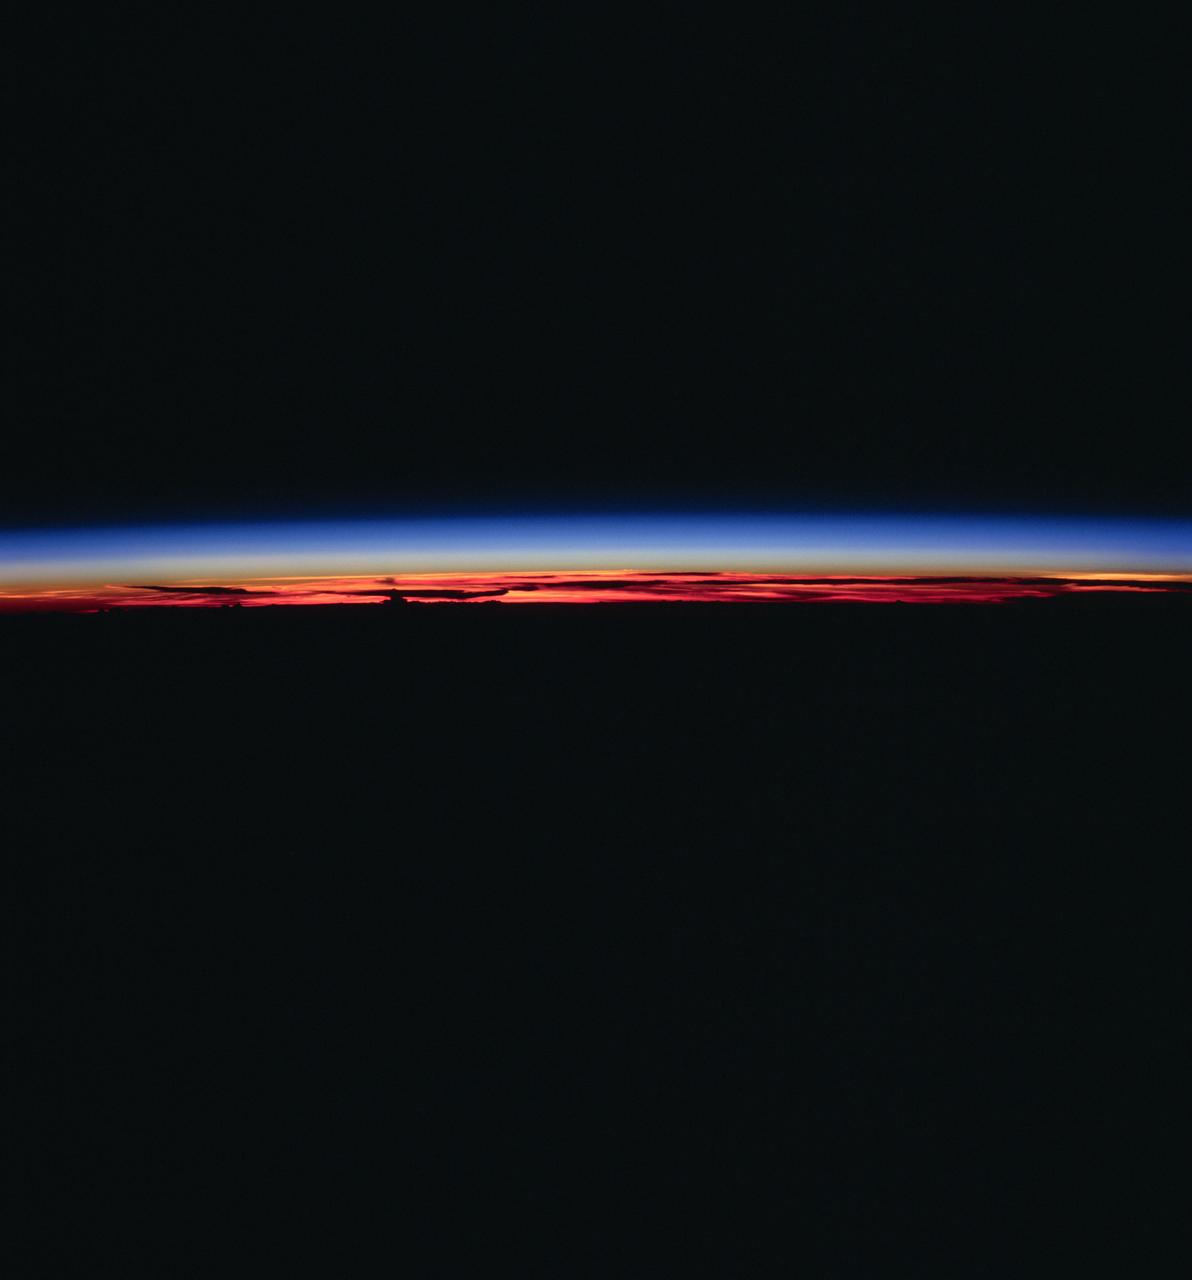
ISS007-E-10974 (27 July 2003) --- Photographed by an Expedition 7 crewmember onboard the International Space Station (ISS), this image shows the limb of the Earth at the bottom transitioning into the orange-colored troposphere, the lowest and most dense portion of the Earth's atmosphere. The troposphere ends abruptly at the tropopause, which appears in the image as the sharp boundary between the orange- and blue- colored atmosphere. The silvery-blue noctilucent clouds extend far above the Earth's troposphere. The sliver of the setting moon is visible at upper right.
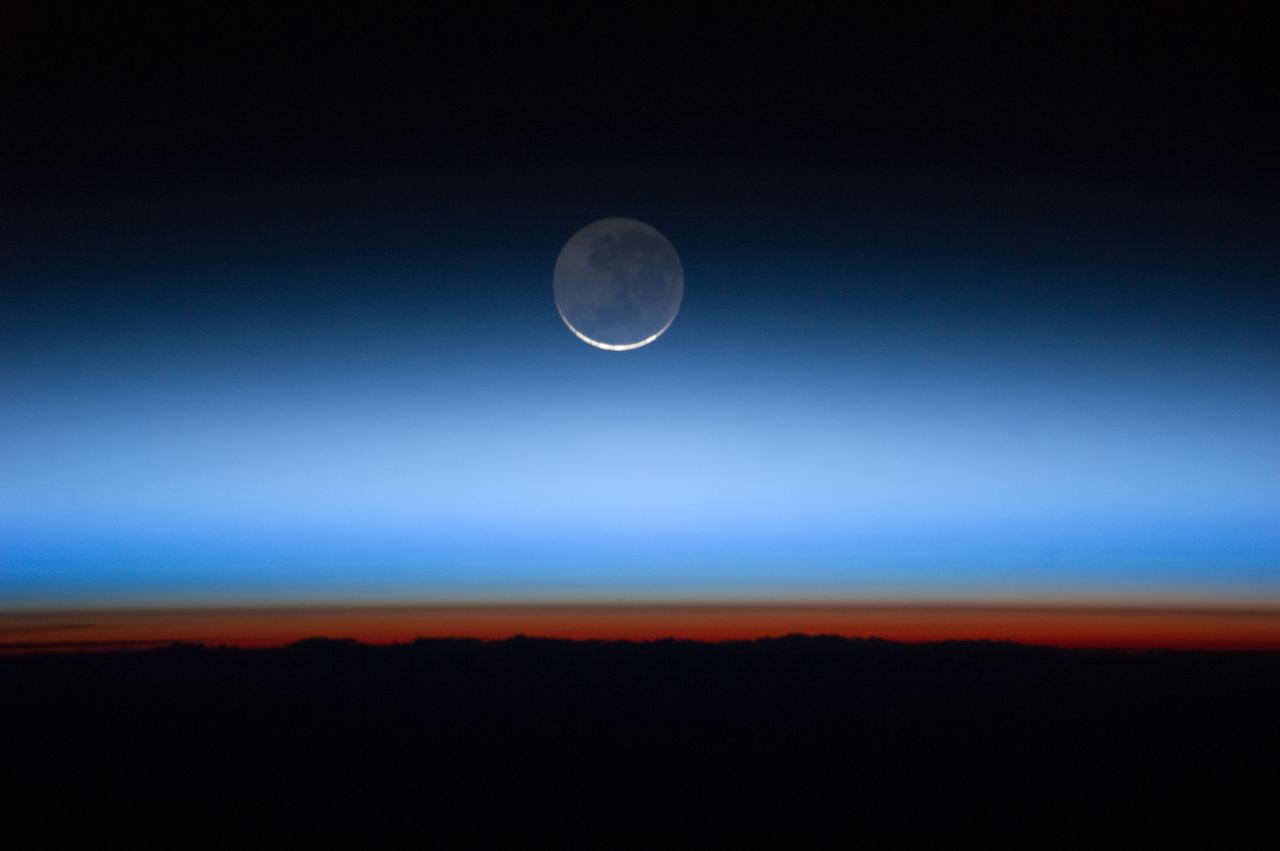
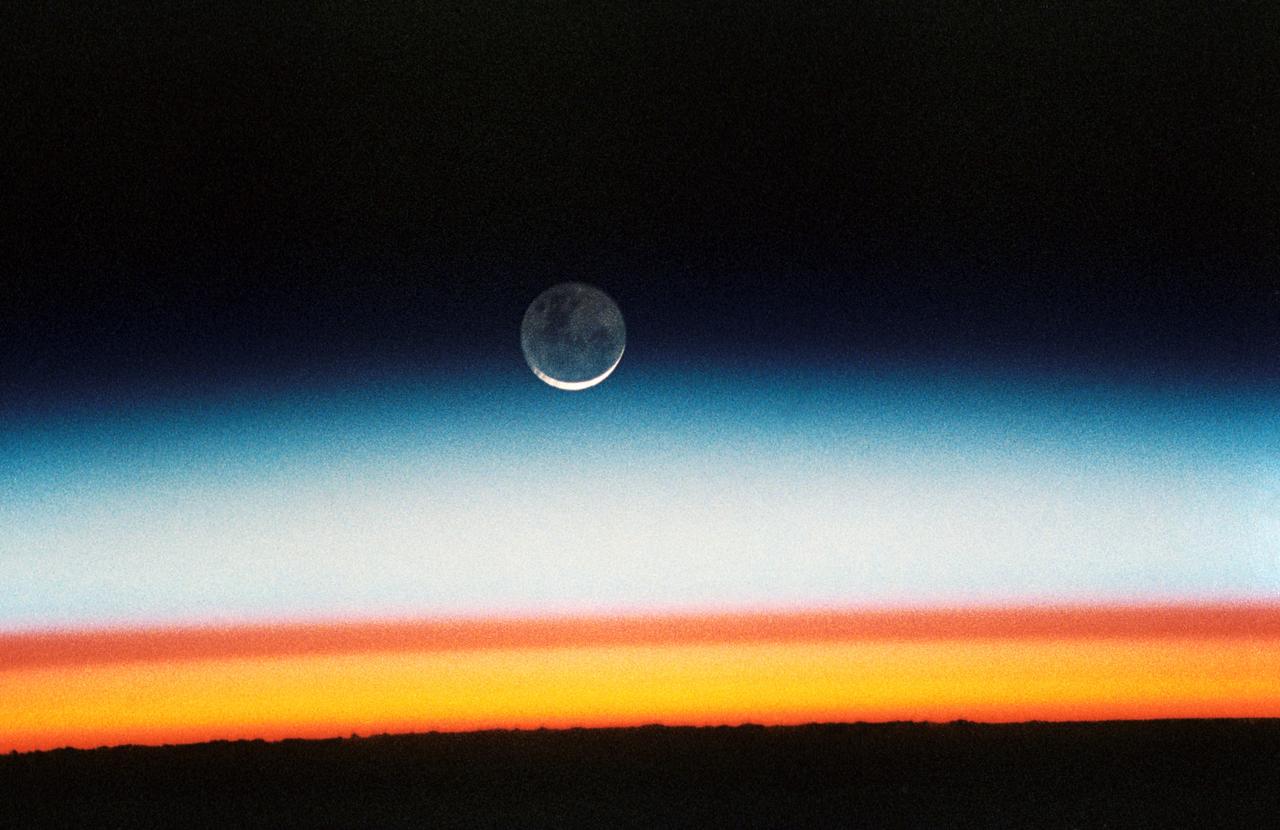
ISS028-E-020072 (31 July 2011) --- Photographed by an Expedition 28 crew member onboard the International Space Station, this image shows the moon at center, with the limb of Earth near the bottom transitioning into the orange-colored troposphere, the lowest and most dense portion of the Earth's atmosphere. The troposphere ends abruptly at the tropopause, which appears in the image as the sharp boundary between the orange- and blue- colored atmosphere. The silvery-blue noctilucent clouds extend far above the Earth's troposphere.
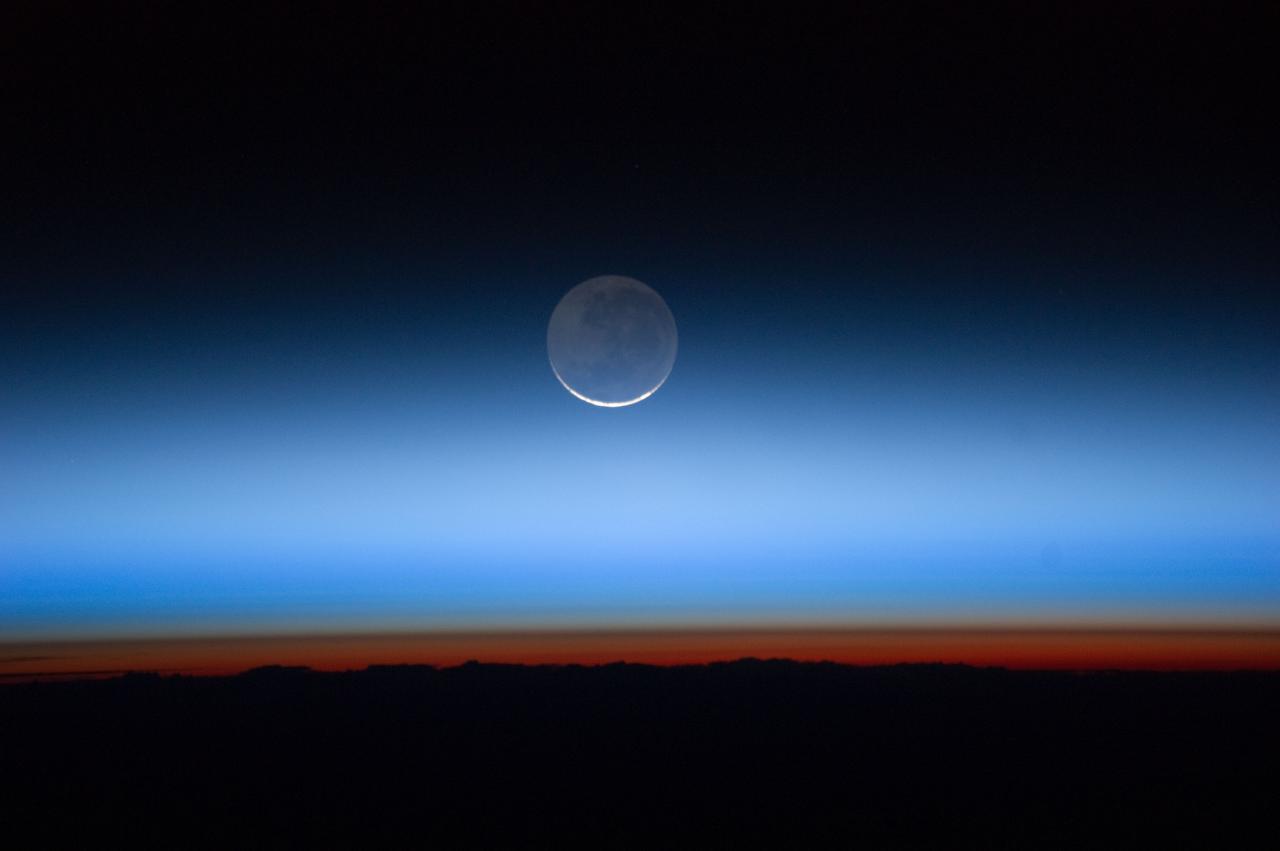
ISS028-E-020073 (31 July 2011) --- Photographed by an Expedition 28 crew member onboard the International Space Station, this image shows the moon at center, with the limb of Earth near the bottom transitioning into the orange-colored troposphere, the lowest and most dense portion of the Earth's atmosphere. The troposphere ends abruptly at the tropopause, which appears in the image as the sharp boundary between the orange- and blue- colored atmosphere. The silvery-blue noctilucent clouds extend far above the Earth's troposphere.
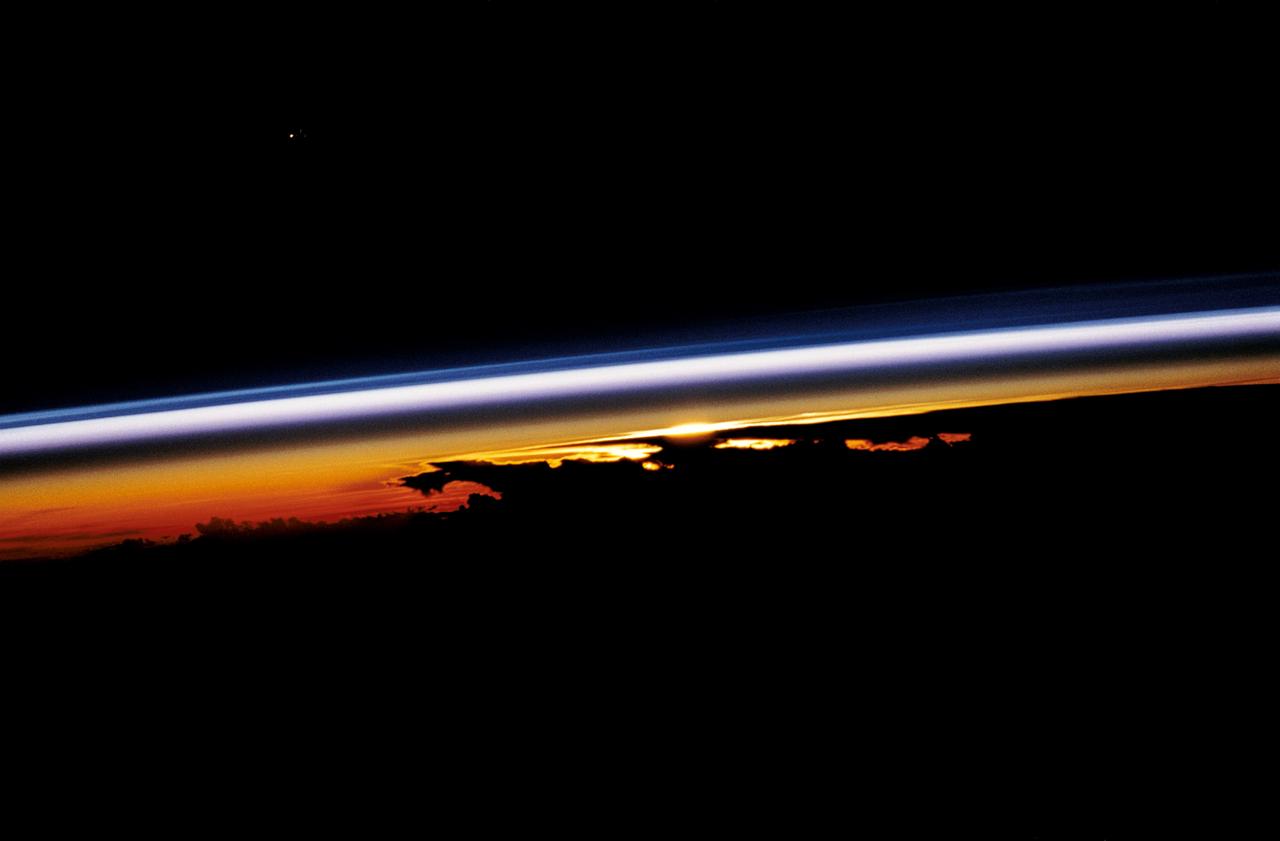
STS047-54-018 (12-20 Sept. 1992) --- The colors in this photograph provide insight into the relative density of the atmosphere. The crew members had many opportunities to witness sunrises and sunsets, considering they orbit the Earth every 90 minutes, but few, they said, compared to this scene. It captures the silhouette of several mature thunderstorms with their cirrus anvil tops spreading out against the tropopause (the top of the lowest layer of Earth's atmosphere) at sunset. The lowest layer (troposphere) is the densest and refracts light at the red end of the visible spectrum (7,400 Angstroms), while the blues (4,000 Angstroms) are separated in the least dense portion of the atmosphere (middle and upper atmosphere, or stratosphere and mesosphere). Several layers of blue can be seen. NASA scientists studying the photos believe this stratification to be caused by the scattering of light by particulate trapped in the stratosphere and mesosphere particulate that generally originate from volcanic eruptions, such as those of Mt. Pinatubo in the Philippines and, most recently, Mt. Spurr in Alaska.
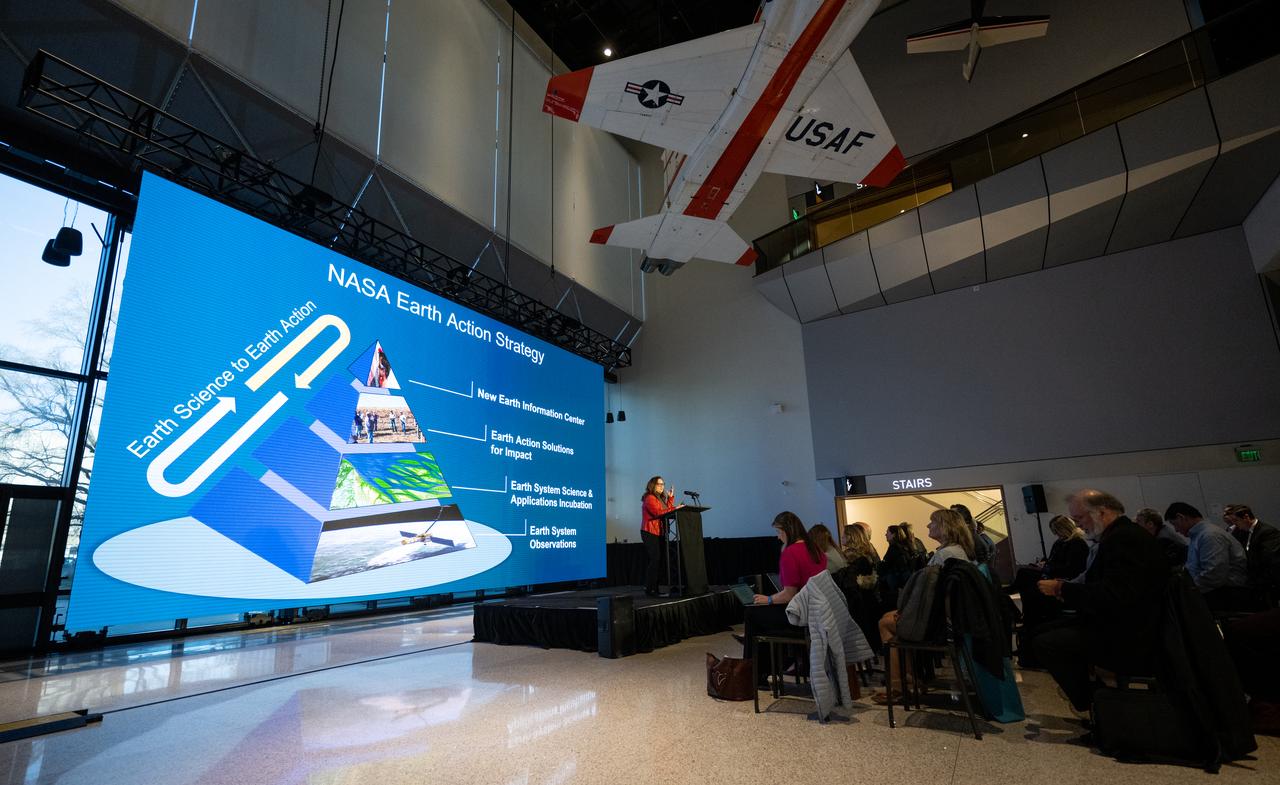
Laura Judd, associate program manager for the Applied Sciences Health and Air Quality Applications in the Applied Sciences Program of NASA’s Earth Science Division, speaks during a briefing on NASA’s TEMPO (Tropospheric Emissions: Monitoring of Pollution) instrument, Tuesday, March 14, 2023 at the Smithsonian’s National Air and Space Museum in Washington. NASA’s TEMPO instrument, the first Earth Venture Instrument mission, will measure air pollution across North America from Mexico City to the Canadian oil sands and from the Atlantic to the Pacific hourly and at a high spatial resolution. A partnership between NASA and the Center for Astrophysics | Harvard & Smithsonian, TEMPO will launch on a commercial satellite to geostationary orbit as early as April. Photo Credit: (NASA/Joel Kowsky)

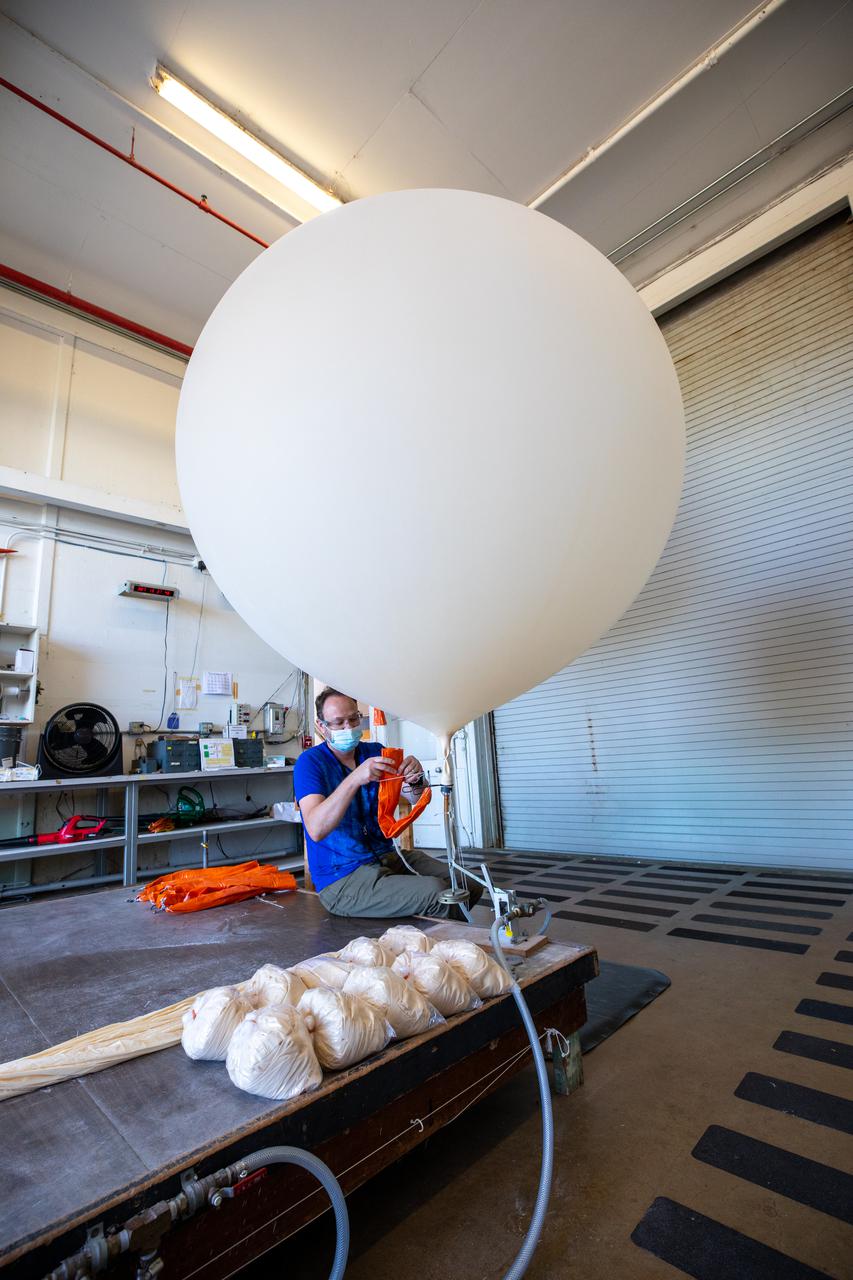
Meteorological Data Specialist Michael Boyer prepares weather balloons for release at the Cape Canaveral Space Force Station (CCSFS) Weather Station in preparation for an Artemis I weather simulation on Nov. 3, 2021. The event involved teams from CCSFS, Kennedy Space Center, Johnson Space Center in Texas, and Marshall Space Flight Center in Alabama. Weather balloons provided data below 6,000 feet and above 62,000 feet, while Kennedy’s Tropospheric Doppler Radar Wind Profiler delivered data from 6,000 to 62,000 feet. The radar wind profiler will be used as the primary upper level wind instrument for NASA’s Artemis missions, including Artemis I, the first launch of the agency’s Space Launch System rocket and the Orion spacecraft on a flight beyond the Moon.
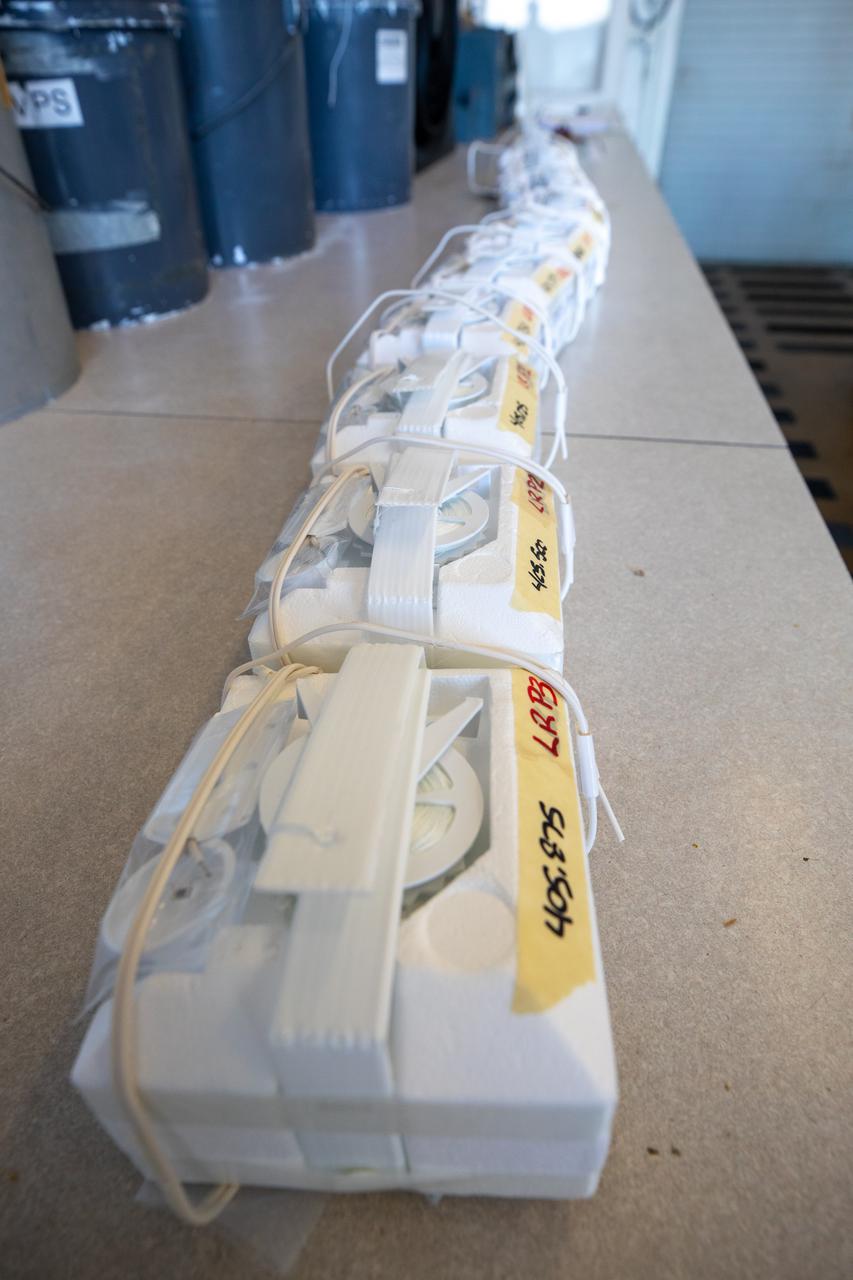
Weather balloons are lined up prior to release at the Cape Canaveral Space Force Station (CCSFS) Weather Station in preparation for an Artemis I weather simulation on Nov. 3, 2021. The event involved teams from CCSFS, Kennedy Space Center, Johnson Space Center in Texas, and Marshall Space Flight Center in Alabama. Weather balloons provided data below 6,000 feet and above 62,000 feet, while Kennedy’s Tropospheric Doppler Radar Wind Profiler delivered data from 6,000 to 62,000 feet. The radar wind profiler will be used as the primary upper level wind instrument for NASA’s Artemis missions, including Artemis I, the first launch of the agency’s Space Launch System rocket and the Orion spacecraft on a flight beyond the Moon.
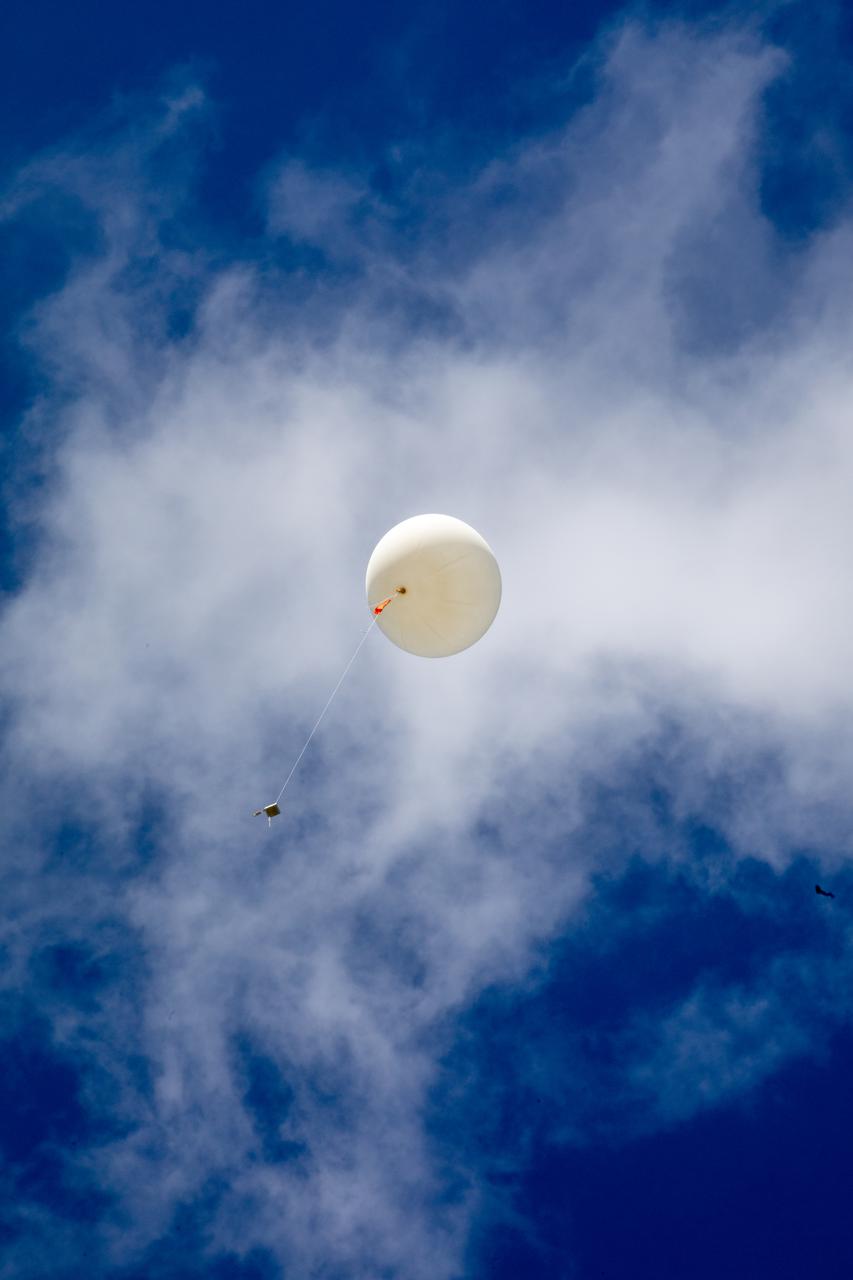
Meteorological Data Specialist Michael Boyer releases a weather balloon at the Cape Canaveral Space Force Station (CCSFS) Weather Station during an Artemis I weather simulation on Nov. 3, 2021. The event involved teams from CCSFS, Kennedy Space Center, Johnson Space Center in Texas, and Marshall Space Flight Center in Alabama. Weather balloons provided data below 6,000 feet and above 62,000 feet, while Kennedy’s Tropospheric Doppler Radar Wind Profiler delivered data from 6,000 to 62,000 feet. The radar wind profiler will be used as the primary upper level wind instrument for NASA’s Artemis missions, including Artemis I, the first launch of the agency’s Space Launch System rocket and the Orion spacecraft on a flight beyond the Moon.
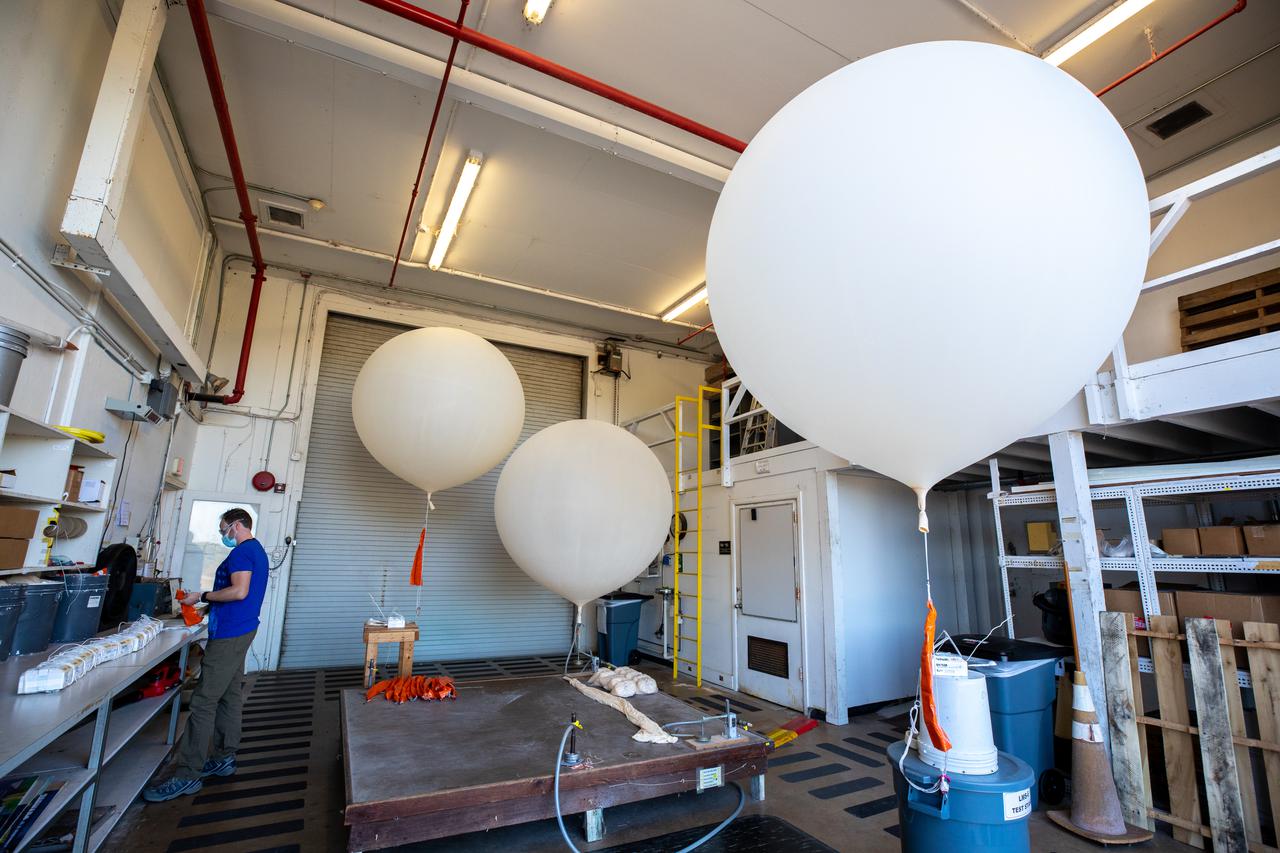
Meteorological Data Specialist Michael Boyer prepares weather balloons for release at the Cape Canaveral Space Force Station (CCSFS) Weather Station in preparation for an Artemis I weather simulation on Nov. 3, 2021. The event involved teams from CCSFS, Kennedy Space Center, Johnson Space Center in Texas, and Marshall Space Flight Center in Alabama. Weather balloons provided data below 6,000 feet and above 62,000 feet, while Kennedy’s Tropospheric Doppler Radar Wind Profiler delivered data from 6,000 to 62,000 feet. The radar wind profiler will be used as the primary upper level wind instrument for NASA’s Artemis missions, including Artemis I, the first launch of the agency’s Space Launch System rocket and the Orion spacecraft on a flight beyond the Moon.
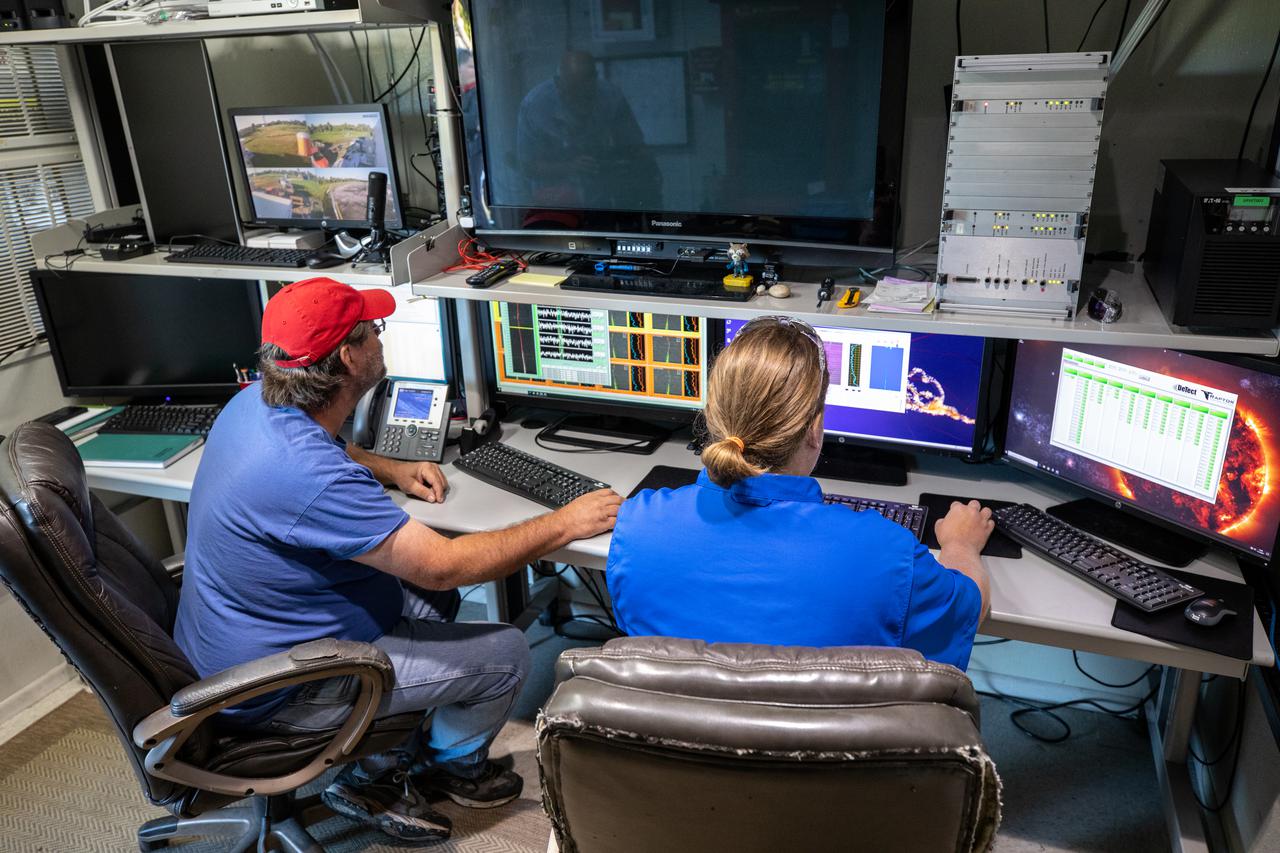
Weather Instrumentation Technician Gavin Oglesby, left, and Weather Instrumentation Engineer Nick O’Connor work with the Tropospheric Doppler Radar Wind Profiler at Kennedy Space Center in Florida during an Artemis I weather simulation on Nov. 3, 2021. The simulation involved teams from Kennedy, Cape Canaveral Space Force Station, Johnson Space Center in Texas, and Marshall Space Flight Center in Alabama. The radar wind profiler delivers data – from 6,000 to 62,000 feet – every five minutes. It will be used as the primary upper level wind instrument for NASA’s Artemis missions, including Artemis I, the first launch of the agency’s Space Launch System rocket and the Orion spacecraft on a flight beyond the Moon.
Meteorological Data Specialist Michael Boyer prepares weather balloons for release at the Cape Canaveral Space Force Station (CCSFS) Weather Station in preparation for an Artemis I weather simulation on Nov. 3, 2021. The event involved teams from CCSFS, Kennedy Space Center, Johnson Space Center in Texas, and Marshall Space Flight Center in Alabama. Weather balloons provided data below 6,000 feet and above 62,000 feet, while Kennedy’s Tropospheric Doppler Radar Wind Profiler delivered data from 6,000 to 62,000 feet. The radar wind profiler will be used as the primary upper level wind instrument for NASA’s Artemis missions, including Artemis I, the first launch of the agency’s Space Launch System rocket and the Orion spacecraft on a flight beyond the Moon.
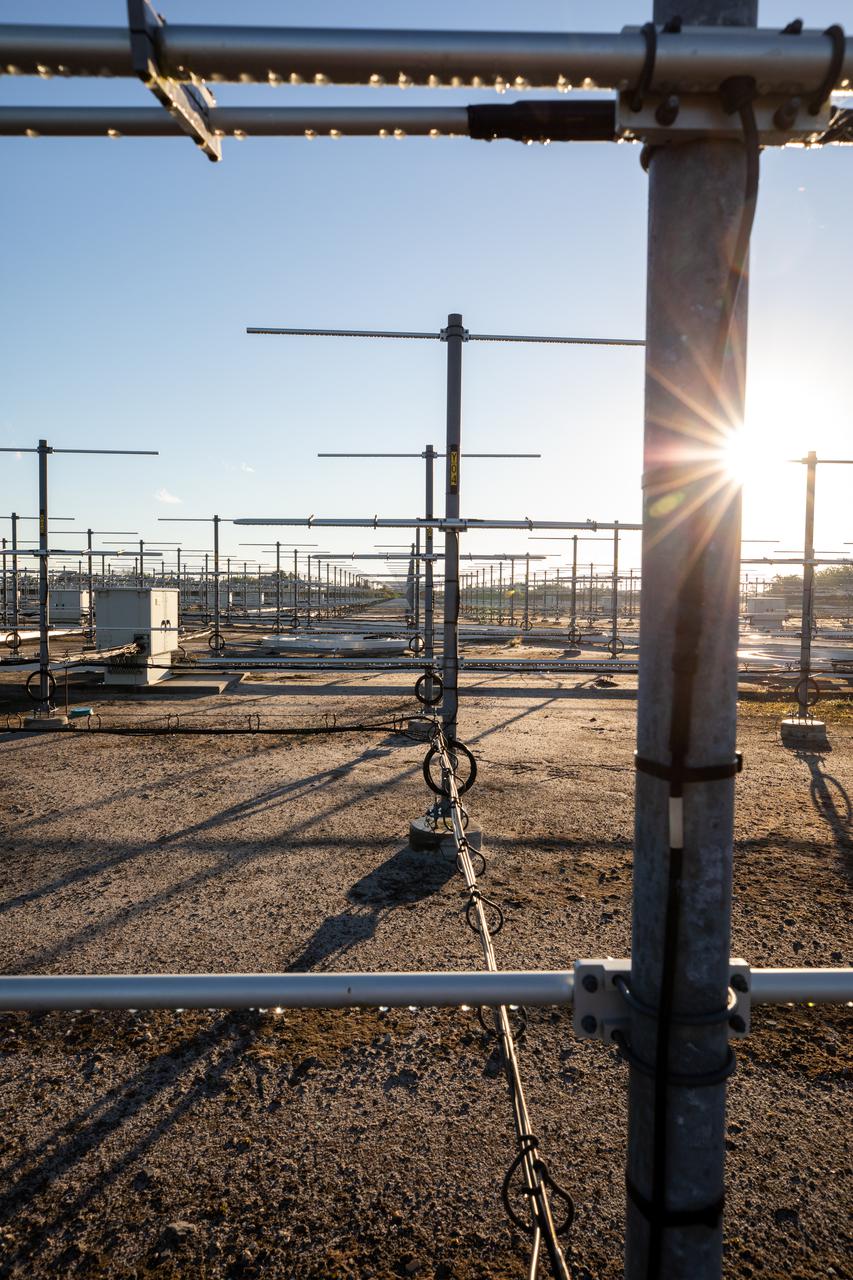
The Tropospheric Doppler Radar Wind Profiler, located on five acres near the Launch and Landing Facility at Kennedy Space Center in Florida, is shown during an Artemis I weather simulation on Nov. 3, 2021. The simulation involved teams from Kennedy, Cape Canaveral Space Force Station, Johnson Space Center in Texas, and Marshall Space Flight Center in Alabama. The radar wind profiler consists of 640 antennae and delivers data – from 6,000 to 62,000 feet – every five minutes. The instrument will be used as the primary upper level wind instrument for NASA’s Artemis missions, including Artemis I, the first launch of the agency’s Space Launch System rocket and the Orion spacecraft on a flight beyond the Moon.

Laura Judd, associate program manager for the Applied Sciences Health and Air Quality Applications in the Applied Sciences Program of NASA’s Earth Science Division, speaks during a briefing on NASA’s TEMPO (Tropospheric Emissions: Monitoring of Pollution) instrument, Tuesday, March 14, 2023 at the Smithsonian’s National Air and Space Museum in Washington. NASA’s TEMPO instrument, the first Earth Venture Instrument mission, will measure air pollution across North America from Mexico City to the Canadian oil sands and from the Atlantic to the Pacific hourly and at a high spatial resolution. A partnership between NASA and the Center for Astrophysics | Harvard & Smithsonian, TEMPO will launch on a commercial satellite to geostationary orbit as early as April. Photo Credit: (NASA/Joel Kowsky)

Meteorological Data Specialist Michael Boyer prepares to release a weather balloon at the Cape Canaveral Space Force Station (CCSFS) Weather Station during an Artemis I weather simulation on Nov. 3, 2021. The event involved teams from CCSFS, Kennedy Space Center, Johnson Space Center in Texas, and Marshall Space Flight Center in Alabama. Weather balloons provided data below 6,000 feet and above 62,000 feet, while Kennedy’s Tropospheric Doppler Radar Wind Profiler delivered data from 6,000 to 62,000 feet. The radar wind profiler will be used as the primary upper level wind instrument for NASA’s Artemis missions, including Artemis I, the first launch of the agency’s Space Launch System rocket and the Orion spacecraft on a flight beyond the Moon.

Meteorological Data Specialist Michael Boyer releases a weather balloon at the Cape Canaveral Space Force Station (CCSFS) Weather Station during an Artemis I weather simulation on Nov. 3, 2021. The event involved teams from CCSFS, Kennedy Space Center, Johnson Space Center in Texas, and Marshall Space Flight Center in Alabama. Weather balloons provided data below 6,000 feet and above 62,000 feet, while Kennedy’s Tropospheric Doppler Radar Wind Profiler delivered data from 6,000 to 62,000 feet. The radar wind profiler will be used as the primary upper level wind instrument for NASA’s Artemis missions, including Artemis I, the first launch of the agency’s Space Launch System rocket and the Orion spacecraft on a flight beyond the Moon.
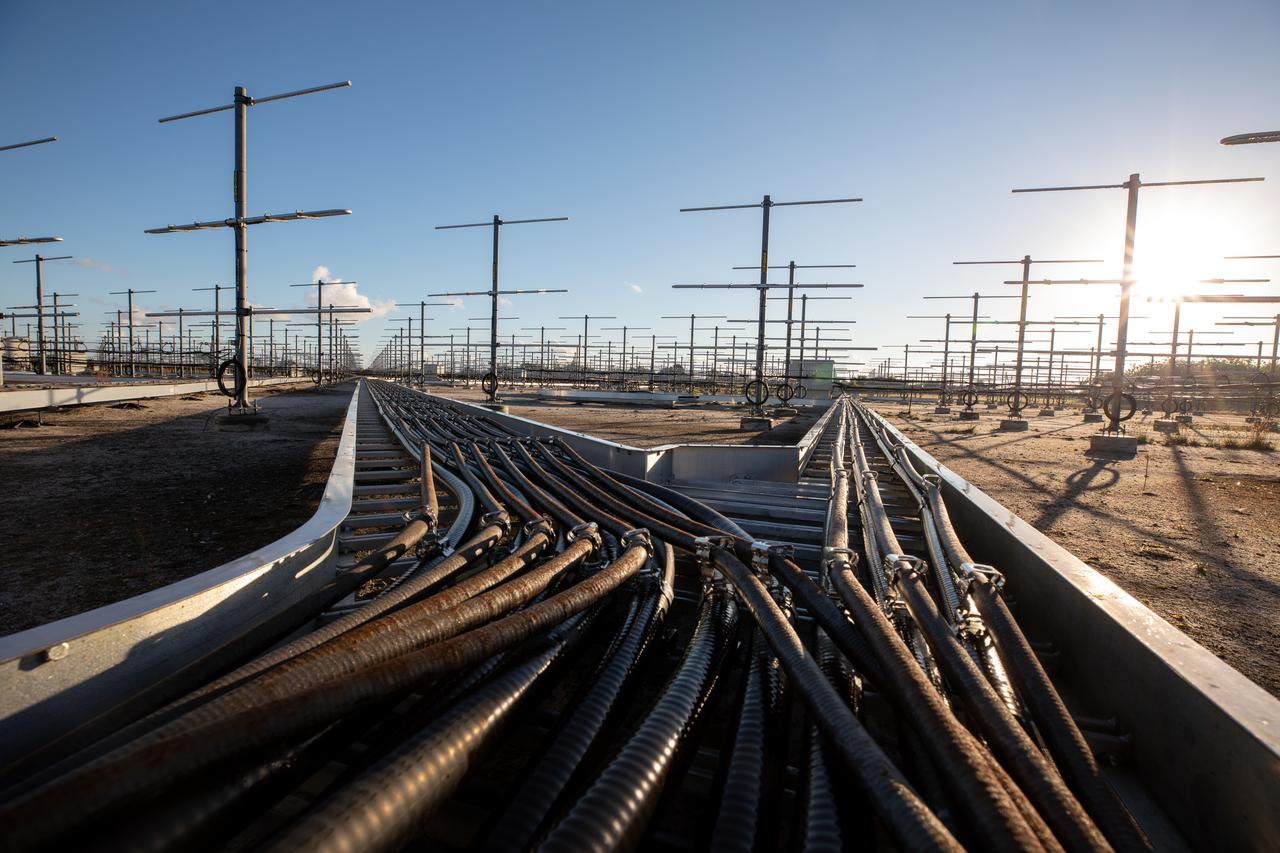
The Tropospheric Doppler Radar Wind Profiler, located on five acres near the Launch and Landing Facility at Kennedy Space Center in Florida, is shown during an Artemis I weather simulation on Nov. 3, 2021. The simulation involved teams from Kennedy, Cape Canaveral Space Force Station, Johnson Space Center in Texas, and Marshall Space Flight Center in Alabama. The radar wind profiler consists of 640 antennae and delivers data – from 6,000 to 62,000 feet – every five minutes. The instrument will be used as the primary upper level wind instrument for NASA’s Artemis missions, including Artemis I, the first launch of the agency’s Space Launch System rocket and the Orion spacecraft on a flight beyond the Moon.
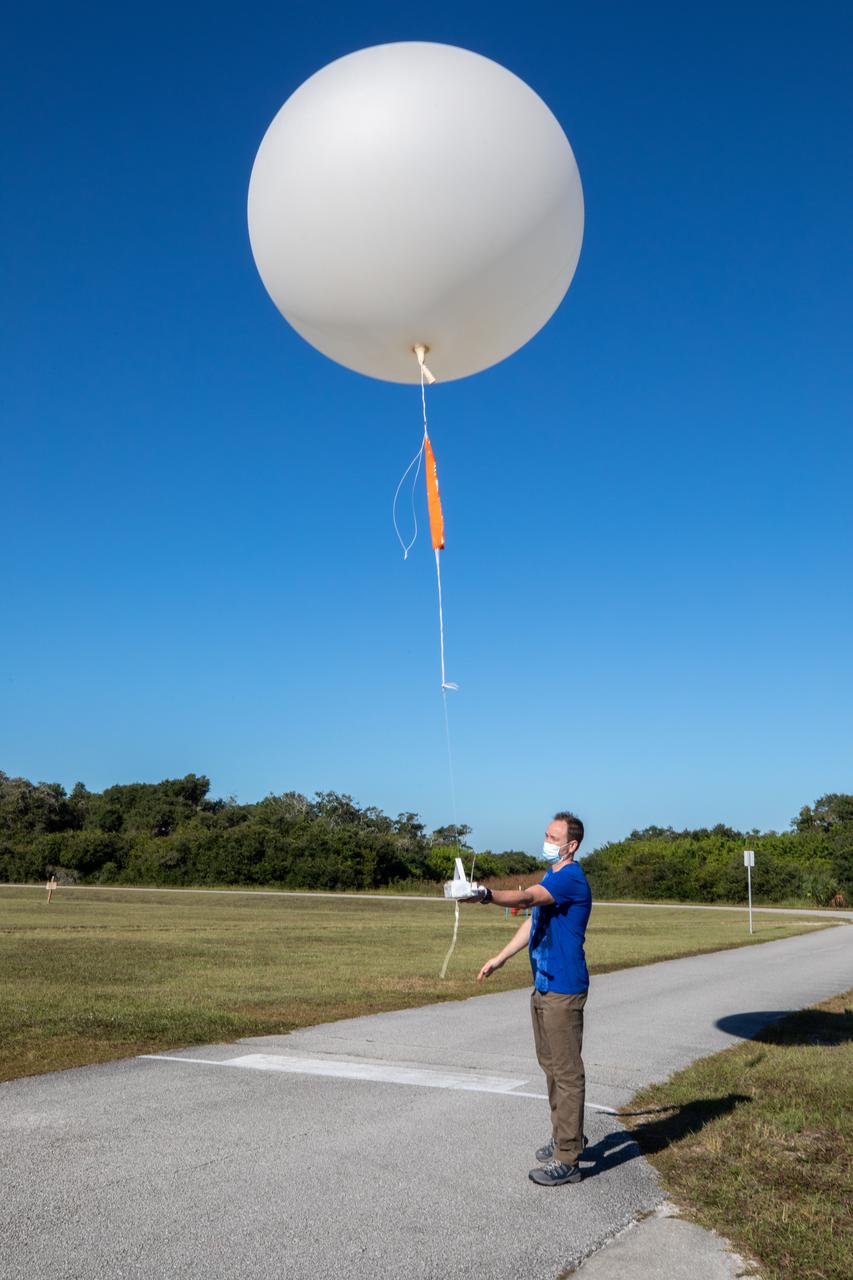
Meteorological Data Specialist Michael Boyer releases a weather balloon at the Cape Canaveral Space Force Station (CCSFS) Weather Station during an Artemis I weather simulation on Nov. 3, 2021. The event involved teams from CCSFS, Kennedy Space Center, Johnson Space Center in Texas, and Marshall Space Flight Center in Alabama. Weather balloons provided data below 6,000 feet and above 62,000 feet, while Kennedy’s Tropospheric Doppler Radar Wind Profiler delivered data from 6,000 to 62,000 feet. The radar wind profiler will be used as the primary upper level wind instrument for NASA’s Artemis missions, including Artemis I, the first launch of the agency’s Space Launch System rocket and the Orion spacecraft on a flight beyond the Moon.
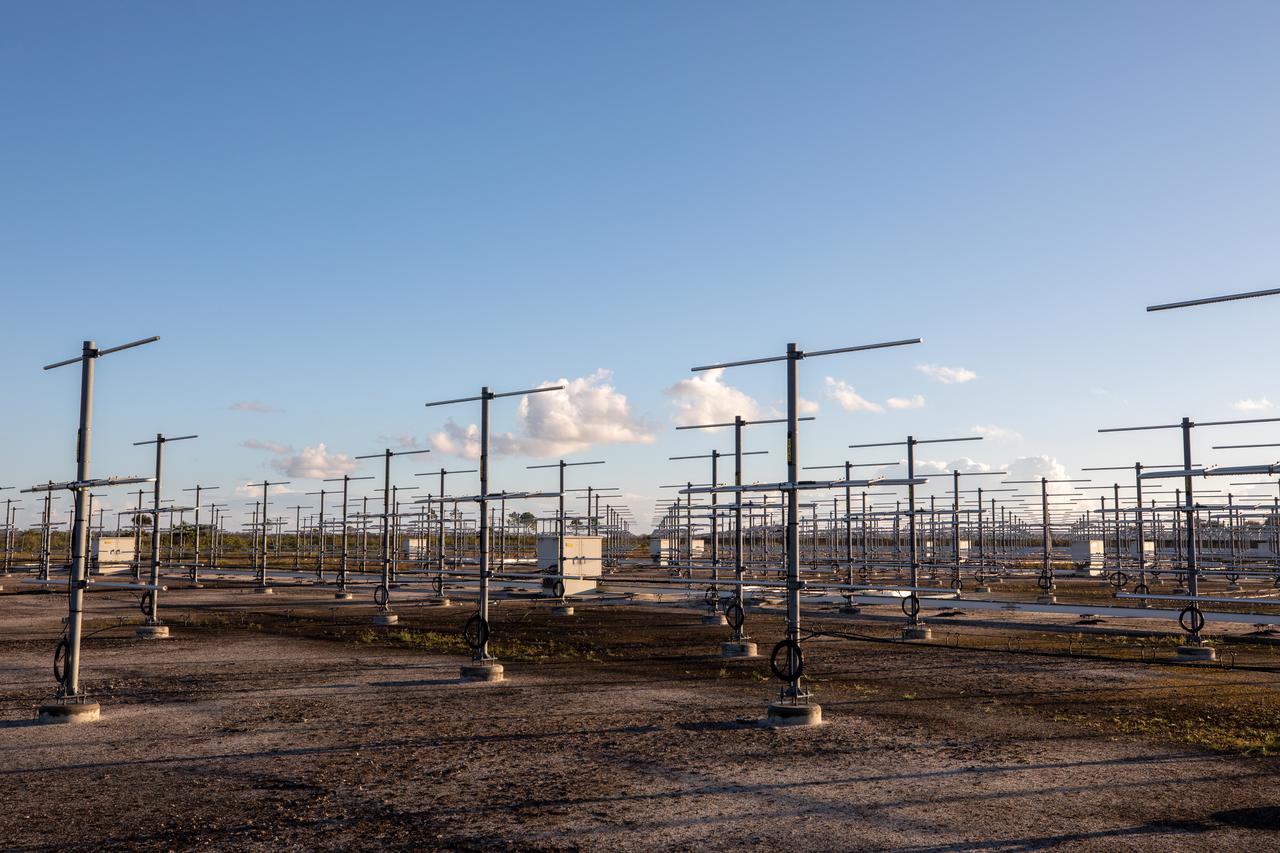
The Tropospheric Doppler Radar Wind Profiler, located on five acres near the Launch and Landing Facility at Kennedy Space Center in Florida, is shown during an Artemis I weather simulation on Nov. 3, 2021. The simulation involved teams from Kennedy, Cape Canaveral Space Force Station, Johnson Space Center in Texas, and Marshall Space Flight Center in Alabama. The radar wind profiler consists of 640 antennae and delivers data – from 6,000 to 62,000 feet – every five minutes. The instrument will be used as the primary upper level wind instrument for NASA’s Artemis missions, including Artemis I, the first launch of the agency’s Space Launch System rocket and the Orion spacecraft on a flight beyond the Moon.
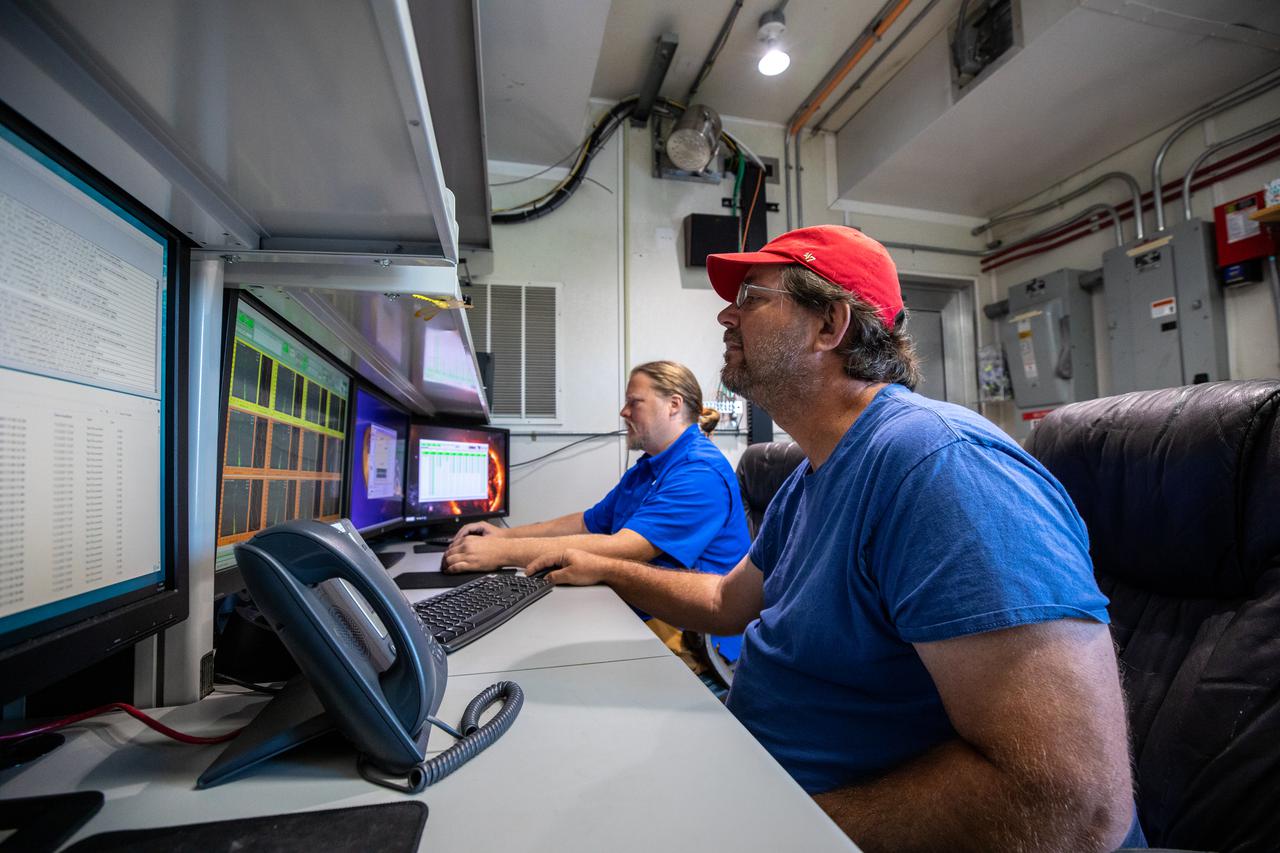
Weather Instrumentation Technician Gavin Oglesby, left, and Weather Instrumentation Engineer Nick O’Connor work with the Tropospheric Doppler Radar Wind Profiler at Kennedy Space Center in Florida during an Artemis I weather simulation on Nov. 3, 2021. The simulation involved teams from Kennedy, Cape Canaveral Space Force Station, Johnson Space Center in Texas, and Marshall Space Flight Center in Alabama. The radar wind profiler delivers data – from 6,000 to 62,000 feet – every five minutes. It will be used as the primary upper level wind instrument for NASA’s Artemis missions, including Artemis I, the first launch of the agency’s Space Launch System rocket and the Orion spacecraft on a flight beyond the Moon.
Barry Lefer, tropospheric composition program manager in the Earth Science Division of NASA’s Science Mission Directorate, at podium, answers a question during a briefing on NASA’s TEMPO (Tropospheric Emissions: Monitoring of Pollution) instrument along with Caroline Nowlan, atmospheric physicist at the Center for Astrophysics | Harvard & Smithsonian, left, Karen St. Germain, director of the Earth Science Division of NASA’s Science Mission Directorate, second from left, Laura Judd, associate program manager for the Applied Sciences Health and Air Quality Applications in the Applied Sciences Program of NASA’s Earth Science Division, third from right, Erika Wright, education specialist at the Center for Astrophysics | Harvard & Smithsonian, second from right, and Karen Fox, NASA Public Affairs Officer, right, Tuesday, March 14, 2023 at the Smithsonian’s National Air and Space Museum in Washington. NASA’s TEMPO instrument, the first Earth Venture Instrument mission, will measure air pollution across North America from Mexico City to the Canadian oil sands and from the Atlantic to the Pacific hourly and at a high spatial resolution. A partnership between NASA and the Center for Astrophysics | Harvard & Smithsonian, TEMPO will launch on a commercial satellite to geostationary orbit as early as April. Photo Credit: (NASA/Joel Kowsky)

Earth atmosphere observation taken by the Expedition 35 crew aboard the ISS. The colors roughly denote the layers of the atmosphere (the orange troposphere, the white stratosphere, and the blue mesosphere).
This Expedition Seven image, taken while aboard the International Space Station (ISS), shows the limb of the Earth at the bottom transitioning into the orange-colored stratosphere, the lowest and most dense portion of the Earth's atmosphere. The troposphere ends abruptly at the tropopause, which appears in the image as the sharp boundary between the orange- and blue-colored atmosphere. The silvery blue noctilucent clouds extend far above the Earth's troposphere. The silver of the setting moon is visible at upper right.
This video shows Jupiter as revealed by a powerful telescope and a mid-infrared filter sensitive to the giant planet's tropospheric temperatures and cloud thickness. It combines observations made on Jan. 14, 2017, using the Subaru Telescope in Hawaii. The filter used admits infrared light centered on a wavelength of 8.8 microns. The video includes interpolated frames for smoother apparent motion. The instrument used to take this image is Cooled Mid-Infrared Camera and Spectrometer (COMICS) of the National Astronomical Observatory of Japan's Subaru Telescope on the Maunakea volcano. Animations are available at https://photojournal.jpl.nasa.gov/catalog/PIA21715

Climate researchers from the National Center for Atmospheric Research (NCAR) and several universities install and perform functional checkouts of a variety of sensitive atmospheric instruments on NASA's DC-8 airborne laboratory prior to beginning the ARCTAS mission.
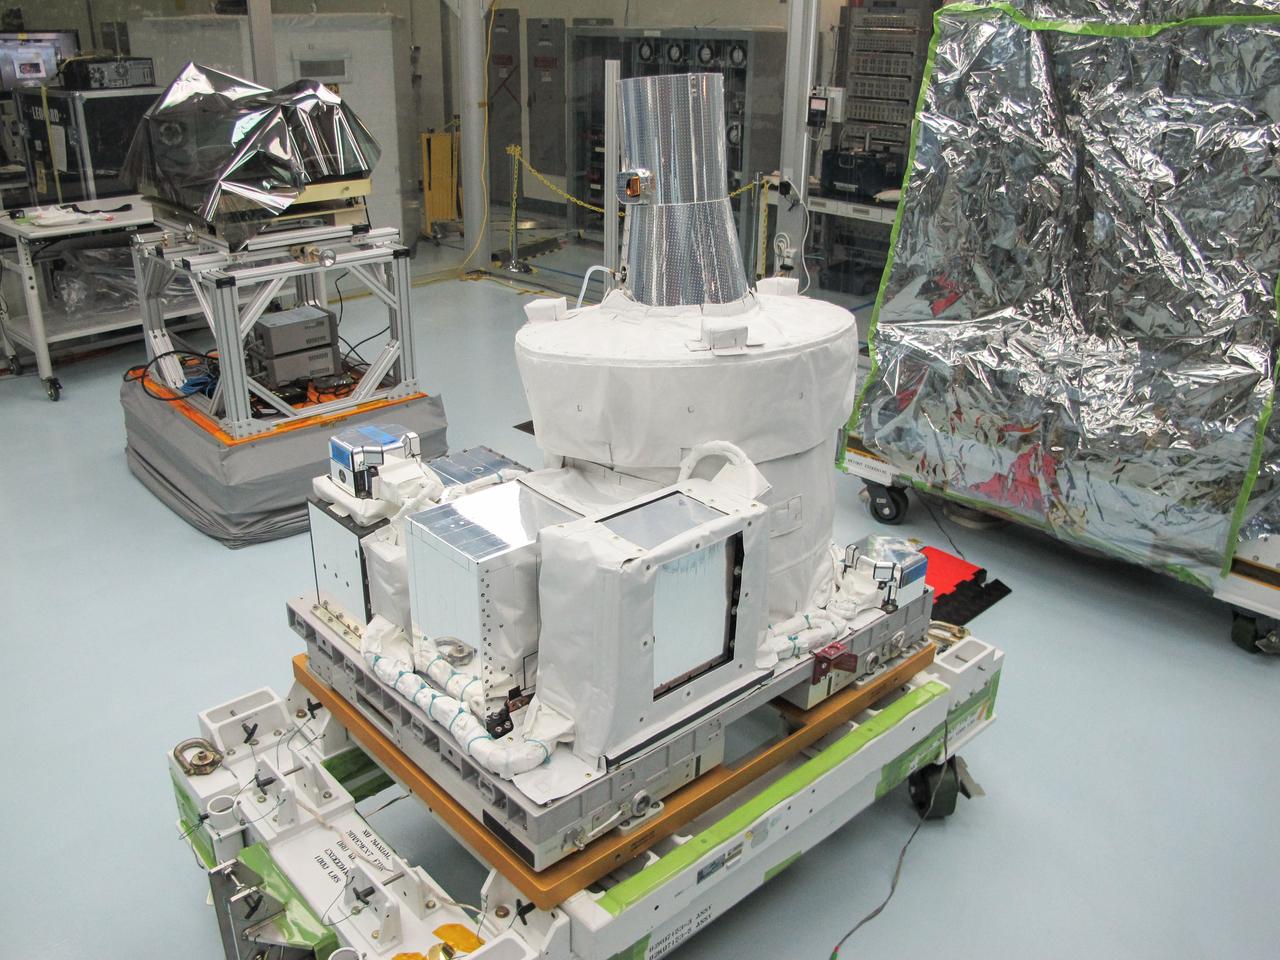
jsc2016e013816 (1/20/2016) --- A view of the SAGE-III Instrument Payload Integrated on EXPRESS Pallet Adapter (ExPA) After Final Sharp Edge Inspection. The role of Stratospheric Aerosol and Gas Experiment III-ISS (SAGE III-ISS) is to provide global, long-term measurements of key components of the Earth's atmosphere. The most important of these are the vertical distributions of aerosols and ozone from the upper troposphere through the stratosphere.

iss071e067226_stk (5/8/2024) --- NASA astronaut Matt Dominick aboard space station captured this waxing lunar crescent illuminated by the Sun. The rest of the Moon dimly glows by earthshine when sunlight reflects off Earth onto the Moon. Scientists track the Earth’s brightness, or albedo, via this phenomenon. This photo also shows a cross-section of Earth’s atmospheric layers, including the orange troposphere nearest to the surface and the thicker, light-blue stratosphere above that.
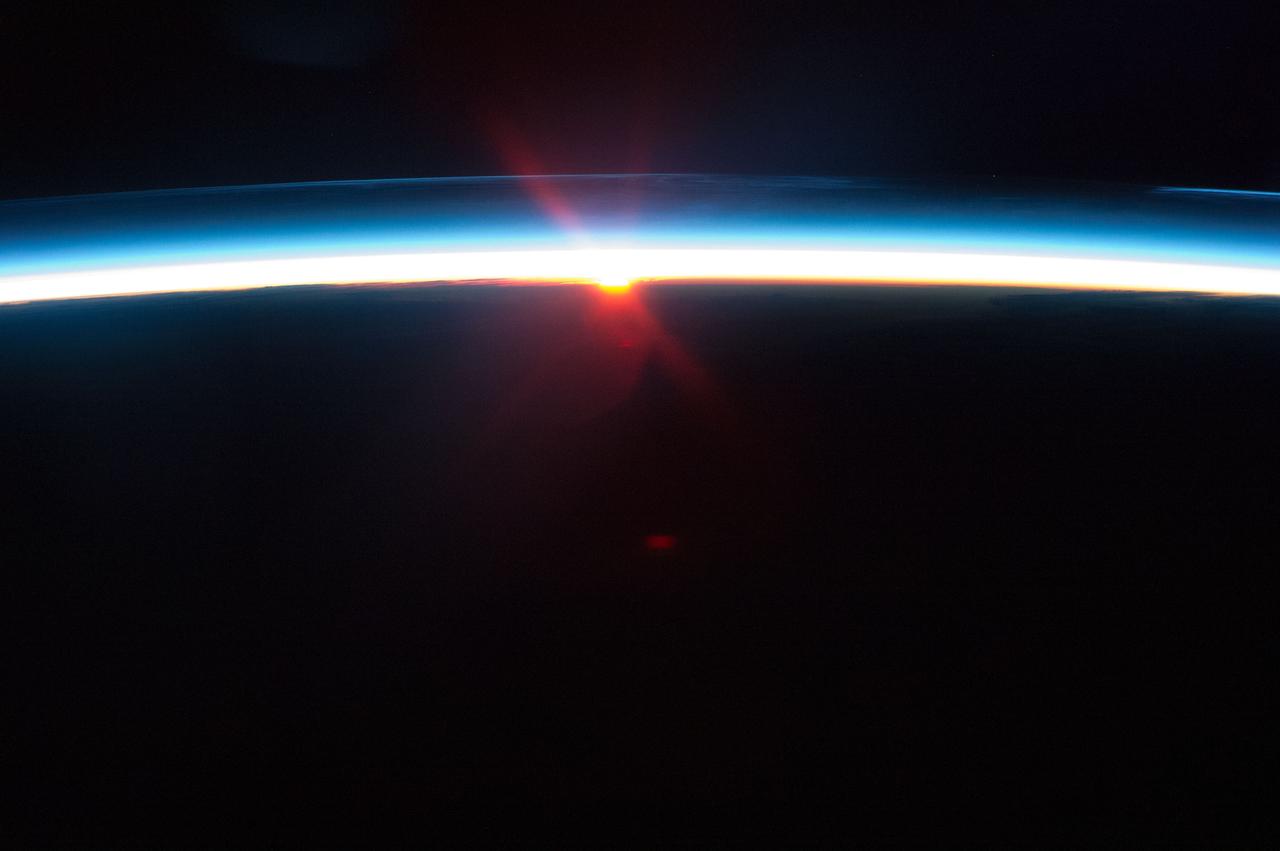
ISS040-E-87351 (1 Aug. 2014) --- This sunset shot, photographed by an Expedition 40 crew member on the International Space Station, shows polar mesospheric clouds only as a thin bright line ? far above the lowest, yellow-brown weather layer of the atmosphere (known as the troposphere) when the space station was flying over southern Ukraine on Aug. 1, 2014.
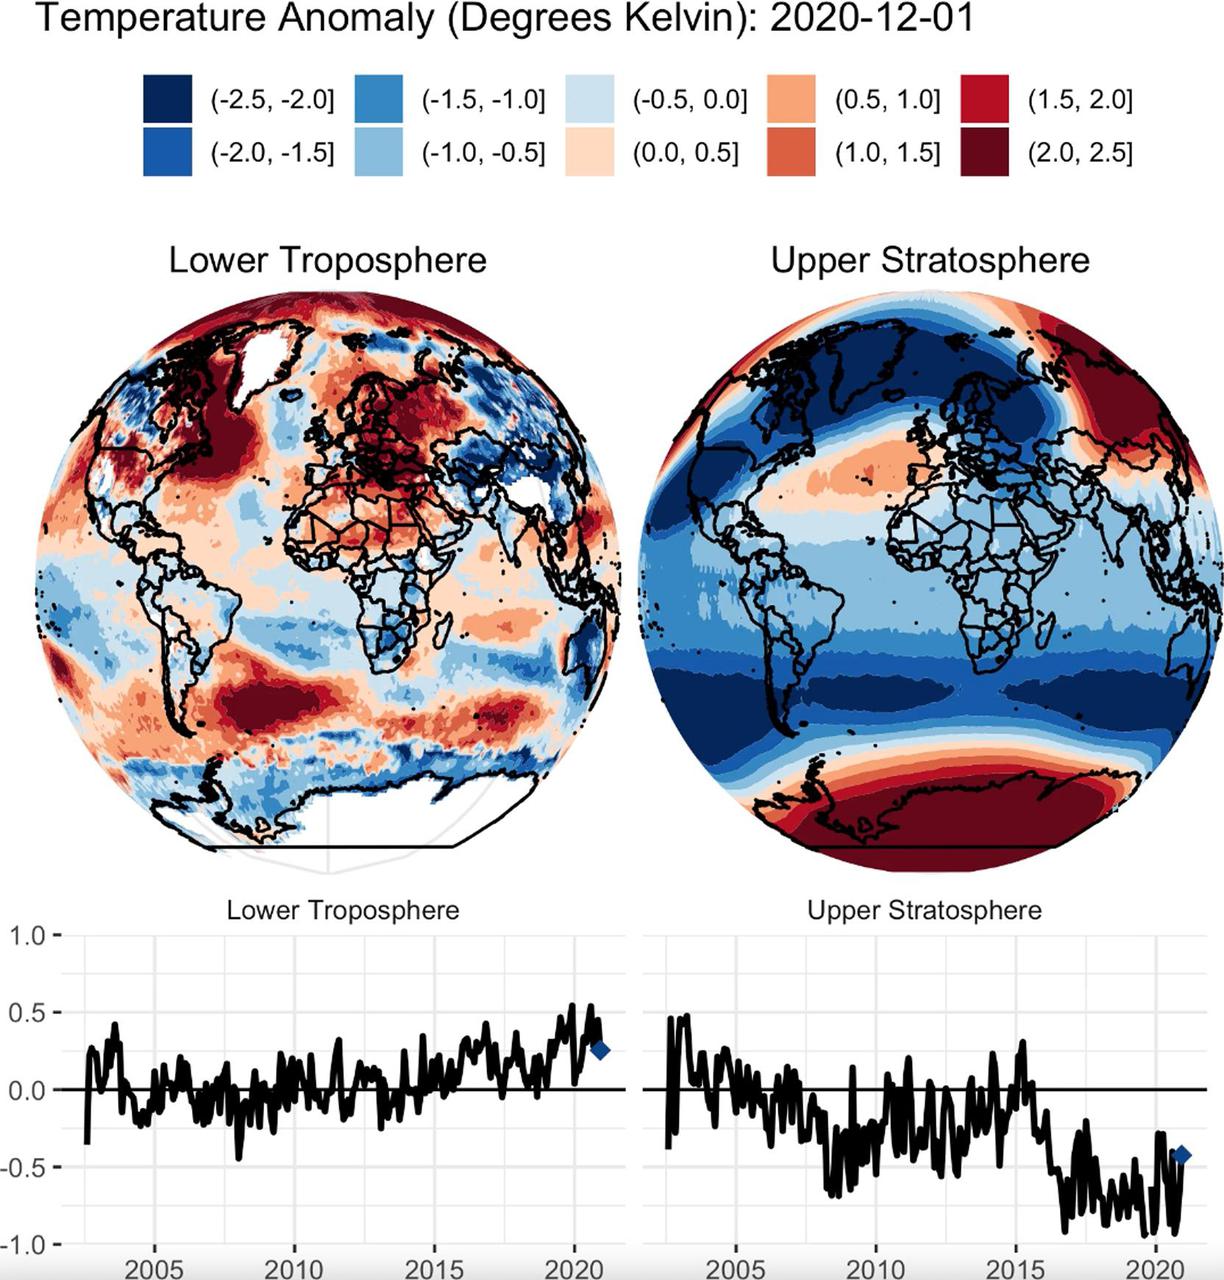
This animation shows a nearly 20-year record of temperature anomalies for two layers in Earth's atmosphere: the lower troposphere, where most of the planet's weather occurs; and the upper stratosphere, which contains the ozone layer. NASA's Atmospheric Infrared Sounder (AIRS), aboard the Aqua satellite, captured these measurements from 2002 to 2020. Preliminary data analysis shows a warming trend for the lower troposphere, and a strong cooling trend in the upper stratosphere. The globes show a map of where warmer than average or cooler than average temperatures for each atmospheric layer occurred during this time period. The line graphs show the deviation of temperatures averaged over the entire planet for the lower troposphere and upper stratosphere. AIRS, in conjunction with the Advanced Microwave Sounding Unit (AMSU), senses emitted infrared and microwave radiation from Earth to provide a three-dimensional look at the planet's weather and climate. Working in tandem, the two instruments make simultaneous observations down to Earth's surface. With more than 2,000 channels sensing different regions of the atmosphere, the system creates a global, three-dimensional map of atmospheric temperature and humidity, cloud amounts and heights, greenhouse gas concentrations and many other atmospheric phenomena. Launched into Earth orbit in 2002 aboard NASA's Aqua spacecraft, the AIRS and AMSU instruments are managed by NASA's Jet Propulsion Laboratory in Southern California, under contract to NASA. JPL is a division of Caltech. Movie available at https://photojournal.jpl.nasa.gov/catalog/PIA24139
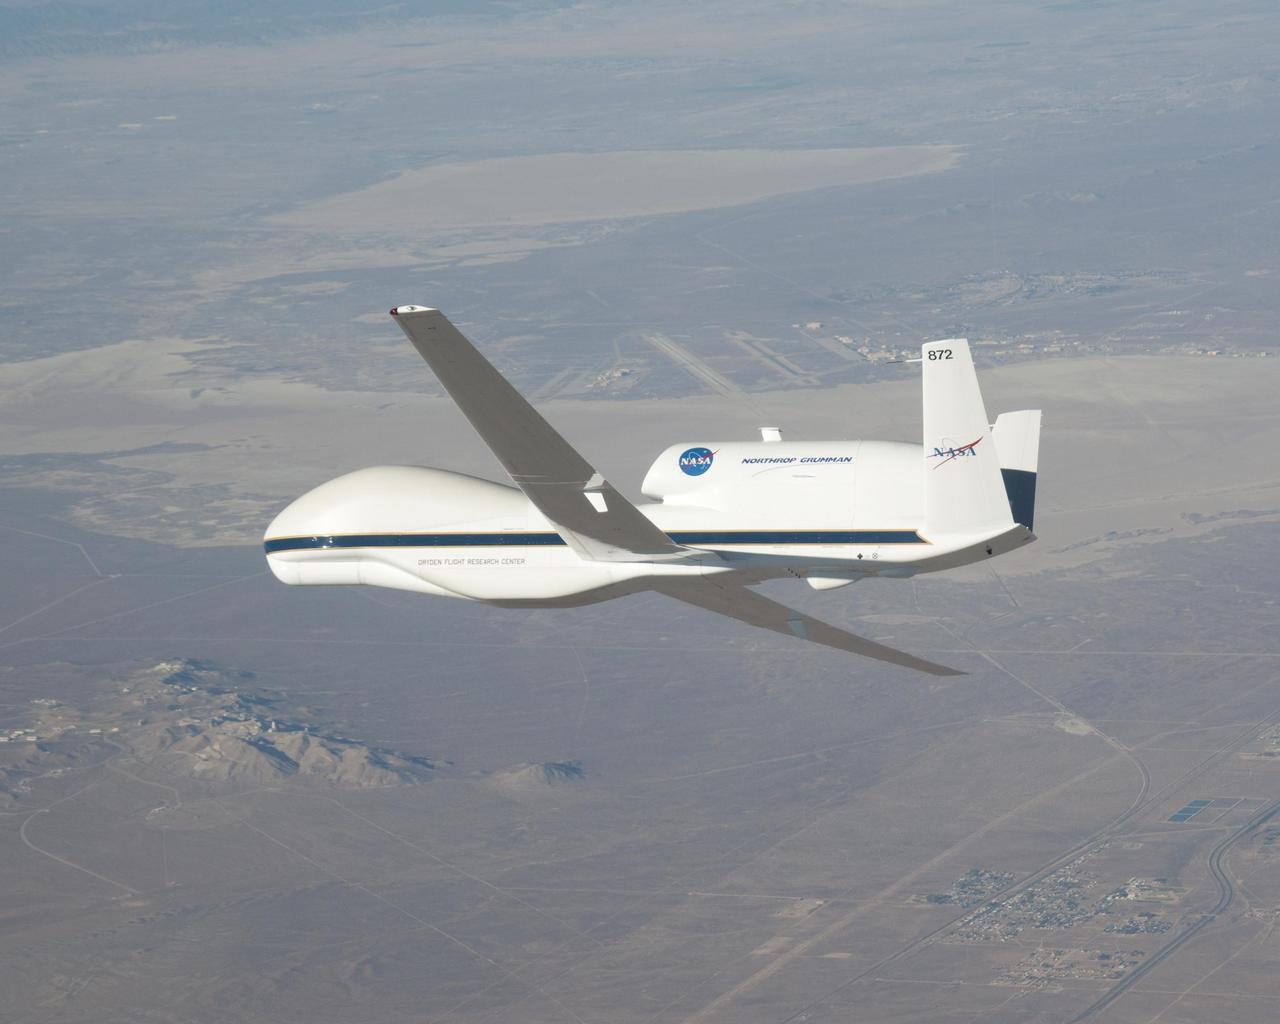
NASA image acquired October 23, 2009. At NASA’s Dryden Research Center in California, a group of engineers, scientists, and aviation technicians have set up camp in a noisy, chilly hangar on Edwards Air Force base. For the past two weeks, they have been working to mount equipment—from HD video cameras to ozone sensors—onto NASA’s Global Hawk, a remote-controlled airplane that can fly for up to 30 hours at altitudes up to 65,000 feet. The team is gearing up for the Global Hawk Pacific campaign, a series of four or five scientific research flights that will take the Global Hawk over the Pacific Ocean and Arctic regions. The 44-foot-long aircraft, with its comically large nose and 116-foot wingspan is pictured in the photograph above, banking for landing over Rogers Dry Lake in California at the end of a test flight on October 23, 2009. The long wings carry the plane’s fuel, and the bulbous nose is one of the payload bays, which house the science instruments. For the Global Hawk Pacific campaign, the robotic aircraft will carry ten science instruments that will sample the chemical composition of air in the troposphere (the atmospheric layer closest to Earth) and the stratosphere (the layer above the troposphere). The mission will also observe clouds and aerosol particles in the troposphere. The primary purpose of the mission is to collect observations that can be used to check the accuracy of simultaneous observations collected by NASA’s Aura satellite. Co-lead scientist Paul Newman from Goddard Space Flight Center is writing about the ground-breaking mission for the Earth Observatory’s Notes from the Field blog. NASA Photograph by Carla Thomas. <b><a href="http://www.nasa.gov/centers/goddard/home/index.html" rel="nofollow">NASA Goddard Space Flight Center</a></b> is home to the nation's largest organization of combined scientists, engineers and technologists that build spacecraft, instruments and new technology to study the Earth, the sun, our solar system, and the universe. To learn more about this image go to: <a href="http://earthobservatory.nasa.gov/IOTD/view.php?id=43291" rel="nofollow">earthobservatory.nasa.gov/IOTD/view.php?id=43291</a>
KENNEDY SPACE CENTER, FLA. -- EOS Aura: The Aura mission will study air quality, climate and stratospheric ozone depletion. Aura is the third of NASA’s major Earth Observing System (EOS) orbital platforms and has four instruments. The Microwave Limb Sounder (MLS) and the High Resolution Dynamics Limb Sounder (HIRDLS) will make complementary measurements of stratospheric ozone and the chemicals that destroy it. HIRDELS and MLS will also measure upper tropospheric water vapor and ozone - key gases that regulate climate. The Aura payload also includes the Tropospheric Emission Spectrometer (TES), which will make the first global measurements of lower atmospheric ozone, and the Ozone Monitoring Instrument (OMI), which will measure the total amount of atmospheric ozone as well as lower atmospheric dust, smoke and other aerosols. Aura is scheduled to launch in 2004. The flags on the decals represent the countries participating in the mission: United States, United Kingdom, Netherlands and Finland. The EOS Aura mission is being managed by NASA’s Goddard Space Flight Center.
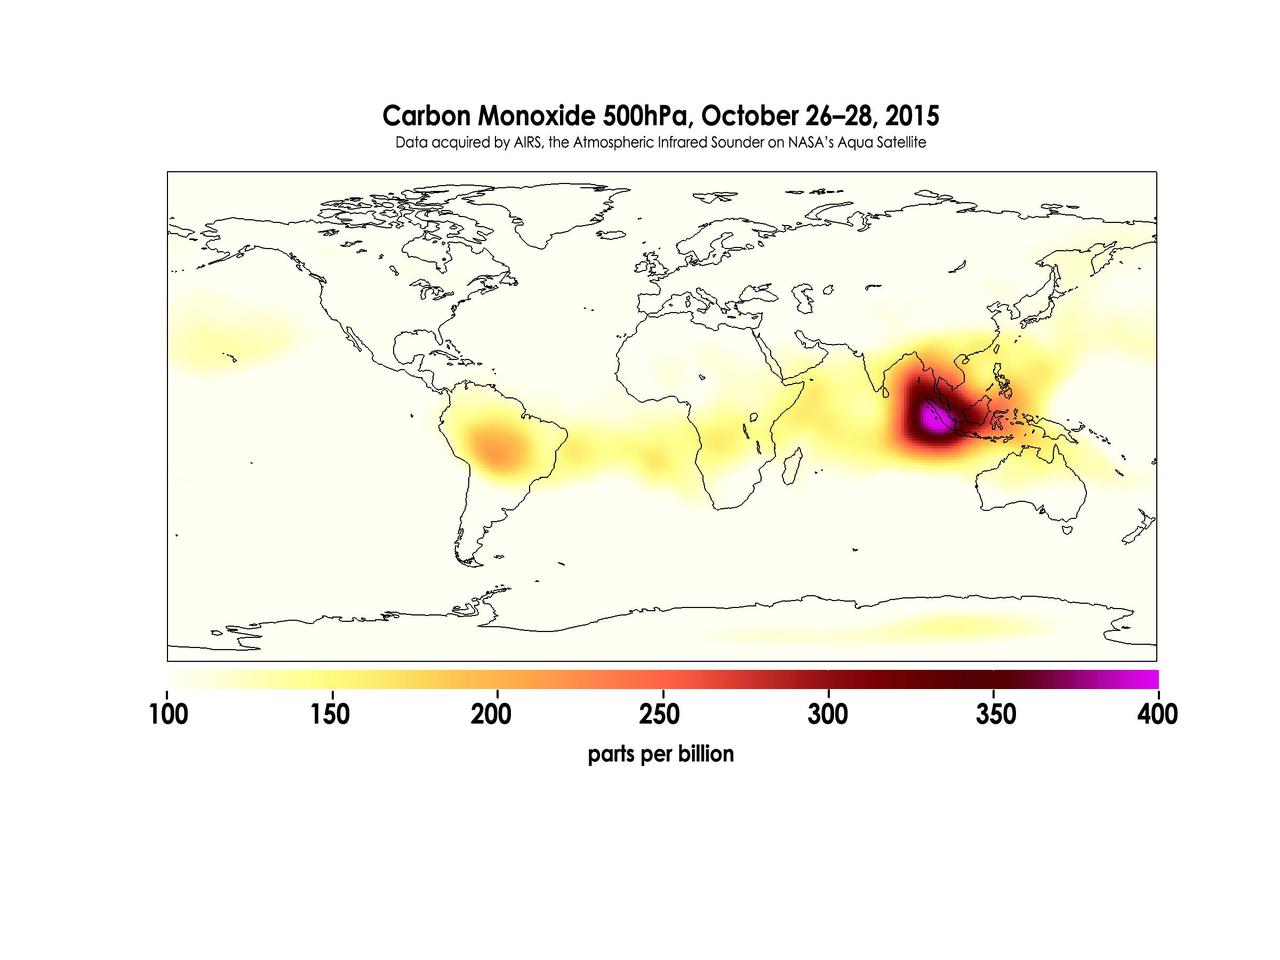
Widespread forest fires across Indonesia have burned tens of thousands of acres over three months, causing high levels of pollution, loss of life, and billions of dollars to the Indonesian government. It is estimated that more than 43 million people have been inhaling toxic fumes, and large parts of Indonesia have been placed in a state of emergency. Most of the fires are believed to have been set to clear farmland during the dry season, but a long term drought enhanced by El Niño conditions have contributed to the fires remaining unchecked due to lack of rain. These images made with data acquired by AIRS, the Atmospheric Infrared Sounder on NASA's Aqua Satellite, show the global concentration of carbon monoxide at the 500hPa pressure level, or approximately 18,000 feet (5,500 meters) altitude. The data are an average of measurements taken over three days, from October 14 through 16, and October 26 through 28, and the high concentration and large extent of the fires over Indonesia are quite apparent. While the scale for this image extends to 400 parts per billion, local values of carbon monoxide can be significantly higher. http://photojournal.jpl.nasa.gov/catalog/PIA20042

NASA's Atmospheric Infrared Sounder (AIRS) instrument captures a polar vortex moving from Central Canada into the U.S. Midwest from January 20 through January 29, 2019. The images show air temperatures at 600 millibars, around 2.5 miles (4 kilometers) high in Earth's troposphere. This polar vortex is responsible for surface air temperatures as low as -40 degrees Fahrenheit (also -40 degrees Celsius) and wind chill readings as low as the -50s and -60s Fahrenheit (-46 and -51 Celsius). Animation available at https://photojournal.jpl.nasa.gov/catalog/PIA22823
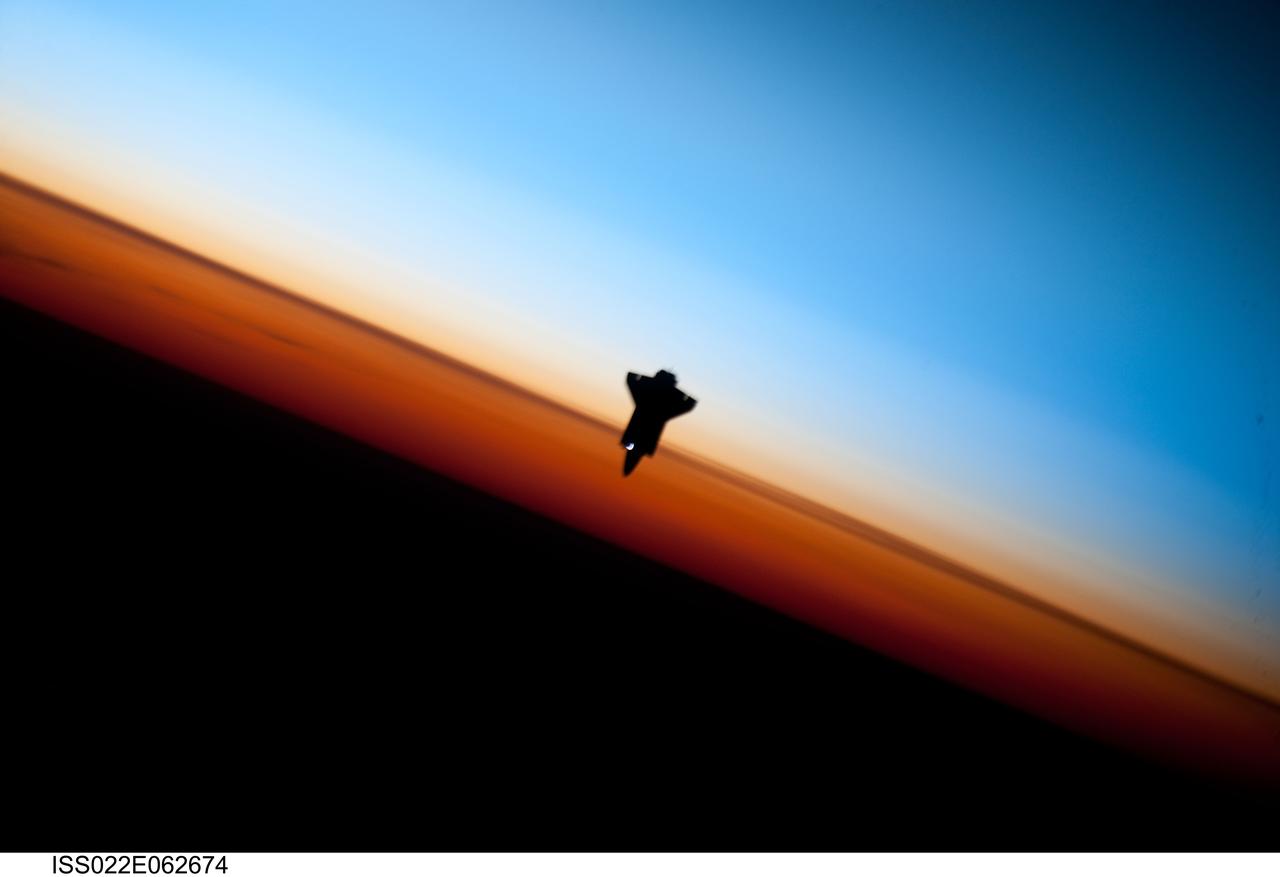
ISS022-E-062674 (9 Feb. 2010) --- Though astronauts and cosmonauts often encounter striking scenes of Earth's limb, this very unique image, part of a series over Earth's colorful horizon, has the added feature of a silhouette of the space shuttle Endeavour. The image was photographed by an Expedition 22 crew member prior to STS-130 rendezvous and docking operations with the International Space Station. Docking occurred at 11:06 p.m. (CST) on Feb. 9, 2010. The orbital outpost was at 46.9 south latitude and 80.5 west longitude, over the South Pacific Ocean off the coast of southern Chile with an altitude of 183 nautical miles when the image was recorded. The orange layer is the troposphere, where all of the weather and clouds which we typically watch and experience are generated and contained. This orange layer gives way to the whitish Stratosphere and then into the Mesosphere. In some frames the black color is part of a window frame rather than the blackness of space.
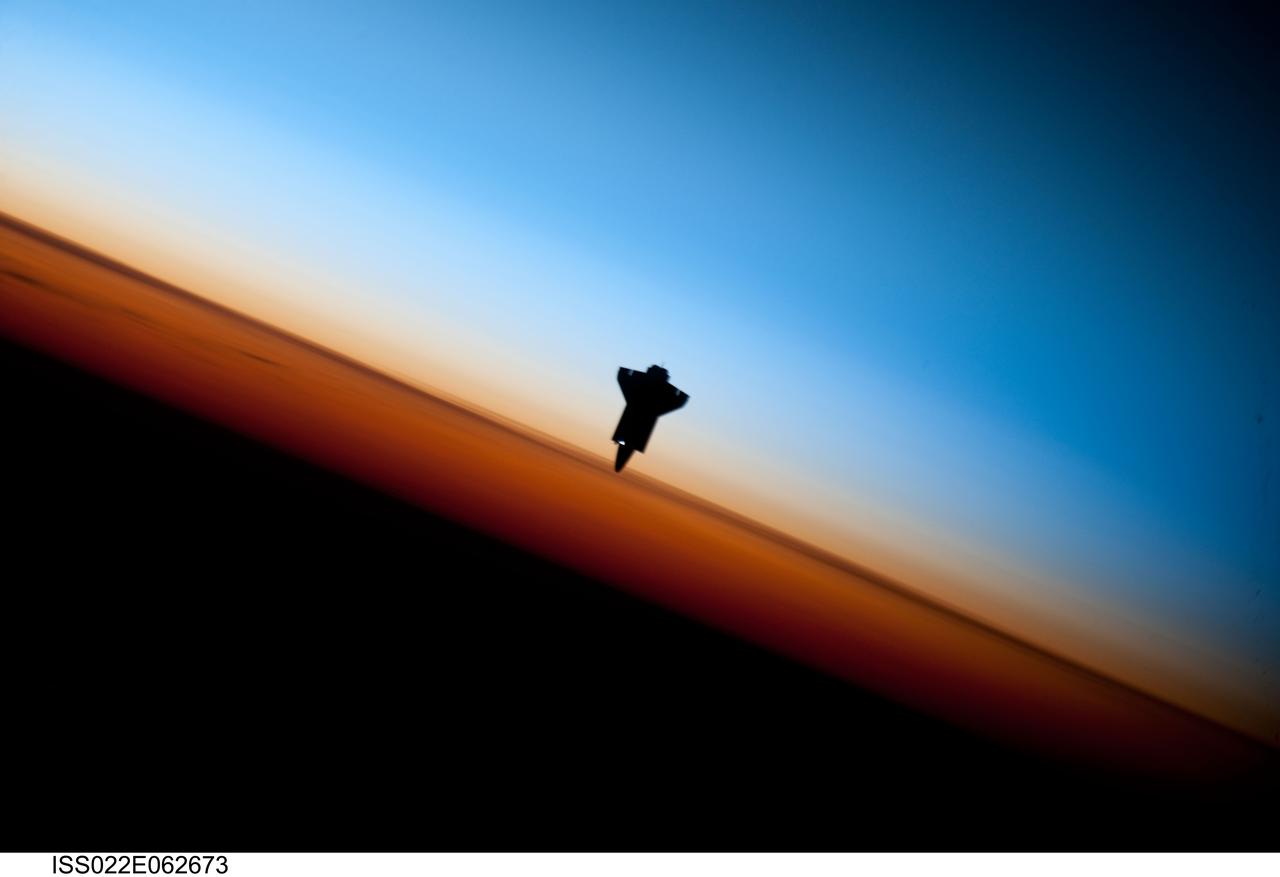
ISS022-E-062673 (9 Feb. 2010) --- Though astronauts and cosmonauts often encounter striking scenes of Earth's limb, this very unique image, part of a series over Earth's colorful horizon, has the added feature of a silhouette of the space shuttle Endeavour. The image was photographed by an Expedition 22 crew member prior to STS-130 rendezvous and docking operations with the International Space Station. Docking occurred at 11:06 p.m. (CST) on Feb. 9, 2010. The orbital outpost was at 46.9 south latitude and 80.5 west longitude, over the South Pacific Ocean off the coast of southern Chile with an altitude of 183 nautical miles when the image was recorded. The orange layer is the troposphere, where all of the weather and clouds which we typically watch and experience are generated and contained. This orange layer gives way to the whitish Stratosphere and then into the Mesosphere. In some frames the black color is part of a window frame rather than the blackness of space.
STS047-54-016 (12 - 20 Sept 1992) --- The colors in this photograph provide insight into the relative density of the atmosphere. The crew members had many opportunities to witness sunrises and sunsets, considering they orbit the Earth every 90 minutes, but few, they said, compared to this scene. It captures the silhouette of several mature thunderstorms with their cirrus anvil tops spreading out against the tropopause (the top of the lowest layer of Earth's atmosphere) at sunset. The lowest layer (troposphere) is the densest and refracts light at the red end of the visible spectrum (7,400 Angstroms), while the blues (4,000 Angstroms) are separated in the least dense portion of the atmosphere (middle and upper atmosphere, or stratosphere and mesosphere). Several layers of blue can be seen. NASA scientists studying the photos believe this stratification to be caused by the scattering of light by particulate trapped in the stratosphere and mesosphere particulate that generally originate from volcanic eruptions, such as those of Mt. Pinatubo in the Philippines and, most recently, Mt. Spurr in Alaska.
STS052-23-022 (22 Oct.-1 Nov. 1992) --- As the Space Shuttle Columbia orbited Earth in an easterly direction over the Indian Ocean, moonrise was followed quickly by sunrise. The photograph was taken from an altitude of 285 kilometers (154 nautical miles), over Lake Tanganyika in central Africa. The Sun was still 28 degrees below the horizon and not yet illuminating the dark band of low-level clouds on the limb 1,850 kilometers (l,000 nautical miles) away. Ranging from 13--18 kilometers above these low-level clouds is a brown layer at the tropical tropopause. A tropopause is a major atmospheric temperature inversion which isolates the troposphere from the stratosphere and effectively concentrates particulate from both above and below this level.
STS083-748-006 (4-8 April 1997) --- This type of scene is seen about every 45 minutes as the astronauts travel around the world. Sunrises and sunsets differ in structure, since the tropopause altitude and atmospheric lamina temperatures vary with time of day, season, and latitude. Close analysis of these terminator photographs provide counts of the number and spacing of atmospheric laminae. In the photographs, as many as 4 laminae have been noted in the normally red-to-orange troposphere, and up to 12 laminae have been counted in the blue upper atmosphere. However, true replication of human vision is not possible using present films. For instance, while on orbit, one astronaut counted 22 layers. The photograph of that event recorded only 8 such layers.
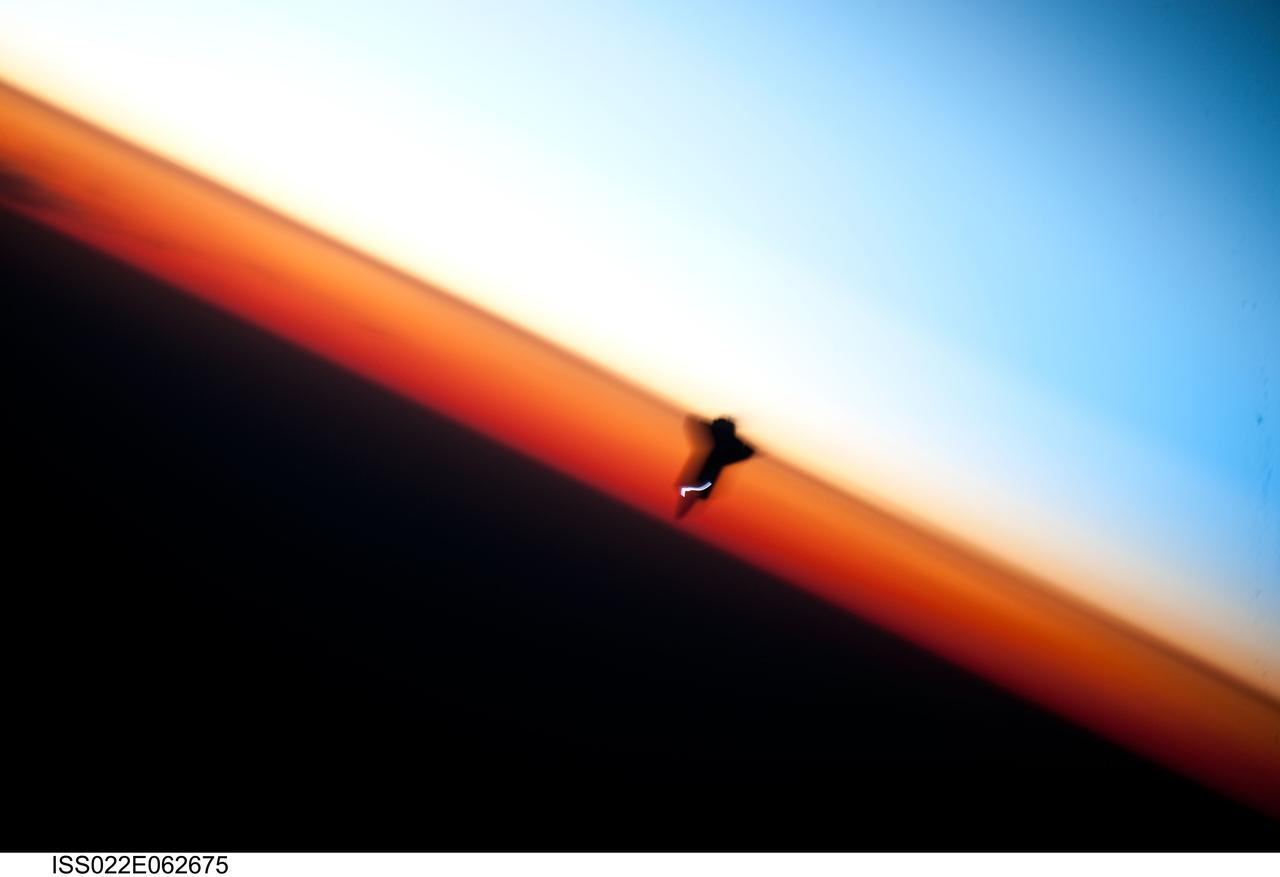
ISS022-E-062675 (9 Feb. 2010) --- Though astronauts and cosmonauts often encounter striking scenes of Earth's limb, this very unique image, part of a series over Earth's colorful horizon, has the added feature of a silhouette of the space shuttle Endeavour. The image was photographed by an Expedition 22 crew member prior to STS-130 rendezvous and docking operations with the International Space Station. Docking occurred at 11:06 p.m. (CST) on Feb. 9, 2010. The orbital outpost was at 46.9 south latitude and 80.5 west longitude, over the South Pacific Ocean off the coast of southern Chile with an altitude of 183 nautical miles when the image was recorded. The orange layer is the troposphere, where all of the weather and clouds which we typically watch and experience are generated and contained. This orange layer gives way to the whitish Stratosphere and then into the Mesosphere. In some frames the black color is part of a window frame rather than the blackness of space.
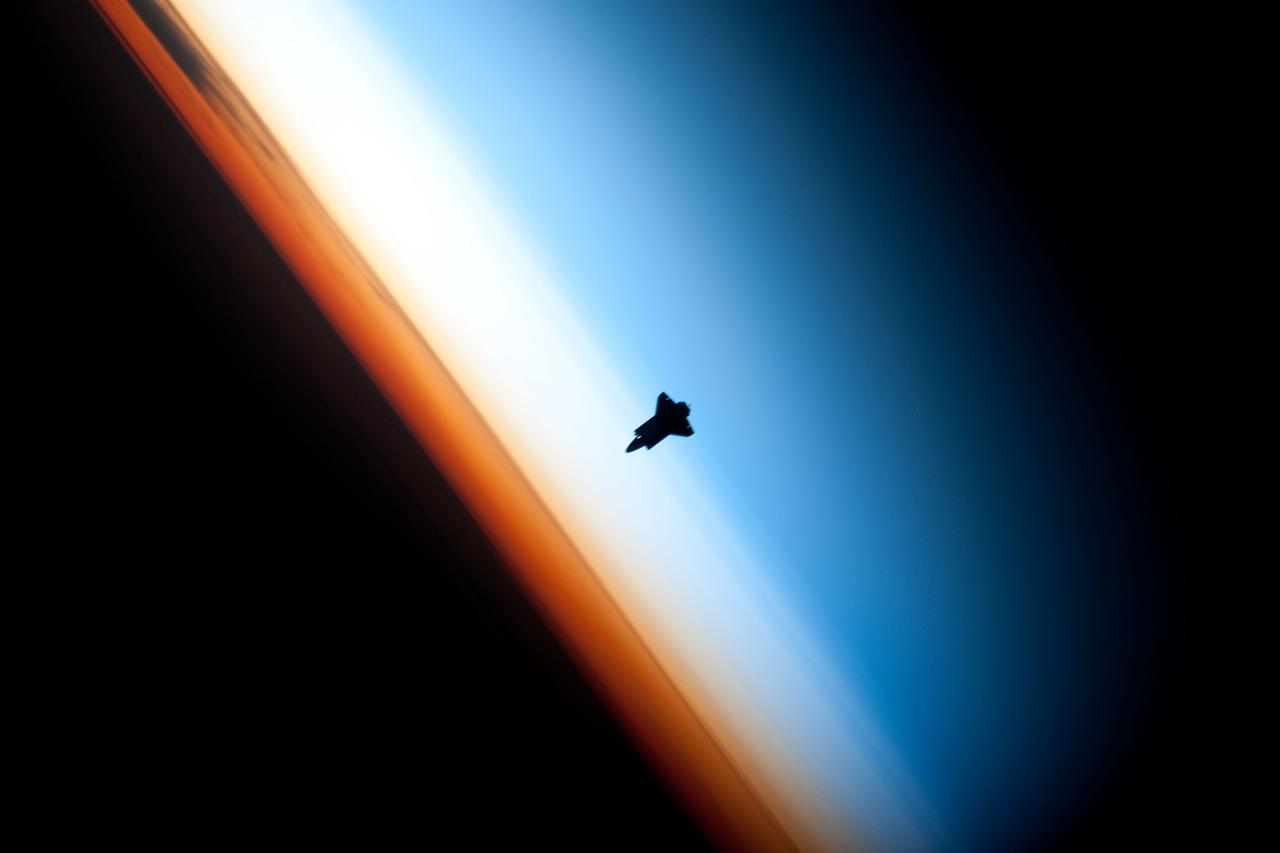
ISS022-E-062672 (9 Feb. 2010) --- Though astronauts and cosmonauts often encounter striking scenes of Earth's limb, this very unique image, part of a series over Earth's colorful horizon, has the added feature of a silhouette of the space shuttle Endeavour. The image was photographed by an Expedition 22 crew member prior to STS-130 rendezvous and docking operations with the International Space Station. Docking occurred at 11:06 p.m. (CST) on Feb. 9, 2010. The orbital outpost was at 46.9 south latitude and 80.5 west longitude, over the South Pacific Ocean off the coast of southern Chile with an altitude of 183 nautical miles when the image was recorded. The orange layer is the troposphere, where all of the weather and clouds which we typically watch and experience are generated and contained. This orange layer gives way to the whitish Stratosphere and then into the Mesosphere. In some frames the black color is part of a window frame rather than the blackness of space.
The STS-64 patch depicts the Space Shuttle Discovery in a payload-bay-to-Earth attitude with its primary payload, Lidar In-Space Technology Experiment (LITE-1) operating in support of Mission to Planet Earth. LITE-1 is a lidar system that uses a three-wavelength laser, symbolized by the three gold rays emanating from the star in the payload bay that form part of the astronaut symbol. The major objective of the LITE-1 is to gather data about the Earth's troposphere and stratosphere, represented by the clouds and dual-colored Earth limb. A secondary payload on STS-64 is the free-flier SPARTAN 201 satellite shown on the Remote Manipulator System (RMS) arm post-retrieval. The RMS also operated another payload, Shuttle Plume Impingement Flight Experiment (SPIFEX). A newly tested extravehicular activity (EVA) maneuvering device, Simplified Aid for EVA Rescue (SAFER), represented symbolically by the two small nozzles on the backpacks of the two untethered EVA crew men. The names of the crew members encircle the patch: Astronauts Richard N. Richards, L. Blaine Hammond, Jr., Jerry M. Linenger, Susan J. Helms, Carl J. Meade and Mark C. Lee. The gold or silver stars by each name represent that person's parent service.
VANDENBERG AIR FORCE BASE, CALIF. - The interstage of a Boeing Delta 2 rocket arrives on Space Launch Complex 2 at Vandenberg Air Force Base in California. It will be mated with the first stage in the launch service tower. The Delta 2 is the launch vehicle for the National Oceanic and Atmospheric Administration (NOAA-N) spacecraft. The NOAA-N satellite will be placed into a polar orbit aboard a Boeing Delta 2 rocket. The spacecraft will continue to provide a polar-orbiting platform to support (1) environmental monitoring instruments for imaging and measuring the Earth's atmosphere, its surface, and cloud cover, including Earth radiation, atmospheric ozone, aerosol distribution, sea surface temperature, and vertical temperature and water profiles in the troposphere and stratosphere; (2) measurement of proton and electron flux at orbit altitude; (3) data collection from remote platforms; and (4) the Search and Rescue Satellite-Aided Tracking (SARSAT) system. Additionally, NOAA-N is the fourth in the series of support dedicated microwave instruments for the generation of temperature, moisture, surface, and hydrological products in cloudy regions where visible and infrared (IR) instruments have decreased capability. Launch is currently scheduled for no earlier than May 11, 2005.

This false-color image of Jupiter was taken on May 18, 2017, with a mid-infrared filter centered at a wavelength of 8.8 microns, at the Subaru Telescope in Hawaii, in collaboration with observations of Jupiter by NASA's Juno mission. The selected wavelength is sensitive to Jupiter's tropospheric temperatures and the thickness of a cloud near the condensation level of ammonia gas. The Great Red Spot appears distinctively at the lower center of the planet as a cold region with a thick cloud layer. It is surrounded by a warm and relatively clear periphery. To its northwest is a turbulent and chaotic region where bands of gas that is warm and dry alternate with bands of gas that is cold and moist. This image, taken a few hours before Juno's sixth close approach to Jupiter, shows the detailed atmospheric structure of the Great Red Spot and its surroundings that the Juno mission will encounter on its seventh closest approach to Jupiter on July 10, 2017, Pacific Time (July 11, Universal Time). The instrument used to take this image is Cooled Mid-Infrared Camera and Spectrometer (COMICS) of the National Astronomical Observatory of Japan's Subaru Telescope on Hawaii's Maunakea peak. https://photojournal.jpl.nasa.gov/catalog/PIA21714
VANDENBERG AIR FORCE BASE, CALIF. - At Vandenberg Air Force Base in California, the National Oceanic and Atmospheric Administration (NOAA-N) spacecraft is being transported to a hangar for preflight processing. The NOAA-N satellite will be placed into a polar orbit aboard a Boeing Delta 2 rocket. The spacecraft will continue to provide a polar-orbiting platform to support (1) environmental monitoring instruments for imaging and measuring the Earth's atmosphere, its surface, and cloud cover, including Earth radiation, atmospheric ozone, aerosol distribution, sea surface temperature, and vertical temperature and water profiles in the troposphere and stratosphere; (2) measurement of proton and electron flux at orbit altitude; (3) data collection from remote platforms; and (4) the Search and Rescue Satellite-Aided Tracking (SARSAT) system. Additionally, NOAA-N is the fourth in the series of support dedicated microwave instruments for the generation of temperature, moisture, surface, and hydrological products in cloudy regions where visible and infrared (IR) instruments have decreased capability. Launch is currently scheduled for no earlier than May 11, 2005.
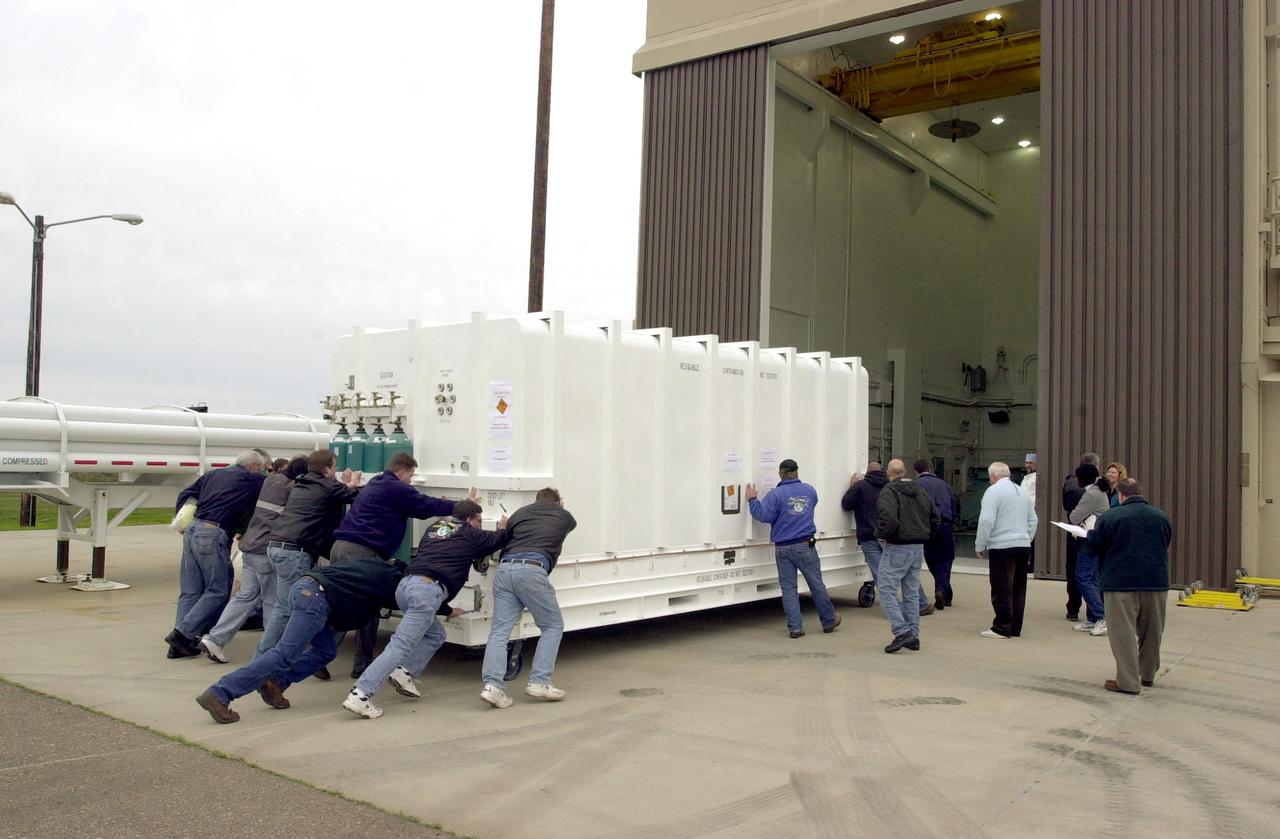
VANDENBERG AIR FORCE BASE, CALIF. - At Vandenberg Air Force Base in California, workers move the National Oceanic and Atmospheric Administration (NOAA-N) spacecraft into a hangar where it will undergo preflight processing. The NOAA-N satellite will be placed into a polar orbit aboard a Boeing Delta 2 rocket. The spacecraft will continue to provide a polar-orbiting platform to support (1) environmental monitoring instruments for imaging and measuring the Earth's atmosphere, its surface, and cloud cover, including Earth radiation, atmospheric ozone, aerosol distribution, sea surface temperature, and vertical temperature and water profiles in the troposphere and stratosphere; (2) measurement of proton and electron flux at orbit altitude; (3) data collection from remote platforms; and (4) the Search and Rescue Satellite-Aided Tracking (SARSAT) system. Additionally, NOAA-N is the fourth in the series of support dedicated microwave instruments for the generation of temperature, moisture, surface, and hydrological products in cloudy regions where visible and infrared (IR) instruments have decreased capability. Launch is currently scheduled for no earlier than May 11, 2005.
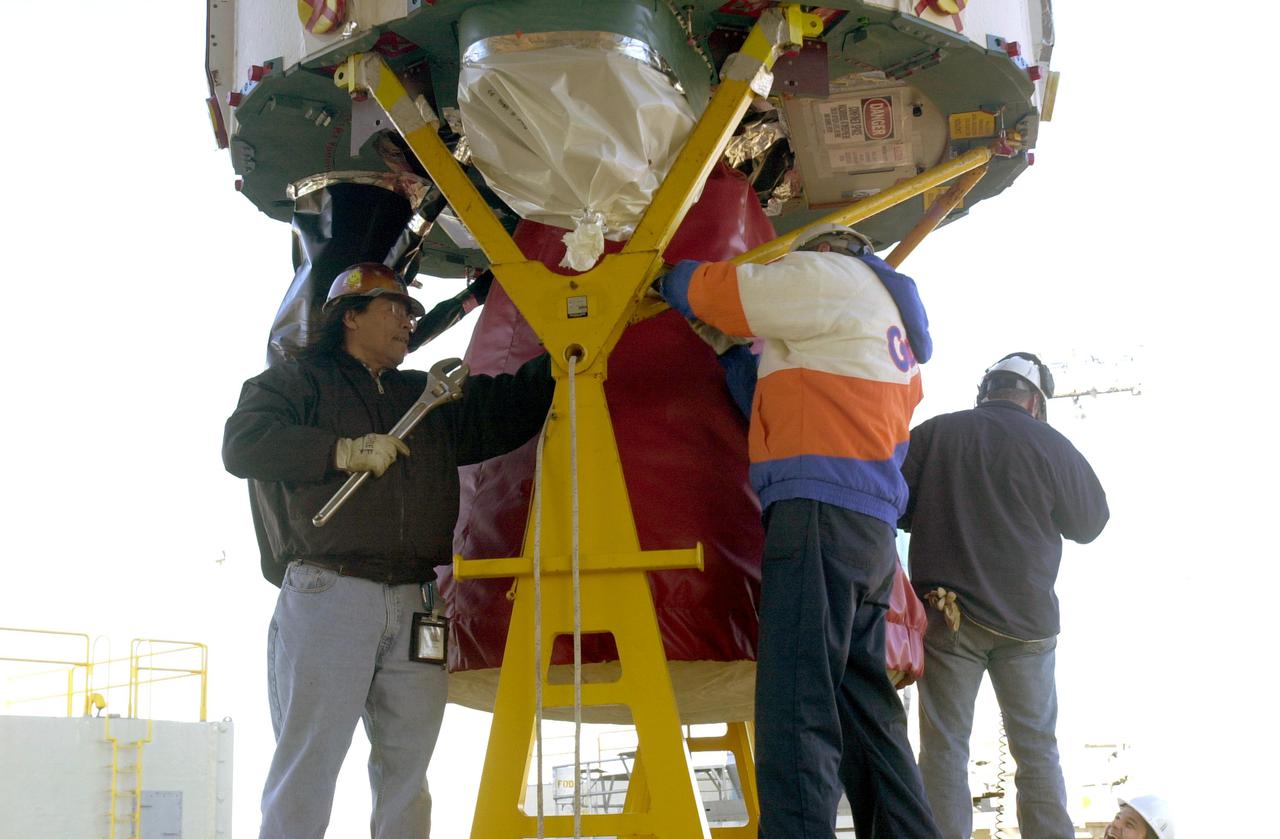
VANDENBERG AIR FORCE BASE, CALIF. - Workers on Space Launch Complex 2 at Vandenberg Air Force Base in California secure the engine on the first stage of a Boeing Delta 2 rocket. The rocket will be lifted up the launch service tower. The Delta 2 is the launch vehicle for the National Oceanic and Atmospheric Administration (NOAA-N) spacecraft.The NOAA-N satellite will be placed into a polar orbit aboard a Boeing Delta 2 rocket. The spacecraft will continue to provide a polar-orbiting platform to support (1) environmental monitoring instruments for imaging and measuring the Earth's atmosphere, its surface, and cloud cover, including Earth radiation, atmospheric ozone, aerosol distribution, sea surface temperature, and vertical temperature and water profiles in the troposphere and stratosphere; (2) measurement of proton and electron flux at orbit altitude; (3) data collection from remote platforms; and (4) the Search and Rescue Satellite-Aided Tracking (SARSAT) system. Additionally, NOAA-N is the fourth in the series of support dedicated microwave instruments for the generation of temperature, moisture, surface, and hydrological products in cloudy regions where visible and infrared (IR) instruments have decreased capability. Launch is currently scheduled for no earlier than May 11, 2005.
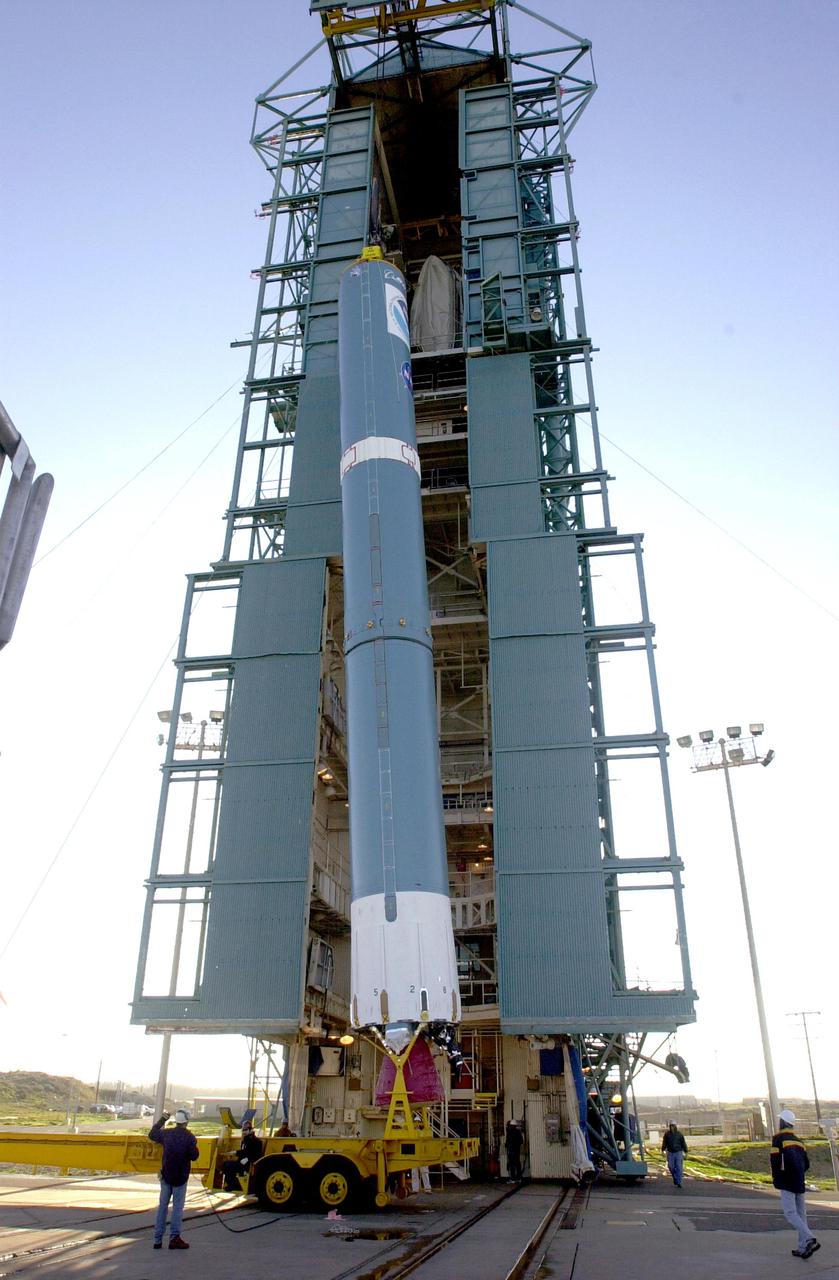
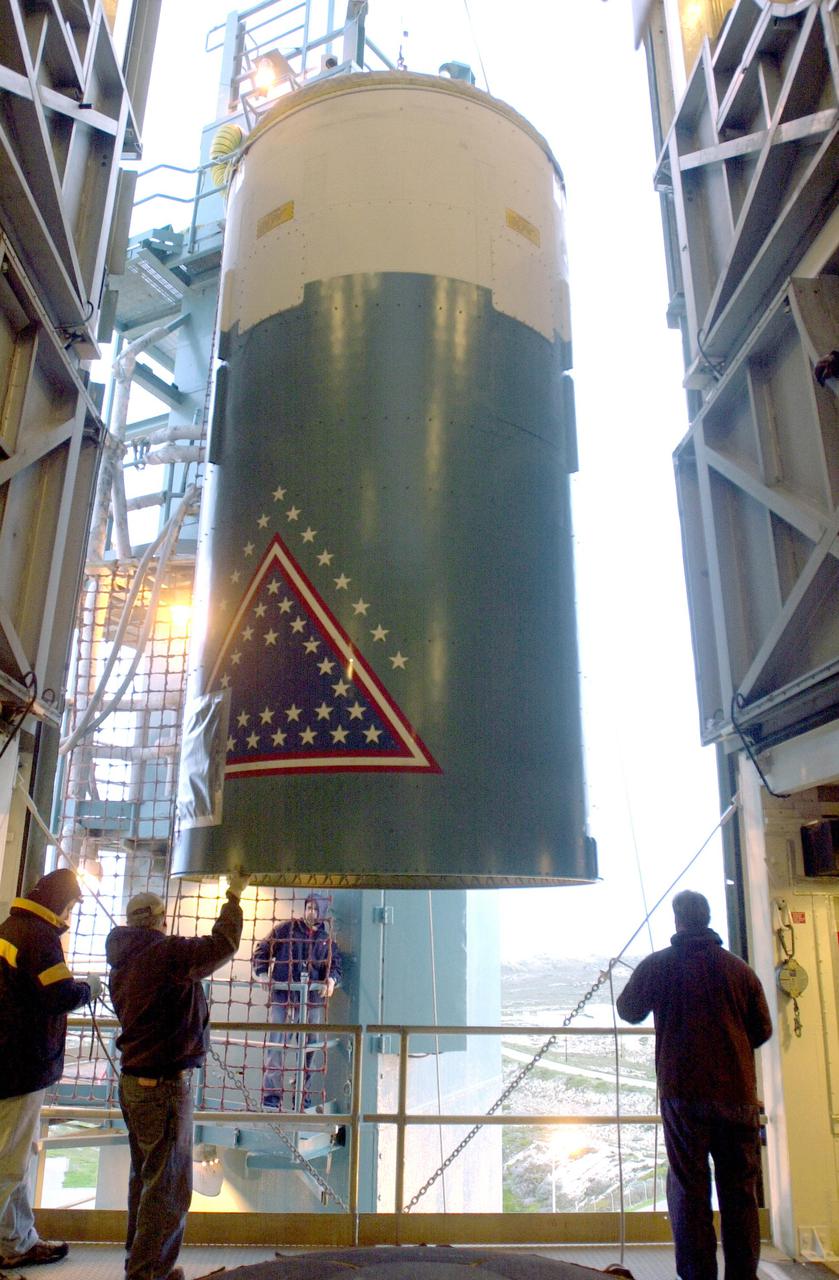
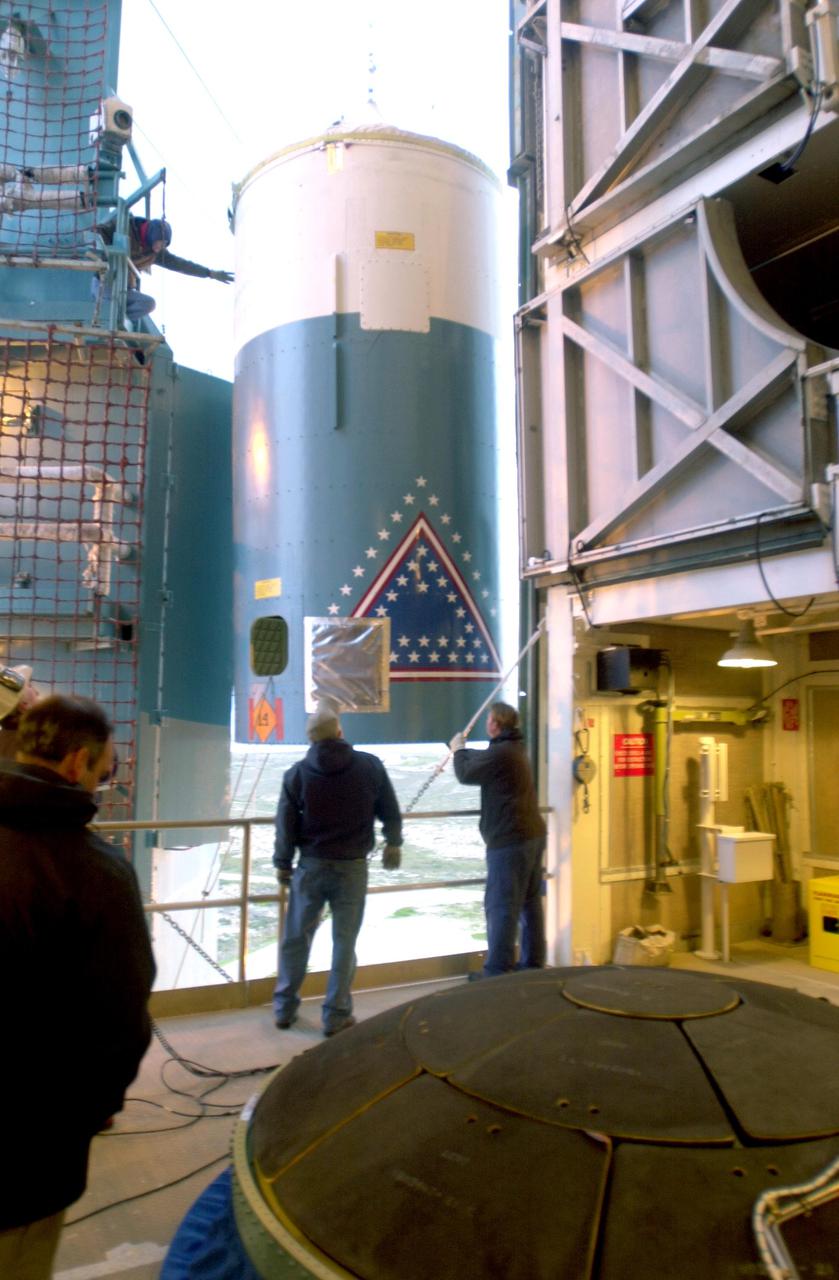
VANDENBERG AIR FORCE BASE, CALIF. - On Space Launch Complex 2 at Vandenberg Air Force Base in California, the first stage of a Boeing Delta 2 rocket has been raised to a vertical position for erection in the launch service tower. The Delta 2 is the launch vehicle for the National Oceanic and Atmospheric Administration (NOAA-N) spacecraft. The NOAA-N satellite will be placed into a polar orbit aboard a Boeing Delta 2 rocket. The spacecraft will continue to provide a polar-orbiting platform to support (1) environmental monitoring instruments for imaging and measuring the Earth's atmosphere, its surface, and cloud cover, including Earth radiation, atmospheric ozone, aerosol distribution, sea surface temperature, and vertical temperature and water profiles in the troposphere and stratosphere; (2) measurement of proton and electron flux at orbit altitude; (3) data collection from remote platforms; and (4) the Search and Rescue Satellite-Aided Tracking (SARSAT) system. Additionally, NOAA-N is the fourth in the series of support dedicated microwave instruments for the generation of temperature, moisture, surface, and hydrological products in cloudy regions where visible and infrared (IR) instruments have decreased capability. Launch is currently scheduled for no earlier than May 11, 2005.
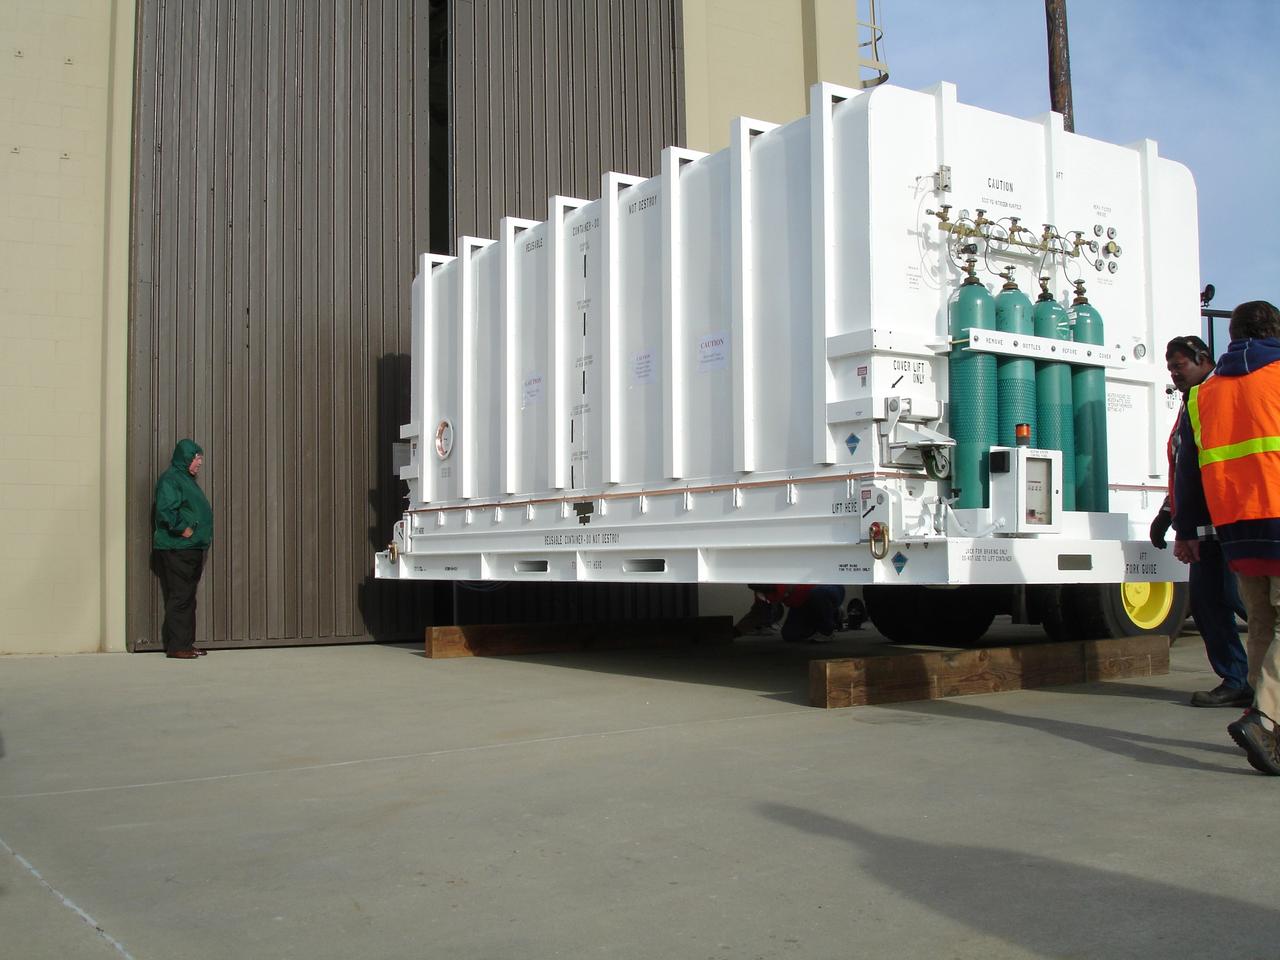
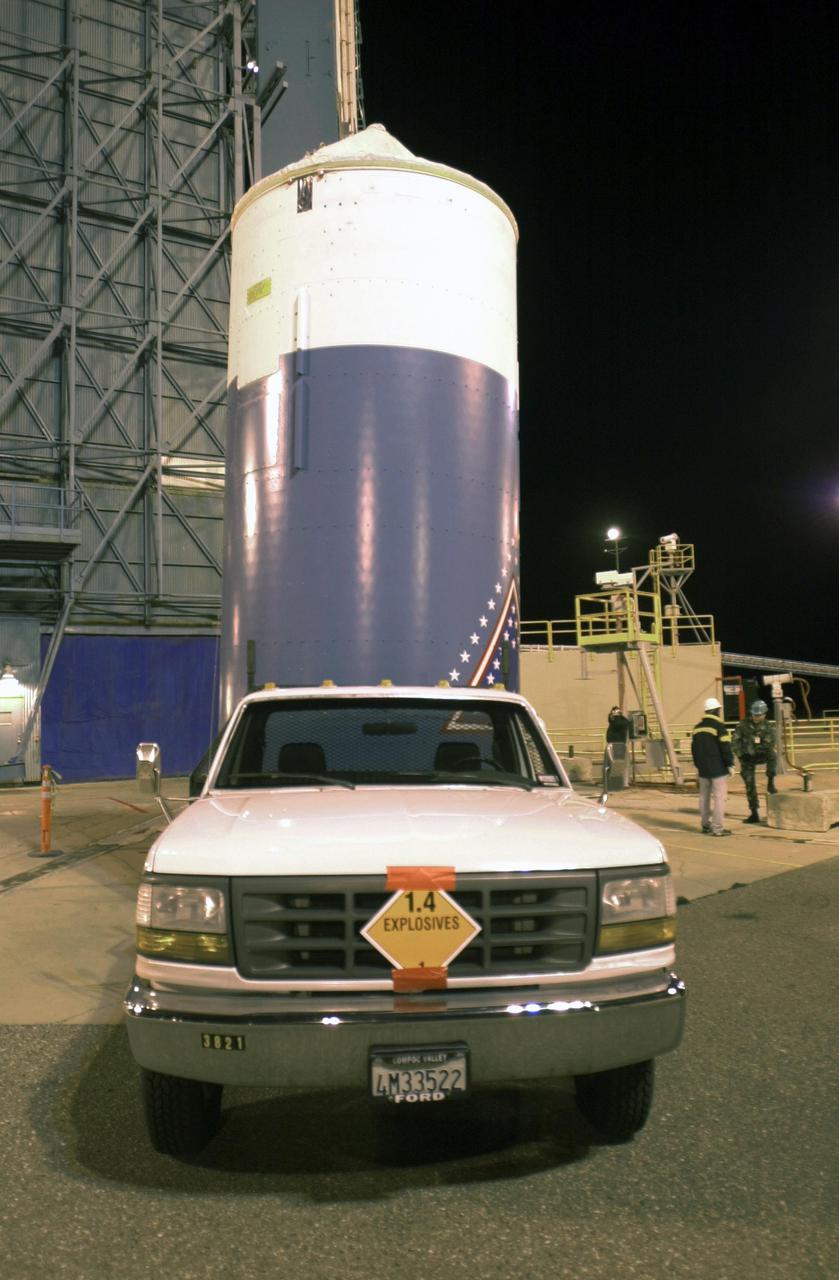
VANDENBERG AIR FORCE BASE, Calif. – The NOAA-N Prime spacecraft is positioned for movement into NASA's Hazardous Processing Facility on Vandenberg Air Force Base in California. NOAA-N Prime was built by Lockheed Martin Space Systems Company for its Advanced Television Infrared Observational Satellites -N series. It is the latest polar-orbiting operational environmental weather satellite developed by NASA for the National Oceanic and Atmospheric Administration. The satellite will provide a platform to support environmental monitoring instruments for imaging and measuring the Earth's atmosphere, its surface and cloud cover, including Earth radiation, atmospheric ozone, aerosol distribution, sea surface temperature and vertical temperature and water profiles in the troposphere and stratosphere. The satellite will assist in measuring proton and electron fluxes at orbit altitude, collecting data from remote platforms to assist the Search and Rescue Satellite-Aided Tracking system. The satellite will be launched from the Western Range at Vandenberg AFB by a United Launch Alliance two-stage Delta II rocket managed by NASA's Launch Service Program at Kennedy. Photo credit: NASA/Jerry Nagy, VAFB
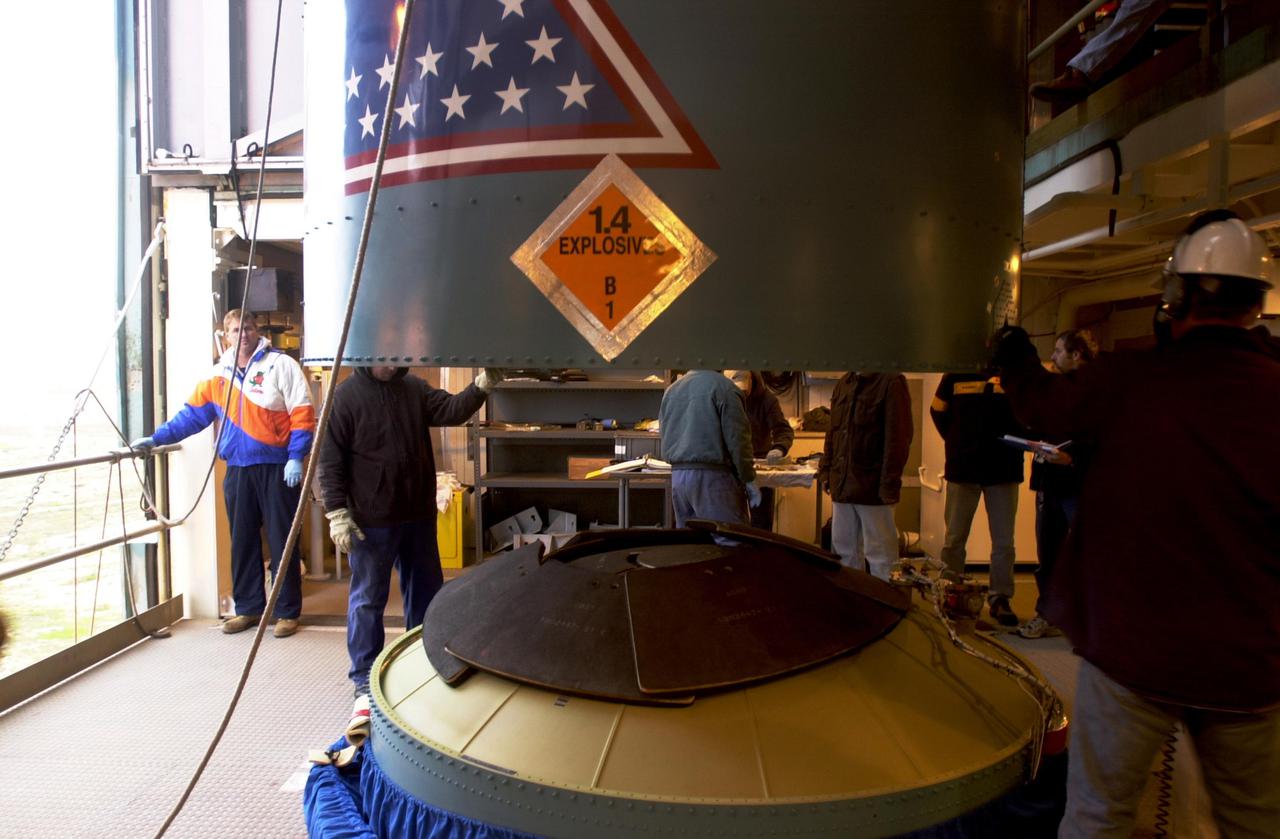
VANDENBERG AIR FORCE BASE, CALIF. - In the launch service tower on Space Launch Complex 2 at Vandenberg Air Force Base in California, the interstage of a Boeing Delta 2 rocket is lowered toward the interstage adapter. The two stages will be mated for launch of the National Oceanic and Atmospheric Administration (NOAA-N) spacecraft. The NOAA-N satellite will be placed into a polar orbit aboard a Boeing Delta 2 rocket. The spacecraft will continue to provide a polar-orbiting platform to support (1) environmental monitoring instruments for imaging and measuring the Earth's atmosphere, its surface, and cloud cover, including Earth radiation, atmospheric ozone, aerosol distribution, sea surface temperature, and vertical temperature and water profiles in the troposphere and stratosphere; (2) measurement of proton and electron flux at orbit altitude; (3) data collection from remote platforms; and (4) the Search and Rescue Satellite-Aided Tracking (SARSAT) system. Additionally, NOAA-N is the fourth in the series of support dedicated microwave instruments for the generation of temperature, moisture, surface, and hydrological products in cloudy regions where visible and infrared (IR) instruments have decreased capability. Launch is currently scheduled for no earlier than May 11, 2005.
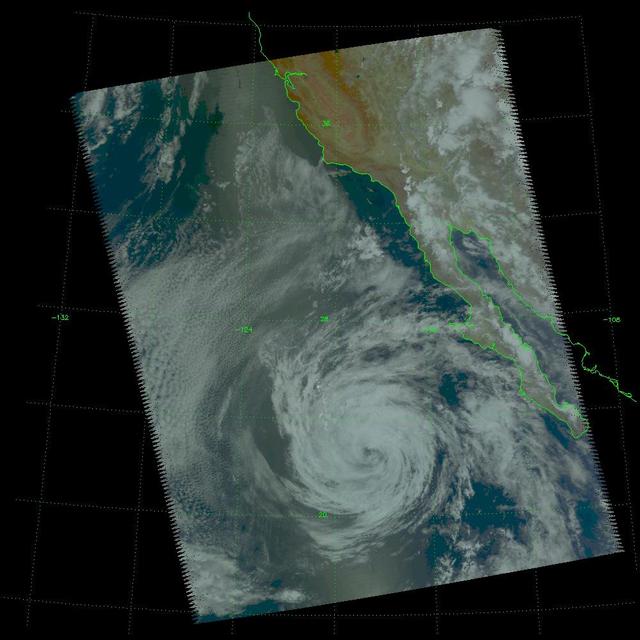
Tropical Storm Blas as observed by the Atmospheric Infrared Sounder AIRS onboard NASA Aqua in the year 2004. The major contribution to radiation (infrared light) that AIRS channels sense comes from different levels in the atmosphere, depending upon the channel wavelength. To create the movie, a set of AIRS channels were selected which probe the atmosphere at progressively deeper levels. If there were no clouds, the color in each frame would be nearly uniform until the Earth's surface is encountered. The tropospheric air temperature warms at a rate of 6 K (about 11 F) for each kilometer of descent toward the surface. Thus the colors would gradually change from cold to warm as the movie progresses. Clouds block the infrared radiation. Thus wherever there are clouds we can penetrate no deeper in infrared. The color remains fixed as the movie progresses, for that area of the image is "stuck" to the cloud top temperature. The coldest temperatures around 220 K (about -65 F) come from altitudes of about 10 miles. http://photojournal.jpl.nasa.gov/catalog/PIA00436
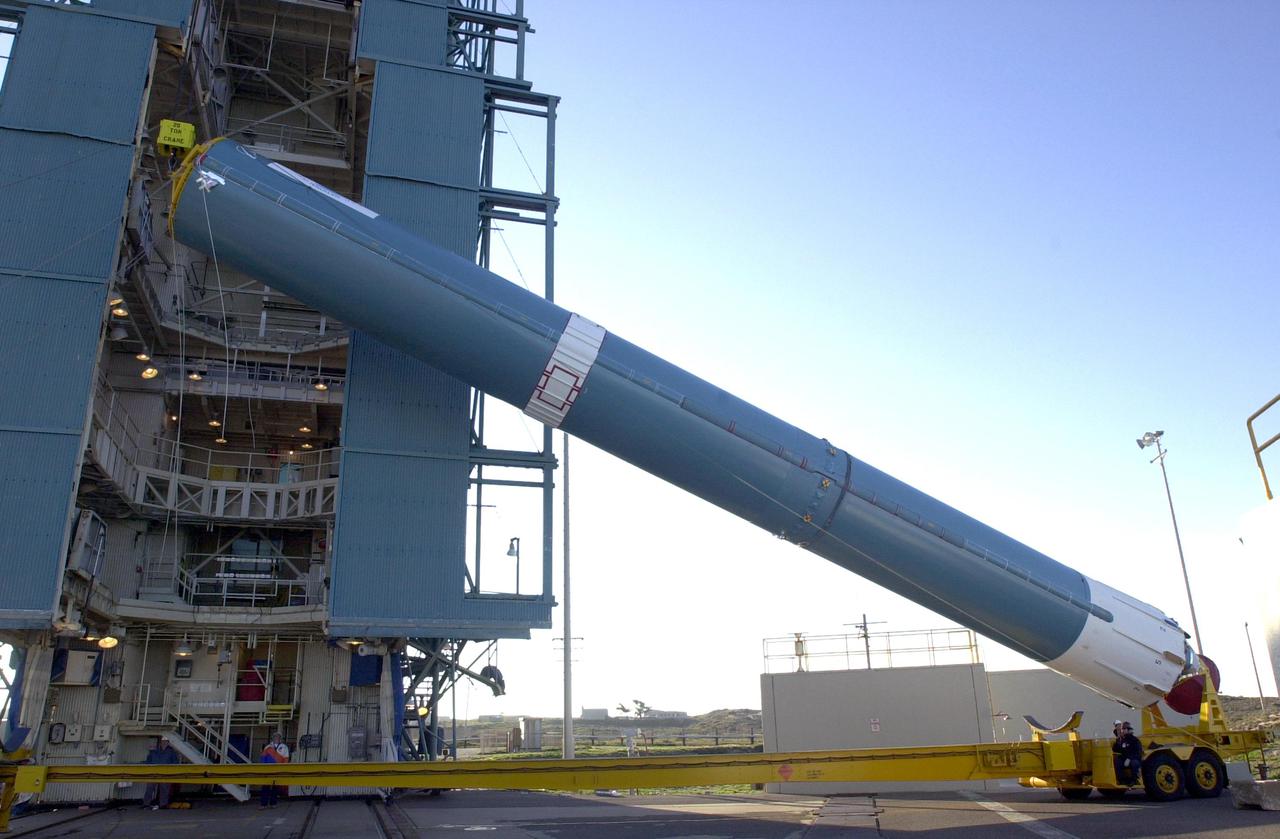
VANDENBERG AIR FORCE BASE, CALIF. - On Space Launch Complex 2 at Vandenberg Air Force Base in California, the first stage of a Boeing Delta 2 rocket is being raised to a vertical position for erection in the launch service tower. The Delta 2 is the launch vehicle for the National Oceanic and Atmospheric Administration (NOAA-N) spacecraft. The NOAA-N satellite will be placed into a polar orbit aboard a Boeing Delta 2 rocket. The spacecraft will continue to provide a polar-orbiting platform to support (1) environmental monitoring instruments for imaging and measuring the Earth's atmosphere, its surface, and cloud cover, including Earth radiation, atmospheric ozone, aerosol distribution, sea surface temperature, and vertical temperature and water profiles in the troposphere and stratosphere; (2) measurement of proton and electron flux at orbit altitude; (3) data collection from remote platforms; and (4) the Search and Rescue Satellite-Aided Tracking (SARSAT) system. Additionally, NOAA-N is the fourth in the series of support dedicated microwave instruments for the generation of temperature, moisture, surface, and hydrological products in cloudy regions where visible and infrared (IR) instruments have decreased capability. Launch is currently scheduled for no earlier than May 11, 2005.
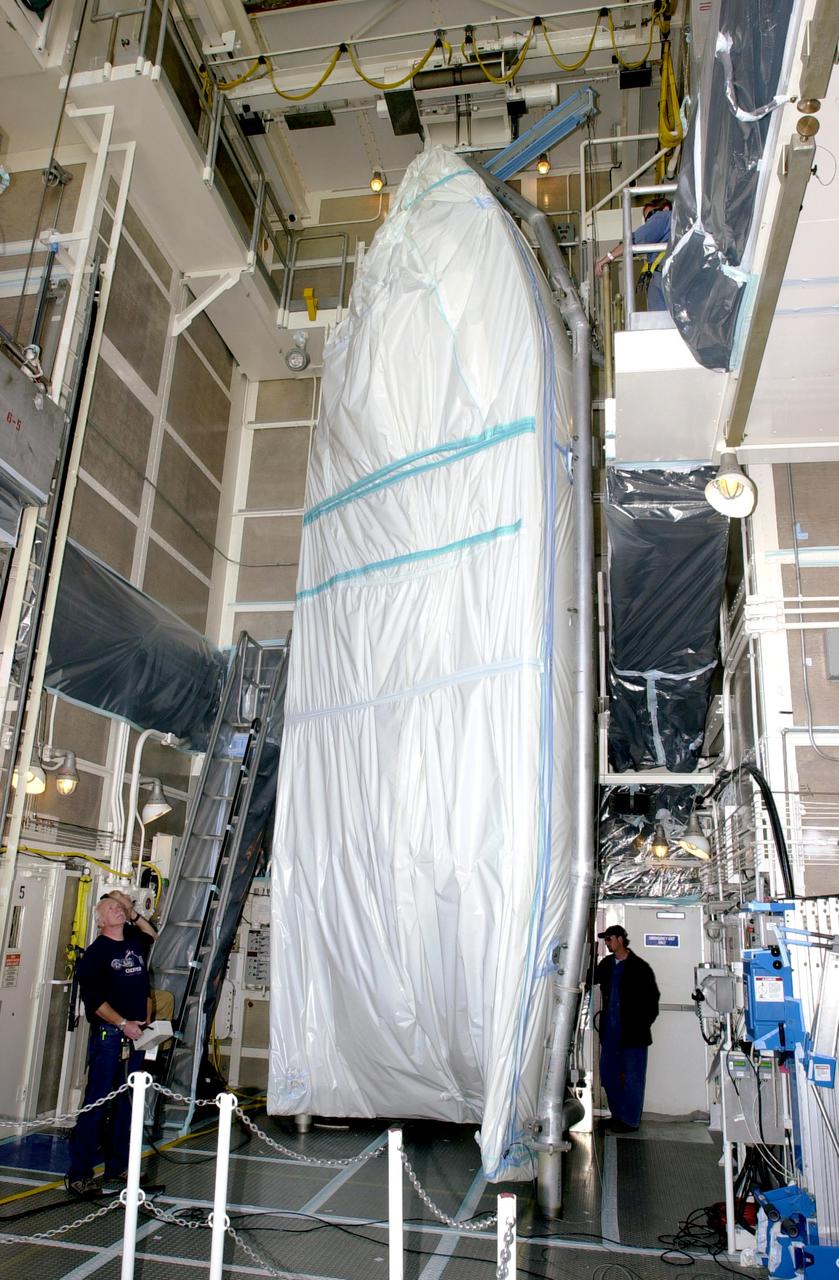
VANDENBERG AIR FORCE BASE, CALIF. - One-half of the fairing for the National Oceanic and Atmospheric Administration (NOAA-N) spacecraft is inside the launch service tower on Space Launch Complex 2 at Vandenberg Air Force Base in California. The NOAA-N satellite will be placed into a polar orbit aboard a Boeing Delta 2 rocket. The spacecraft will continue to provide a polar-orbiting platform to support (1) environmental monitoring instruments for imaging and measuring the Earth's atmosphere, its surface, and cloud cover, including Earth radiation, atmospheric ozone, aerosol distribution, sea surface temperature, and vertical temperature and water profiles in the troposphere and stratosphere; (2) measurement of proton and electron flux at orbit altitude; (3) data collection from remote platforms; and (4) the Search and Rescue Satellite-Aided Tracking (SARSAT) system. Additionally, NOAA-N is the fourth in the series of support dedicated microwave instruments for the generation of temperature, moisture, surface, and hydrological products in cloudy regions where visible and infrared (IR) instruments have decreased capability. Launch is currently scheduled for no earlier than May 11, 2005.
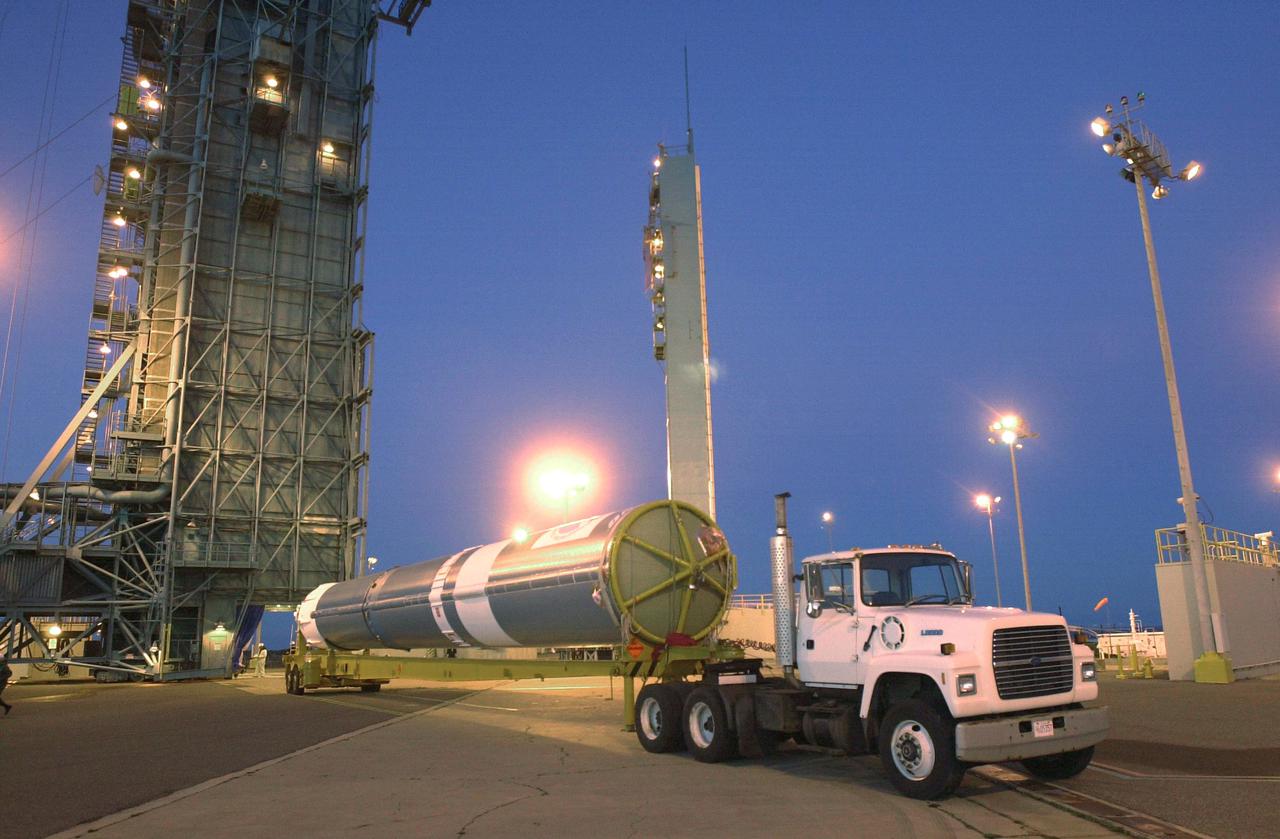
VANDENBERG AIR FORCE BASE, CALIF. - The first stage of a Boeing Delta 2 rocket arrives at Space Launch Complex 2 at Vandenberg Air Force Base in California. The Delta 2 is the launch vehicle for the National Oceanic and Atmospheric Administration (NOAA-N) spacecraft. The NOAA-N satellite will be placed into a polar orbit aboard a Boeing Delta 2 rocket. The spacecraft will continue to provide a polar-orbiting platform to support (1) environmental monitoring instruments for imaging and measuring the Earth's atmosphere, its surface, and cloud cover, including Earth radiation, atmospheric ozone, aerosol distribution, sea surface temperature, and vertical temperature and water profiles in the troposphere and stratosphere; (2) measurement of proton and electron flux at orbit altitude; (3) data collection from remote platforms; and (4) the Search and Rescue Satellite-Aided Tracking (SARSAT) system. Additionally, NOAA-N is the fourth in the series of support dedicated microwave instruments for the generation of temperature, moisture, surface, and hydrological products in cloudy regions where visible and infrared (IR) instruments have decreased capability. Launch is currently scheduled for no earlier than May 11, 2005.
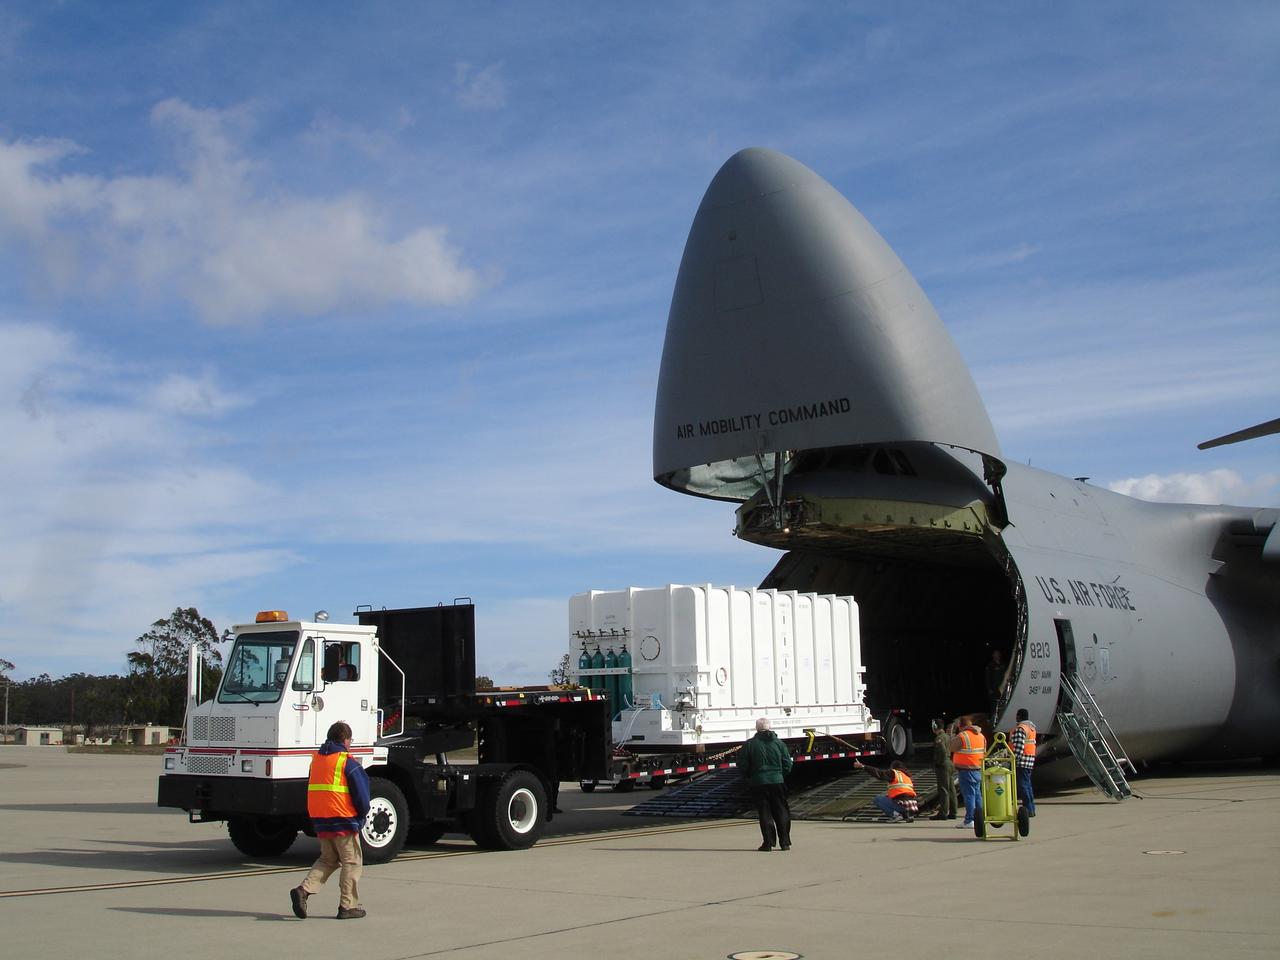
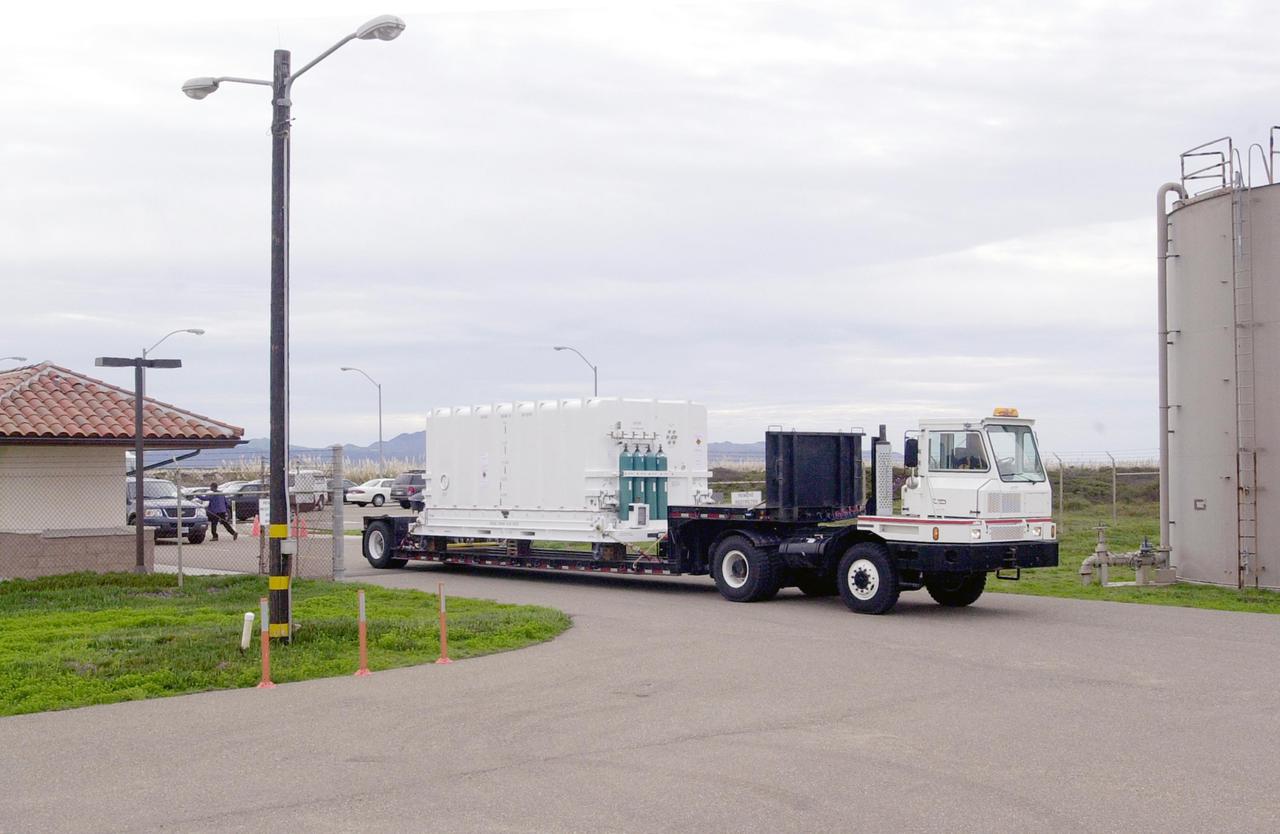
VANDENBERG AIR FORCE BASE, Calif. – The NOAA-N Prime spacecraft is offloaded from a C-5 aircraft after arrival at Vandenberg Air Force Base Airfield in California. NOAA-N Prime was built by Lockheed Martin Space Systems Company for its Advanced Television Infrared Observational Satellites -N series. It is the latest polar-orbiting operational environmental weather satellite developed by NASA for the National Oceanic and Atmospheric Administration. The satellite will provide a platform to support environmental monitoring instruments for imaging and measuring the Earth's atmosphere, its surface and cloud cover, including Earth radiation, atmospheric ozone, aerosol distribution, sea surface temperature and vertical temperature and water profiles in the troposphere and stratosphere. The satellite will assist in measuring proton and electron fluxes at orbit altitude, collecting data from remote platforms to assist the Search and Rescue Satellite-Aided Tracking system. The satellite will be launched from the Western Range at Vandenberg AFB by a United Launch Alliance two-stage Delta II rocket managed by NASA's Launch Service Program at Kennedy. Photo credit: NASA/Jerry Nagy, VAFB
VANDENBERG AIR FORCE BASE, CALIF. - At an upper level of the launch service tower on Space Launch Complex 2 at Vandenberg Air Force Base in California, workers help guide the interstage of a Boeing Delta 2 rocket inside. It will be mated with the first stage in the launch service tower for launch of the National Oceanic and Atmospheric Administration (NOAA-N) spacecraft. The NOAA-N satellite will be placed into a polar orbit aboard a Boeing Delta 2 rocket. The spacecraft will continue to provide a polar-orbiting platform to support (1) environmental monitoring instruments for imaging and measuring the Earth's atmosphere, its surface, and cloud cover, including Earth radiation, atmospheric ozone, aerosol distribution, sea surface temperature, and vertical temperature and water profiles in the troposphere and stratosphere; (2) measurement of proton and electron flux at orbit altitude; (3) data collection from remote platforms; and (4) the Search and Rescue Satellite-Aided Tracking (SARSAT) system. Additionally, NOAA-N is the fourth in the series of support dedicated microwave instruments for the generation of temperature, moisture, surface, and hydrological products in cloudy regions where visible and infrared (IR) instruments have decreased capability. Launch is currently scheduled for no earlier than May 11, 2005.
VANDENBERG AIR FORCE BASE, CALIF. - The interstage of a Boeing Delta 2 rocket is lifted to an upper level on the launch service tower on Space Launch Complex 2 at Vandenberg Air Force Base in California. It will be mated with the first stage in the launch service tower. In the foreground is the interstage adapter. The Delta 2 is the launch vehicle for the National Oceanic and Atmospheric Administration (NOAA-N) spacecraft. The NOAA-N satellite will be placed into a polar orbit aboard a Boeing Delta 2 rocket. The spacecraft will continue to provide a polar-orbiting platform to support (1) environmental monitoring instruments for imaging and measuring the Earth's atmosphere, its surface, and cloud cover, including Earth radiation, atmospheric ozone, aerosol distribution, sea surface temperature, and vertical temperature and water profiles in the troposphere and stratosphere; (2) measurement of proton and electron flux at orbit altitude; (3) data collection from remote platforms; and (4) the Search and Rescue Satellite-Aided Tracking (SARSAT) system. Additionally, NOAA-N is the fourth in the series of support dedicated microwave instruments for the generation of temperature, moisture, surface, and hydrological products in cloudy regions where visible and infrared (IR) instruments have decreased capability. Launch is currently scheduled for no earlier than May 11, 2005.