
Bizarre Sounds of Saturn Radio Emissions
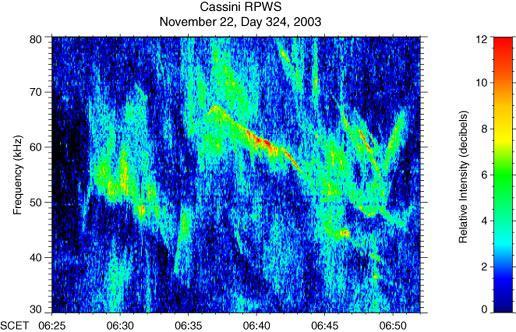
Eerie Sounds of Saturn Radio Emissions
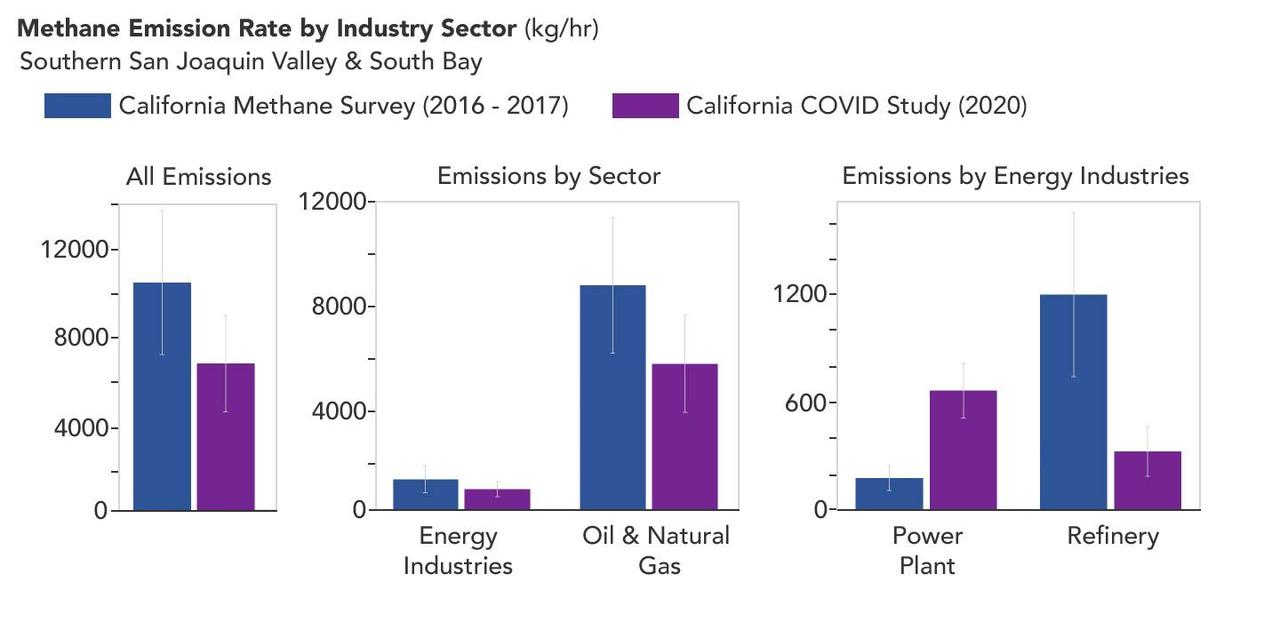
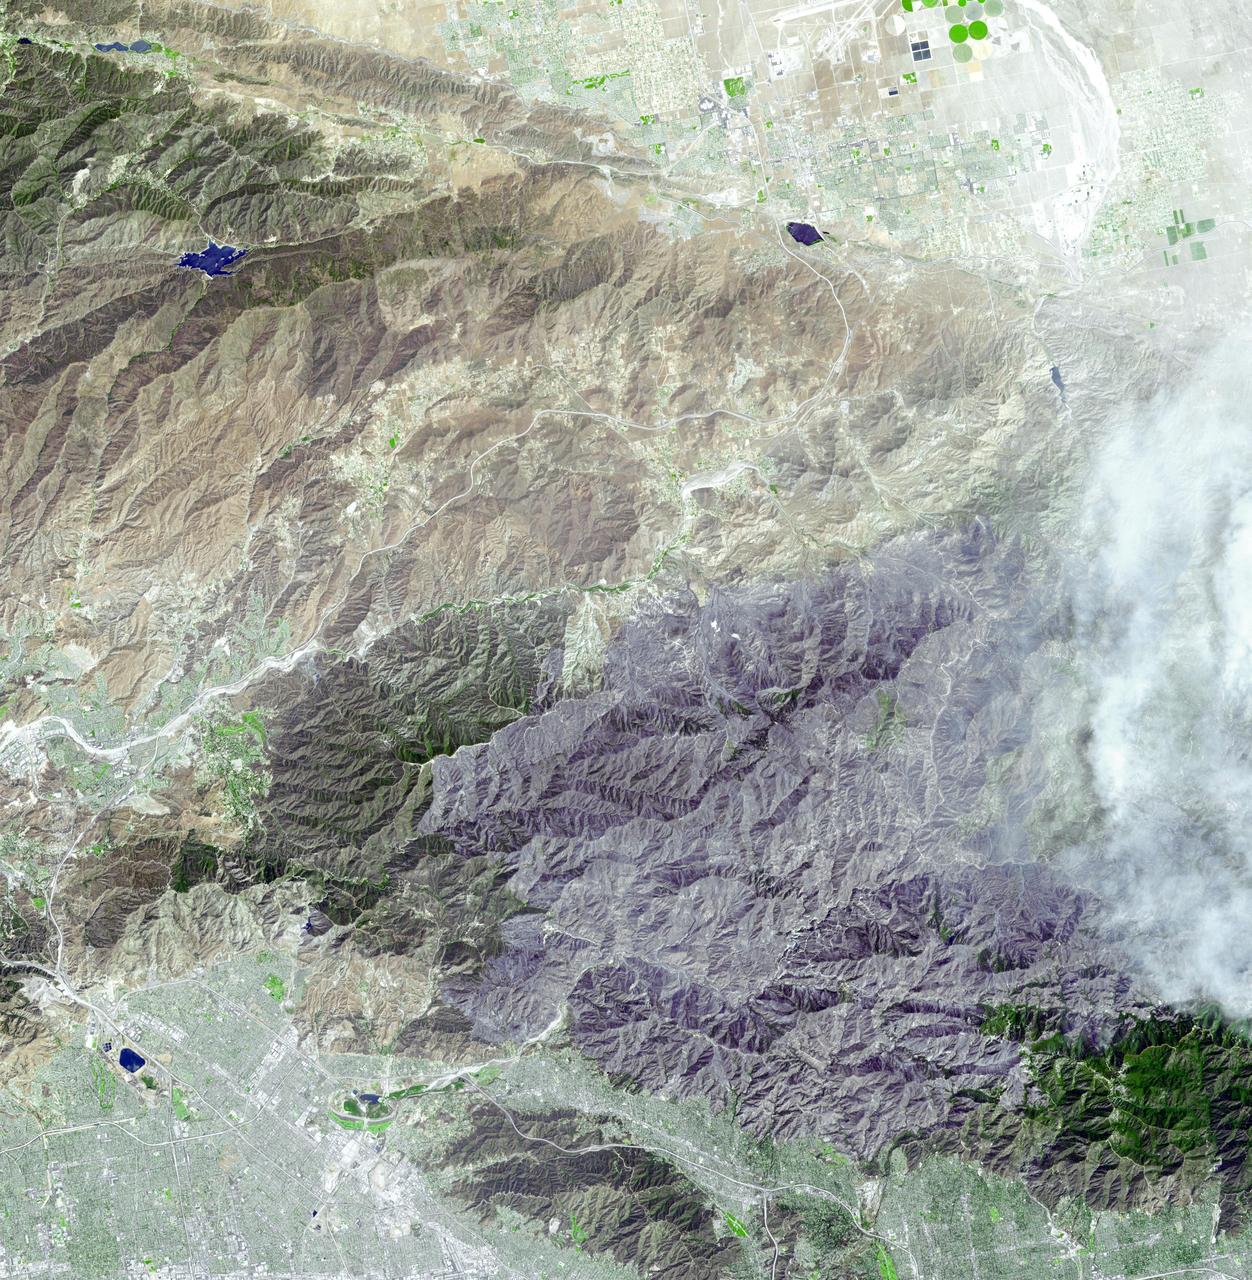
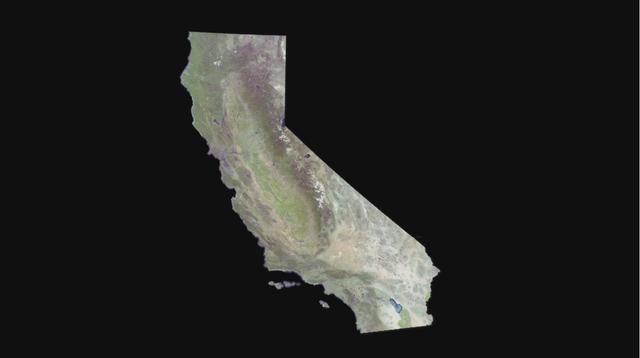
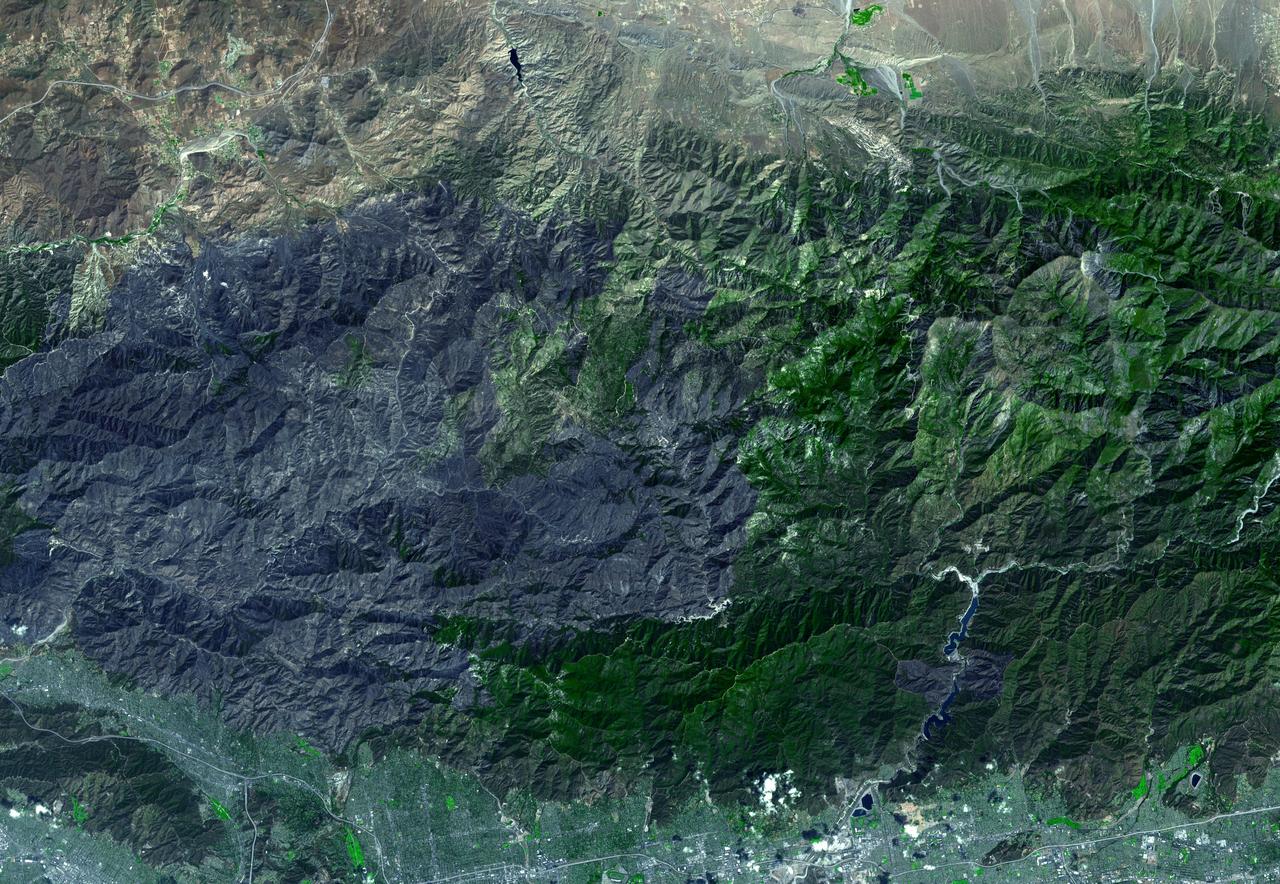
A March 2023 study by researchers at NASA's Jet Propulsion Laboratory in Southern California compared emissions from a belt of oil refineries across the South Bay area of Los Angeles during the first summer of the COVID-19 pandemic to those observed three years earlier. Using data from a NASA airborne instrument, researchers saw that most of the facilities they identified as methane sources in 2016-17 were no longer emitting the greenhouse gas in 2020, leading to a 73% reduction in measured emissions. The study uses measurements made by an imaging spectrometer called AVIRIS-NG (Airborne Visible/Infrared Imaging Spectrometer-Next Generation). Attached to the bottom of an aircraft, the instrument can detect greenhouse gas emissions from individual facilities or even pieces of equipment by looking at how the gases absorb sunlight. In 2016 and 2017, AVIRIS-NG was flown over 22,000 square miles (57,000 square kilometers) of the state as part of the California Methane Survey. From July to September 2020, researchers retraced some of those flight paths over refineries and power plants in Los Angeles County and over oil fields in central California's San Joaquin Valley. The flights were funded by NASA's Earth Science Division, the California Air Resources Board, and the California Energy Commission. The 2020 surveys over Los Angeles identified only 11 plumes from five refinery sources, with a total emissions rate of about 712 pounds (323 kilograms) methane per hour. The 2016 and 2017 flights had found 48 plumes from 33 sources, with a total emissions rate of roughly 2,639 pounds (1,197 kilograms) methane per hour. The drop correlates with an 18% decrease in monthly production in Southern California refineries between the two flight campaigns, the scientists noted, citing data from the California Energy Commission. The study also found that emissions from oil fields in and around the city of Bakersfield in central California fell 34.2%, correlating with a 24.2% drop in oil production. Reduced production during the pandemic due to lower demand for fuel and lower gas prices could have led to the drop in methane emissions, as oil fields and refineries emitted less methane as part of operations. However, researchers said, improved equipment maintenance and mitigation efforts at those facilities between 2016 and 2020 can't be ruled out as a factor. https://photojournal.jpl.nasa.gov/catalog/PIA25864
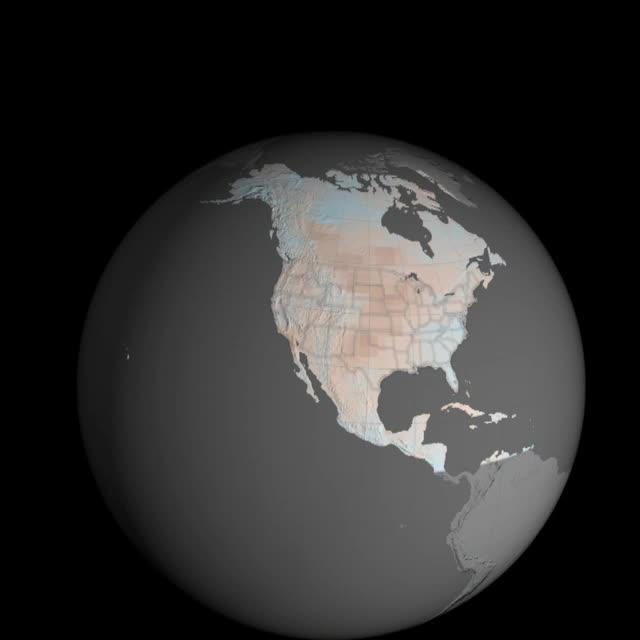
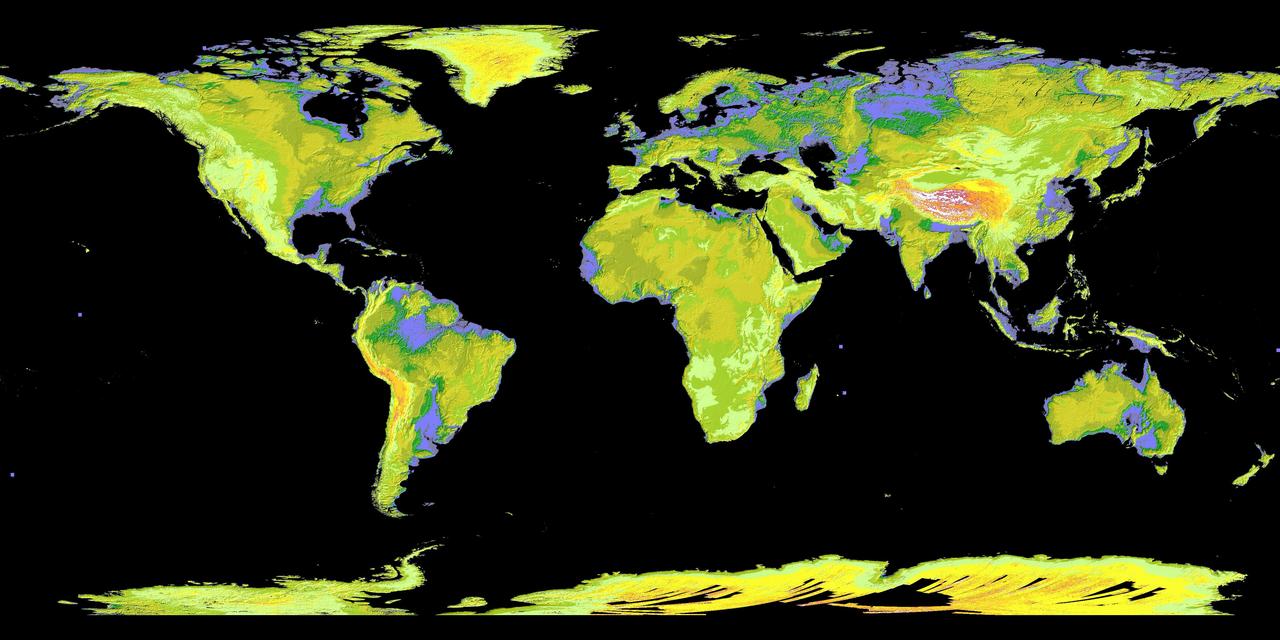
Droughts in the U.S. Southwest and Central Plains at the end of this century could be drier and longer compared to drought conditions seen in those regions in the last 1,000 years, according to a new NASA study. The study, published Feb 12 in the journal Science Advances, is based on projections from several climate models, including one sponsored by NASA. The research found the risk of severe droughts in those regions would increase if human-produced greenhouse gas emissions continue to increase. "Natural droughts like the 1930s Dust Bowl and the current drought in the Southwest have historically lasted maybe a decade or a little less," said Ben Cook, climate scientist at NASA's Goddard Institute for Space Studies and the Lamont-Doherty Earth Observatory at Columbia University in New York City, and lead author of the study. "What these results are saying is we're going to get a drought similar to those events, but it is probably going to last at least 30 to 35 years." Read more:http://bit.ly/nasa-megadroughts Credit: NASA’s Goddard Space Flight Center <b><a href="http://www.nasa.gov/audience/formedia/features/MP_Photo_Guidelines.html" rel="nofollow">NASA image use policy.</a></b> <b><a href="http://www.nasa.gov/centers/goddard/home/index.html" rel="nofollow">NASA Goddard Space Flight Center</a></b> enables NASA’s mission through four scientific endeavors: Earth Science, Heliophysics, Solar System Exploration, and Astrophysics. Goddard plays a leading role in NASA’s accomplishments by contributing compelling scientific knowledge to advance the Agency’s mission. <b>Follow us on <a href="http://twitter.com/NASAGoddardPix" rel="nofollow">Twitter</a></b> <b>Like us on <a href="http://www.facebook.com/pages/Greenbelt-MD/NASA-Goddard/395013845897?ref=tsd" rel="nofollow">Facebook</a></b> <b>Find us on <a href="http://instagram.com/nasagoddard?vm=grid" rel="nofollow">Instagram</a></b>
New Views of Mars from the Thermal Emission Spectrometer Instrument
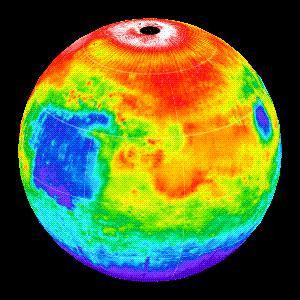
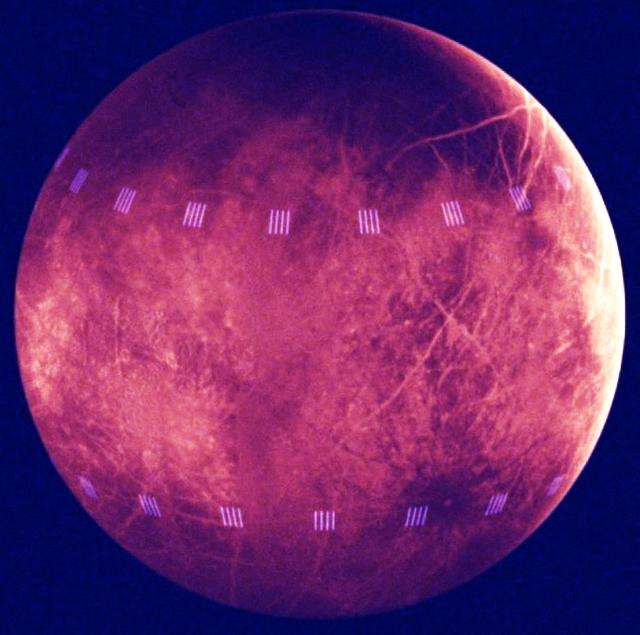
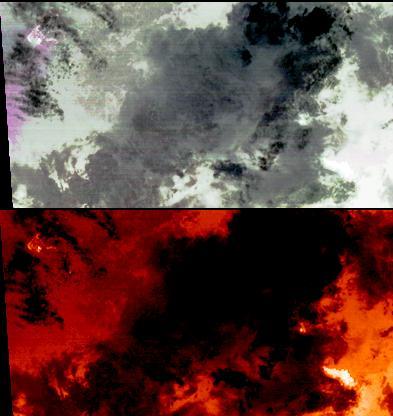
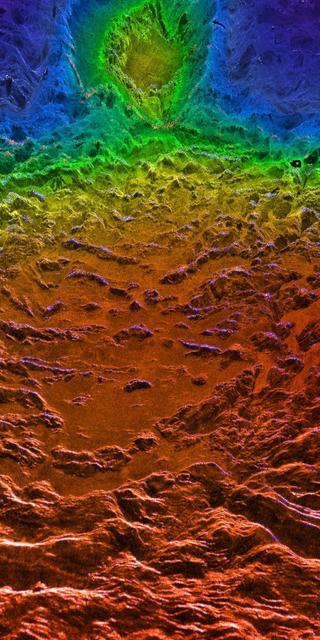
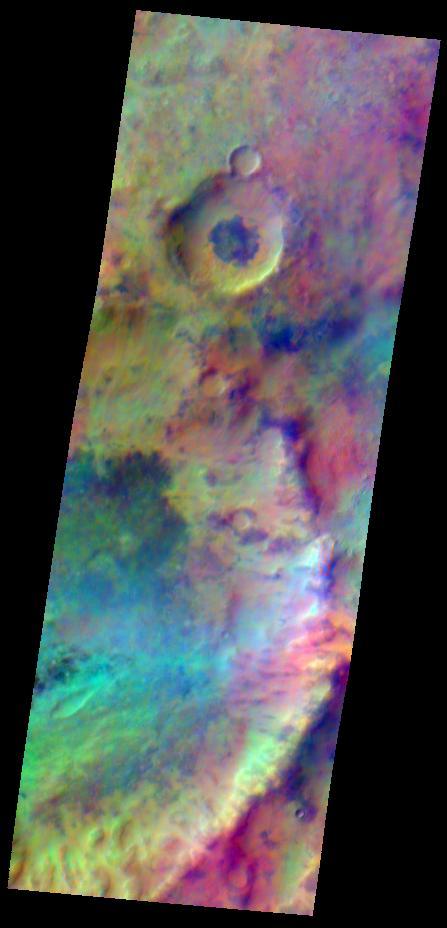
Martian Temperatures Measured by the Thermal Emission Spectrometer TES. Isidis Planitia View
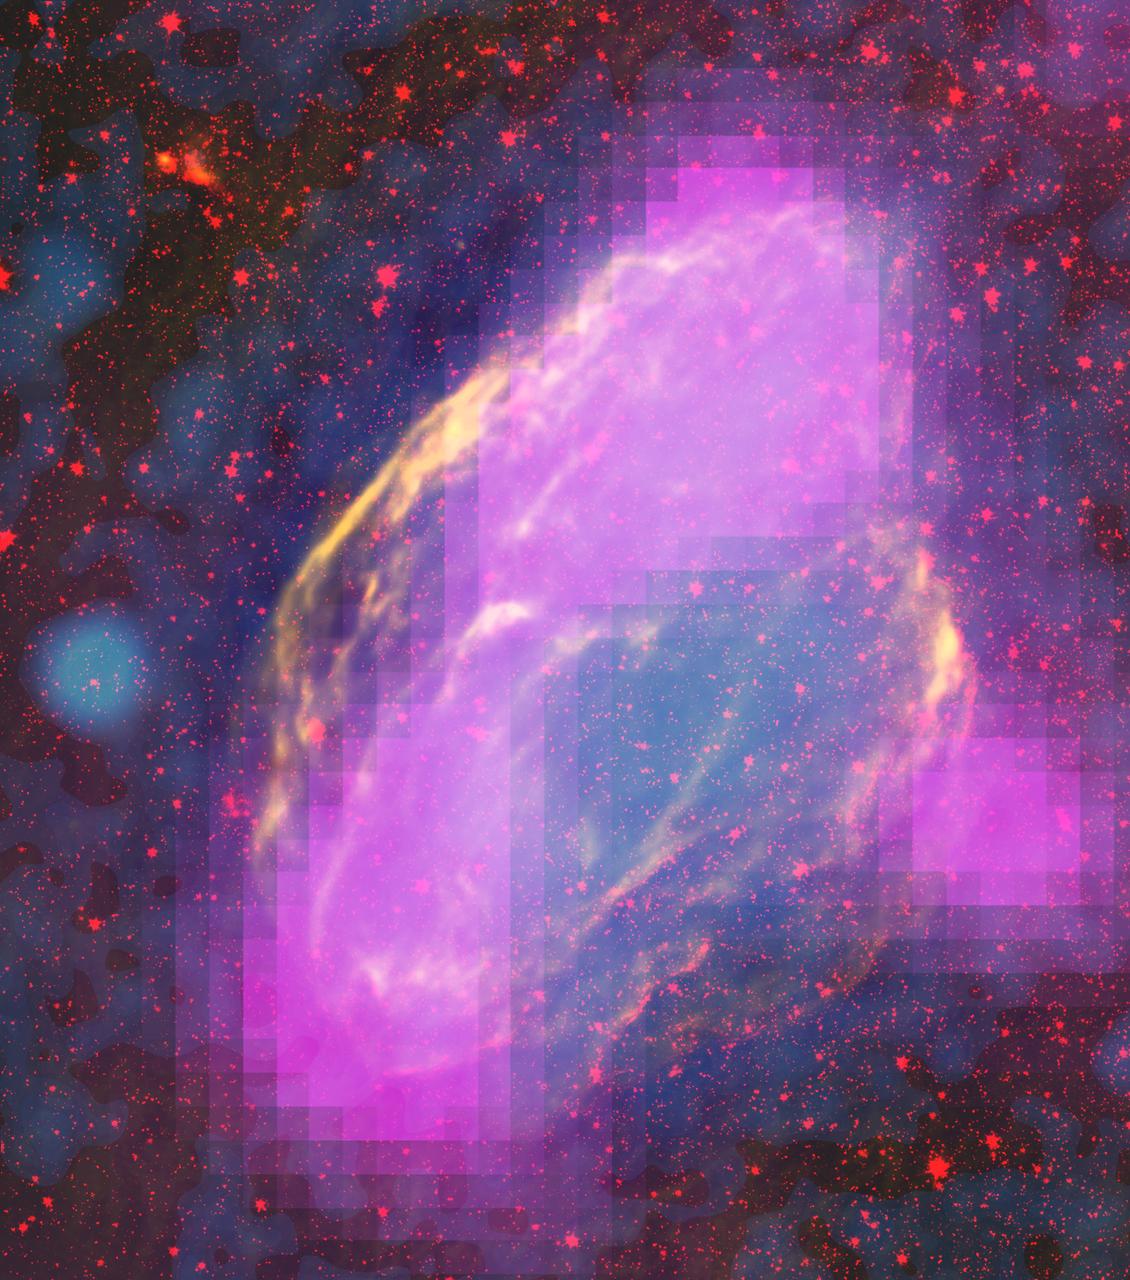
NASA's Fermi Closes on Source of Cosmic Rays New images from NASA's Fermi Gamma-ray Space Telescope show where supernova remnants emit radiation a billion times more energetic than visible light. The images bring astronomers a step closer to understanding the source of some of the universe's most energetic particles -- cosmic rays. Fermi mapped GeV-gamma-ray emission regions (magenta) in the W44 supernova remnant. The features clearly align with filaments detectable in other wavelengths. This composite merges X-rays (blue) from the Germany-led ROSAT mission, infrared (red) from NASA's Spitzer Space Telescope, and radio (orange) from the Very Large Array near Socorro, N.M. Credit: NASA/DOE/Fermi LAT Collaboration, ROSAT, JPL-Caltech, and NRAO/AUI For more information: <a href="http://www.nasa.gov/mission_pages/GLAST/news/cosmic-rays-source.html" rel="nofollow">www.nasa.gov/mission_pages/GLAST/news/cosmic-rays-source....</a>
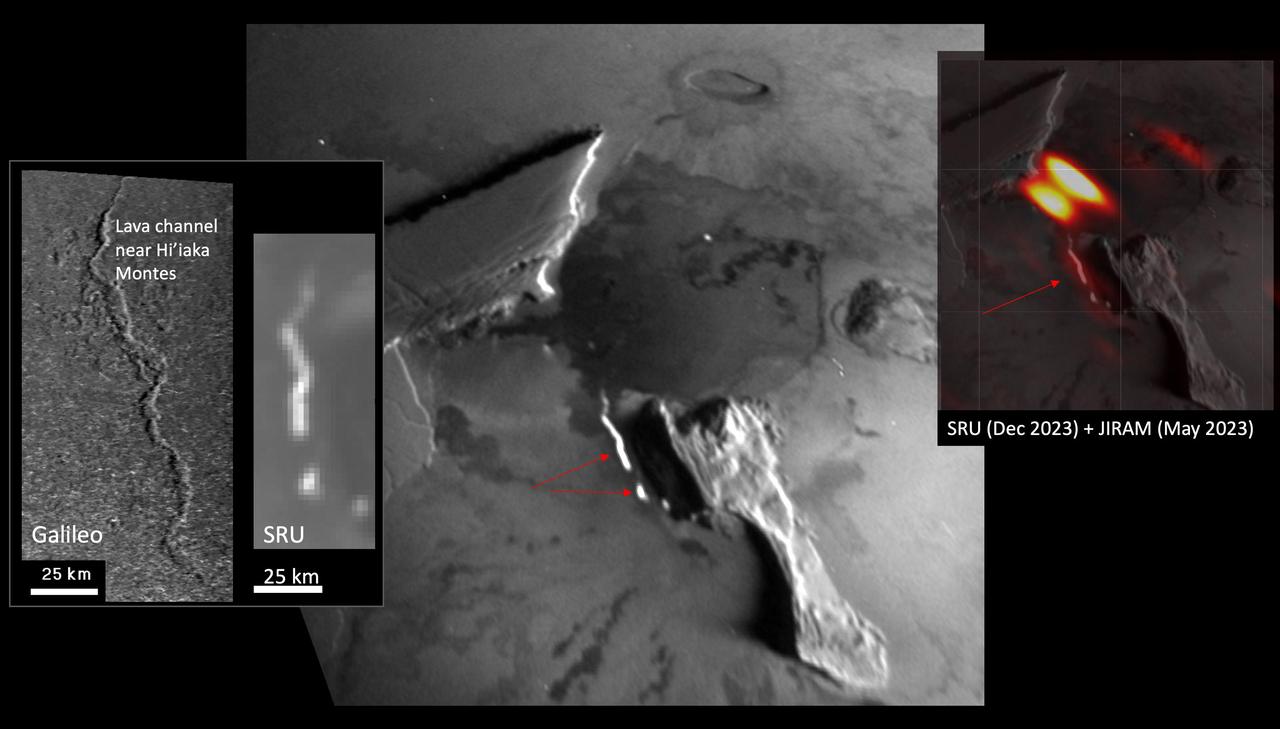
The Stellar Reference Unit (SRU) on NASA's Juno spacecraft made this first-of-a-kind observation on Dec. 30, 2023, of an elongated, 40-mile-long (65-kilometer-long), curvy thermal emission feature and a shorter linear emission segment to the west of South Zal Mons. The resolution is 0.6 miles (1 kilometer) per pixel. The feature is suspected to be an active lava channel, given the similarity of its morphology to that of the two previously identified lava channels on Io. The shape of the Ionian lava channel near Hi'iaka Montes is compared to the SRU emission feature in the left panel. Juno's infrared camera, JIRAM, observed a long thermal emission "hot spot" at lower resolution (19 miles, or 30 kilometers, per pixel) in May 2023 at the same location (JIRAM infrared data is overlaid on the SRU image in the right panel, illustrating the overlap). https://photojournal.jpl.nasa.gov/catalog/PIA26523
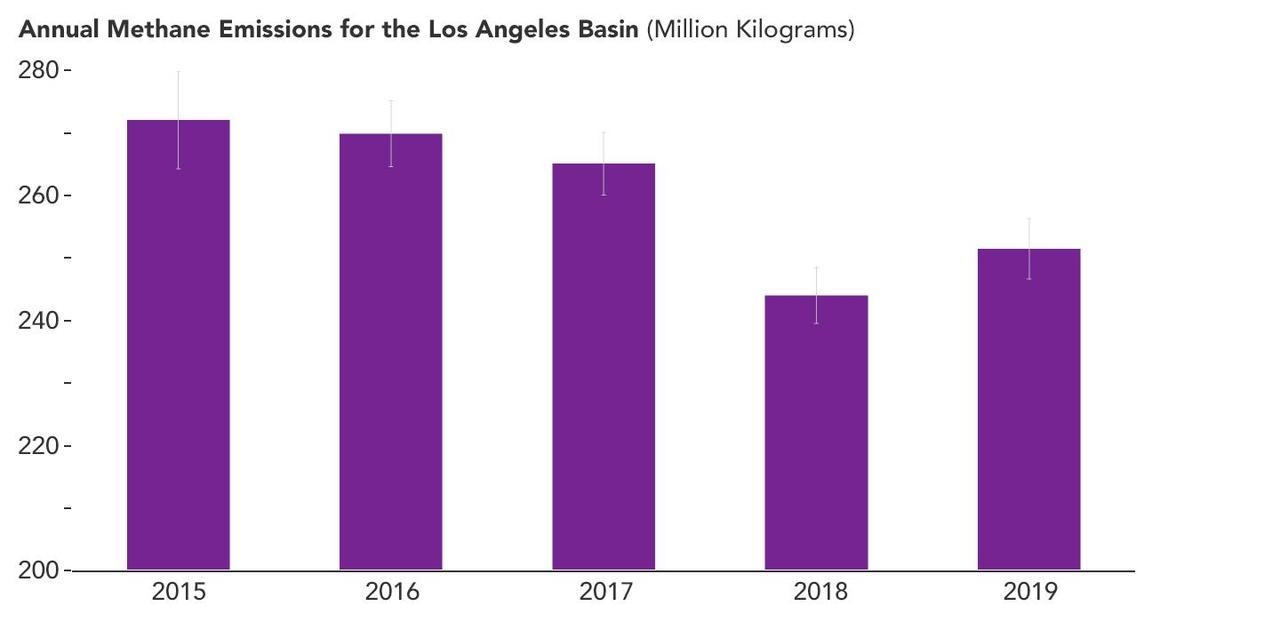
A February 2023 study by researchers at NASA's Jet Propulsion Laboratory in Southern California analyzed data on atmospheric methane concentrations from ground-based sensors scattered around four densely populated Southern California counties. It found that emissions of the powerful greenhouse gas methane fell by about 7% between 2015 and 2020 – a reduction of 33 million pounds (15 million kilograms) of methane released per year. This bar graph shows that overall emissions in the study area decreased between 2015 and 2019, the last full year of the data for the study. Error bars indicate uncertainties in the estimates for each year. Published in Environmental Research Letters, the paper is based on measurements from eight spectroscopic sensors that were installed as part of the Megacities Carbon Project, a multiagency collaboration monitoring greenhouse gases in the Los Angeles, Indianapolis, and Washington, D.C., areas. The sensors have been gathering data since 2015. The California data enabled researchers to study an area that stretches from the beaches of Malibu in the west to the mountains and deserts of San Bernardino and Riverside counties in the east. It also extends south through all of Orange County. The researchers found that the month-to-month fluctuations in methane concentrations around Los Angeles gradually fell from 2015 to 2020, and well into 2022 – a strong indication that local emissions of the gas were also decreasing. Then, using a mathematical model to estimate the emissions decrease, they found the areas covered by sensors in Granada Hills (Los Angeles County) and Ontario (San Bernardino County) accounted for much of the drop in annual emissions from 2015 to 2020. Although the paper doesn't cite causes of the emission reductions in those two locales, researchers suspect they resulted from better management of natural gas pipelines and equipment, which in turn led to lower fugitive – or accidental – methane releases. Improved infrastructure at a massive landfill near Granada Hills likely also played a role. https://photojournal.jpl.nasa.gov/catalog/PIA25863
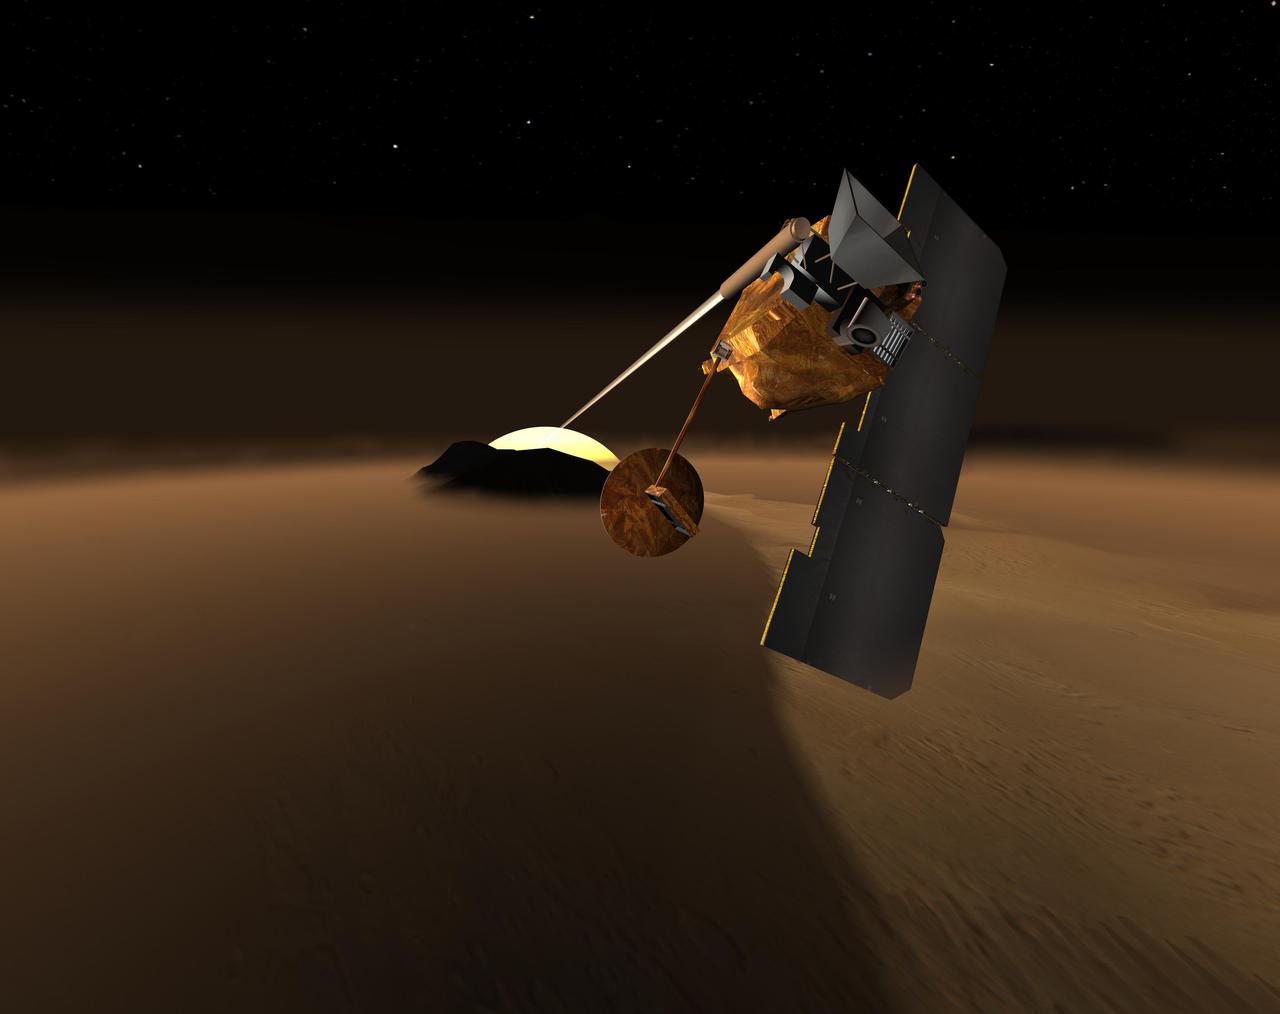
This artist rendition depicts a concept for NASA Mars orbiter that would scrutinize the martian atmosphere for chemical traces of life or environments supportive of life that might be present anywhere on the planet.
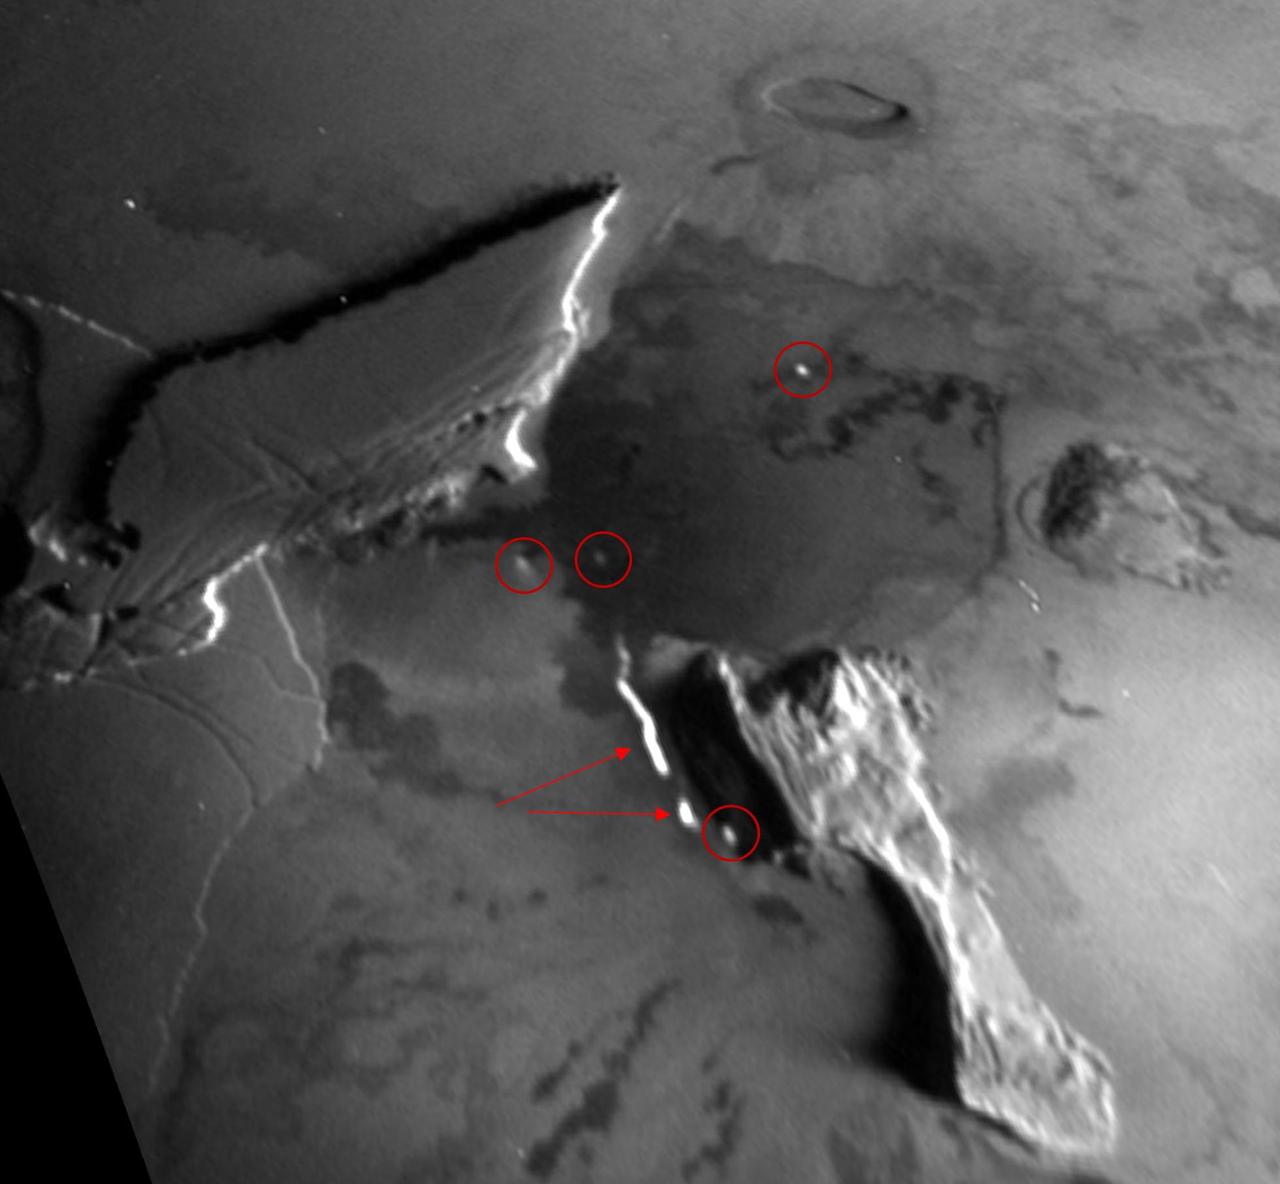
Red circles and arrows point to glowing thermal emission from active lava breakouts observed by the Stellar Reference Unit (SRU) on NASA's Juno spacecraft on Dec. 30, 2023, in the Zal Montes-Patera complex on Io. https://photojournal.jpl.nasa.gov/catalog/PIA26521
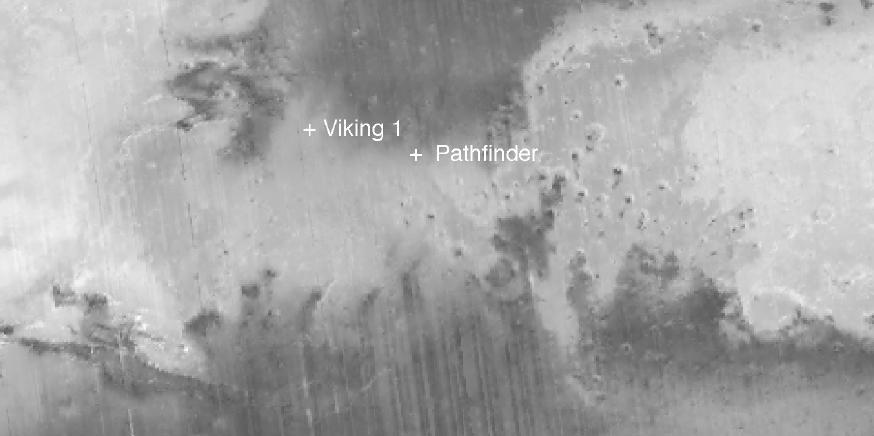
Martian Temperatures Measured by the Thermal Emission Spectrometer TES. Pathfinder Landing Aite View
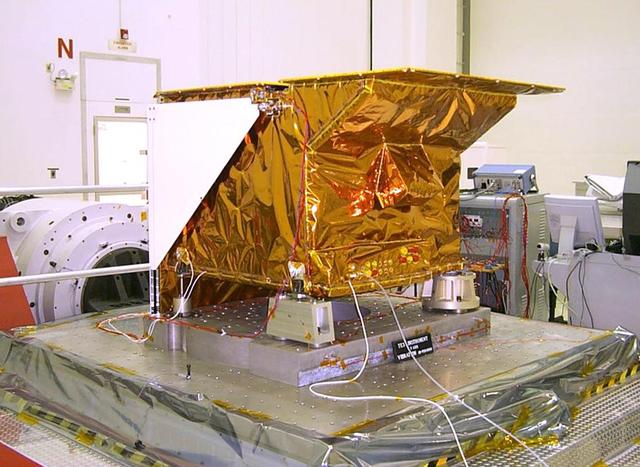
Technicians install NASA's Tropospheric Emission Spectrometer (TES) instrument on NASA's Aura spacecraft prior to launch. Launched in July 2004 and designed to fly for two years, the TES mission is currently in an extended operations phase. Mission managers at NASA's Jet Propulsion Laboratory, Pasadena, California, are evaluating an alternate way to collect and process science data from the Tropospheric Emission Spectrometer (TES) instrument on NASA's Aura spacecraft following the age-related failure of a critical instrument component. TES is an infrared sensor designed to study Earth's troposphere, the lowermost layer of Earth's atmosphere, which is where we live. The remainder of the TES instrument, and the Aura spacecraft itself, are operating as expected, and TES continues to collect science data. TES is one of four instruments on Aura, three of which are still operating. http://photojournal.jpl.nasa.gov/catalog/PIA15608
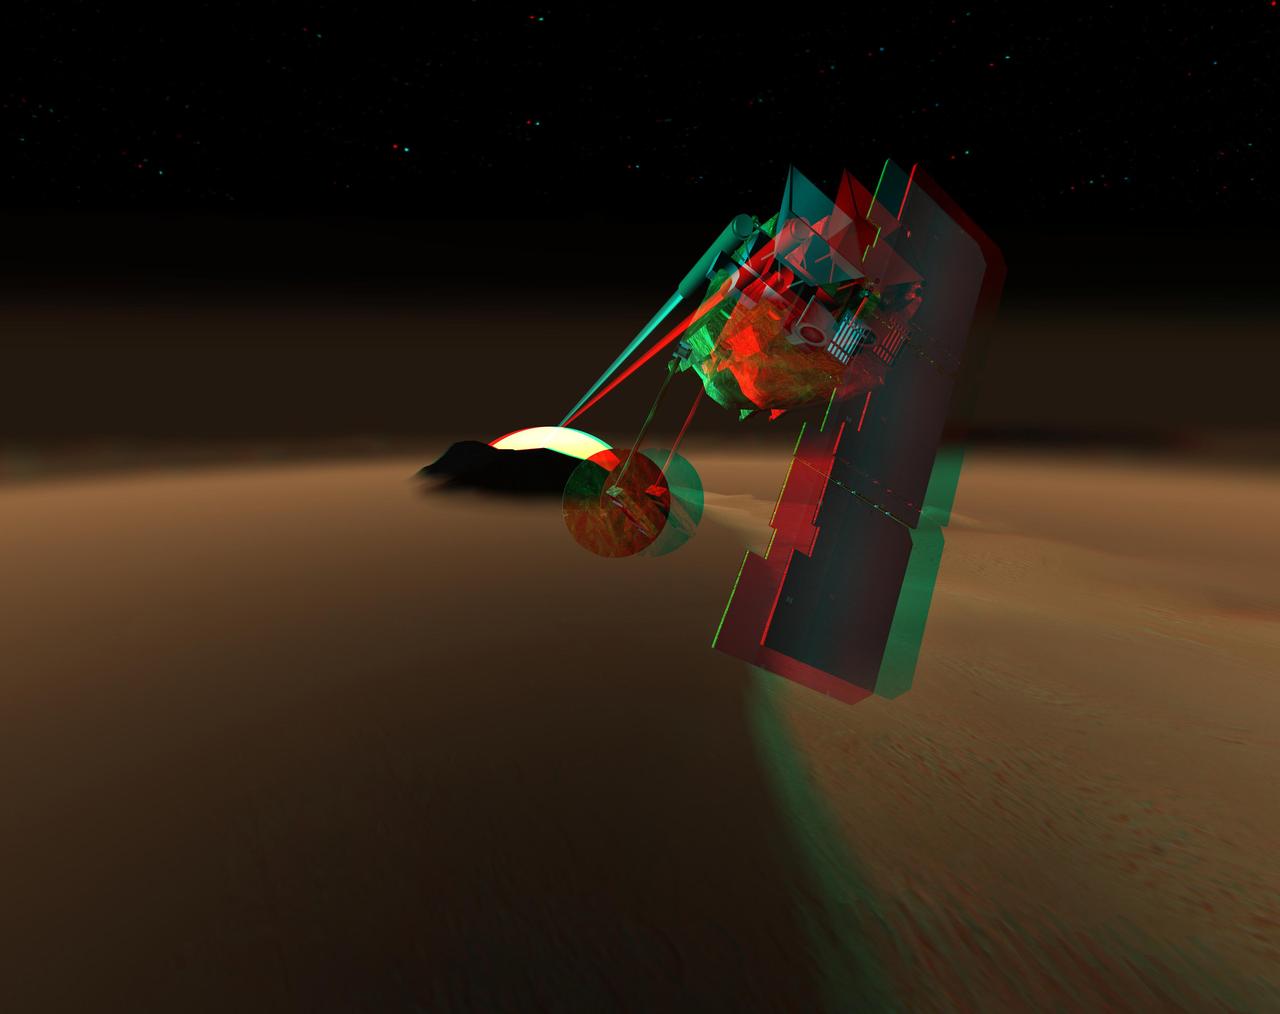
This artist rendition depicts a concept for a Mars orbiter that would scrutinize the martian atmosphere for chemical traces of life or environments supportive of life that might be present anywhere on the planet. 3D glasses are necessary.
This image is a simulation of how NASA's Europa Clipper will understand which areas of the Jovian moon Europa are warm and active by studying the moon's thermal emissions. Scientists based this image on a model of data from NASA's Galileo mission and data from an instrument on NASA's Cassini mission that studied warm regions of Saturn's moon Enceladus where jets of water ice and organic chemicals spray out from vents in the icy surface. Europa Clipper's Europa Thermal Emission Imaging System, or E-THEMIS, will take both daytime and nighttime observations of Europa. The light pink vertical stripes simulate the warm vents seen on the surface of Enceladus, if they were viewed on Europa in the night. If Europa has warm spots like Enceladus, E-THEMIS is expected to detect such areas on Europa, even from a distance. Europa Clipper will get as close as 16 miles (25 kilometers) from the moon's surface, resulting in observations at much higher resolution. Europa Clipper's three main science objectives are to determine the thickness of the moon's icy shell and its interactions with the ocean below, to investigate its composition, and to characterize its geology. The mission's detailed exploration of Europa will help scientists better understand the astrobiological potential for habitable worlds beyond our planet. https://photojournal.jpl.nasa.gov/catalog/PIA26105
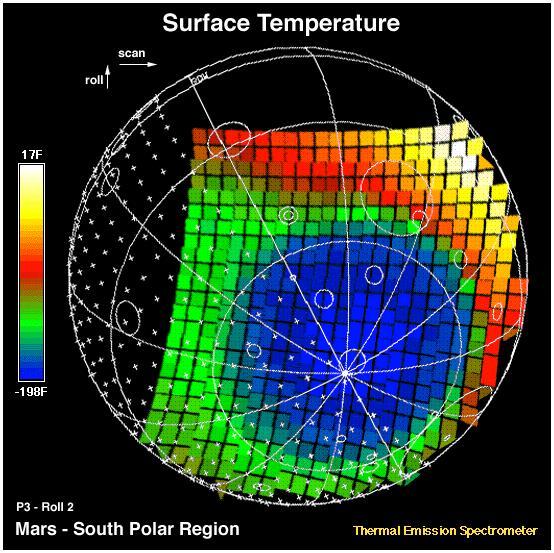
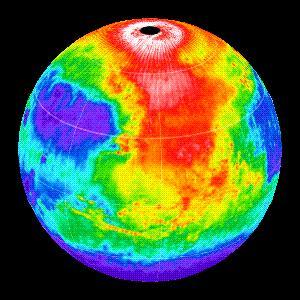
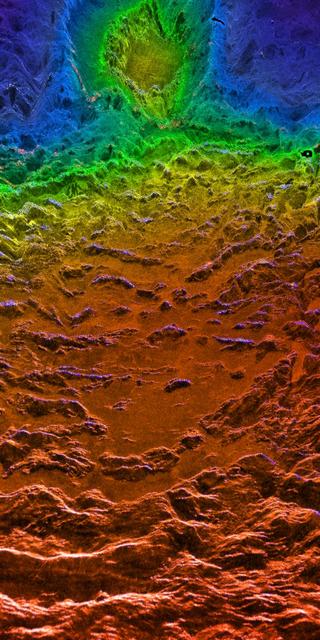
This image shows the temperature of the martian surface measured by the Mars Global Surveyor Thermal Emission Spectrometer (TES) instrument. On September 15, 3 hours and 48 minutes after the spacecrafts third close approach to the planet, the TES instrument was commanded to point at Mars and measure the temperature of the surface during a four minute scan. At this time MGS was approximately 15,000 miles (~24,000 km) from the planet, with a view looking up from beneath the planet at the south polar region. The circular blue region (- 198 F) is the south polar cap of Mars that is composed of CO2 ice. The night side of the planet, shown with crosses, is generally cool (green). The sunlit side of the planet reaches temperatures near 15 F (yellow). Each square represents an individual observation acquired in 2 seconds with a ground resolution of ~125 miles (~200 km). The TES instrument will remain on and collect similar images every 100 minutes to monitor the temperature of the surface and atmosphere throughout the aerobraking phase of the MGS mission. http://photojournal.jpl.nasa.gov/catalog/PIA00937
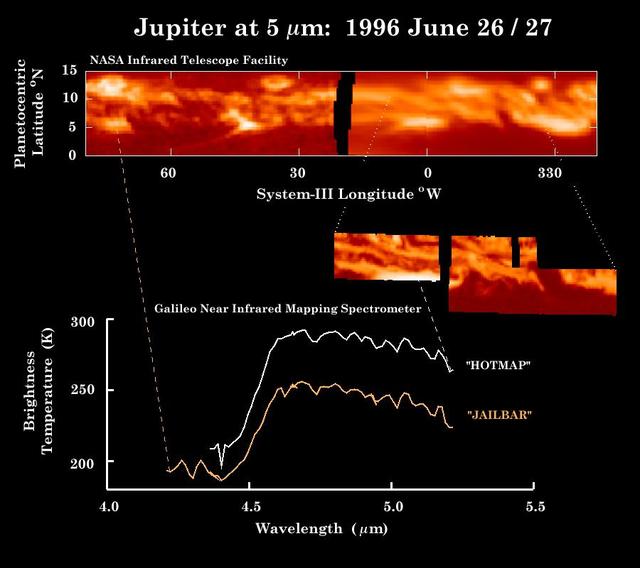
These observations of Jupiter equator in thermal heat emission were made by NASA Infrared Telescope Facility top panel within hours of the Near-Infrared Mapping Spectrometer NIMS instrument image middle inset and the spectra bottom.
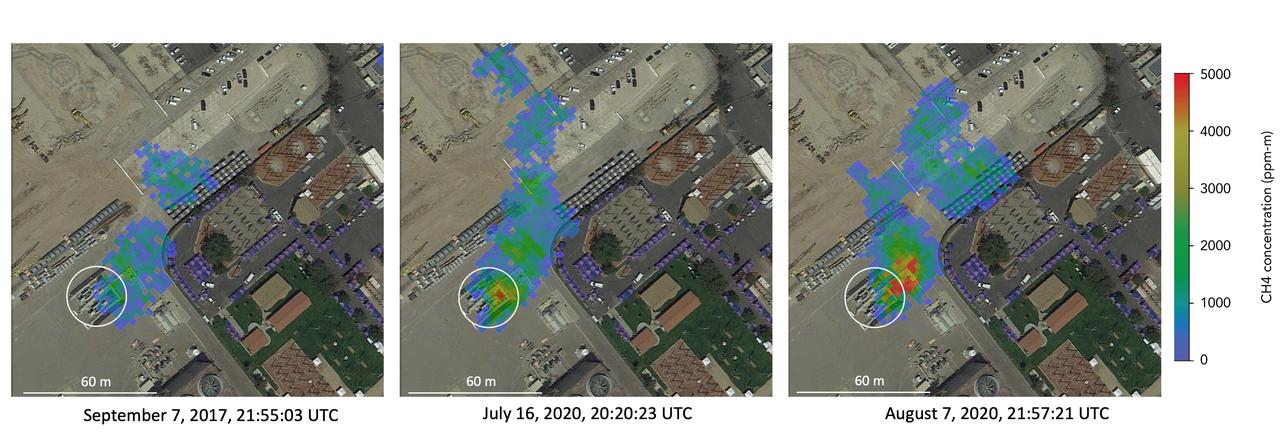
Atmospheric methane is a potent greenhouse gas and an important contributor to air quality. Future instruments on orbiting satellites can help improve our understanding of important methane emission sources. NASA conducts periodic methane studies using the next-generation Airborne Visible/Infrared Imaging Spectrometer (AVIRIS-NG) instrument. These studies are determining the locations and magnitudes of the largest methane emission sources across California, including those associated with landfills, refineries, dairies, wastewater treatment plants, oil and gas fields, power plants, and natural gas infrastructure. These three images show concentrations of methane in a natural gas plume relative to background air measured by AVIRIS-NG, overlaid on true-color land surface images (source: Google Earth). The aircraft was flying at an altitude of about 10,000 feet (3,000 meters) above ground level and the AVIRIS-NG image pixels are each about 10 feet (3 meters) across. The plume shape varies with changing emission rate, wind speed and direction. The methane plume originates from a compressor — circled in each image — at Valley Generating Station, a natural gas-fired power plant near Los Angeles. The color scale indicates the concentration of methane in each pixel relative to background methane concentrations in the surrounding atmosphere. The plume was initially detected by a single overflight in September 2017 but assumed at the time to be due to normal operations (intermittent venting). The plume was detected by AVIRIS-NG again on six flights in July-August 2020. https://photojournal.jpl.nasa.gov/catalog/PIA24019

SCI2016_0006: Map of Cepheus E emphasizing the jets of material flowing to the upper left and lower right from the protostar. The protostar itself is the central yellow-red 'blob" in the colored background map of hydrogen emission made at a wavelength of 4.5 microns by the Spitzer infrared space telescope. The contour curves show the strength of emission from cool carbon monoxide gas measured by the Plateau de Bure radio telescope located in the French Alps. Lefloch et al. used GREAT on SOFIA to measure the amount and velocity of hot carbon monoxide gas at multiple positions along both "wings" of the outflow jet. Credit: Lefloch et al. 2015 Figure 1
This frame from a time series, from one year of Tropospheric Emission Spectrometer TES measurements, shows how powerful the TES data are for understanding emissions, chemistry, and transport in the troposphere.
A composite image of the spiral galaxy NGC 4258 showing X-ray emission observed with NASA Chandra X-ray Observatory blue and infrared emission observed with NASA Spitzer Space Telescope red and green.
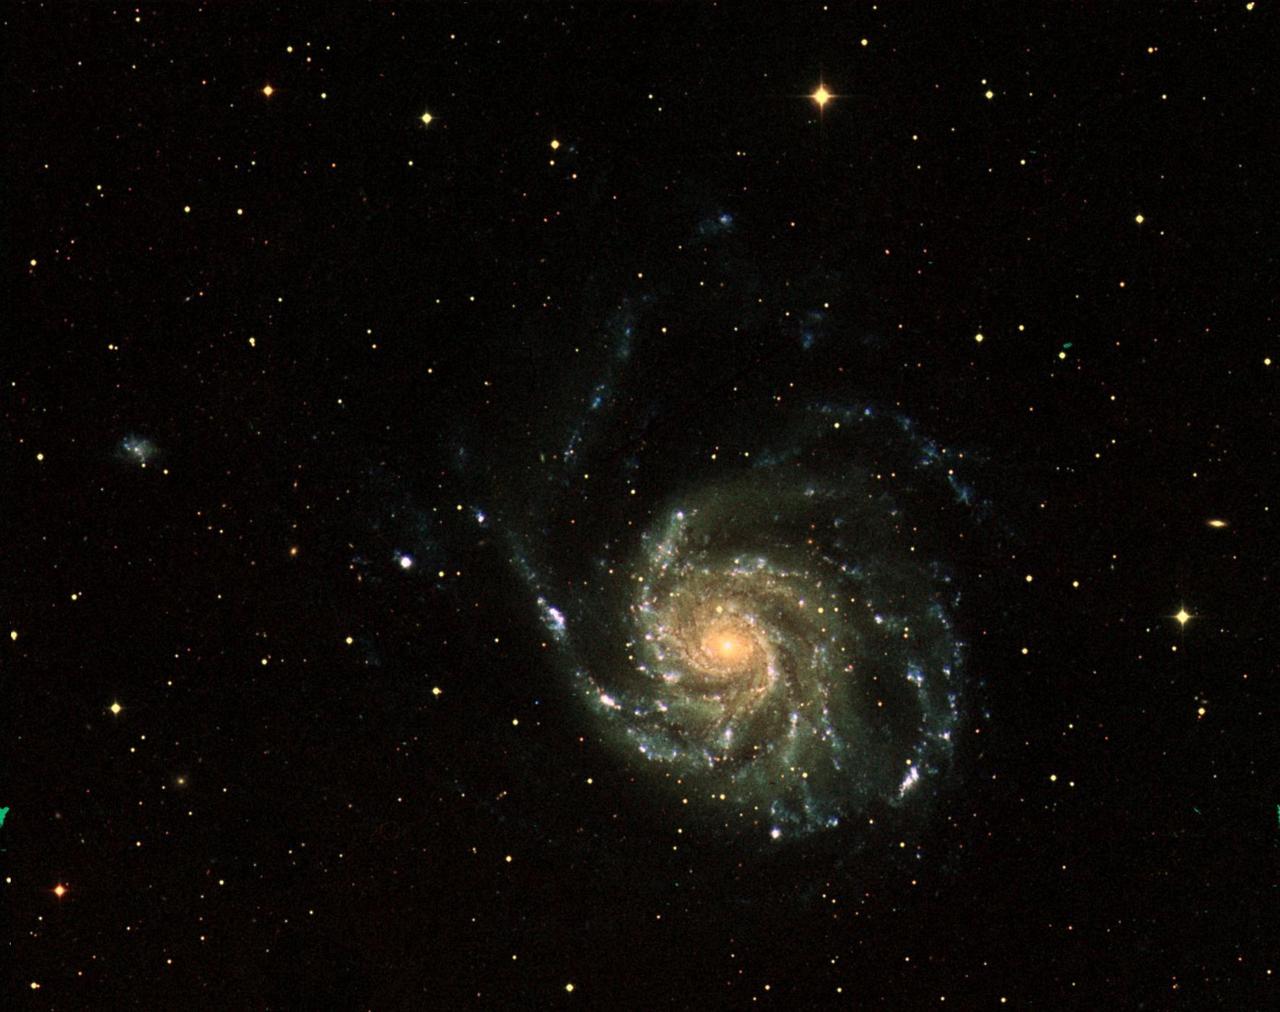
This three-color image of galaxy M101 was taken by NASA's Galaxy Evolution Explorer on June 20, 2003. The far ultraviolet emissions are shown in blue, the near ultraviolet emissions are green, and the red emissions, which were taken from NASA's Digital Sky Survey, represent visible light. This image combines short, medium, and long "exposure" pictures to best display the evolution of star formation in a spiral galaxy. http://photojournal.jpl.nasa.gov/catalog/PIA04630

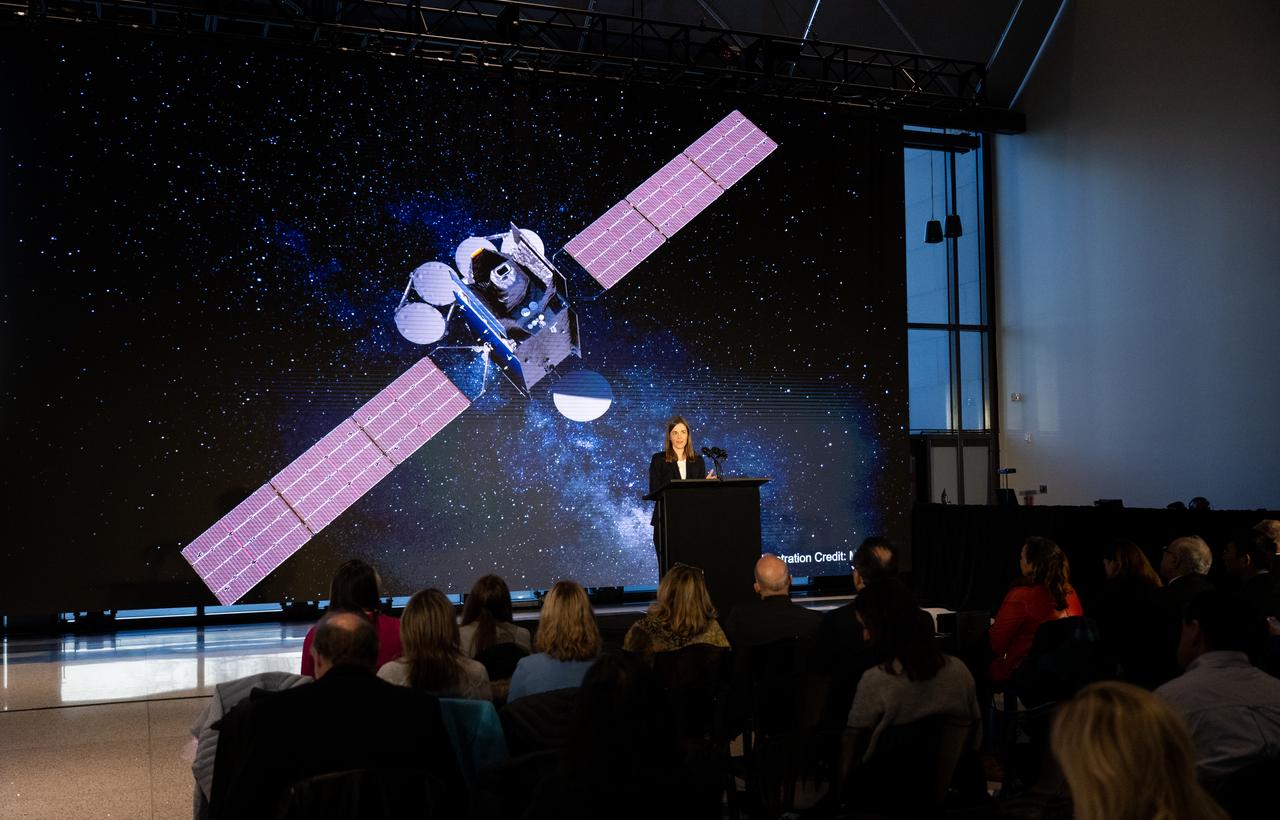
Erika Wright, education specialist at the Center for Astrophysics | Harvard & Smithsonian, speaks during a briefing on NASA’s TEMPO (Tropospheric Emissions: Monitoring of Pollution) instrument, Tuesday, March 14, 2023 at the Smithsonian’s National Air and Space Museum in Washington. NASA’s TEMPO instrument, the first Earth Venture Instrument mission, will measure air pollution across North America from Mexico City to the Canadian oil sands and from the Atlantic to the Pacific hourly and at a high spatial resolution. A partnership between NASA and the Center for Astrophysics | Harvard & Smithsonian, TEMPO will launch on a commercial satellite to geostationary orbit as early as April. Photo Credit: (NASA/Joel Kowsky)

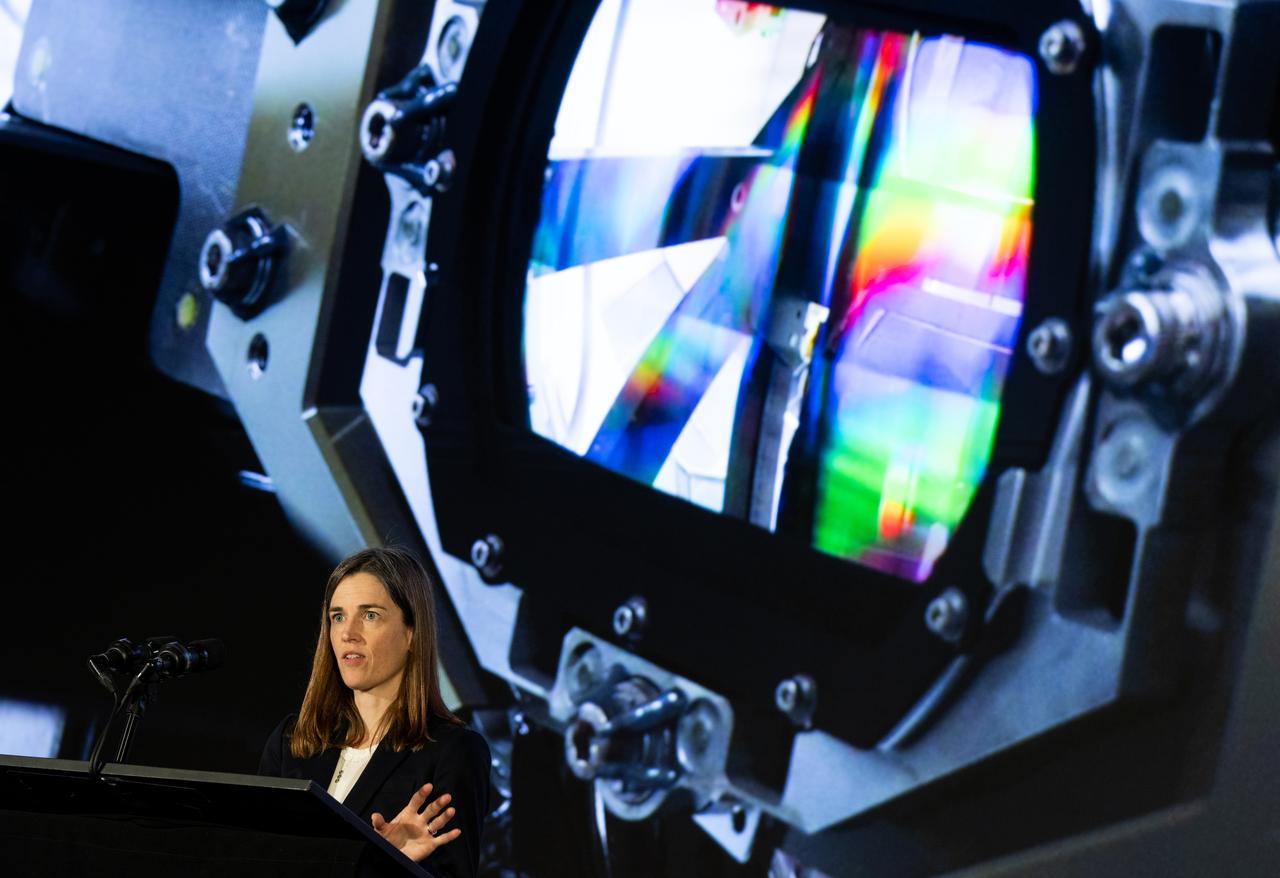
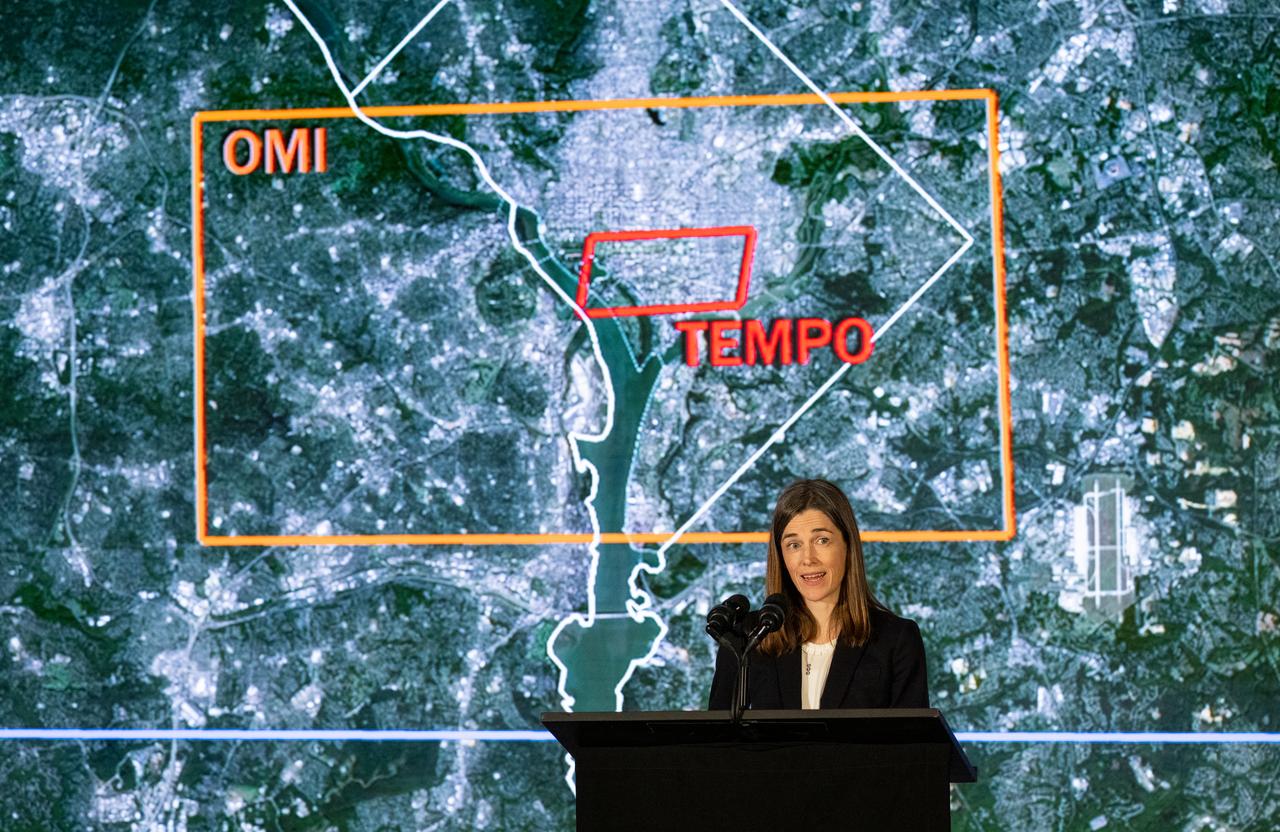
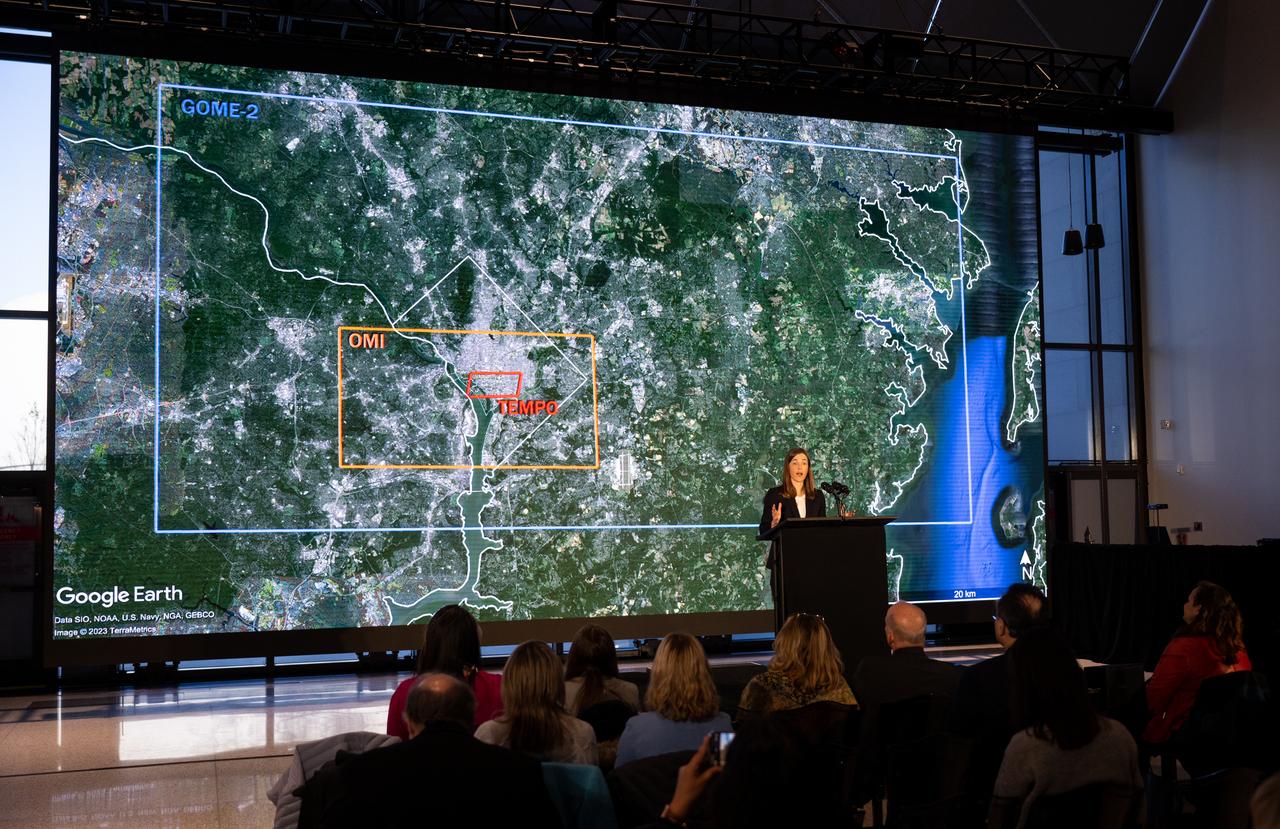
Caroline Nowlan, atmospheric physicist at the Center for Astrophysics | Harvard & Smithsonian, speaks during a briefing on NASA’s TEMPO (Tropospheric Emissions: Monitoring of Pollution) instrument, Tuesday, March 14, 2023 at the Smithsonian’s National Air and Space Museum in Washington. NASA’s TEMPO instrument, the first Earth Venture Instrument mission, will measure air pollution across North America from Mexico City to the Canadian oil sands and from the Atlantic to the Pacific hourly and at a high spatial resolution. A partnership between NASA and the Center for Astrophysics | Harvard & Smithsonian, TEMPO will launch on a commercial satellite to geostationary orbit as early as April. Photo Credit: (NASA/Joel Kowsky)
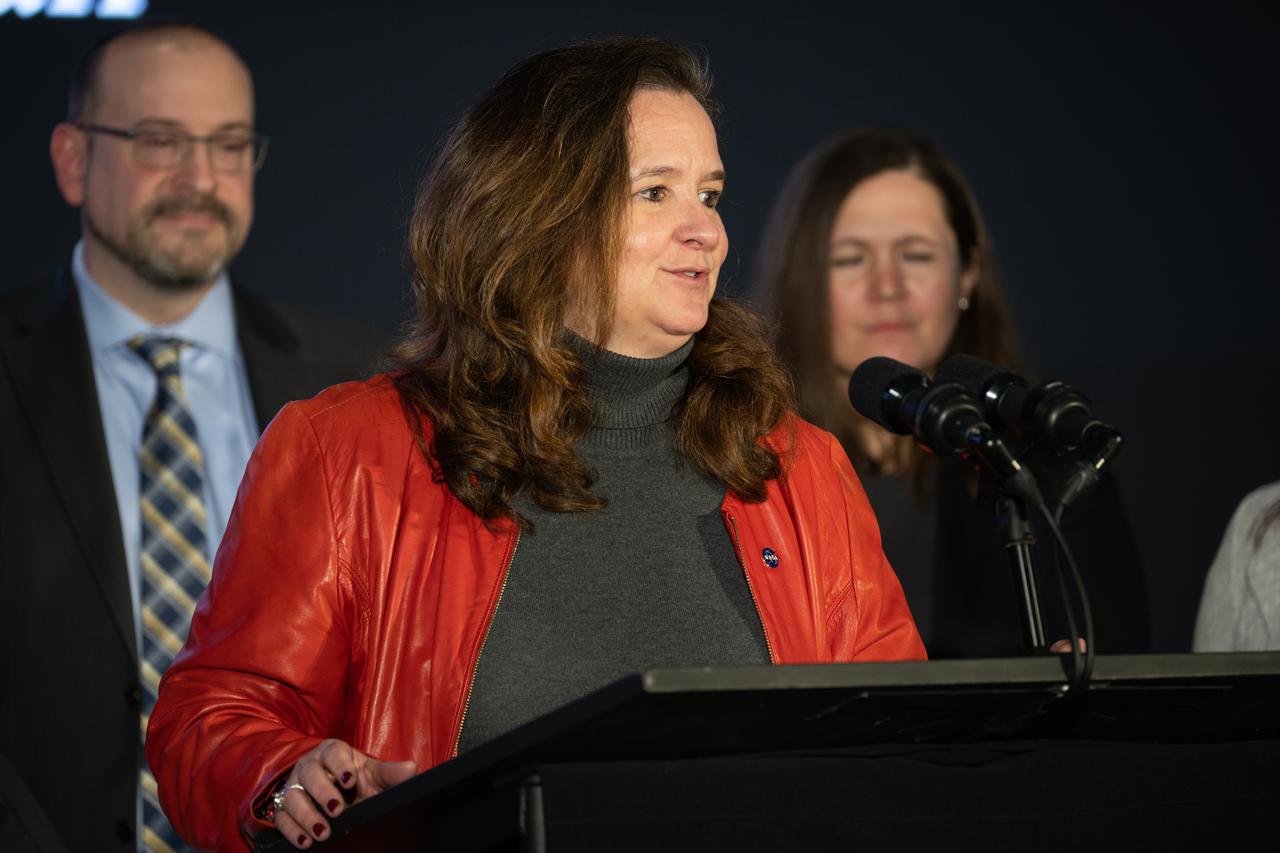
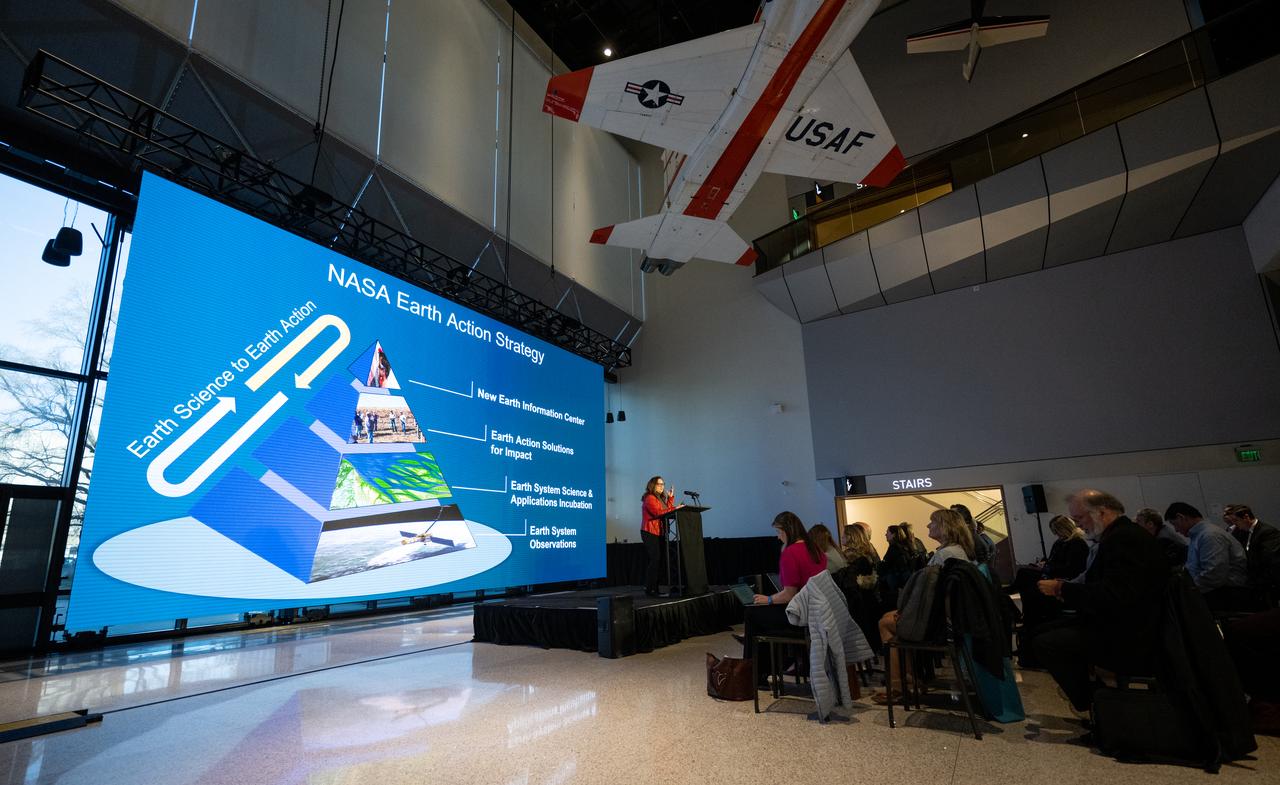
Karen St. Germain, director of the Earth Science Division of NASA’s Science Mission Directorate, answers a question during a briefing on NASA’s TEMPO (Tropospheric Emissions: Monitoring of Pollution) instrument, Tuesday, March 14, 2023 at the Smithsonian’s National Air and Space Museum in Washington. NASA’s TEMPO instrument, the first Earth Venture Instrument mission, will measure air pollution across North America from Mexico City to the Canadian oil sands and from the Atlantic to the Pacific hourly and at a high spatial resolution. A partnership between NASA and the Center for Astrophysics | Harvard & Smithsonian, TEMPO will launch on a commercial satellite to geostationary orbit as early as April. Photo Credit: (NASA/Joel Kowsky)

Ellen Stofan, under secretary for Science and Research at the Smithsonian Institution, speaks during a briefing on NASA’s TEMPO (Tropospheric Emissions: Monitoring of Pollution) instrument, Tuesday, March 14, 2023 at the Smithsonian’s National Air and Space Museum in Washington. NASA’s TEMPO instrument, the first Earth Venture Instrument mission, will measure air pollution across North America from Mexico City to the Canadian oil sands and from the Atlantic to the Pacific hourly and at a high spatial resolution. A partnership between NASA and the Center for Astrophysics | Harvard & Smithsonian, TEMPO will launch on a commercial satellite to geostationary orbit as early as April. Photo Credit: (NASA/Joel Kowsky)

Barry Lefer, tropospheric composition program manager in the Earth Science Division of NASA’s Science Mission Directorate, speaks during a briefing on NASA’s TEMPO (Tropospheric Emissions: Monitoring of Pollution) instrument, Tuesday, March 14, 2023 at the Smithsonian’s National Air and Space Museum in Washington. NASA’s TEMPO instrument, the first Earth Venture Instrument mission, will measure air pollution across North America from Mexico City to the Canadian oil sands and from the Atlantic to the Pacific hourly and at a high spatial resolution. A partnership between NASA and the Center for Astrophysics | Harvard & Smithsonian, TEMPO will launch on a commercial satellite to geostationary orbit as early as April. Photo Credit: (NASA/Joel Kowsky)
Caroline Nowlan, atmospheric physicist at the Center for Astrophysics | Harvard & Smithsonian, speaks during a briefing on NASA’s TEMPO (Tropospheric Emissions: Monitoring of Pollution) instrument, Tuesday, March 14, 2023 at the Smithsonian’s National Air and Space Museum in Washington. NASA’s TEMPO instrument, the first Earth Venture Instrument mission, will measure air pollution across North America from Mexico City to the Canadian oil sands and from the Atlantic to the Pacific hourly and at a high spatial resolution. A partnership between NASA and the Center for Astrophysics | Harvard & Smithsonian, TEMPO will launch on a commercial satellite to geostationary orbit as early as April. Photo Credit: (NASA/Joel Kowsky)

Ellen Stofan, under secretary for Science and Research at the Smithsonian Institution, speaks during a briefing on NASA’s TEMPO (Tropospheric Emissions: Monitoring of Pollution) instrument, Tuesday, March 14, 2023 at the Smithsonian’s National Air and Space Museum in Washington. NASA’s TEMPO instrument, the first Earth Venture Instrument mission, will measure air pollution across North America from Mexico City to the Canadian oil sands and from the Atlantic to the Pacific hourly and at a high spatial resolution. A partnership between NASA and the Center for Astrophysics | Harvard & Smithsonian, TEMPO will launch on a commercial satellite to geostationary orbit as early as April. Photo Credit: (NASA/Joel Kowsky)

Karen St. Germain, director of the Earth Science Division of NASA’s Science Mission Directorate, speaks during a briefing on NASA’s TEMPO (Tropospheric Emissions: Monitoring of Pollution) instrument, Tuesday, March 14, 2023 at the Smithsonian’s National Air and Space Museum in Washington. NASA’s TEMPO instrument, the first Earth Venture Instrument mission, will measure air pollution across North America from Mexico City to the Canadian oil sands and from the Atlantic to the Pacific hourly and at a high spatial resolution. A partnership between NASA and the Center for Astrophysics | Harvard & Smithsonian, TEMPO will launch on a commercial satellite to geostationary orbit as early as April. Photo Credit: (NASA/Joel Kowsky)

Caroline Nowlan, atmospheric physicist at the Center for Astrophysics | Harvard & Smithsonian, answers a question during a briefing on NASA’s TEMPO (Tropospheric Emissions: Monitoring of Pollution) instrument, Tuesday, March 14, 2023 at the Smithsonian’s National Air and Space Museum in Washington. NASA’s TEMPO instrument, the first Earth Venture Instrument mission, will measure air pollution across North America from Mexico City to the Canadian oil sands and from the Atlantic to the Pacific hourly and at a high spatial resolution. A partnership between NASA and the Center for Astrophysics | Harvard & Smithsonian, TEMPO will launch on a commercial satellite to geostationary orbit as early as April. Photo Credit: (NASA/Joel Kowsky)

NASA Public Affairs Officer Karen Fox moderates a briefing on NASA’s TEMPO (Tropospheric Emissions: Monitoring of Pollution) instrument, Tuesday, March 14, 2023 at the Smithsonian’s National Air and Space Museum in Washington. NASA’s TEMPO instrument, the first Earth Venture Instrument mission, will measure air pollution across North America from Mexico City to the Canadian oil sands and from the Atlantic to the Pacific hourly and at a high spatial resolution. A partnership between NASA and the Center for Astrophysics | Harvard & Smithsonian, TEMPO will launch on a commercial satellite to geostationary orbit as early as April. Photo Credit: (NASA/Joel Kowsky)
Caroline Nowlan, atmospheric physicist at the Center for Astrophysics | Harvard & Smithsonian, speaks during a briefing on NASA’s TEMPO (Tropospheric Emissions: Monitoring of Pollution) instrument, Tuesday, March 14, 2023 at the Smithsonian’s National Air and Space Museum in Washington. NASA’s TEMPO instrument, the first Earth Venture Instrument mission, will measure air pollution across North America from Mexico City to the Canadian oil sands and from the Atlantic to the Pacific hourly and at a high spatial resolution. A partnership between NASA and the Center for Astrophysics | Harvard & Smithsonian, TEMPO will launch on a commercial satellite to geostationary orbit as early as April. Photo Credit: (NASA/Joel Kowsky)
Caroline Nowlan, atmospheric physicist at the Center for Astrophysics | Harvard & Smithsonian, speaks during a briefing on NASA’s TEMPO (Tropospheric Emissions: Monitoring of Pollution) instrument, Tuesday, March 14, 2023 at the Smithsonian’s National Air and Space Museum in Washington. NASA’s TEMPO instrument, the first Earth Venture Instrument mission, will measure air pollution across North America from Mexico City to the Canadian oil sands and from the Atlantic to the Pacific hourly and at a high spatial resolution. A partnership between NASA and the Center for Astrophysics | Harvard & Smithsonian, TEMPO will launch on a commercial satellite to geostationary orbit as early as April. Photo Credit: (NASA/Joel Kowsky)

Karen St. Germain, director of the Earth Science Division of NASA’s Science Mission Directorate, speaks during a briefing on NASA’s TEMPO (Tropospheric Emissions: Monitoring of Pollution) instrument, Tuesday, March 14, 2023 at the Smithsonian’s National Air and Space Museum in Washington. NASA’s TEMPO instrument, the first Earth Venture Instrument mission, will measure air pollution across North America from Mexico City to the Canadian oil sands and from the Atlantic to the Pacific hourly and at a high spatial resolution. A partnership between NASA and the Center for Astrophysics | Harvard & Smithsonian, TEMPO will launch on a commercial satellite to geostationary orbit as early as April. Photo Credit: (NASA/Joel Kowsky)

Karen St. Germain, director of the Earth Science Division of NASA’s Science Mission Directorate, speaks during a briefing on NASA’s TEMPO (Tropospheric Emissions: Monitoring of Pollution) instrument, Tuesday, March 14, 2023 at the Smithsonian’s National Air and Space Museum in Washington. NASA’s TEMPO instrument, the first Earth Venture Instrument mission, will measure air pollution across North America from Mexico City to the Canadian oil sands and from the Atlantic to the Pacific hourly and at a high spatial resolution. A partnership between NASA and the Center for Astrophysics | Harvard & Smithsonian, TEMPO will launch on a commercial satellite to geostationary orbit as early as April. Photo Credit: (NASA/Joel Kowsky)
Caroline Nowlan, atmospheric physicist at the Center for Astrophysics | Harvard & Smithsonian, speaks during a briefing on NASA’s TEMPO (Tropospheric Emissions: Monitoring of Pollution) instrument, Tuesday, March 14, 2023 at the Smithsonian’s National Air and Space Museum in Washington. NASA’s TEMPO instrument, the first Earth Venture Instrument mission, will measure air pollution across North America from Mexico City to the Canadian oil sands and from the Atlantic to the Pacific hourly and at a high spatial resolution. A partnership between NASA and the Center for Astrophysics | Harvard & Smithsonian, TEMPO will launch on a commercial satellite to geostationary orbit as early as April. Photo Credit: (NASA/Joel Kowsky)

Barry Lefer, tropospheric composition program manager in the Earth Science Division of NASA’s Science Mission Directorate, speaks during a briefing on NASA’s TEMPO (Tropospheric Emissions: Monitoring of Pollution) instrument, Tuesday, March 14, 2023 at the Smithsonian’s National Air and Space Museum in Washington. NASA’s TEMPO instrument, the first Earth Venture Instrument mission, will measure air pollution across North America from Mexico City to the Canadian oil sands and from the Atlantic to the Pacific hourly and at a high spatial resolution. A partnership between NASA and the Center for Astrophysics | Harvard & Smithsonian, TEMPO will launch on a commercial satellite to geostationary orbit as early as April. Photo Credit: (NASA/Joel Kowsky)

Barry Lefer, tropospheric composition program manager in the Earth Science Division of NASA’s Science Mission Directorate, speaks during a briefing on NASA’s TEMPO (Tropospheric Emissions: Monitoring of Pollution) instrument, Tuesday, March 14, 2023 at the Smithsonian’s National Air and Space Museum in Washington. NASA’s TEMPO instrument, the first Earth Venture Instrument mission, will measure air pollution across North America from Mexico City to the Canadian oil sands and from the Atlantic to the Pacific hourly and at a high spatial resolution. A partnership between NASA and the Center for Astrophysics | Harvard & Smithsonian, TEMPO will launch on a commercial satellite to geostationary orbit as early as April. Photo Credit: (NASA/Joel Kowsky)

Christopher Browne, director of the Smithsonian’s National Air and Space Museum delivers remarks during a briefing on NASA’s TEMPO (Tropospheric Emissions: Monitoring of Pollution) instrument, Tuesday, March 14, 2023 at the Smithsonian’s National Air and Space Museum in Washington. NASA’s TEMPO instrument, the first Earth Venture Instrument mission, will measure air pollution across North America from Mexico City to the Canadian oil sands and from the Atlantic to the Pacific hourly and at a high spatial resolution. A partnership between NASA and the Center for Astrophysics | Harvard & Smithsonian, TEMPO will launch on a commercial satellite to geostationary orbit as early as April. Photo Credit: (NASA/Joel Kowsky)
Karen St. Germain, director of the Earth Science Division of NASA’s Science Mission Directorate, speaks during a briefing on NASA’s TEMPO (Tropospheric Emissions: Monitoring of Pollution) instrument, Tuesday, March 14, 2023 at the Smithsonian’s National Air and Space Museum in Washington. NASA’s TEMPO instrument, the first Earth Venture Instrument mission, will measure air pollution across North America from Mexico City to the Canadian oil sands and from the Atlantic to the Pacific hourly and at a high spatial resolution. A partnership between NASA and the Center for Astrophysics | Harvard & Smithsonian, TEMPO will launch on a commercial satellite to geostationary orbit as early as April. Photo Credit: (NASA/Joel Kowsky)
This image from NASA Spitzer Space Telescope shows an exceptionally bright source of radio emission called DR21.
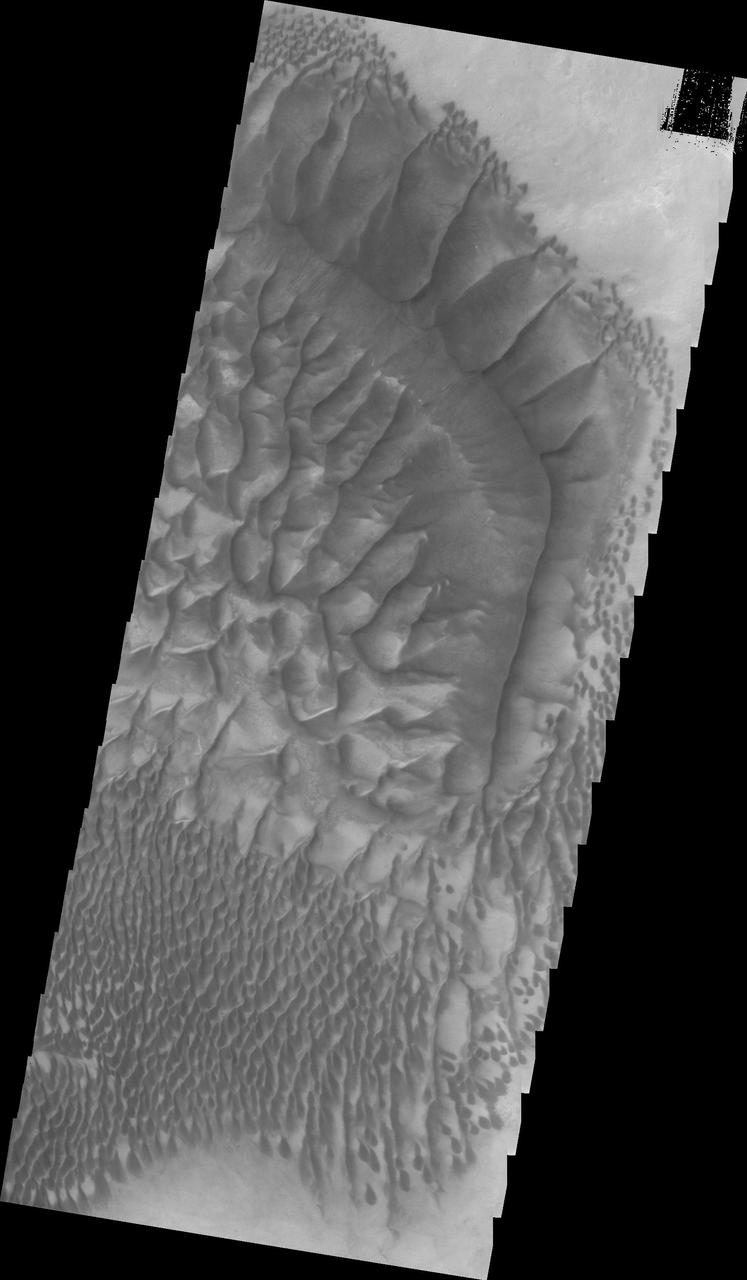
The Thermal Emission Imaging System aboard NASA Mars Odyssey highlights the complexity and variety of dune forms on the floor of Russell Crater.
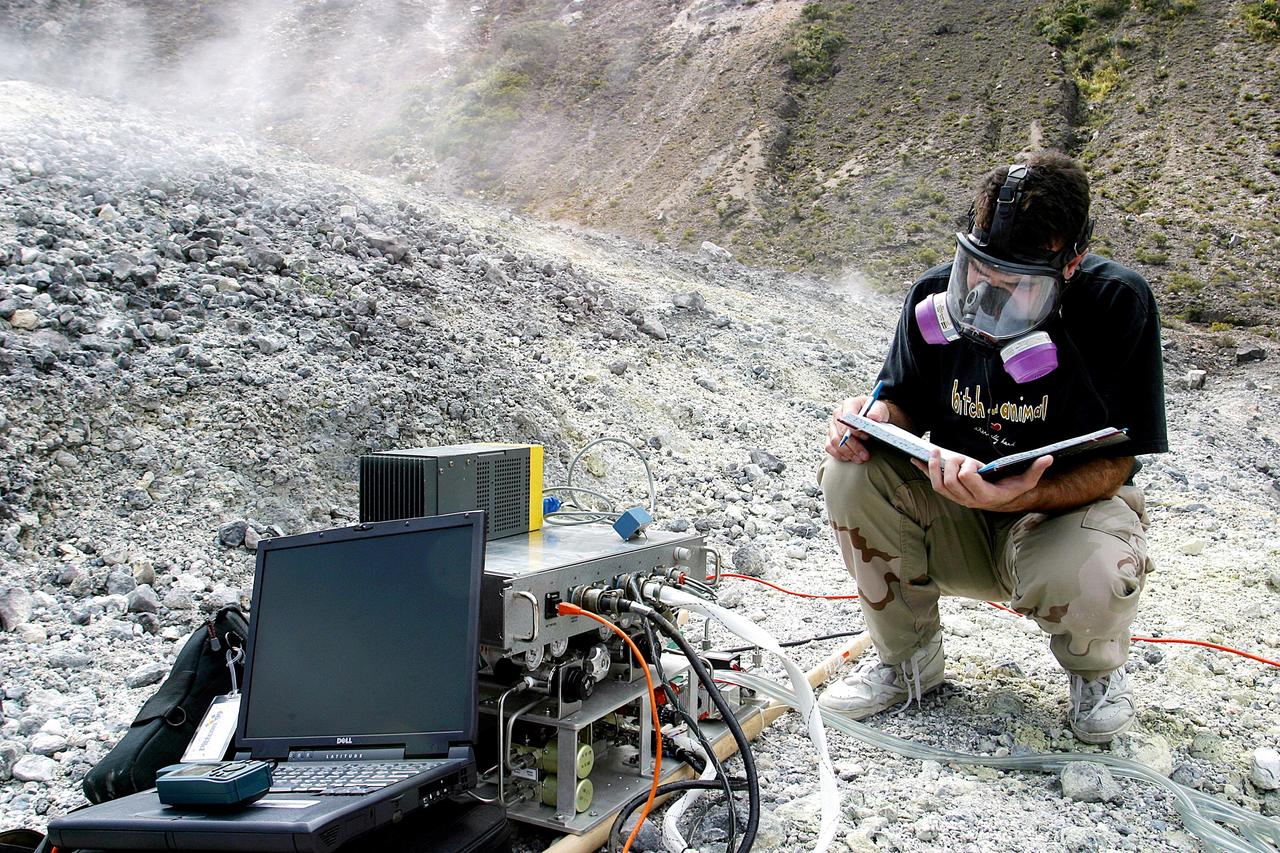
KENNEDY SPACE CENTER, FLA. - Dr. Richard Arkin records data as the hazardous gas detection system AVEMS is used to analyze the toxic gases produced by active vents, called fumaroles, in the Turrialba volcano in Costa Rica. He is using the Aircraft-based Volcanic Emission Mass Spectrometer (AVEMS) that determines the presence and concentration of various chemicals. The AVEMS system has been developed for use in the Space Shuttle program, to detect toxic gas leaks and emissions in the Shuttle’s aft compartment and the crew compartment.
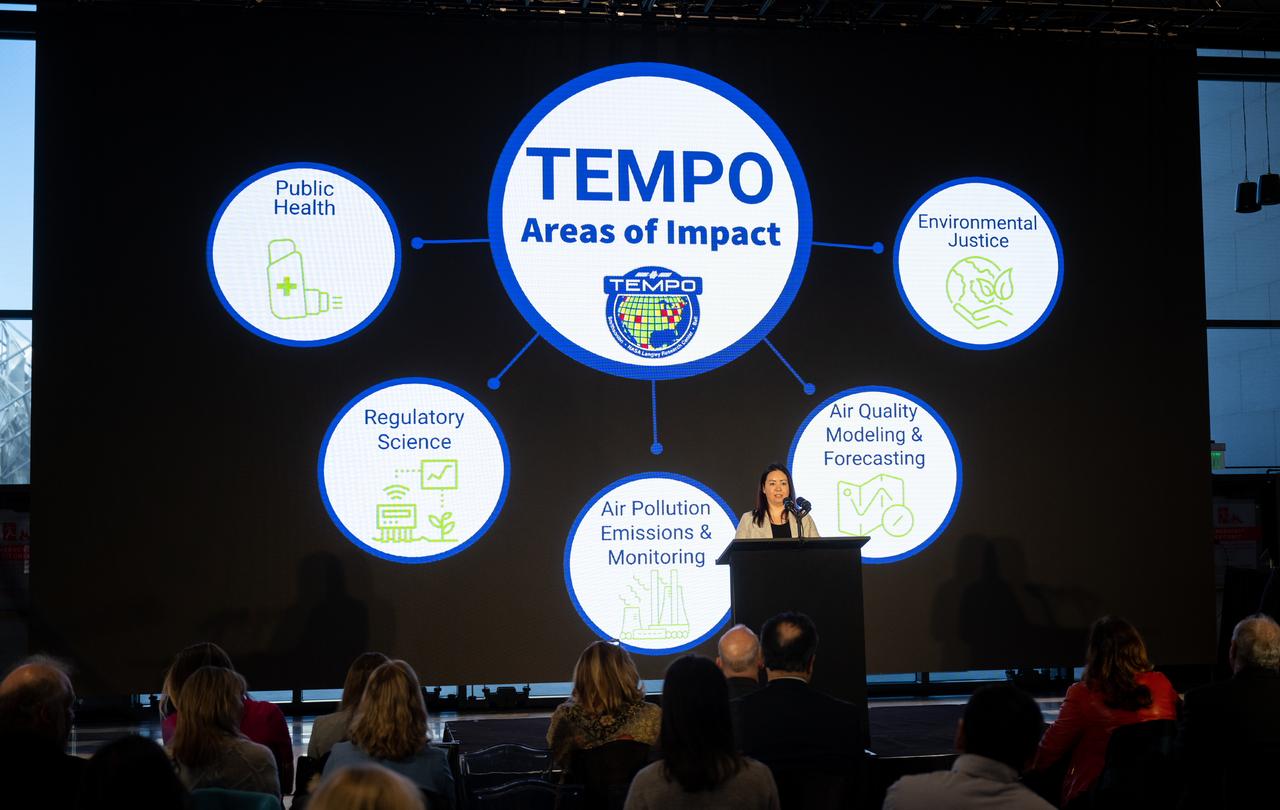
Laura Judd, associate program manager for the Applied Sciences Health and Air Quality Applications in the Applied Sciences Program of NASA’s Earth Science Division, speaks during a briefing on NASA’s TEMPO (Tropospheric Emissions: Monitoring of Pollution) instrument, Tuesday, March 14, 2023 at the Smithsonian’s National Air and Space Museum in Washington. NASA’s TEMPO instrument, the first Earth Venture Instrument mission, will measure air pollution across North America from Mexico City to the Canadian oil sands and from the Atlantic to the Pacific hourly and at a high spatial resolution. A partnership between NASA and the Center for Astrophysics | Harvard & Smithsonian, TEMPO will launch on a commercial satellite to geostationary orbit as early as April. Photo Credit: (NASA/Joel Kowsky)

Laura Judd, associate program manager for the Applied Sciences Health and Air Quality Applications in the Applied Sciences Program of NASA’s Earth Science Division, speaks during a briefing on NASA’s TEMPO (Tropospheric Emissions: Monitoring of Pollution) instrument, Tuesday, March 14, 2023 at the Smithsonian’s National Air and Space Museum in Washington. NASA’s TEMPO instrument, the first Earth Venture Instrument mission, will measure air pollution across North America from Mexico City to the Canadian oil sands and from the Atlantic to the Pacific hourly and at a high spatial resolution. A partnership between NASA and the Center for Astrophysics | Harvard & Smithsonian, TEMPO will launch on a commercial satellite to geostationary orbit as early as April. Photo Credit: (NASA/Joel Kowsky)
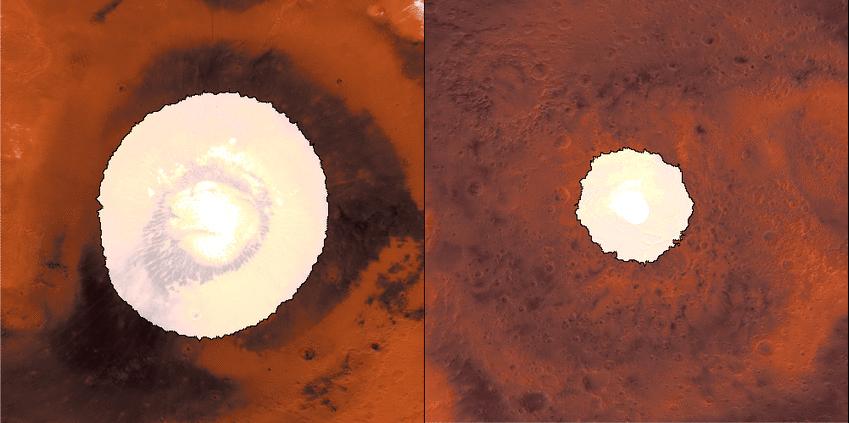
This animation shows a side-by-side comparison of CO2 ice at the north (left) and south (right) Martian poles over the course of a typical year (two Earth years). This simulation isn't based on photos; instead, the data used to create it came from two infrared instruments capable of studying the poles even when they're in complete darkness. As Mars enters fall and winter, reduced sunlight allows CO2 ice to grow, covering each pole. While ice at the north pole is fairly symmetrical, it's somewhat asymmetrical during its retreat from the south pole for reasons scientists still don't understand. Scientists are especially interested in studying how global dust events affect the growth and retreat of this polar ice. Mars' seasons are caused by a tilt in the planet, resulting in winter at one of the planet's poles while it's summer at the other. How do spacecraft observe the Martian surface in the polar night, when the Sun is below the horizon for weeks or even months, or in the spring, when it's hazy? They use infrared instruments measuring surface temperatures, even when the ground is in complete darkness or the atmosphere obscured. CO2 ice (sometimes called dry ice) is the coldest material found on Mars, and it is near -193 degrees Fahrenheit (-125 degrees Celsius), whereas ice free soil is generally warmer. As a result, scientists can track the position of the seasonal caps, even in the dark, using surface temperature measurements. Each panel of the animation is about 3,728 miles (6,000 kilometers) across. This data was collected by the Mars Climate Sounder (MCS) instrument on NASA's Mars Reconnaissance Orbiter, and the Thermal Emission Spectrometer (TES) onboard NASA's now defunct Mars Global Surveyor. The MCS data was collected between mid-2006 and the end of 2013; the TES data was collected between early 1999 to late 2006. Animation is available at https://photojournal.jpl.nasa.gov/catalog/PIA22546
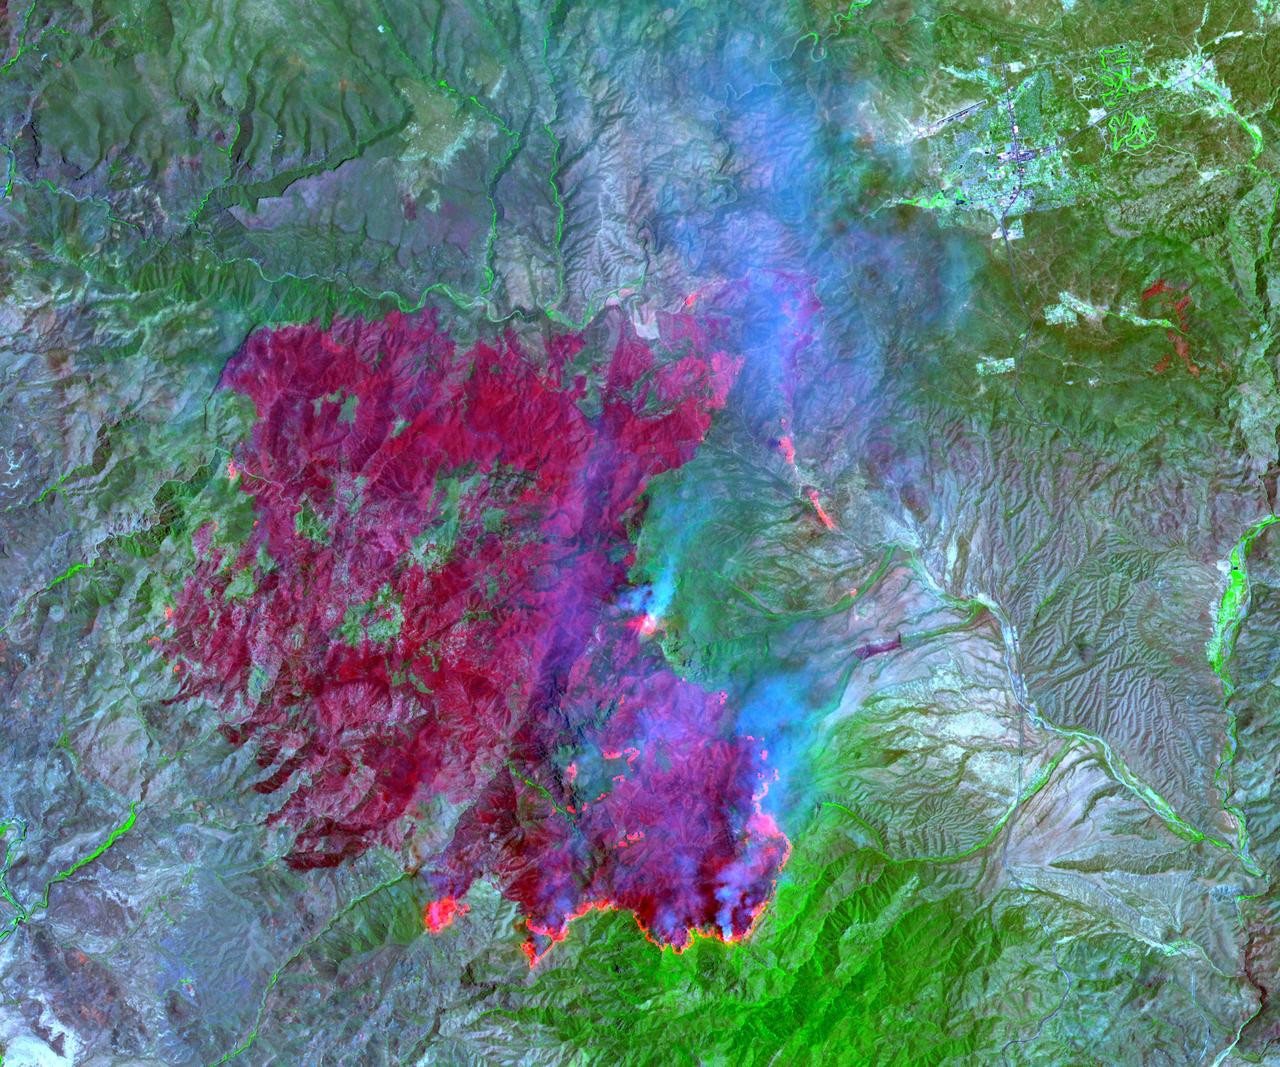
On July 3, 2004, the Advanced Spaceborne Thermal Emission and Reflection Radiometer ASTER on NASA Terra satellite acquired this image of the Willow fire near Payson, Arizona.

NASA 2001 Mars Odyssey Thermal Emission Imaging System THEMIS acquired these images of the Earth using its visible and infrared cameras as it left the Earth.
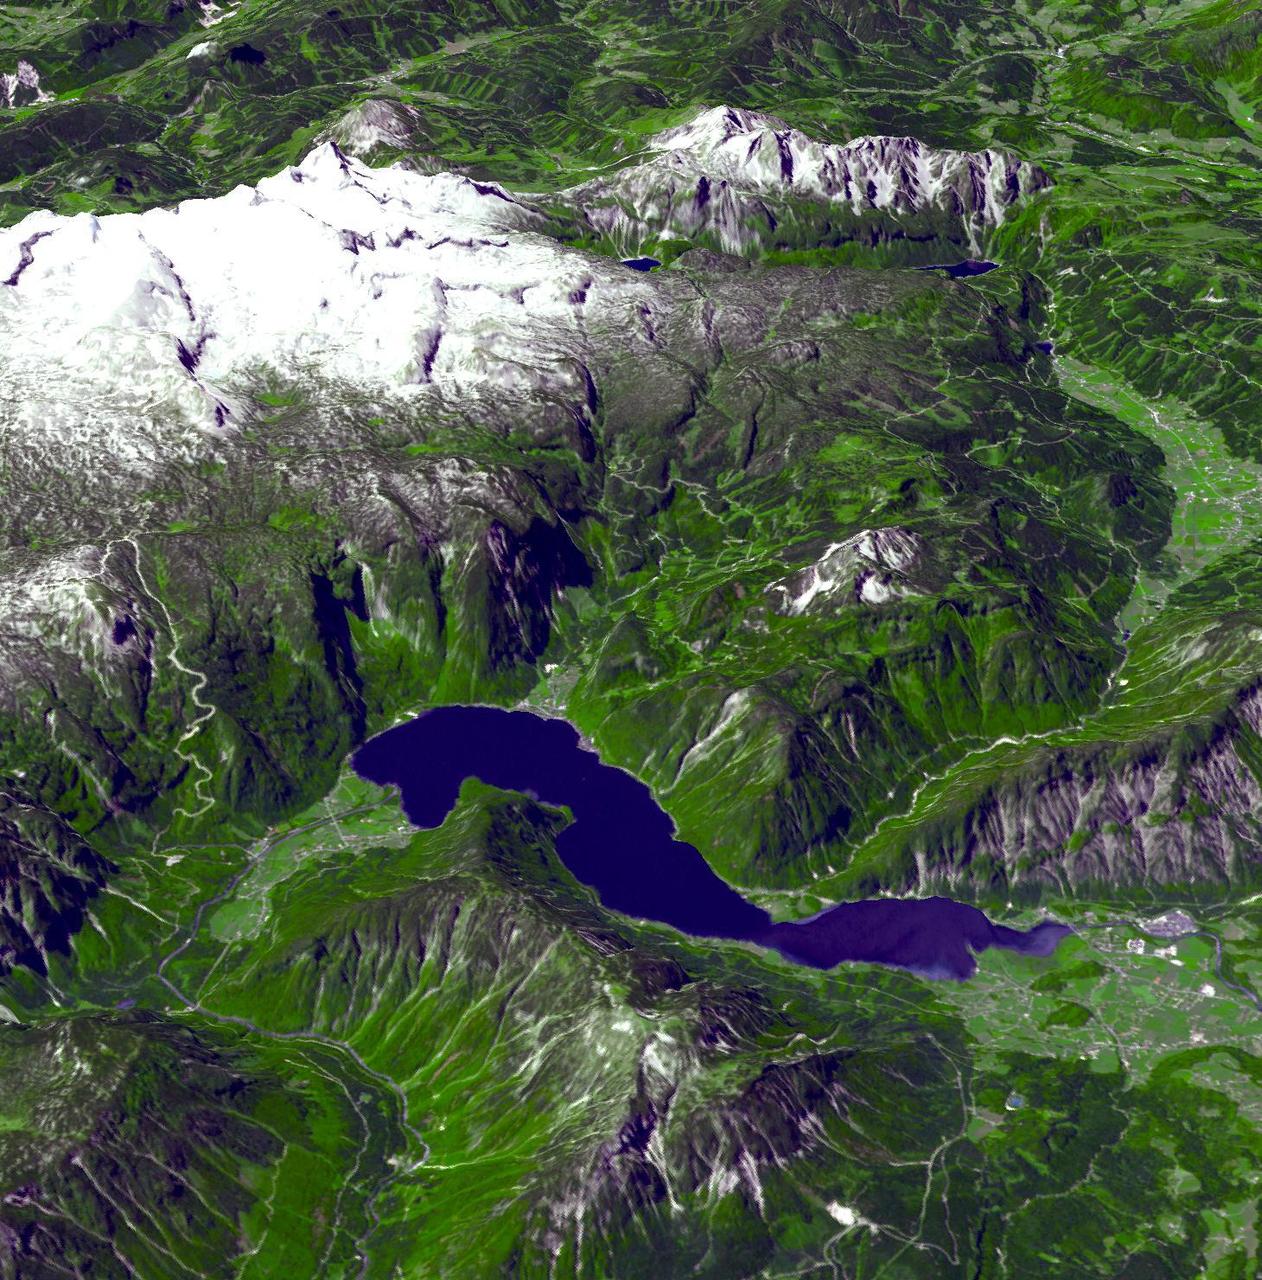
This perspective view from the Advanced Spaceborne Thermal Emission and Reflection Radiometer instrument aboard NASA Terra spacecraft shows the magnificent natural landscape of Salzkammergut, Austria.
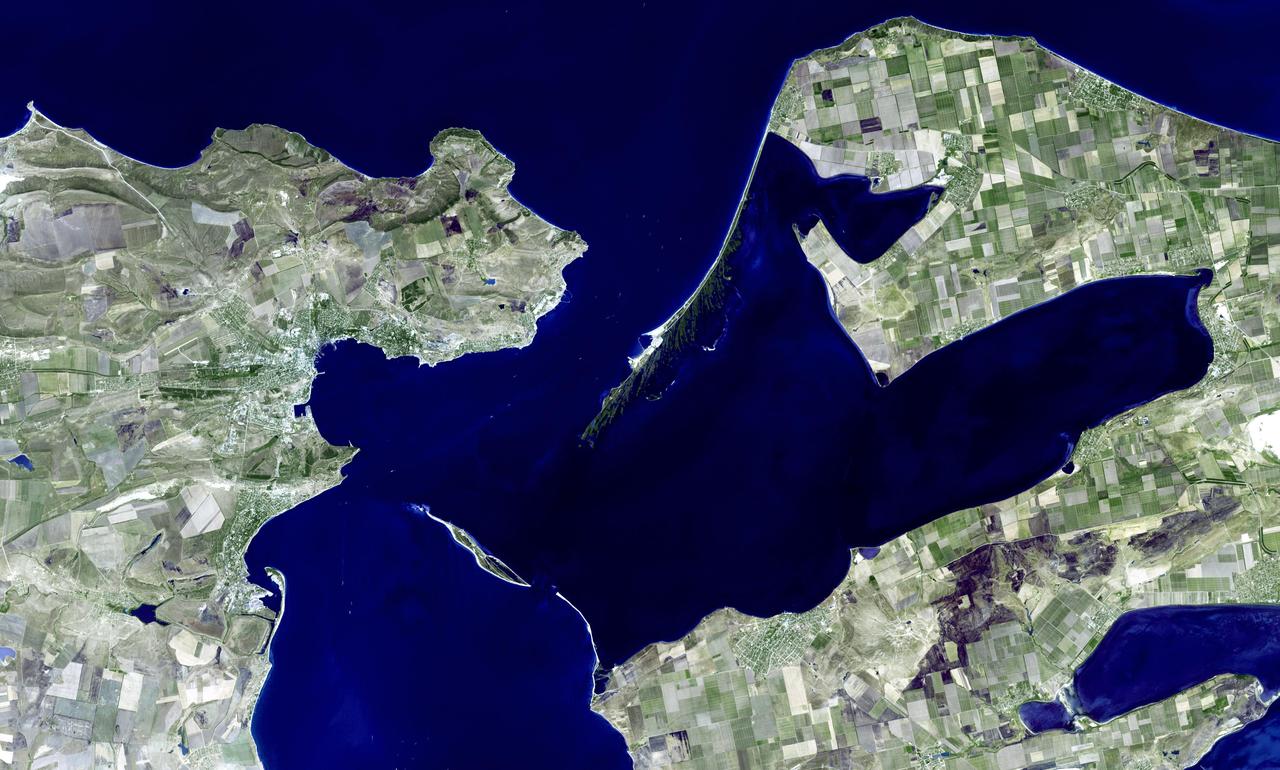
This image, from NASA Advanced Spaceborne Thermal Emission and Reflection Radiometer instrument aboard Terra, shows Kerch, one of the most ancient cities of the Ukraine.
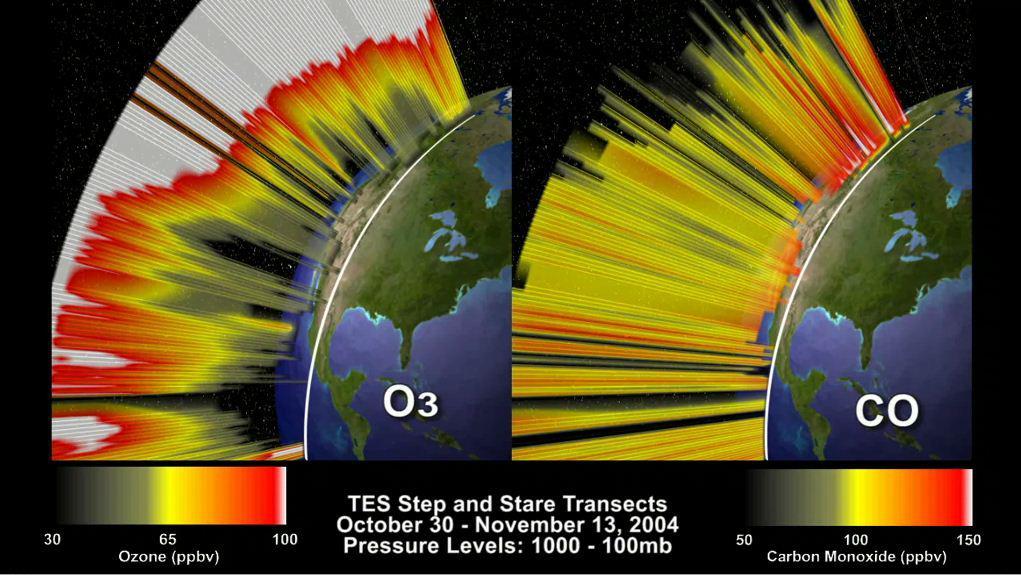
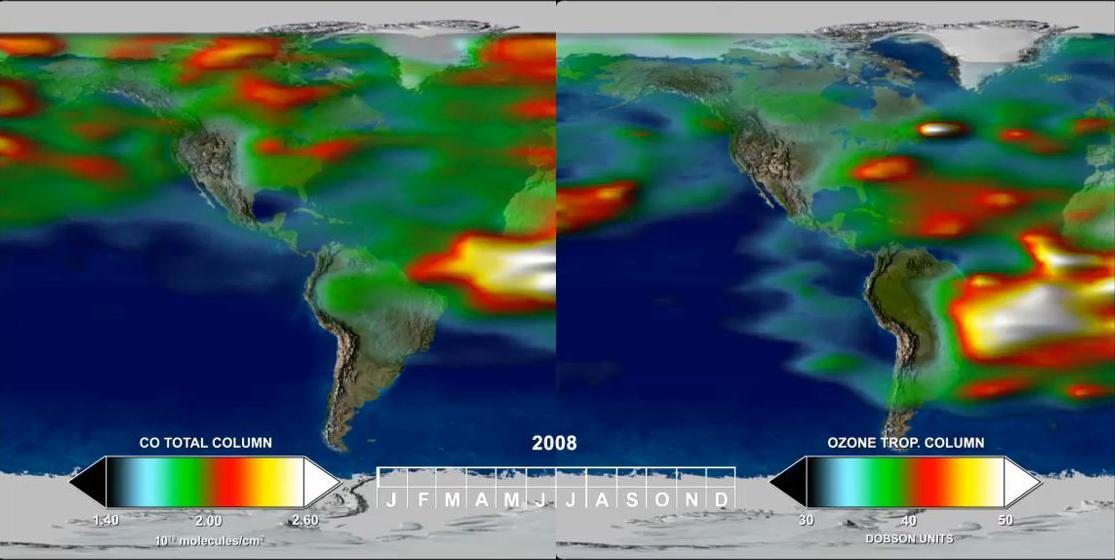
This frame from an animation depicts the distribution of O3 and CO in the atmosphere over North America. This visualization is based on data acquired by NASA Tropospheric Emission Spectrometer TES.
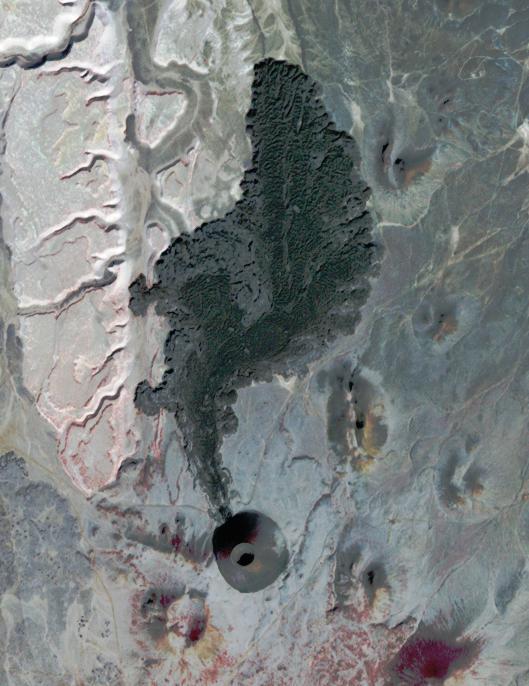
SP Crater, a volcanic cone and flow in Arizona, is visible in this image obtained by the Advanced Spaceborne Thermal Emission and Reflection Radiometer ASTER instrument on NASA Terra spacecraft.
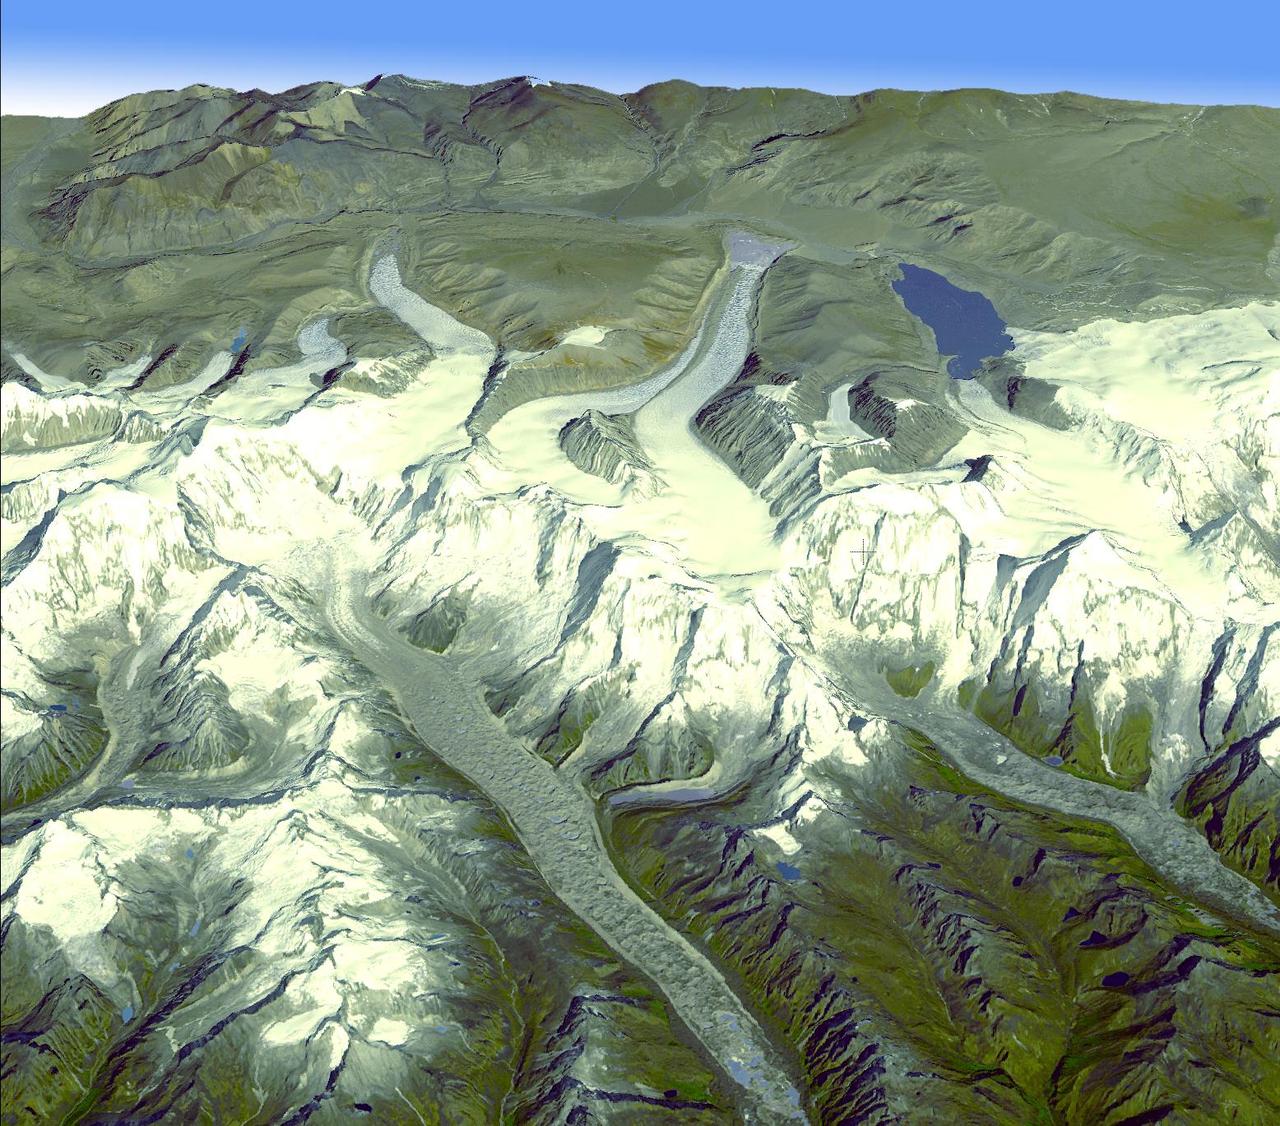
Onboard NASA Terra spacecraft, the Advanced Spaceborne Thermal Emission and Reflection Radiometer data have revealed significant spatial variability in glacier flow in the Bhutan Himalayas.
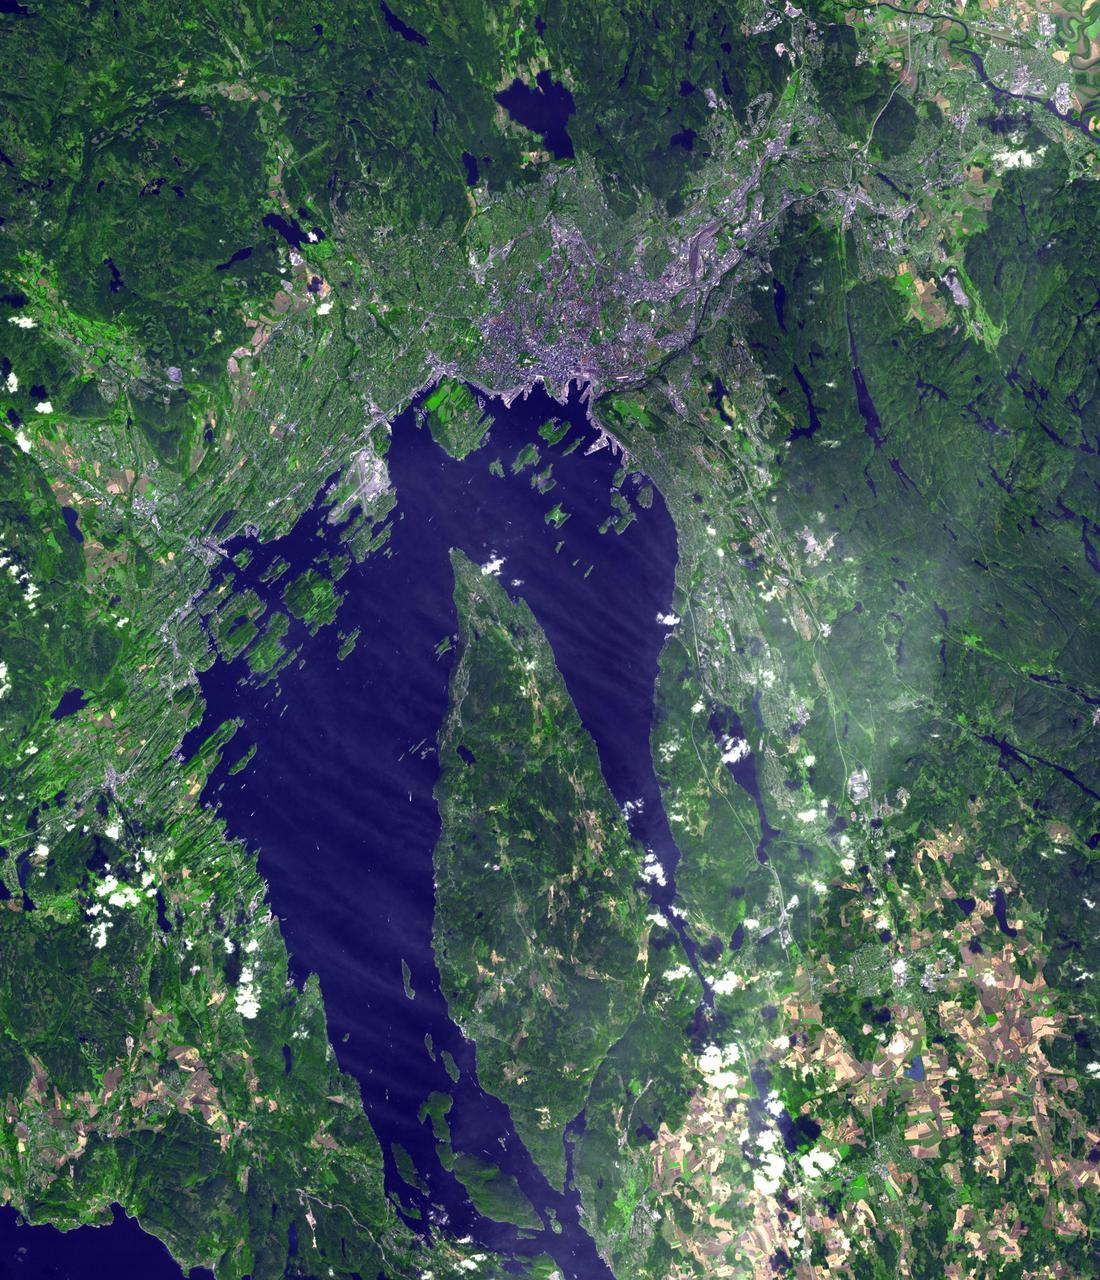
Oslo, the capital and largest city in Norway, as seen by the Advanced Spaceborne Thermal Emission and Reflection Radiometer instrument aboard NASA Terra spacecraft.
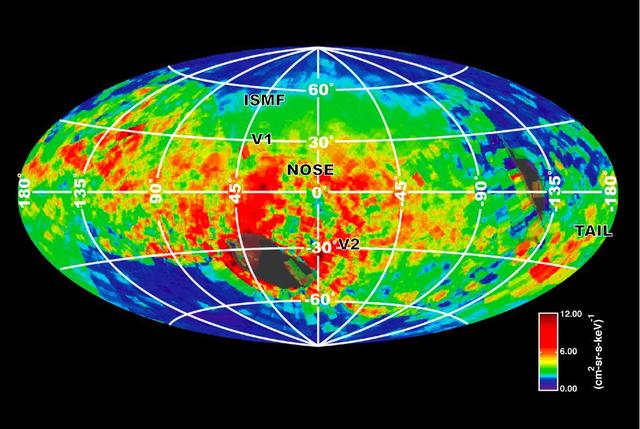
NASA Cassini spacecraft created this image of the bubble around our solar system based on emissions of particles known as energetic neutral atoms.

This picture shows both a visible and a thermal infrared image taken by the thermal emission imaging system on NASA Mars Odyssey spacecraft on November 2, 2001.
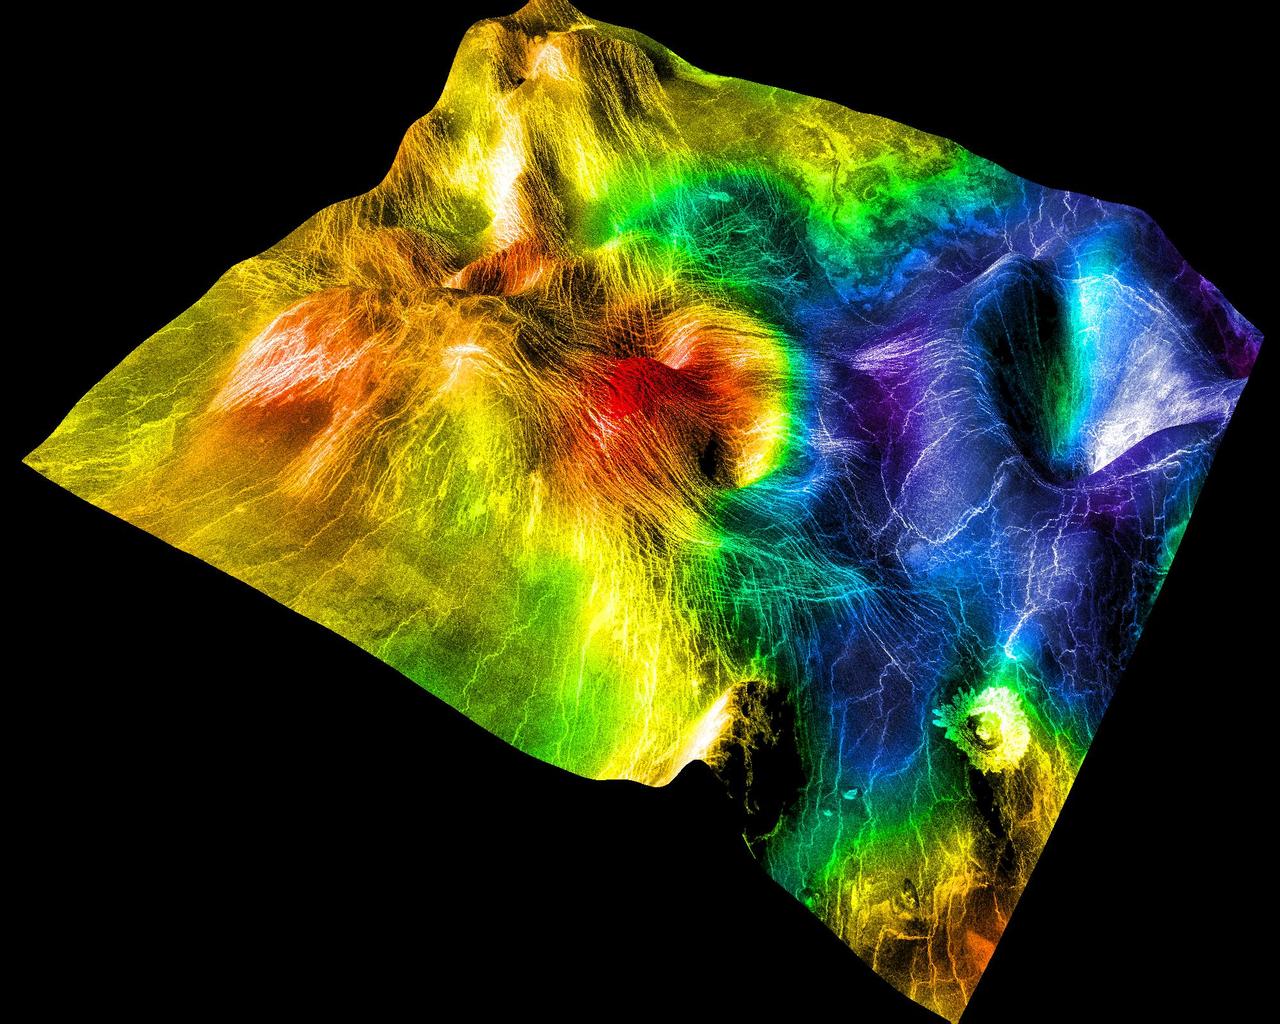
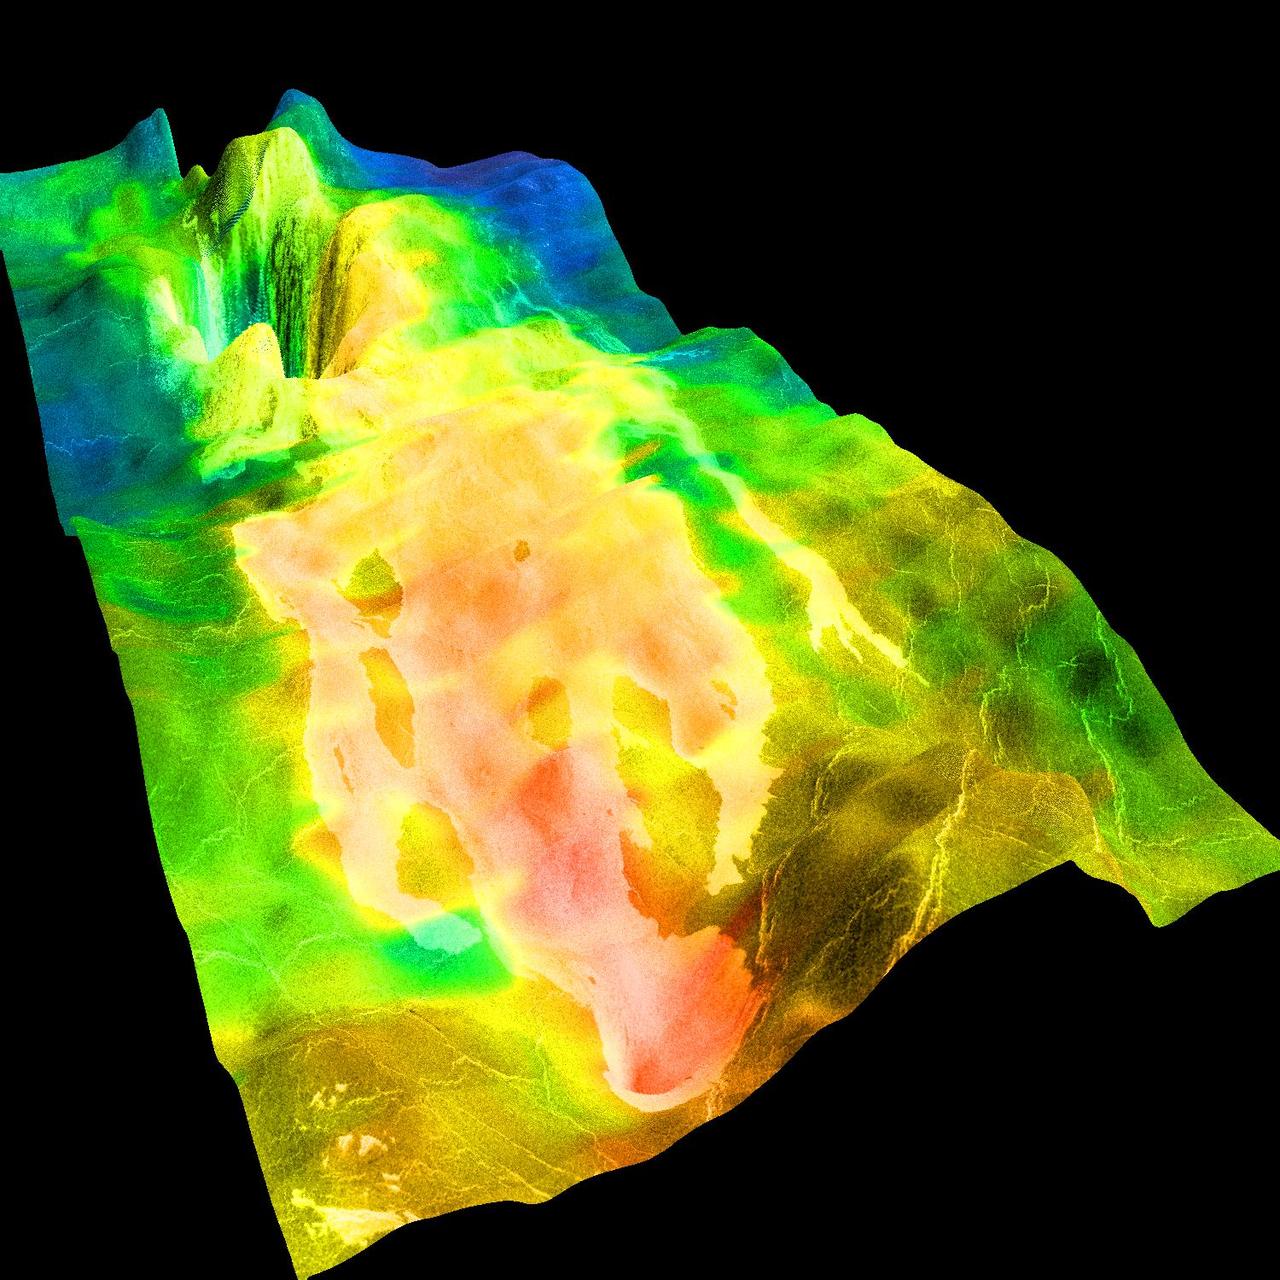
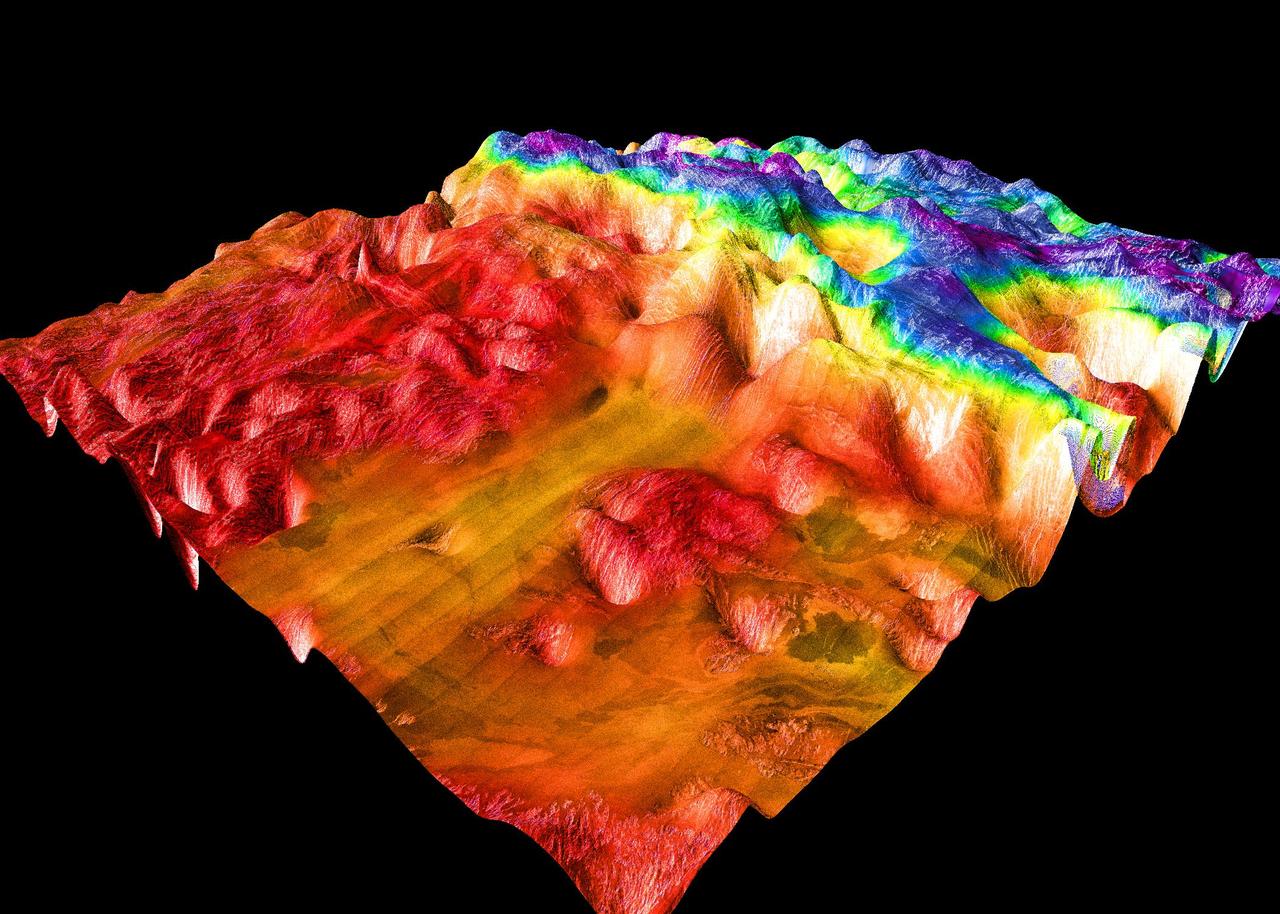
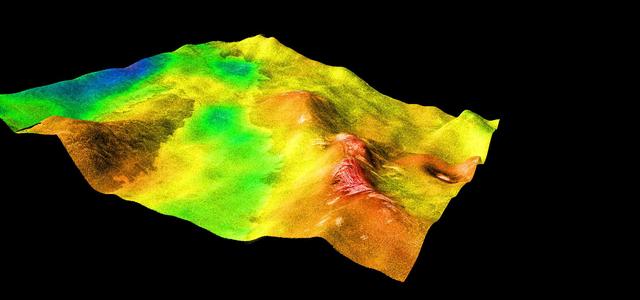
This perspective view of Venus, generated by computer from NASA Magellan data and color-coded with emissivity, shows part of the lowland plains in Sedna Planitia. http://photojournal.jpl.nasa.gov/catalog/PIA00307
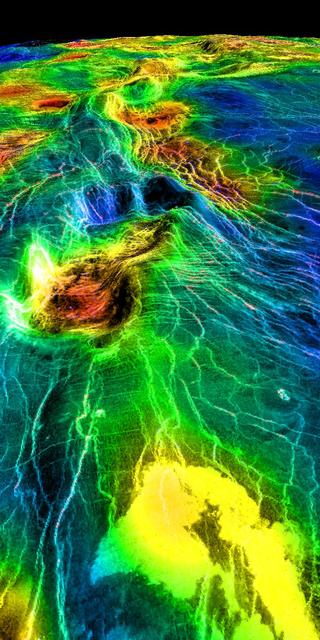
This perspective view of Venus, generated by computer from NASA Magellan data and color-coded with emissivity, shows part of the lowland plains in Sedna Planitia. http://photojournal.jpl.nasa.gov/catalog/PIA00314
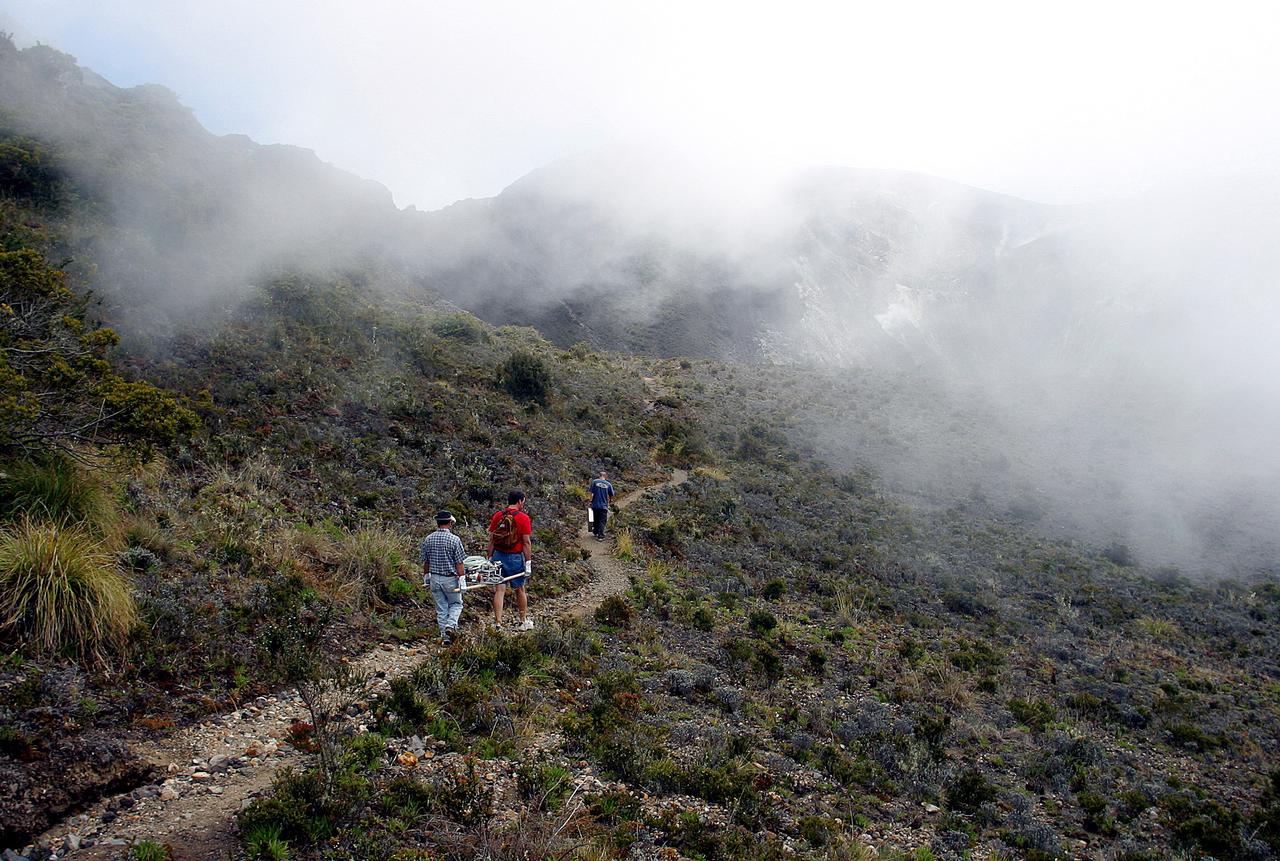
KENNEDY SPACE CENTER, FLA. - Arturo Ramierez, Charles Curley and Duke Follistein, KSC and Costa Rican researchers, carry the hazardous gas detection system AVEMS to the central of the Turrialba volcano. The Aircraft-based Volcanic Emission Mass Spectrometer determines the presence and concentration of various chemicals. It is being tested in flights over the Turrialba volcano and in the crater, sampling and analyzing fresh volcanic gases in their natural chemical state. The AVEMS system has been developed for use in the Space Shuttle program, to detect toxic gas leaks and emissions in the Shuttle’s aft compartment and the crew compartment.

KENNEDY SPACE CENTER, FLA. - Reporters at the dedication ceremony of a NASA hangar at the San Jose, Costa Rica, airport observe the WB-57f takeoff for its sixth Costa Rican flight. KSC and NASA researchers are testing the Aircraft-based Volcanic Emission Mass Spectrometer (AVEMS) that determines the presence and concentration of various chemicals. It is being tested in flights over the Turrialba volcano in Costa Rica, and in the crater, sampling and analyzing fresh volcanic gases in their natural chemical state. The AVEMS system has been developed for use in the Space Shuttle program, to detect toxic gas leaks and emissions in the Shuttle’s aft compartment and the crew compartment.

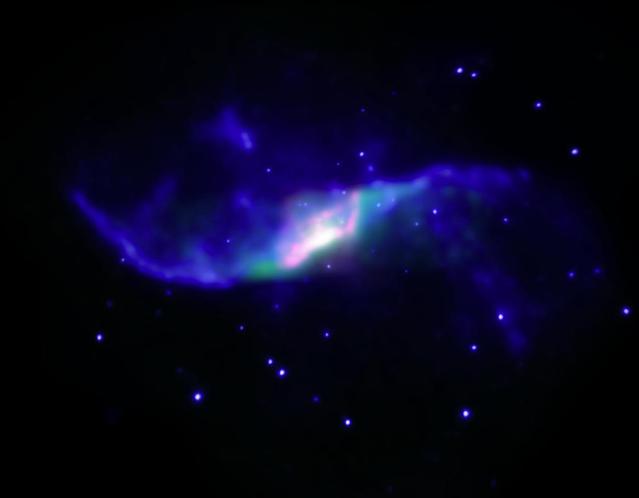
This image of the active galaxy Centaurus A was taken by NASA's Galaxy Evolution Explorer on June 7, 2003. The galaxy is located 30 million light-years from Earth and is seen edge on, with a prominent dust lane across the major axis. In this image the near ultraviolet emission is represented as green, and the far ultraviolet emission as blue. The galaxy exhibits jets of high energy particles, which were traced by the X-ray emission and measured by NASA's Chandra X-ray Observatory. These X-ray emissions are seen as red in the image. Several regions of ultraviolet emission can be seen where the jets of high energy particles intersect with hydrogen clouds in the upper left corner of the image. The emission shown may be the result of recent star formation triggered by the compression of gas by the jet. http://photojournal.jpl.nasa.gov/catalog/PIA04624
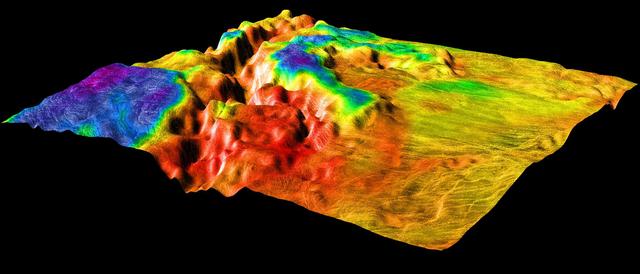
This perspective view of Venus, generated by computer from NASA Magellan data and color-coded with emissivity, shows the boundary between the lowland plains and characteristic Venusian highland terrain in Ovda Region. http://photojournal.jpl.nasa.gov/catalog/PIA00311
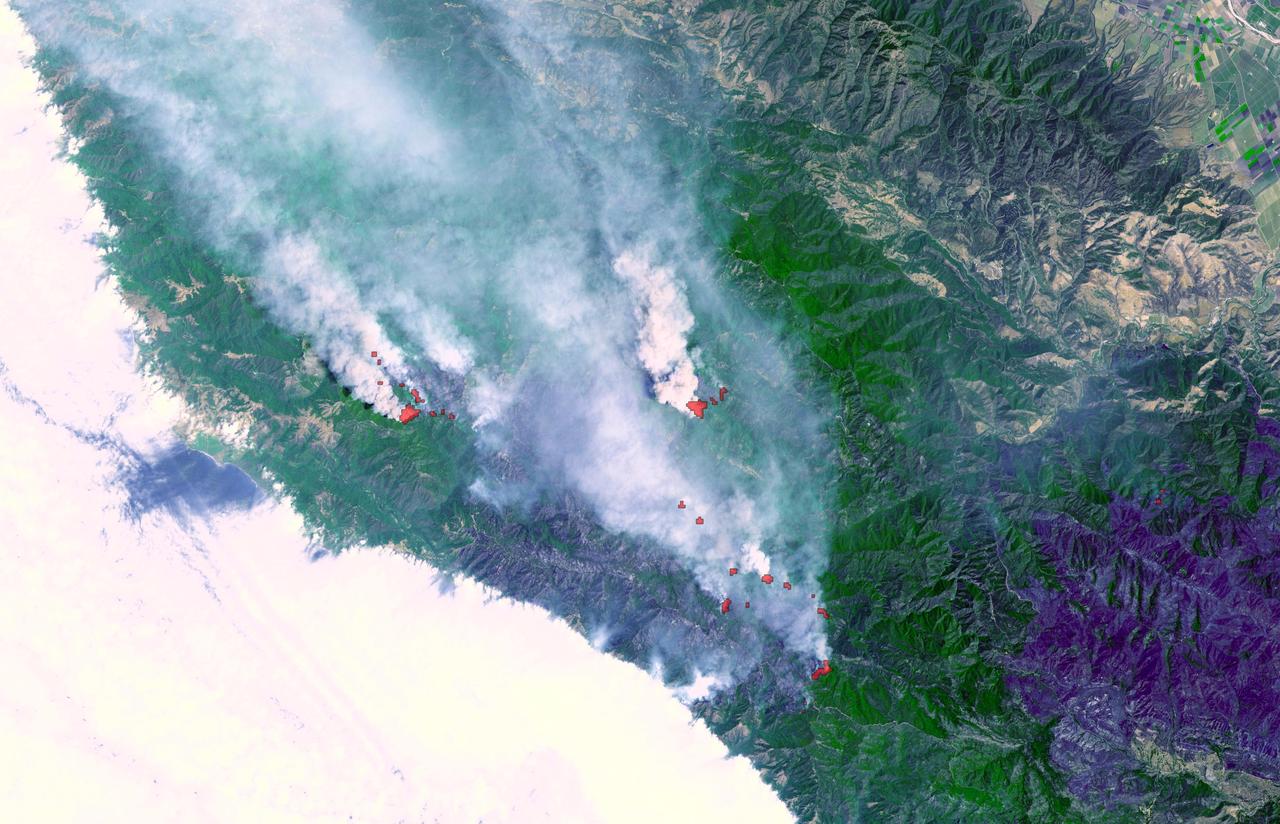
Fires near Big Sur, Calif., continued to burn unchecked when the Advanced Spaceborne Thermal Emission and Reflection Radiometer ASTER instrument on NASA Terra satellite captured this image on Sunday, June 29, 2008.
On the night of March 25, 2008, the Advanced Spaceborne Thermal Emission and Reflection Radiometer instrument on NASA Terra satellite captured these thermal infrared images of Kilauea volcano on Hawaii Big Island. Kilauea was active at two locations.
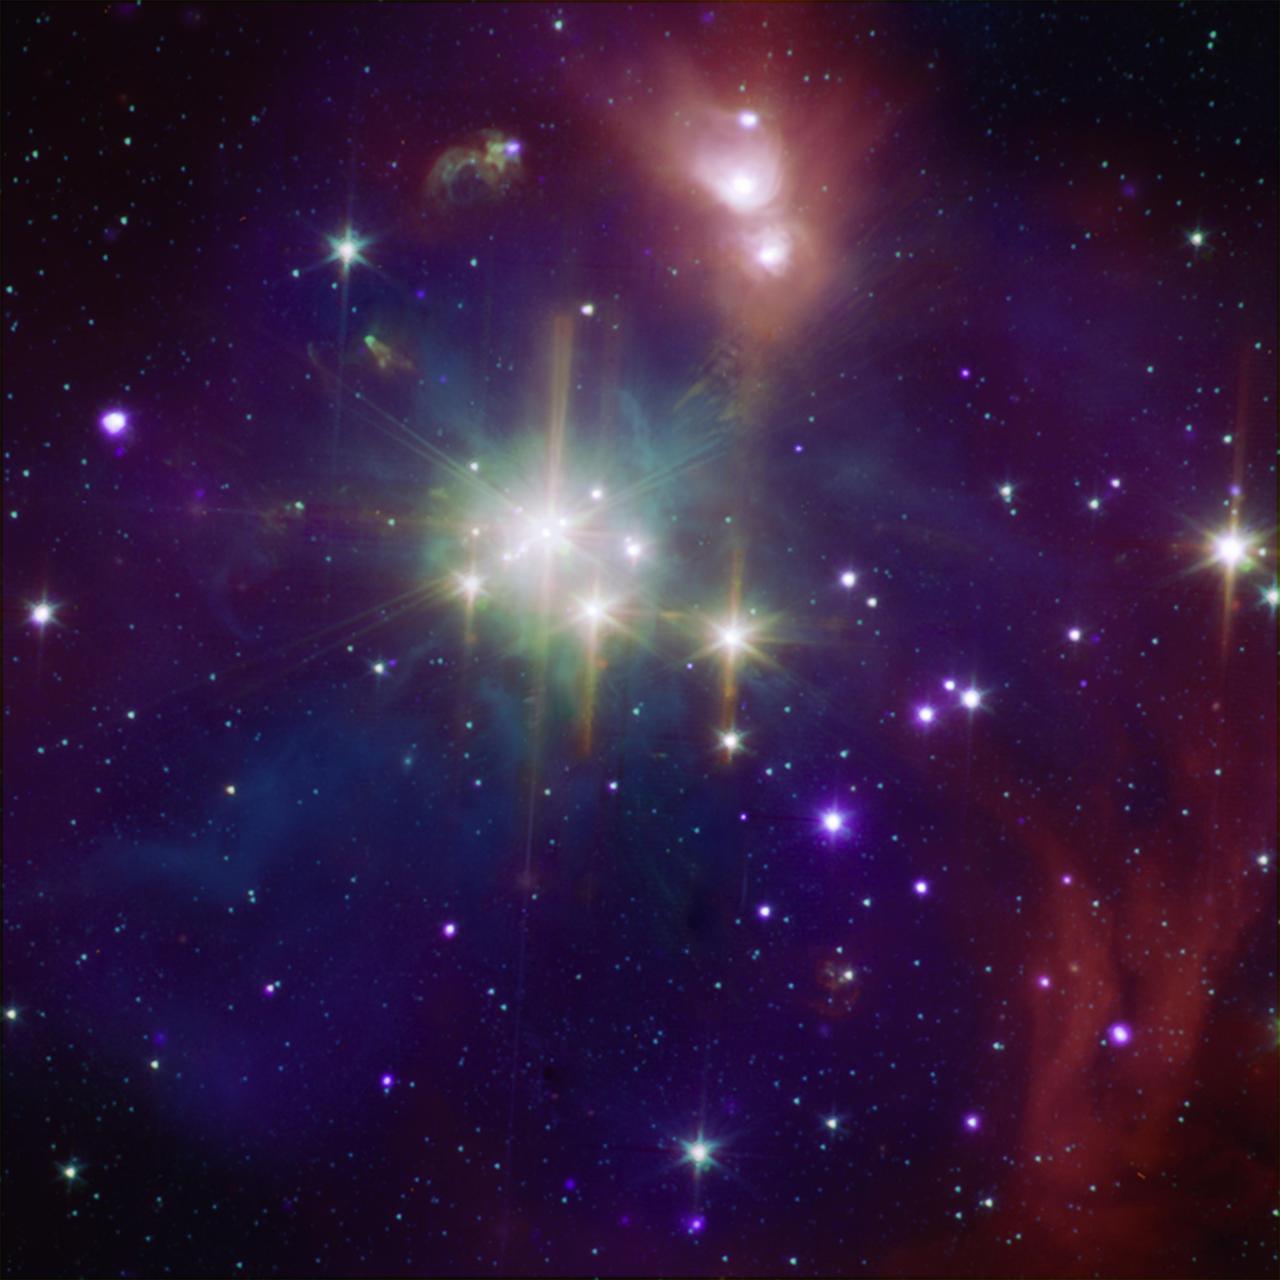
This composite image shows the Coronet in X-rays from Chandra and infrared from NASA Spitzer Space Telescope orange, green, and cyan. The Spitzer data show young stars plus diffuse emission from dust.
This perspective view of Venus, generated by computer from NASA Magellan data and color-coded with emissivity, shows the impact crater Markham, named after the English aviator Beryl Markham. http://photojournal.jpl.nasa.gov/catalog/PIA00312
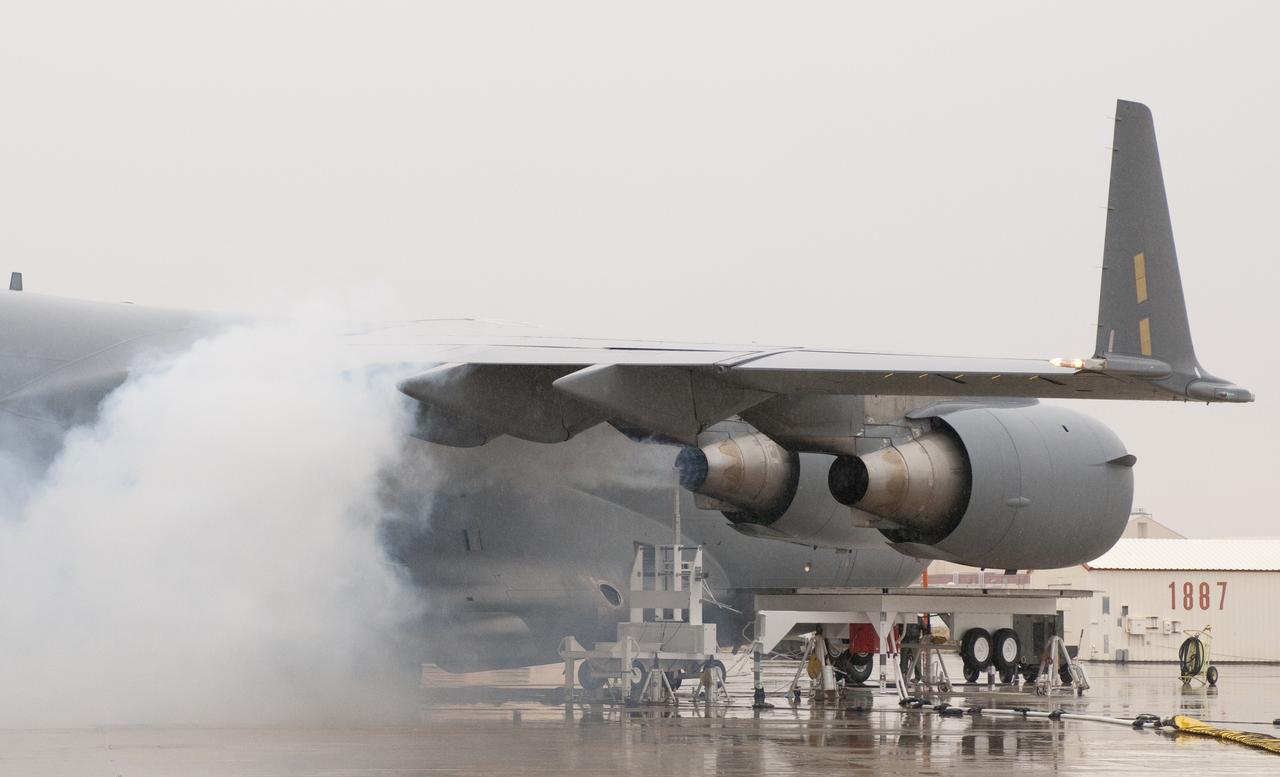
Oil smoke billows from the right inboard engine of the C-17 while a probe collects emissions data during 2011 VIPR engine health monitoring tests.
JPL Advanced Spaceborne Thermal Emission and Reflection Radiometer aboard NASA Terra satellite captured this simulated natural color image of the Station fire, burning in the San Gabriel Mountains.
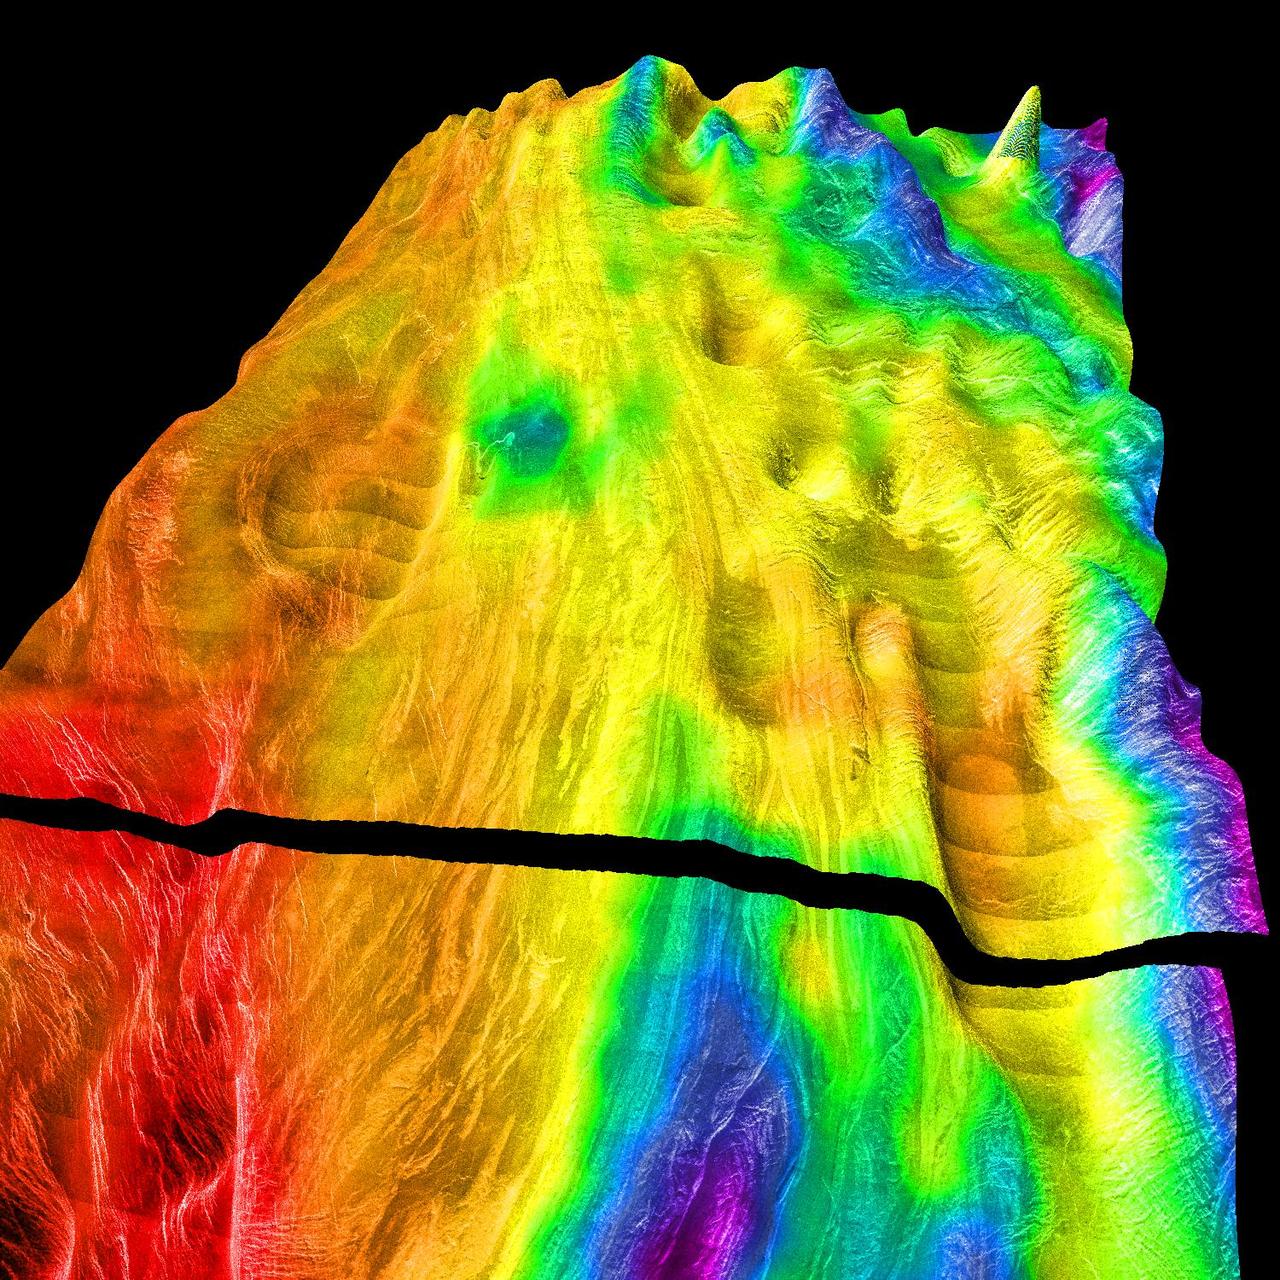
NASA and Japan Ministry of Economy, Trade and Industry METI released the Advanced Spaceborne Thermal Emission and Reflection Radiometer ASTER Global Digital Elevation Model GDEM to the worldwide public on June 29, 2009.
This perspective view of Venus, generated by computer from NASA Magellan data and color-coded with emissivity, shows the boundary between the lowland plains and characteristic Venusian highland terrain in Ovda Regio. http://photojournal.jpl.nasa.gov/catalog/PIA00309
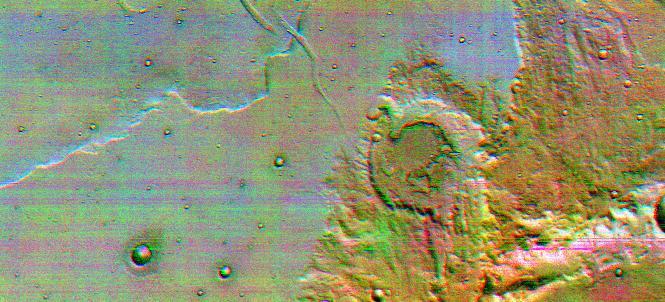
This is the first high-resolution color infrared image taken of Mars. The image was constructed using three of the ten infrared filters on the thermal emission imaging system of NASA Mars Odyssey spacecraft.
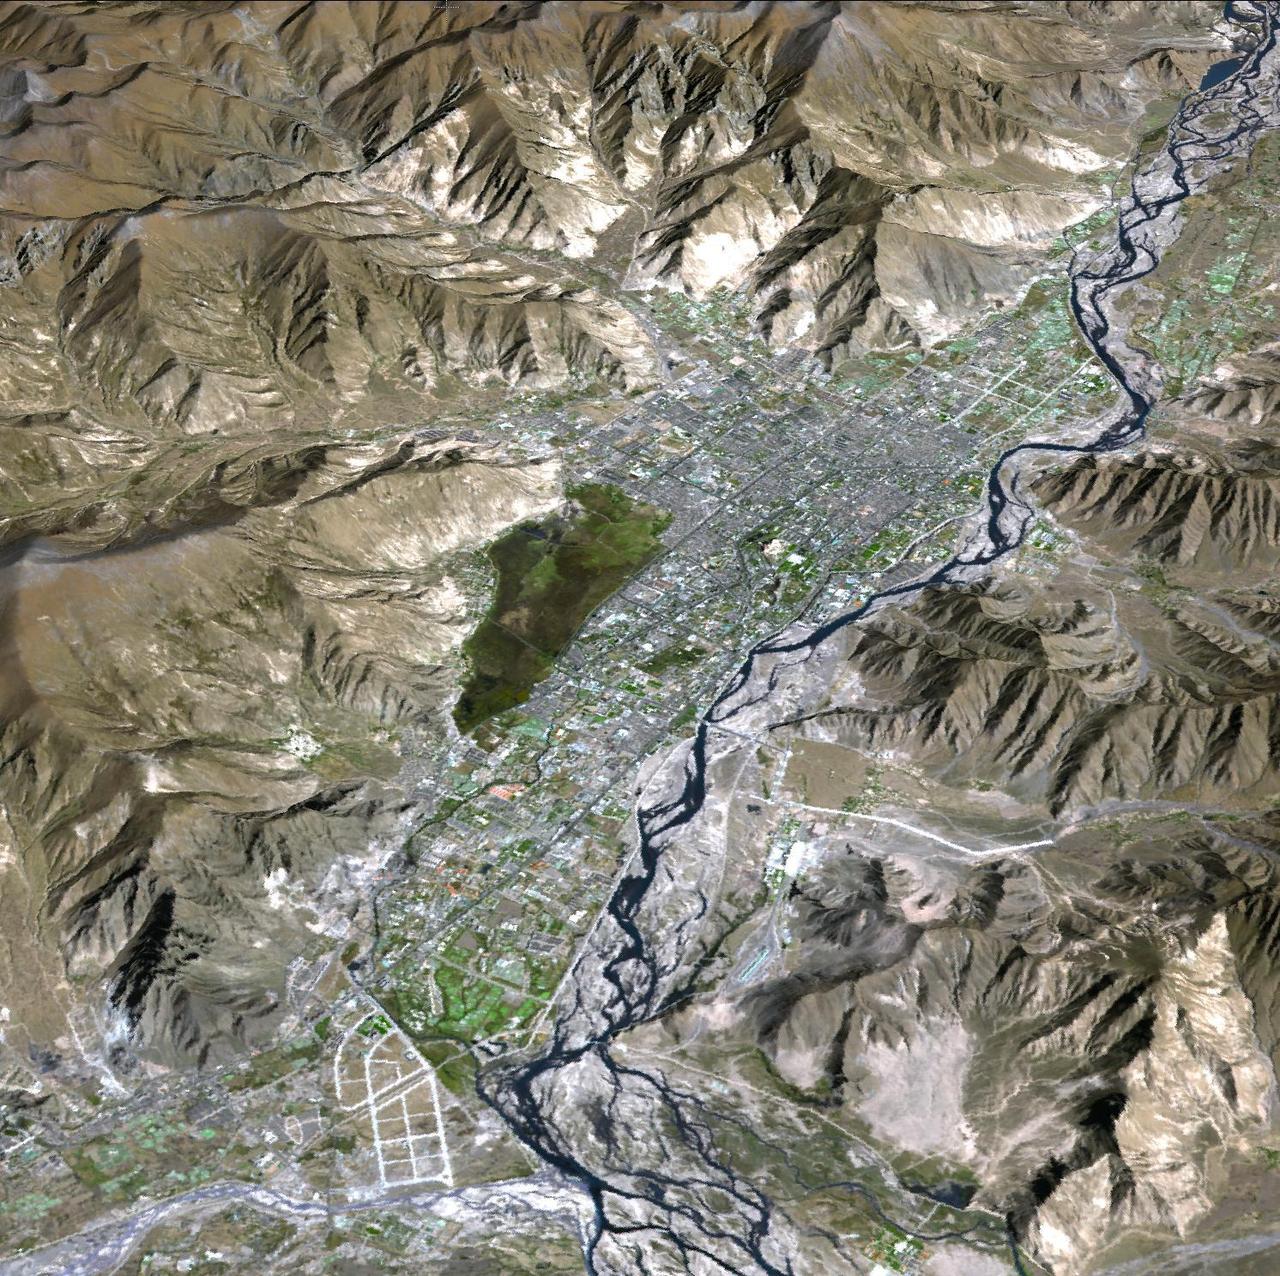
JPL Advanced Spaceborne Thermal Emission and Reflection Radiometer aboard NASA Terra satellite, shows Lhasa, the traditional seat of the Dalai Lama and capital of the Tibet Autonomous Region in China.
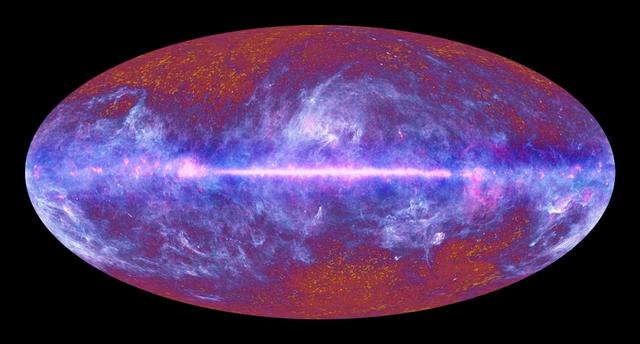
This image of the microwave sky was synthesized using data spanning the range of light frequencies detected by ESA Planck. A vast portion of the sky is dominated by the diffuse emission from gas and dust in our Milky Way galaxy.
This perspective view of Venus, generated by computer from NASA Magellan data and color-coded with emissivity, shows the boundary between the lowland plains and characteristic Venusian highland terrain in Ovda Regio. http://photojournal.jpl.nasa.gov/catalog/PIA00310
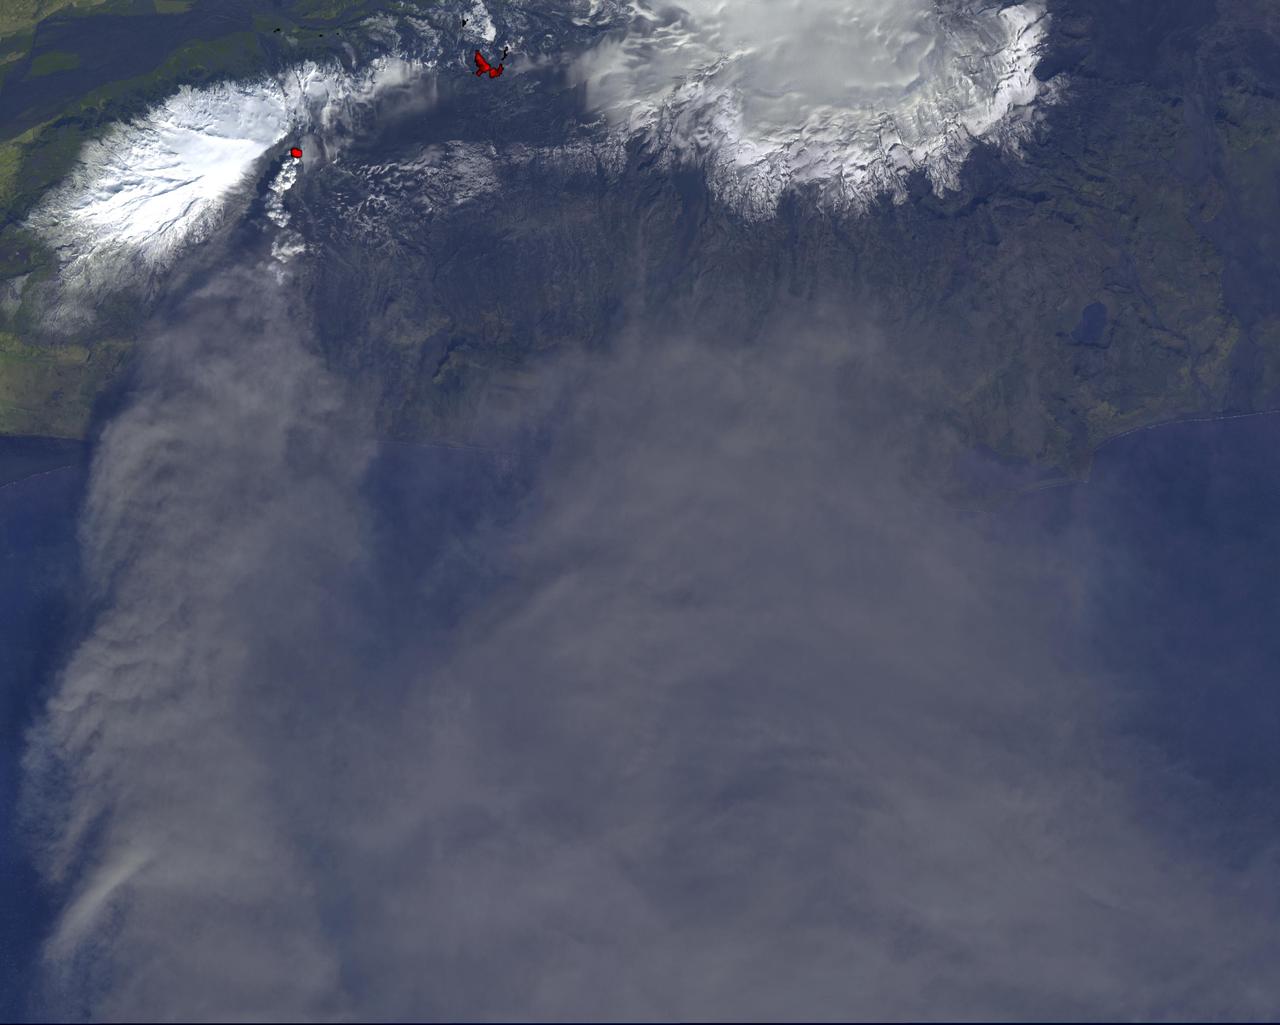
On Monday, April 19, 2010, the Advanced Spaceborne Thermal Emission and Reflection Radiometer ASTER instrument onboard NASA Terra spacecraft obtained this image of the continuing eruption of Iceland Eyjafjallajökull volcano.
This perspective view of Venus, generated by computer from NASA Magellan data and color-coded with emissivity, is a look westward across the Fortuna Tessera toward the slopes of Maxwell Montes. http://photojournal.jpl.nasa.gov/catalog/PIA00316
Data from JPL Advanced Spaceborne Thermal Emission and Reflection Radiometer instrument on NASA Terra satellite provides views of the L.A. Basin, San Francisco Bay and more.
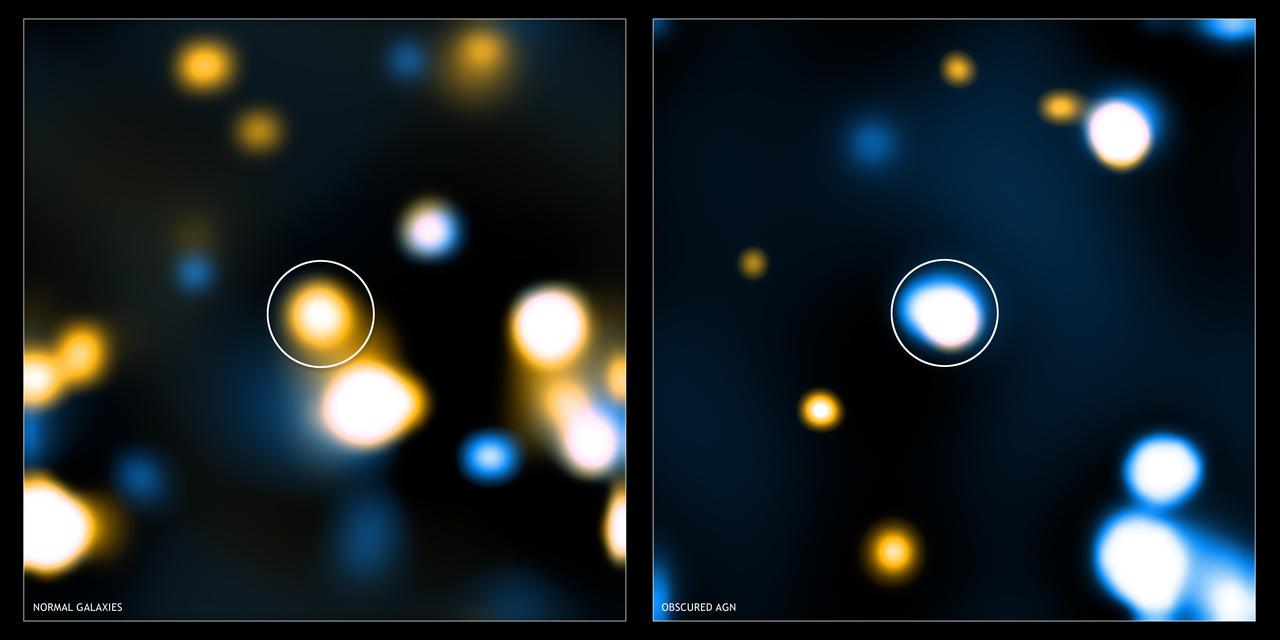
These two images show tacked Chandra images for two different classes of distant, massive galaxy detected with NASA Spitzer. Image stacking is a procedure used to detect emission from objects that is too faint to be detected in single images.
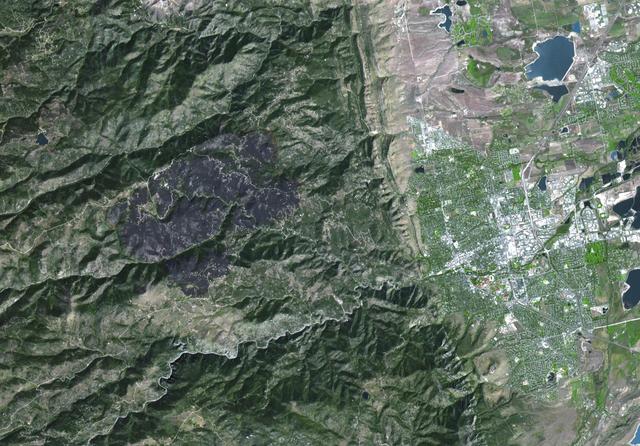
The Advanced Spaceborne Thermal Emission and Reflection Radiometer ASTER instrument aboard NASA Terra spacecraft captured this image of the Fourmile Canyon fire west of Boulder Colo., on Sept. 17, 2010; it was 100 percent contained.
Pastel colors swirl across Mars, revealing differences in the composition and nature of the surface in this false-color infrared image taken on May 22, 2009,by the Thermal Emission Imaging System THEMIS camera on NASA Mars Odyssey orbiter.

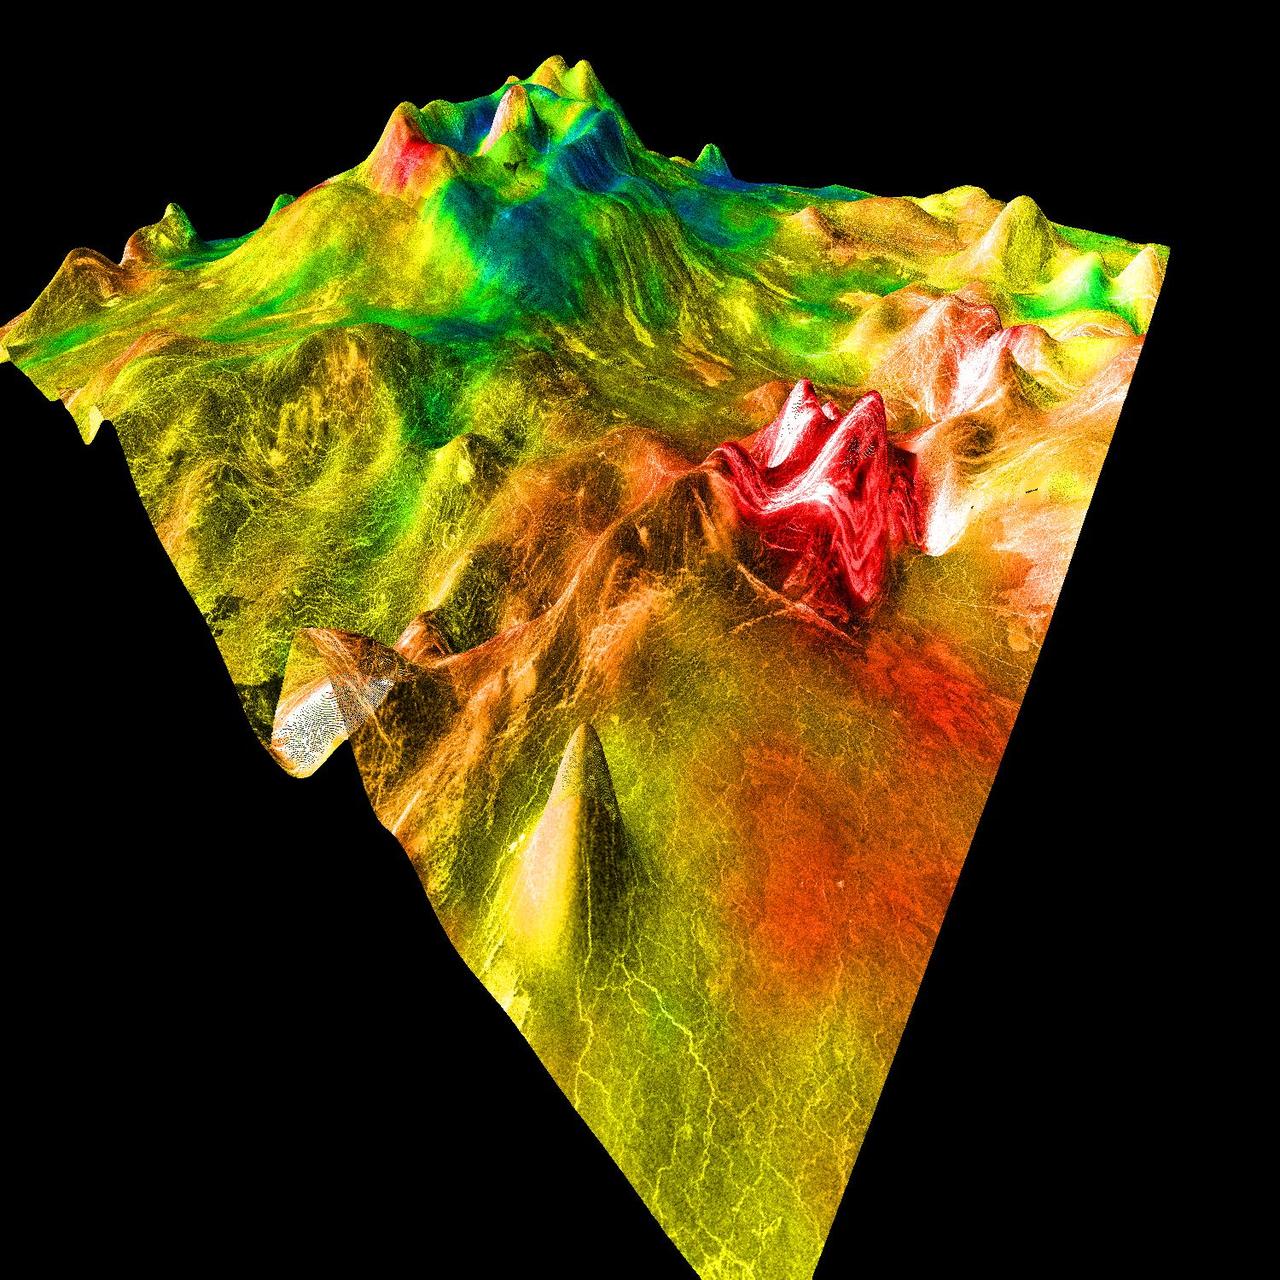
This vertical profile view from the Tropospheric Emission Spectrometer TES instrument on NASA Aura satellite depicts the distribution of water vapor molecules over Earth tropics across one transect of the satellite orbit on January 6, 2006.

Data from JPL Advanced Spaceborne Thermal Emission and Reflection Radiometer instrument on NASA Terra satellite provides views of the L.A. Basin, including Dodger Stadium, the L.A.X. airport and JPL.
JPL Advanced Spaceborne Thermal Emission and Reflection Radiometer aboard NASA Terra satellite captured this simulated natural color image of the Station fire burning in the San Gabriel Mountains.
This perspective view of Venus, generated by computer from NASA Magellan data and color-coded with emissivity, shows part of Sedna Planitia and illustrates a common phenomenon of the lowland plains of Venus. http://photojournal.jpl.nasa.gov/catalog/PIA00306

This image of the Eagle nebula shows the self-emission of the intensely cold nebula gas and dust as never seen before; the nebula intricate tendril nature, with vast cavities forms an almost cave-like surrounding to the famous pillars.
This perspective view of Venus, generated by computer from NASA Magellan data and color-coded with emissivity, is a look westward across the Fortuna Tessera toward the slopes of Maxwell Montes. http://photojournal.jpl.nasa.gov/catalog/PIA00315
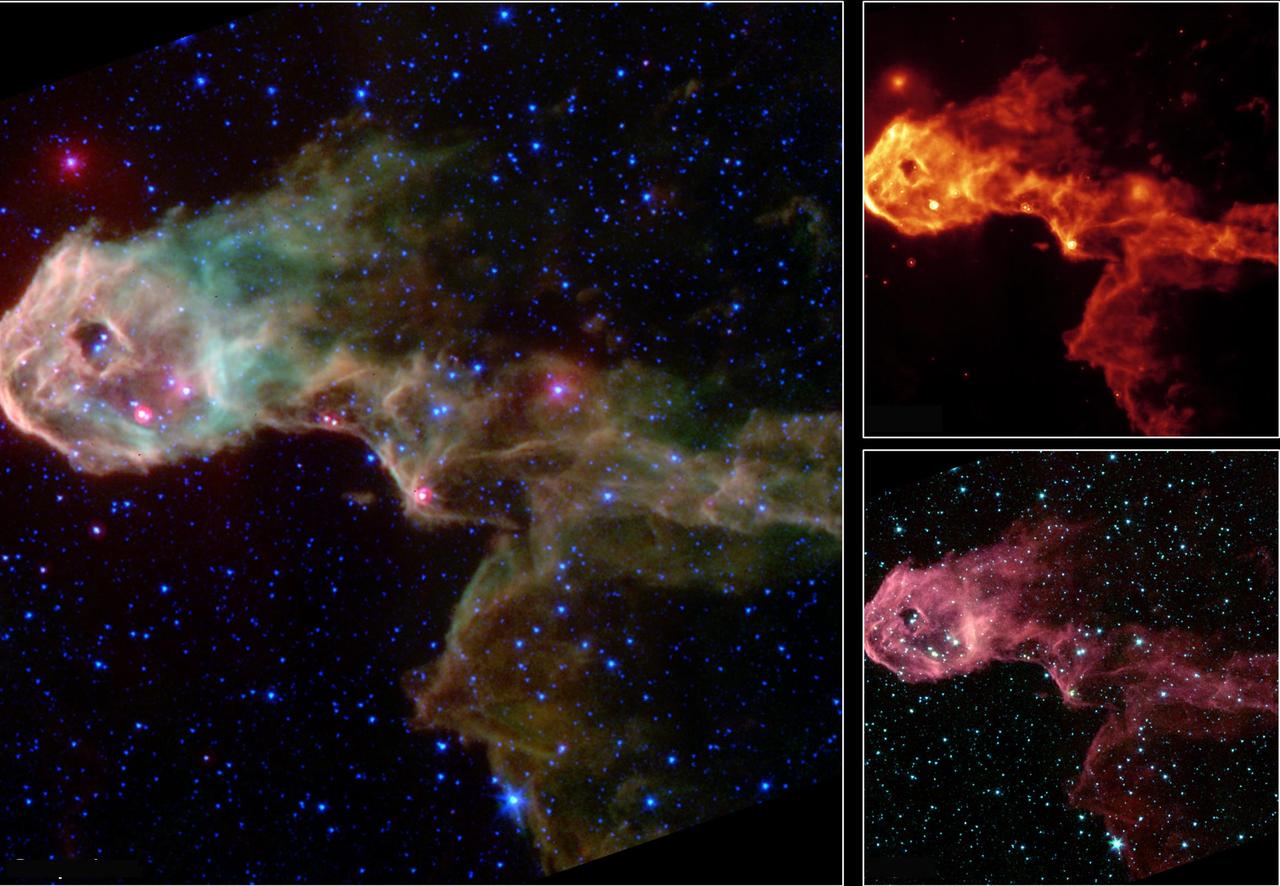
This archival image from 2003 captured by NASA Spitzer Space Telescope captured the Elephant Trunk Nebula, an elongated dark globule within the emission nebula IC 1396 in the constellation of Cepheus.
This perspective view of Venus, generated by computer from NASA Magellan data and color-coded with emissivity, shows part of the lowlands to the north of Ovda Regio. The prominent topographic feature is a shield volcano. http://photojournal.jpl.nasa.gov/catalog/PIA00308
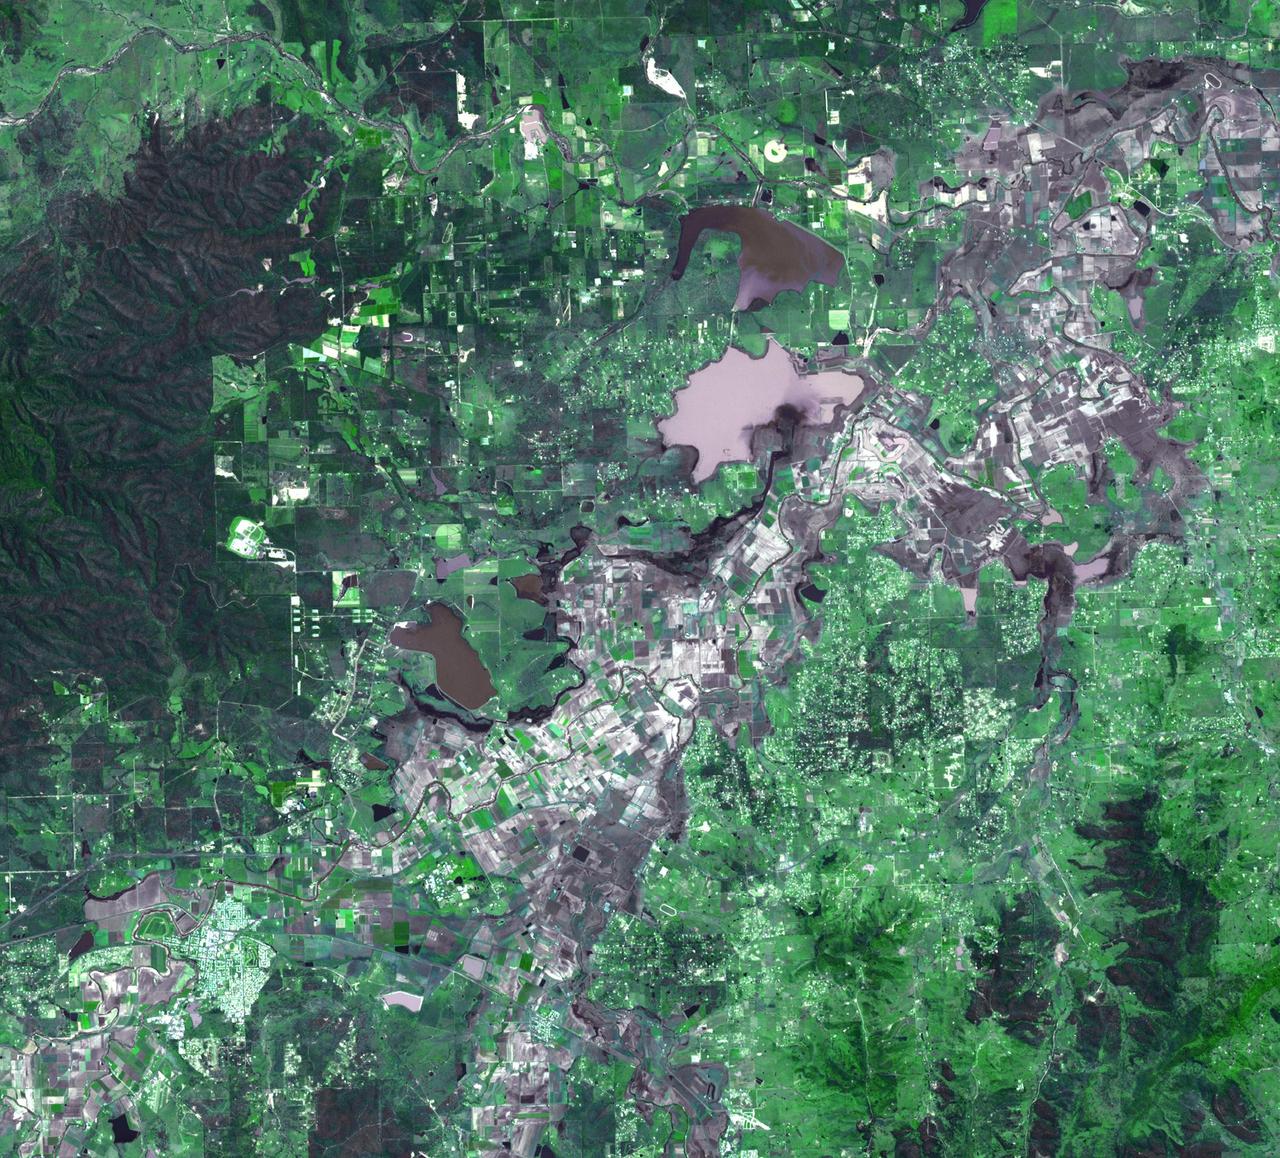
On January 17, 2011, the Advanced Spaceborne Thermal Emission and Reflection Radiometer ASTER instrument on NASA Terra spacecraft captured this image of the inundation west of Brisbane, Queensland, Australia.
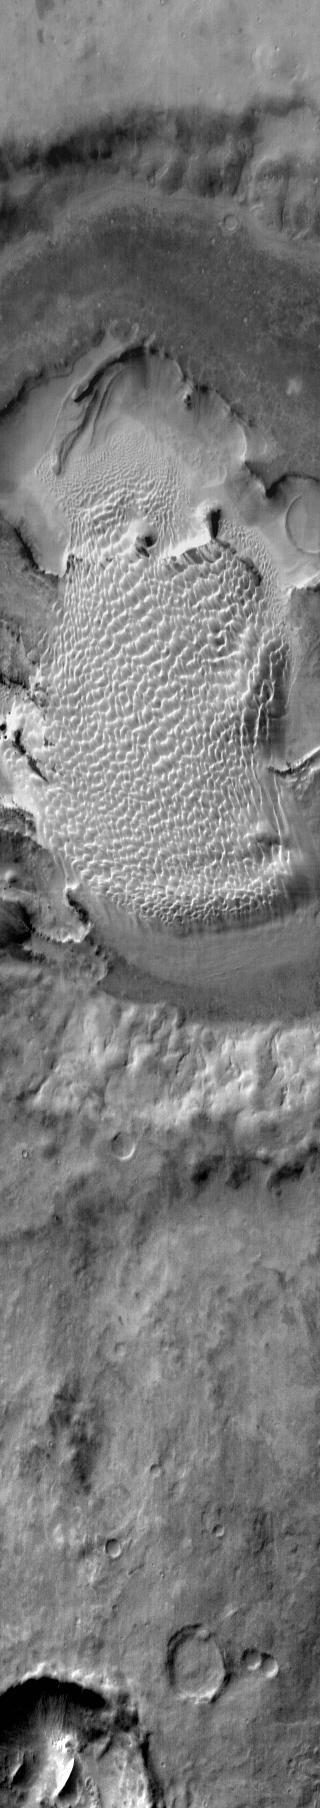
The Thermal Emission Imaging System aboard NASA Mars Odyssey captured this daytime infrared image of Rabe Crater shows the large dune field located within the crater. Note that the dunes are not confined to the lowest elevation depressions on the
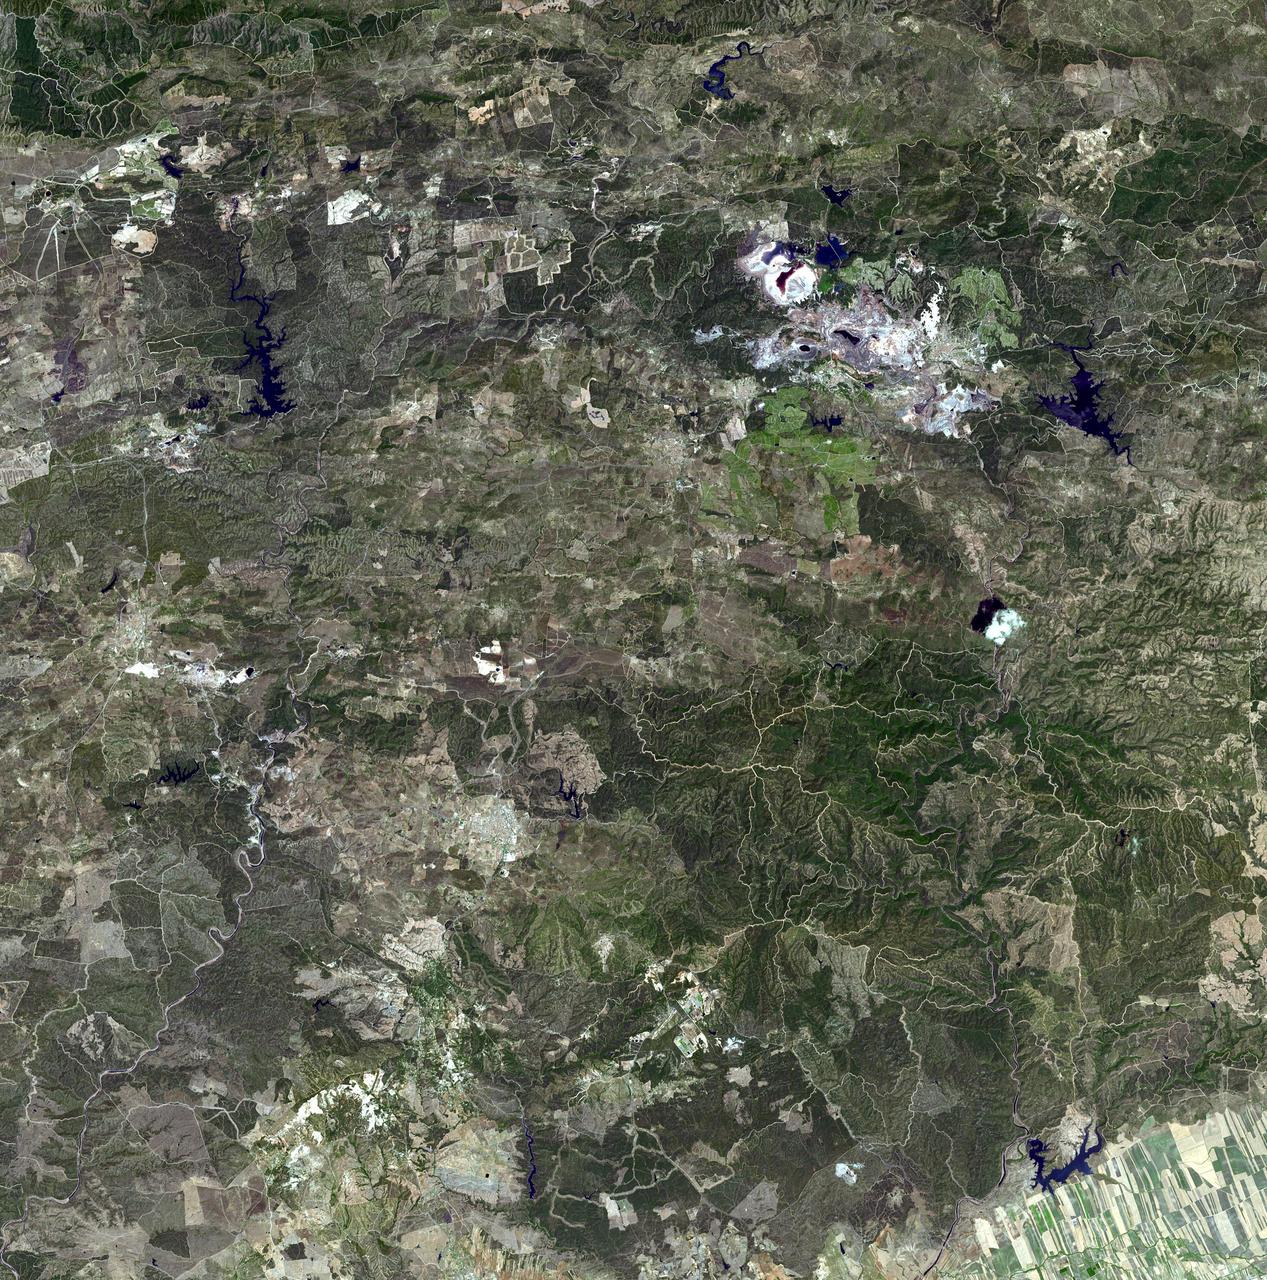
The Advanced Spaceborne Thermal Emission and Reflection Radiometer instrument aboard NASA Terra spacecraft captured this image of the Rio Tinto river in southwestern Spain which originates in the Sierra Morena mountains of Andalusia.
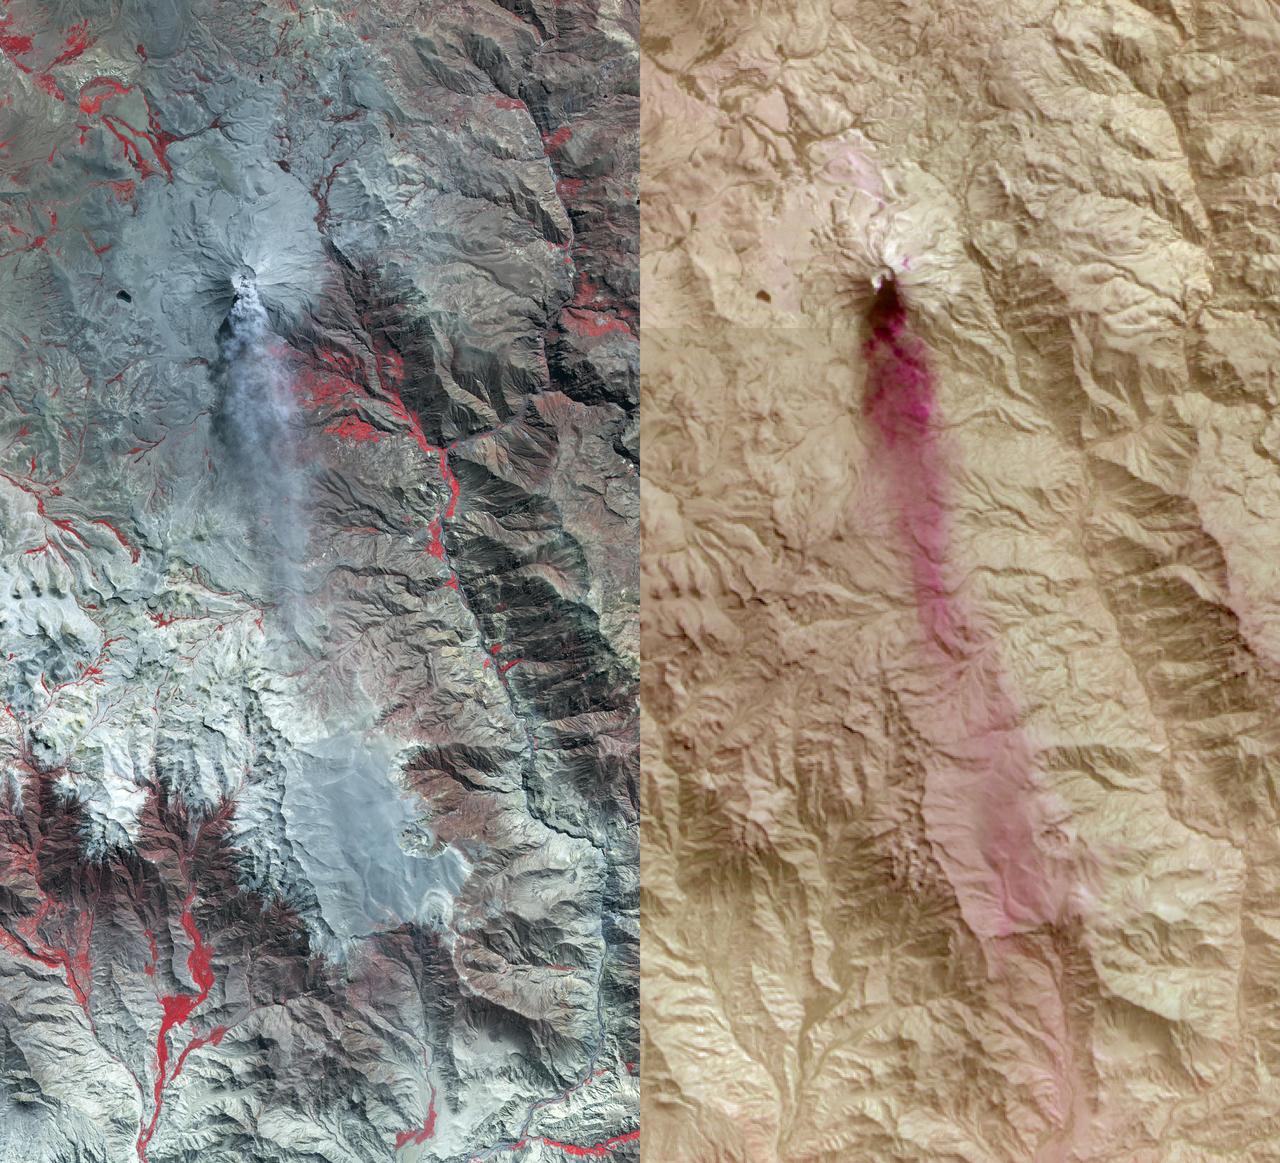
On April 28, 2014, NASA Terra spacecraft spotted signs of activity at Ubinas volcano in the Peruvian Andes. The appearance of a new lava dome in March 2014 and frequent ash emissions are signs of increasing activity at this volcano.
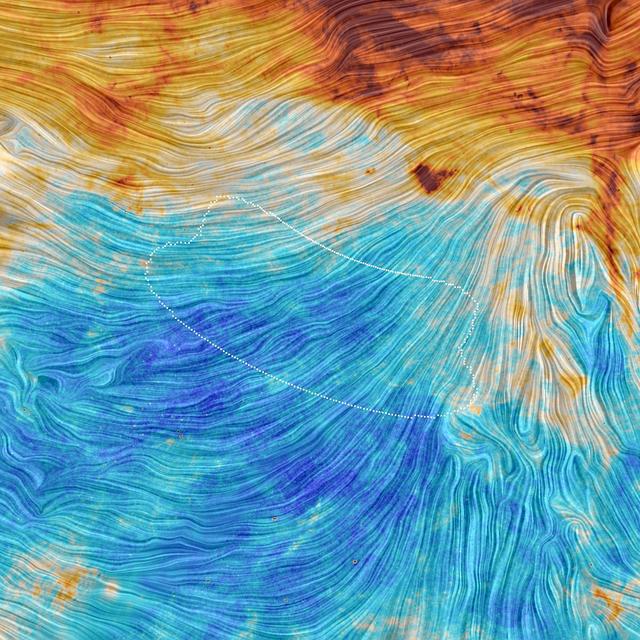
The color scale in this image from the Planck mission represents the emission from dust, a minor but crucial component that pervades our Milky Way galaxy. The texture indicates the orientation of the galactic magnetic field.
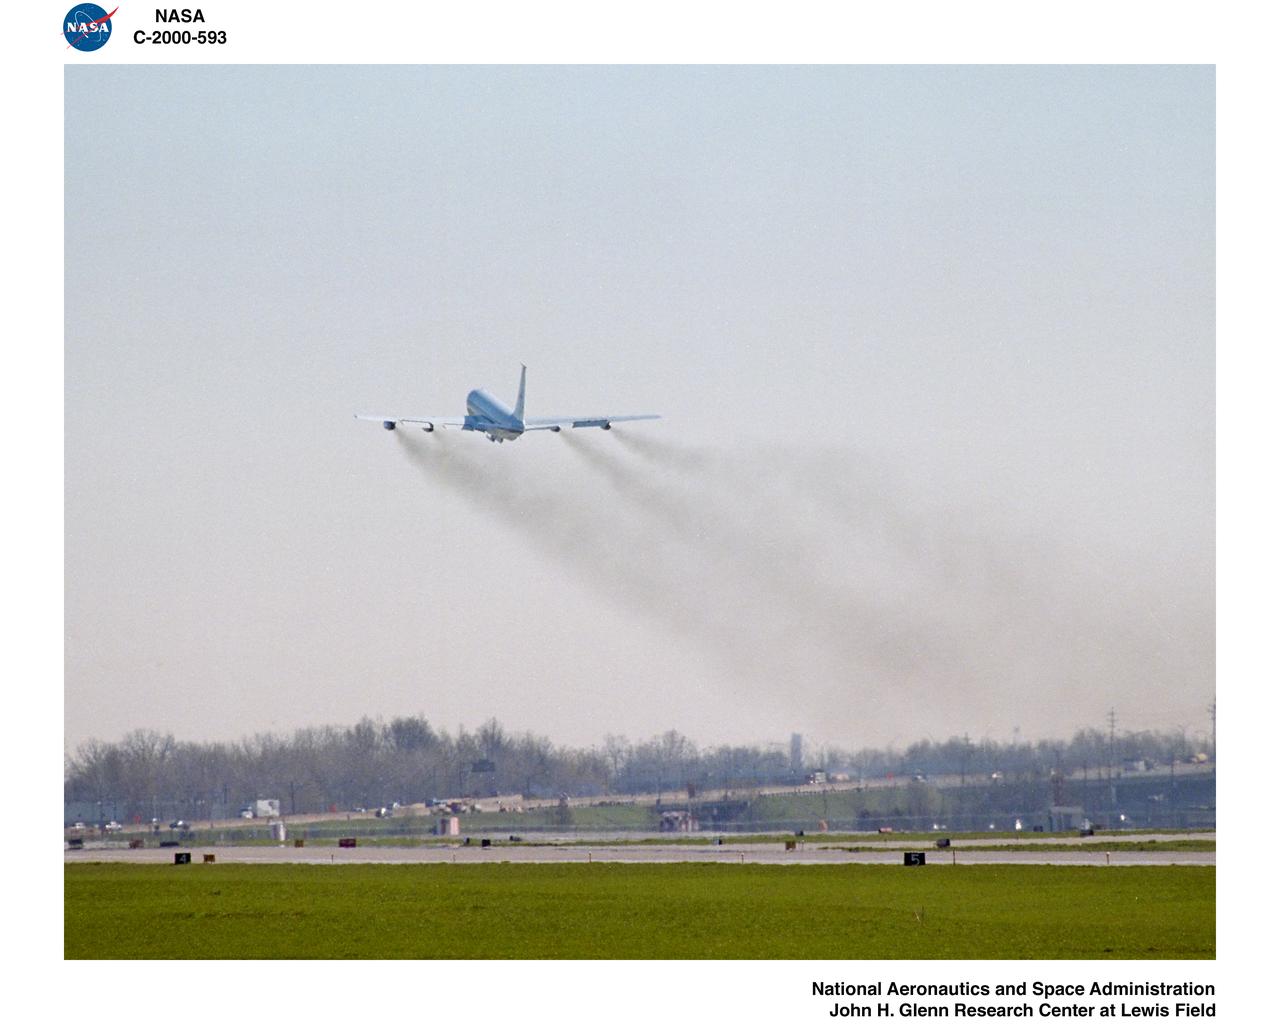
AIRCRAFT EXHAUST EMISSIONS FROM JET AIRCRAFT AND TRUCK

Engineers and technicians prepare the Carbon Mapper imaging spectrometer, which will measure the greenhouse gases methane and carbon dioxide from space, for vibration testing at NASA's Jet Propulsion Laboratory in Southern California in August 2023. This test is one of a series meant to ensure that the instrument can withstand the rigors of launch and the harsh conditions of space. Engineers subjected the spectrometer to intense vibrations similar to what it will endure atop a rocket blasting into orbit. The instrument was shipped from JPL to Planet Labs PBC in San Francisco on Sept. 12, 2023, where it will be integrated into a Tanager satellite. Designed and built by JPL, imaging spectrometer will be part of an effort led by the nonprofit Carbon Mapper organization to collect data on greenhouse gas point-source emissions. The information will help locate and quantify "super-emitters" – the small percentage of individual sources responsible for a significant fraction of methane and carbon dioxide emissions around the world. https://photojournal.jpl.nasa.gov/catalog/PIA26093
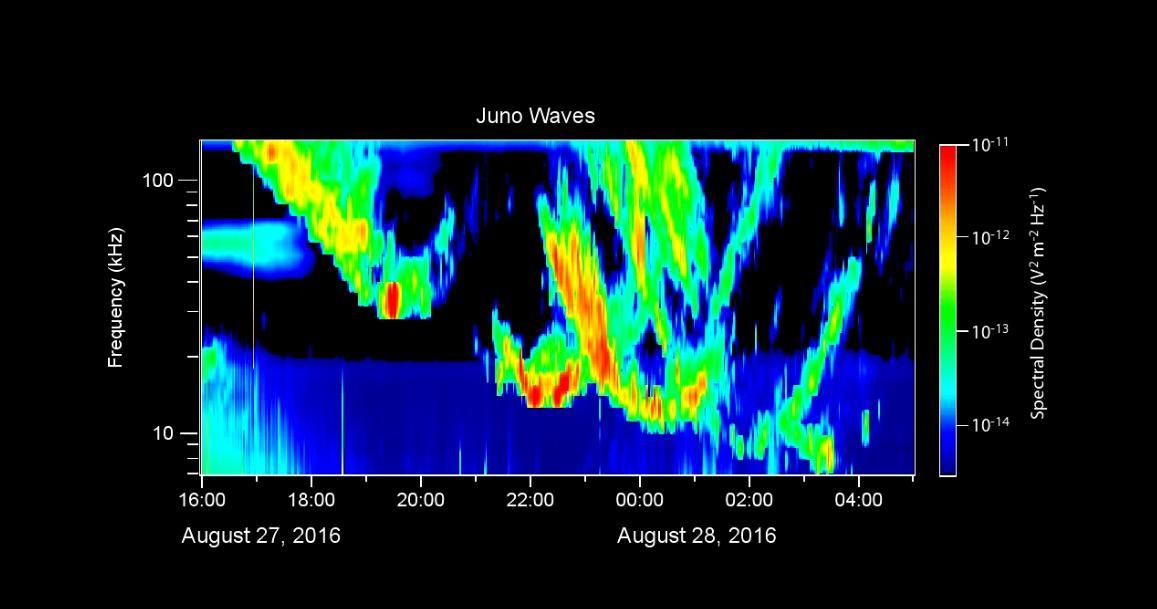
During its close flyby of Jupiter on August 27, 2016, the Waves instrument on NASA's Juno spacecraft received radio signals associated with the giant planet's very intense auroras. This video displays these radio emissions in a format similar to a voiceprint, showing the intensity of radio waves as a function of frequency and time. The largest intensities are indicated in warmer colors. The frequency range of these signals is from 7 to 140 kilohertz. Radio astronomers call these "kilometric emissions" because their wavelengths are about a kilometer long. The time span of this data is 13 hours, beginning shortly after Juno's closest approach to Jupiter. Accompanying this data display is an audio rendition of the radio emissions, shifted into a lower register since the radio waves are well above the audio frequency range. In the video, a cursor moves from left to right to mark the time as the sounds are heard. These radio emissions were among the first observed by early radio astronomers in the 1950s. However, until now, they had not been observed from closely above the auroras themselves. From its polar orbit vantage point, Juno has -- for the first time -- enabled observations of these emissions from very close range. The Juno team believes that Juno flew directly through the source regions for some of these emissions during this flyby, which was Juno's first with its sensors actively collecting data. A movie is available at http://photojournal.jpl.nasa.gov/catalog/PIA21037
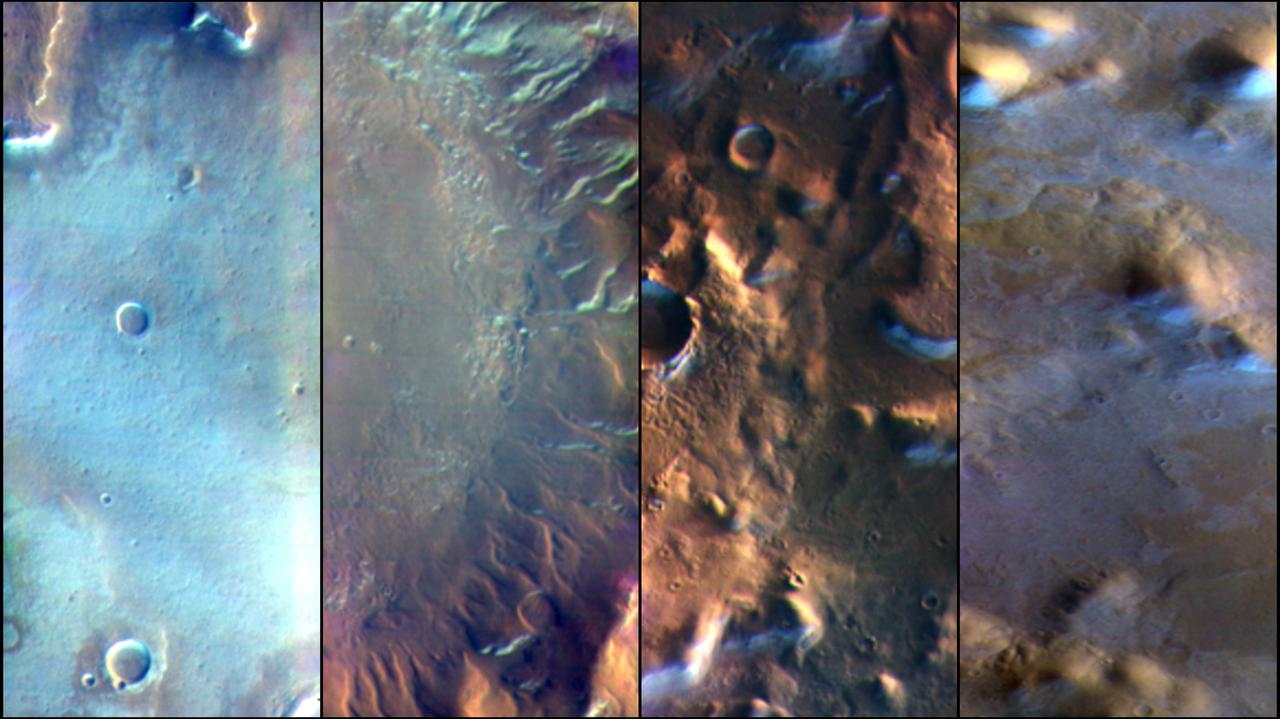
Martian surface frost, made up largely of carbon dioxide, appears blueish-white in these images from the Thermal Emission Imaging System (THEMIS) camera aboard NASA's 2001 Odyssey orbiter. THEMIS takes images in both visible light perceptible to the human eye and heat-sensitive infrared. https://photojournal.jpl.nasa.gov/catalog/PIA25233
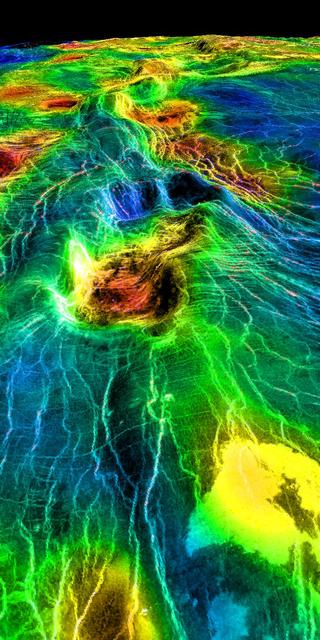
This perspective view of Venus, generated by computer from NASA Magellan data and color-coded with emissivity, shows part of the lowland plains in Sedna Planitia. Circular depressions with associated fracture patterns, called coronae. http://photojournal.jpl.nasa.gov/catalog/PIA00313
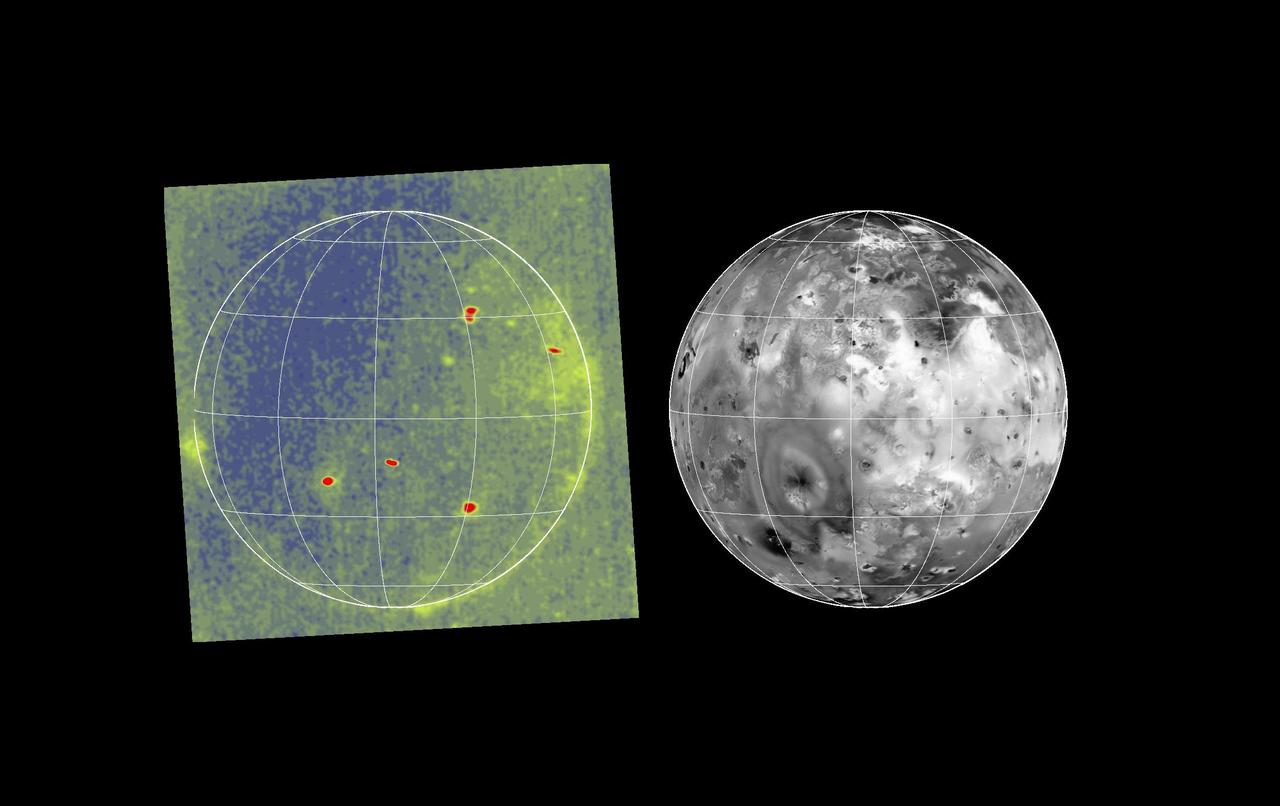
Volcanic hot spots and auroral emissions glow on the darkside of Jupiter moon Io in the image at left. The image was taken by the camera onboard NASA Galileo spacecraft on 29 June, 1996 UT while Io was in Jupiter shadow. http://photojournal.jpl.nasa.gov/catalog/PIA00274